Social network analysis with R sna package
|
|
|
- Derrick Hood
- 7 years ago
- Views:
Transcription
1 Social network analysis with R sna package George Zhang iresearch Consulting Group (China) bird@iresearch.com.cn birdzhangxiang@gmail.com

2 Social network (graph) definition G = (V,E) Max edges = N All possible E edge graphs = Linear graph(without parallel edges and slings) N E V V V V V V6 V7 V V9 V Erdös, P. and Rényi, A. (960). On the Evolution of Random Graphs.
.")
3 Different kinds of networks Random graphs a graph that is generated by some random process Scale free network whose degree distribution follows a power law Small world most nodes are not neighbors of one another, but most nodes can be reached from every other by a small number of hops or steps

4 Differ by Graph index Degree distribution average node-to-node distance average shortest path length clustering coefficient Global, local

5 network examples Butts, C.T. (006). Cycle Census Statistics for Exponential Random Graph Models.

6 GLI-Graph level index

7 Array statistic Mean Variance Standard deviation Skr Graph statistic Degree Density Reciprocity Centralization

8 Simple graph measurements Degree Number of links to a vertex(indegree, outdegree ) Density sum of tie values divided by the number of possible ties Reciprocity the proportion of dyads which are symmetric Mutuality the number of complete dyads Transtivity the total number of transitive triads is computed

9 Example Degree sum(g) = Density 9 gden(g) = /90 = 0. Reciprocity grecip(g, measure="dyadic") = grecip(g,measure="edgewise") = 0 Mutuality 6 mutuality(g) = 0 Transtivity gtrans(g) = 0.
 = 0 Transtivity")
10 Path and Cycle statistics kpath.census kcycle.census dyad.census Triad.census Butts, C.T. (006). Cycle Census Statistics for Exponential Random Graph Models.

11 Multi graph measurements Graph mean In dichotomous case, graph mean corresponds to graph s density Graph covariance gcov/gscov Graph correlation gcor/gscor Structural covariance unlabeled graph Butts, C.T., and Carley, K.M. (00). Multivariate Methods for Interstructural Analysis.
.")
12 Example gcov(g,g) = gscov(g,g,exchange.list=:0) = gscov(g,g)=0.00 unlabeled graph gcor(g,g) = gscor(g,g,exchange.list=:0) = gscor(g,g) = unlabeled graph 9
 = - 0.")

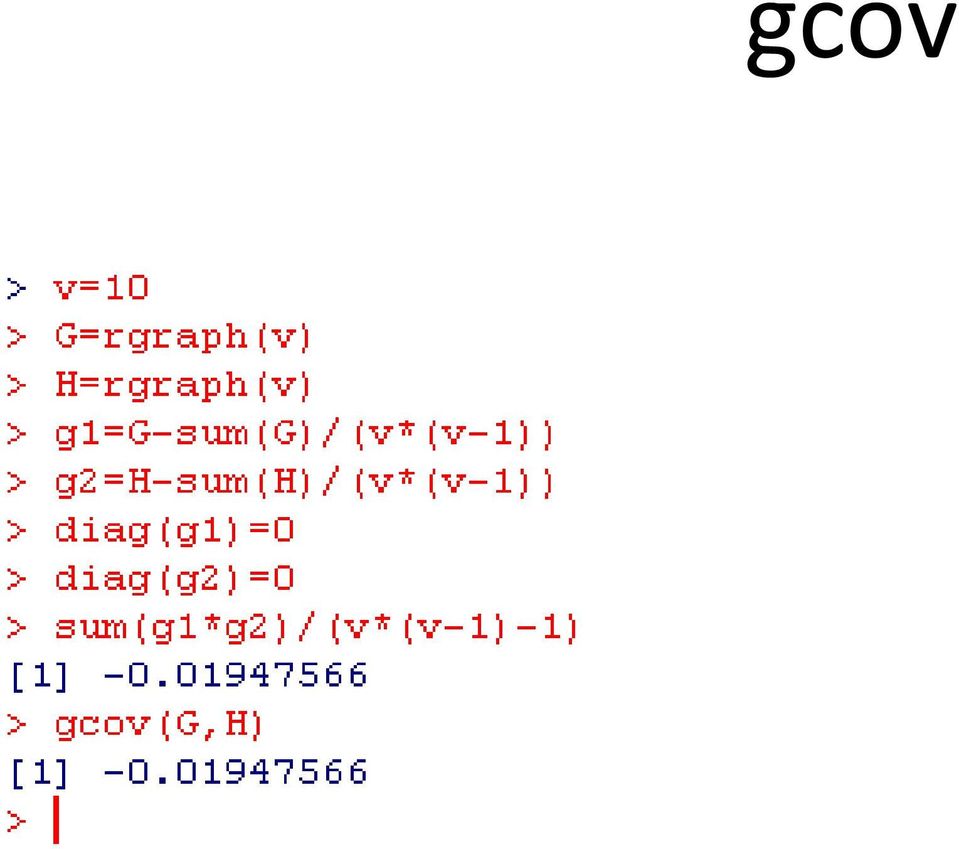
13 gcov
14 Connectedness 0 for no edges for N edges Hierarchy Measure of structure 0 for all two-way links for all one-way links Efficiency 0 for edgs N V - N( N ) - V MaxV for N- edges Least Upper Boundedness (lubness) 0 for all vertex link into one for all outtree V - MaxV Krackhardt,David.(99). Graph Theoretical Dimensionsof Informal Organizations.
.")
15 Example Outtree Connectedness= Hierarchy= Efficiency= Lubness=

16 Graph centrality Degree Number of links to a vertex(indegree, outdegree ) Betweenness Number of shortest paths pass it Closeness Length to all other vertices Centralization by ways above 0 for all vertices has equal position(central score) for vertex be the center of the graph See also evcent, bonpow, graphcent, infocent, prestige Freeman,L.C.(979). Centrality in Social Networks-Conceptual Clarification
.")
17 Example > centralization(g,degree,mode="graph") [] 0.9 > centralization(g,betweenness,mode="graph") [] 0.06 > centralization(g,closeness,mode="graph") [] Mode= graph means only consider indegree
![[] 0.06 > centralization(g,closeness,mode="graph")](/docs-images/44/19568899/images/page_17.jpg "[] 0 6 0 7 9 Mode= graph means only consider")
18 Example > centralization(g,degree,mode="graph") [] 0.9 > centralization(g,betweenness,mode="graph") [] 0.06 > centralization(g,closeness,mode="graph") [] 0 Degree center Mode= graph means only consider indegree
![06 > centralization(g,closeness,mode="graph") [] 0](/docs-images/44/19568899/images/page_18.jpg "Degree center 6 0 7 9 Mode= graph means only consider")
19 Example > centralization(g,degree,mode="graph") [] 0.9 > centralization(g,betweenness,mode="graph") [] 0.06 > centralization(g,closeness,mode="graph") [] 0 Betweeness center Degree center Mode= graph means only consider indegree
![06 > centralization(g,closeness,mode="graph") [] 0](/docs-images/44/19568899/images/page_19.jpg "Betweeness center Degree center 6 0 7 9 Mode= graph means")
20 Example > centralization(g,degree,mode="graph") [] 0.9 > centralization(g,betweenness,mode="graph") [] 0.06 > centralization(g,closeness,mode="graph") [] 0 Betweeness center Degree center Mode= graph means only consider indegree 9 Both closeness centers
![06 > centralization(g,closeness,mode="graph") [] 0 Betweeness](/docs-images/44/19568899/images/page_20.jpg "center Degree center 6 0 7 Mode= graph means only consider")
21 GLI relation
22 GLI map density Connectedness Efficiency Hierarchy 0 size Centralization(degree) Centralization(betweenness) Centralization(closeness) Anderson,B.S.;Butts,C. T.;and Carley,K. M.(999). The Interaction of Size and Density with Graph-Level Indices.
23 connectedness distribution by graph size and density density size / /6 / 6 Anderson,B.S.;Butts,C. T.;and Carley,K. M.(999). The Interaction of Size and Density with Graph-Level Indices.
24 efficiency distribution by graph size and density density size /6 / / 6
25 hierarchy distribution by graph size and density density size /6 / / 6
26 GLI map R code compare<-function(size,den) { g=rgraph(n=size,m=00,tprob=den) gli=apply(g,,connectedness) gli=apply(g,,efficiency) gli=apply(g,,hierarchy) gli=apply(g,,function(x) centralization(x,degree)) gli=apply(g,,function(x) centralization(x,betweenness)) gli6=apply(g,,function(x) centralization(x,closeness)) x=mean(gli,na.rm=t) x=mean(gli,na.rm=t) x=mean(gli,na.rm=t) x=mean(gli,na.rm=t) x=mean(gli,na.rm=t) x6=mean(gli6,na.rm=t) return(c(x,x,x,x,x,x6)) } nx=0 ny=0 res=array(0,c(nx,ny,6)) size=:6 den=seq(0.0,0.,length.out=0) for(i in :nx) for(j in :ny) res[i,j,]=compare(size[i],den[j]) #image(res,col=gray(000:/000)) par(mfrow=c(,)) image(res[,,],col=gray(000:/000),main="connectedness") image(res[,,],col=gray(000:/000),main="efficiency") image(res[,,],col=gray(000:/000),main="hierarchy") image(res[,,],col=gray(000:/000),main="centralization(degree)") image(res[,,],col=gray(000:/000),main="centralization(betweenness)") image(res[,,6],col=gray(000:/000),main="centralization(closeness)")
27 GLI distribution R code par(mfrow=c(,)) for(i in :) for(j in :) hist(centralization(rgraph(*^i,00,tprob=j/),betweenness),main="",xlab="",ylab="",xlim=range(0:),ylim=range(0:0)) hist(centralization(rgraph(*^i,00,tprob=j/),degree),main="",xlab="",ylab="",xlim=range(0:),ylim=range(0:0)) hist(hierarchy(rgraph(*^i,00,tprob=j/6)),main="",xlab="",ylab="",xlim=range(0:),ylim=range(0:0)) hist(efficiency(rgraph(*^i,00,tprob=j/6)),main="",xlab="",ylab="",xlim=range(0:),ylim=range(0:0)) hist(connectedness(rgraph(*^i,00,tprob=j/)),main="",xlab="",ylab="",xlim=range(0:),ylim=range(0:00))
28 Graph distance Clustering, MDS
29 Distance between graphs Hamming(labeling) distance e : ( e E( G ), e E( G)) ( e E( G ), e E( G number of addition/deletion operations required to turn the edge set of G into that of G hdist for typical hamming distance matrix Structure distance d (G,H L,L ) min d( (G), (H)) S G H L G, L H structdist & sdmat for structure distance with exchange.list of vertices )) Butts, C.T., and Carley, K.M. (00). Multivariate Methods for Interstructural Analysis.
30 Example
31 Example hdist(g) sdmat(g) [,] [,] [,] [,] [,] [,] 0 7 [,] [,] 0 6 [,] [,] structdist(g)
32 Measure Distance Inter-Graph MDS gdist.plotstats Plot by distances between graphs Add graph level index as third or forth dimension > g.h<-hdist(g) #sample graph used before > gdist.plotdiff(g.h,gden(g),lm.line=true) > gdist.plotstats(g.h,cbind(gden(g),grecip(g))) 0 0 Inter-Graph Distance
33 Height 0 0 Graph clustering Use hamming distance g.h=hdist(g) g.c<-hclust(as.dist(g.h)) rect.hclust(g.c,) g.cg<-gclust.centralgraph(g.c,,g) gplot(g.cg[,,]) gplot(g.cg[,,]) gclust.boxstats(g.c,,gden(g)) Cluster Dendrogram hc hc as.dist(g.h) hclust (*, "complete") X X
34 Distance between vertices Structural equivalence sedist with methods:. correlation: the product-moment correlation. euclidean: the euclidean distance. hamming: the Hamming distance. gamma: the gamma correlation Path distance geodist with shortest path distance and the number of shortest pathes Breiger, R.L.; Boorman, S.A.; and Arabie, P. (97). An Algorithm for Clustering Relational Data with Applications to Social Network Analysis and Comparison with Multidimensional Scaling. Brandes, U. (000). Faster Evaluation of Shortest-Path Based Centrality Indices.
35 sedist Example sedist(g) = sedist(g,mode="graph") [,] [,] [,] [,] [,] [,6] [,7] [,] [,9] [,0] [,] [,] [,] [,] [,] 6 0 [6,] [7,] [,] [9,] 0 6 [0,]
36 geodist Example geodist(g) $counts [,] [,] [,] [,] [,] [,6] [,7] [,] [,9][,0] [,] [,] 0 [,] 0 0 [,] [,] [6,] [7,] [,] [9,] [0,] $gdist [,] [,] [,] [,] [,] [,6] [,7] [,] [,9][,0] [,] 0 [,] Inf 0 [,] Inf Inf 0 [,] Inf Inf Inf 0 [,] Inf Inf Inf 0 6 [6,] Inf Inf Inf 0 [7,] Inf Inf Inf 0 [,] Inf Inf Inf 0 [9,] Inf Inf Inf 0 [0,] Inf Inf Inf 0
37 geodist Example geodist(g) $counts [,] [,] [,] [,] [,] [,6] [,7] [,] [,9][,0] [,] [,] 0 [,] 0 0 [,] [,] [6,] [7,] [,] [9,] [0,] $gdist [,] [,] [,] [,] [,] [,6] [,7] [,] [,9][,0] [,] 0 [,] Inf 0 [,] Inf Inf 0 [,] Inf Inf Inf 0 [,] Inf Inf Inf 0 6 [6,] Inf Inf Inf 0 [7,] Inf Inf Inf 0 [,] Inf Inf Inf 0 [9,] Inf Inf Inf 0 [0,] Inf Inf Inf 0
38 geodist Example geodist(g) $counts [,] [,] [,] [,] [,] [,6] [,7] [,] [,9][,0] [,] [,] 0 [,] 0 0 [,] [,] [6,] [7,] [,] [9,] [0,] $gdist [,] [,] [,] [,] [,] [,6] [,7] [,] [,9][,0] [,] 0 [,] Inf 0 [,] Inf Inf 0 [,] Inf Inf Inf 0 [,] Inf Inf Inf 0 6 [6,] Inf Inf Inf 0 [7,] Inf Inf Inf 0 [,] Inf Inf Inf 0 [9,] Inf Inf Inf 0 [0,] Inf Inf Inf 0
39 geodist Example geodist(g) $counts [,] [,] [,] [,] [,] [,6] [,7] [,] [,9][,0] [,] [,] 0 [,] 0 0 [,] [,] [6,] [7,] [,] [9,] [0,] $gdist [,] [,] [,] [,] [,] [,6] [,7] [,] [,9][,0] [,] 0 [,] Inf 0 [,] Inf Inf 0 [,] Inf Inf Inf 0 [,] Inf Inf Inf 0 6 [6,] Inf Inf Inf 0 [7,] Inf Inf Inf 0 [,] Inf Inf Inf 0 [9,] Inf Inf Inf 0 [0,] Inf Inf Inf 0
40 geodist reachability gplot(reachability(g),label=:0)
41 6 7 9 Height Graph vertices clustering by sedist General clustering methods equiv.clust for vertices clustering by Structural equivalence( sedist ) Cluster Dendrogram as.dist(equiv.dist) hclust (*, "complete")
42 Distance Graph structure by geodist structure.statistics > ss<-structure.statistics(g) > plot(0:9,ss,xlab="mean Coverage",ylab="Distance") Mean Coverage
43 Graph cov based function Regression, principal component, canonical correlation
44 Multi graph measurements Graph mean In dichotomous case, graph mean corresponds to graph s density Graph covariance gcov/gscov Graph correlation gcor/gscor Structural covariance unlabeled graph Butts, C.T., and Carley, K.M. (00). Multivariate Methods for Interstructural Analysis.
45 Correlation statistic model Canonical correlation netcancor Linear regression netlm Logistic regression netlogit Linear autocorrelation model lnam nacf
46 Random graph models
47 Graph evolution Random Biased Phases
48 Proportion Reached Mut Asym Null D 0U 0C D U 00T 00C 0 0D 0U 0C 0 00 Count Count 0 0 Biased net model graph generate: rgbn graph prediction: bn Predicted Dyad Census Predicted Triad Census 9 6 Dyad Type Triad Type 0 7 Predicted Structure Statistics 0 6 Distance
49 Graph statistic test cugtest qaptest
50 Thanks
Social Media Mining. Network Measures
 Klout Measures and Metrics 22 Why Do We Need Measures? Who are the central figures (influential individuals) in the network? What interaction patterns are common in friends? Who are the like-minded users
Practical Graph Mining with R. 5. Link Analysis
 Practical Graph Mining with R 5. Link Analysis Outline Link Analysis Concepts Metrics for Analyzing Networks PageRank HITS Link Prediction 2 Link Analysis Concepts Link A relationship between two entities
Outline. NP-completeness. When is a problem easy? When is a problem hard? Today. Euler Circuits
 Outline NP-completeness Examples of Easy vs. Hard problems Euler circuit vs. Hamiltonian circuit Shortest Path vs. Longest Path 2-pairs sum vs. general Subset Sum Reducing one problem to another Clique
Univariate Regression
 Univariate Regression Correlation and Regression The regression line summarizes the linear relationship between 2 variables Correlation coefficient, r, measures strength of relationship: the closer r is
Social Media Mining. Graph Essentials
 Graph Essentials Graph Basics Measures Graph and Essentials Metrics 2 2 Nodes and Edges A network is a graph nodes, actors, or vertices (plural of vertex) Connections, edges or ties Edge Node Measures
Package sna. February 20, 2015
 Version 2.3-2 Date 2014-01-13 Title Tools for Social Network Analysis Depends R (>= 2.0.0), utils Suggests network, rgl, numderiv, SparseM Package sna February 20, 2015 A range of tools for social network
Journal of Statistical Software
 JSS Journal of Statistical Software February 2008, Volume 24, Issue 6. http://www.jstatsoft.org/ Social Network Analysis with sna Carter T. Butts University of California, Irvine Abstract Modern social
MEASURES OF VARIATION
 NORMAL DISTRIBTIONS MEASURES OF VARIATION In statistics, it is important to measure the spread of data. A simple way to measure spread is to find the range. But statisticians want to know if the data are
USING SPECTRAL RADIUS RATIO FOR NODE DEGREE TO ANALYZE THE EVOLUTION OF SCALE- FREE NETWORKS AND SMALL-WORLD NETWORKS
 USING SPECTRAL RADIUS RATIO FOR NODE DEGREE TO ANALYZE THE EVOLUTION OF SCALE- FREE NETWORKS AND SMALL-WORLD NETWORKS Natarajan Meghanathan Jackson State University, 1400 Lynch St, Jackson, MS, USA natarajan.meghanathan@jsums.edu
DATA ANALYSIS II. Matrix Algorithms
 DATA ANALYSIS II Matrix Algorithms Similarity Matrix Given a dataset D = {x i }, i=1,..,n consisting of n points in R d, let A denote the n n symmetric similarity matrix between the points, given as where
Imputation of missing network data: Some simple procedures
 Imputation of missing network data: Some simple procedures Mark Huisman Dept. of Psychology University of Groningen Abstract Analysis of social network data is often hampered by non-response and missing
Data Structure [Question Bank]
![Data Structure [Question Bank]](/thumbs/40/21355705.jpg "Data Structure [Question Bank]") Unit I (Analysis of Algorithms) 1. What are algorithms and how they are useful? 2. Describe the factor on best algorithms depends on? 3. Differentiate: Correct & Incorrect Algorithms? 4. Write short note:
Unit I (Analysis of Algorithms) 1. What are algorithms and how they are useful? 2. Describe the factor on best algorithms depends on? 3. Differentiate: Correct & Incorrect Algorithms? 4. Write short note:
Social and Technological Network Analysis. Lecture 3: Centrality Measures. Dr. Cecilia Mascolo (some material from Lada Adamic s lectures)
") Social and Technological Network Analysis Lecture 3: Centrality Measures Dr. Cecilia Mascolo (some material from Lada Adamic s lectures) In This Lecture We will introduce the concept of centrality and
Social and Technological Network Analysis Lecture 3: Centrality Measures Dr. Cecilia Mascolo (some material from Lada Adamic s lectures) In This Lecture We will introduce the concept of centrality and
Point Biserial Correlation Tests
 Chapter 807 Point Biserial Correlation Tests Introduction The point biserial correlation coefficient (ρ in this chapter) is the product-moment correlation calculated between a continuous random variable
SGL: Stata graph library for network analysis
 SGL: Stata graph library for network analysis Hirotaka Miura Federal Reserve Bank of San Francisco Stata Conference Chicago 2011 The views presented here are my own and do not necessarily represent the
Graph/Network Visualization
 Graph/Network Visualization Data model: graph structures (relations, knowledge) and networks. Applications: Telecommunication systems, Internet and WWW, Retailers distribution networks knowledge representation
Course on Social Network Analysis Graphs and Networks
 Course on Social Network Analysis Graphs and Networks Vladimir Batagelj University of Ljubljana Slovenia V. Batagelj: Social Network Analysis / Graphs and Networks 1 Outline 1 Graph...............................
Part 2: Community Detection
 Chapter 8: Graph Data Part 2: Community Detection Based on Leskovec, Rajaraman, Ullman 2014: Mining of Massive Datasets Big Data Management and Analytics Outline Community Detection - Social networks -
Linear Threshold Units
 Linear Threshold Units w x hx (... w n x n w We assume that each feature x j and each weight w j is a real number (we will relax this later) We will study three different algorithms for learning linear
Graphs over Time Densification Laws, Shrinking Diameters and Possible Explanations
 Graphs over Time Densification Laws, Shrinking Diameters and Possible Explanations Jurij Leskovec, CMU Jon Kleinberg, Cornell Christos Faloutsos, CMU 1 Introduction What can we do with graphs? What patterns
Graph Theory and Complex Networks: An Introduction. Chapter 08: Computer networks
 Graph Theory and Complex Networks: An Introduction Maarten van Steen VU Amsterdam, Dept. Computer Science Room R4.20, steen@cs.vu.nl Chapter 08: Computer networks Version: March 3, 2011 2 / 53 Contents
Additional sources Compilation of sources: http://lrs.ed.uiuc.edu/tseportal/datacollectionmethodologies/jin-tselink/tselink.htm
 Mgt 540 Research Methods Data Analysis 1 Additional sources Compilation of sources: http://lrs.ed.uiuc.edu/tseportal/datacollectionmethodologies/jin-tselink/tselink.htm http://web.utk.edu/~dap/random/order/start.htm
Introduction to Multivariate Analysis
 Introduction to Multivariate Analysis Lecture 1 August 24, 2005 Multivariate Analysis Lecture #1-8/24/2005 Slide 1 of 30 Today s Lecture Today s Lecture Syllabus and course overview Chapter 1 (a brief
! E6893 Big Data Analytics Lecture 10:! Linked Big Data Graph Computing (II)
") E6893 Big Data Analytics Lecture 10: Linked Big Data Graph Computing (II) Ching-Yung Lin, Ph.D. Adjunct Professor, Dept. of Electrical Engineering and Computer Science Mgr., Dept. of Network Science and
E6893 Big Data Analytics Lecture 10: Linked Big Data Graph Computing (II) Ching-Yung Lin, Ph.D. Adjunct Professor, Dept. of Electrical Engineering and Computer Science Mgr., Dept. of Network Science and
Statistical Analysis of Complete Social Networks
 Statistical Analysis of Complete Social Networks Introduction to networks Christian Steglich c.e.g.steglich@rug.nl median geodesic distance between groups 1.8 1.2 0.6 transitivity 0.0 0.0 0.5 1.0 1.5 2.0
Institute of Actuaries of India Subject CT3 Probability and Mathematical Statistics
 Institute of Actuaries of India Subject CT3 Probability and Mathematical Statistics For 2015 Examinations Aim The aim of the Probability and Mathematical Statistics subject is to provide a grounding in
CRLS Mathematics Department Algebra I Curriculum Map/Pacing Guide
 Curriculum Map/Pacing Guide page 1 of 14 Quarter I start (CP & HN) 170 96 Unit 1: Number Sense and Operations 24 11 Totals Always Include 2 blocks for Review & Test Operating with Real Numbers: How are
15.062 Data Mining: Algorithms and Applications Matrix Math Review
 .6 Data Mining: Algorithms and Applications Matrix Math Review The purpose of this document is to give a brief review of selected linear algebra concepts that will be useful for the course and to develop
Week 3. Network Data; Introduction to Graph Theory and Sociometric Notation
 Wasserman, Stanley, and Katherine Faust. 2009. Social Network Analysis: Methods and Applications, Structural Analysis in the Social Sciences. New York, NY: Cambridge University Press. Chapter III: Notation
Strong and Weak Ties
 Strong and Weak Ties Web Science (VU) (707.000) Elisabeth Lex KTI, TU Graz April 11, 2016 Elisabeth Lex (KTI, TU Graz) Networks April 11, 2016 1 / 66 Outline 1 Repetition 2 Strong and Weak Ties 3 General
Sections 2.11 and 5.8
 Sections 211 and 58 Timothy Hanson Department of Statistics, University of South Carolina Stat 704: Data Analysis I 1/25 Gesell data Let X be the age in in months a child speaks his/her first word and
Simple Linear Regression Inference
 Simple Linear Regression Inference 1 Inference requirements The Normality assumption of the stochastic term e is needed for inference even if it is not a OLS requirement. Therefore we have: Interpretation
CSE 326, Data Structures. Sample Final Exam. Problem Max Points Score 1 14 (2x7) 2 18 (3x6) 3 4 4 7 5 9 6 16 7 8 8 4 9 8 10 4 Total 92.
 2 18 (3x6) 3 4 4 7 5 9 6 16 7 8 8 4 9 8 10 4 Total 92.") Name: Email ID: CSE 326, Data Structures Section: Sample Final Exam Instructions: The exam is closed book, closed notes. Unless otherwise stated, N denotes the number of elements in the data structure
Name: Email ID: CSE 326, Data Structures Section: Sample Final Exam Instructions: The exam is closed book, closed notes. Unless otherwise stated, N denotes the number of elements in the data structure
IBM SPSS Modeler Social Network Analysis 15 User Guide
 IBM SPSS Modeler Social Network Analysis 15 User Guide Note: Before using this information and the product it supports, read the general information under Notices on p. 25. This edition applies to IBM
Module 3: Correlation and Covariance
 Using Statistical Data to Make Decisions Module 3: Correlation and Covariance Tom Ilvento Dr. Mugdim Pašiƒ University of Delaware Sarajevo Graduate School of Business O ften our interest in data analysis
Example: Credit card default, we may be more interested in predicting the probabilty of a default than classifying individuals as default or not.
 Statistical Learning: Chapter 4 Classification 4.1 Introduction Supervised learning with a categorical (Qualitative) response Notation: - Feature vector X, - qualitative response Y, taking values in C
Part 2: Analysis of Relationship Between Two Variables
 Part 2: Analysis of Relationship Between Two Variables Linear Regression Linear correlation Significance Tests Multiple regression Linear Regression Y = a X + b Dependent Variable Independent Variable
Mean = (sum of the values / the number of the value) if probabilities are equal
 if probabilities are equal") Population Mean Mean = (sum of the values / the number of the value) if probabilities are equal Compute the population mean Population/Sample mean: 1. Collect the data 2. sum all the values in the population/sample.
Population Mean Mean = (sum of the values / the number of the value) if probabilities are equal Compute the population mean Population/Sample mean: 1. Collect the data 2. sum all the values in the population/sample.
Principal Component Analysis
 Principal Component Analysis ERS70D George Fernandez INTRODUCTION Analysis of multivariate data plays a key role in data analysis. Multivariate data consists of many different attributes or variables recorded
MISSING DATA TECHNIQUES WITH SAS. IDRE Statistical Consulting Group
 MISSING DATA TECHNIQUES WITH SAS IDRE Statistical Consulting Group ROAD MAP FOR TODAY To discuss: 1. Commonly used techniques for handling missing data, focusing on multiple imputation 2. Issues that could
B490 Mining the Big Data. 2 Clustering
 B490 Mining the Big Data 2 Clustering Qin Zhang 1-1 Motivations Group together similar documents/webpages/images/people/proteins/products One of the most important problems in machine learning, pattern
containing Kendall correlations; and the OUTH = option will create a data set containing Hoeffding statistics.
 Getting Correlations Using PROC CORR Correlation analysis provides a method to measure the strength of a linear relationship between two numeric variables. PROC CORR can be used to compute Pearson product-moment
Distributed Computing over Communication Networks: Maximal Independent Set
 Distributed Computing over Communication Networks: Maximal Independent Set What is a MIS? MIS An independent set (IS) of an undirected graph is a subset U of nodes such that no two nodes in U are adjacent.
Graph Mining and Social Network Analysis
 Graph Mining and Social Network Analysis Data Mining and Text Mining (UIC 583 @ Politecnico di Milano) References Jiawei Han and Micheline Kamber, "Data Mining: Concepts and Techniques", The Morgan Kaufmann
How To Understand The Network Of A Network
 Roles in Networks Roles in Networks Motivation for work: Let topology define network roles. Work by Kleinberg on directed graphs, used topology to define two types of roles: authorities and hubs. (Each
Chapter 29 Scale-Free Network Topologies with Clustering Similar to Online Social Networks
 Chapter 29 Scale-Free Network Topologies with Clustering Similar to Online Social Networks Imre Varga Abstract In this paper I propose a novel method to model real online social networks where the growing
Big Data Analytics of Multi-Relationship Online Social Network Based on Multi-Subnet Composited Complex Network
 , pp.273-284 http://dx.doi.org/10.14257/ijdta.2015.8.5.24 Big Data Analytics of Multi-Relationship Online Social Network Based on Multi-Subnet Composited Complex Network Gengxin Sun 1, Sheng Bin 2 and
CMPSCI611: Approximating MAX-CUT Lecture 20
 CMPSCI611: Approximating MAX-CUT Lecture 20 For the next two lectures we ll be seeing examples of approximation algorithms for interesting NP-hard problems. Today we consider MAX-CUT, which we proved to
Equivalence Concepts for Social Networks
 Equivalence Concepts for Social Networks Tom A.B. Snijders University of Oxford March 26, 2009 c Tom A.B. Snijders (University of Oxford) Equivalences in networks March 26, 2009 1 / 40 Outline Structural
Performance Metrics for Graph Mining Tasks
 Performance Metrics for Graph Mining Tasks 1 Outline Introduction to Performance Metrics Supervised Learning Performance Metrics Unsupervised Learning Performance Metrics Optimizing Metrics Statistical
How To Cluster Of Complex Systems
 Entropy based Graph Clustering: Application to Biological and Social Networks Edward C Kenley Young-Rae Cho Department of Computer Science Baylor University Complex Systems Definition Dynamically evolving
Business Statistics. Successful completion of Introductory and/or Intermediate Algebra courses is recommended before taking Business Statistics.
 Business Course Text Bowerman, Bruce L., Richard T. O'Connell, J. B. Orris, and Dawn C. Porter. Essentials of Business, 2nd edition, McGraw-Hill/Irwin, 2008, ISBN: 978-0-07-331988-9. Required Computing
Multivariate Analysis of Ecological Data
 Multivariate Analysis of Ecological Data MICHAEL GREENACRE Professor of Statistics at the Pompeu Fabra University in Barcelona, Spain RAUL PRIMICERIO Associate Professor of Ecology, Evolutionary Biology
Exercise 1.12 (Pg. 22-23)
") Individuals: The objects that are described by a set of data. They may be people, animals, things, etc. (Also referred to as Cases or Records) Variables: The characteristics recorded about each individual.
Individuals: The objects that are described by a set of data. They may be people, animals, things, etc. (Also referred to as Cases or Records) Variables: The characteristics recorded about each individual.
PITFALLS IN TIME SERIES ANALYSIS. Cliff Hurvich Stern School, NYU
 PITFALLS IN TIME SERIES ANALYSIS Cliff Hurvich Stern School, NYU The t -Test If x 1,..., x n are independent and identically distributed with mean 0, and n is not too small, then t = x 0 s n has a standard
1 o Semestre 2007/2008
 Departamento de Engenharia Informática Instituto Superior Técnico 1 o Semestre 2007/2008 Outline 1 2 3 4 5 Outline 1 2 3 4 5 Exploiting Text How is text exploited? Two main directions Extraction Extraction
MATH 10: Elementary Statistics and Probability Chapter 5: Continuous Random Variables
 MATH 10: Elementary Statistics and Probability Chapter 5: Continuous Random Variables Tony Pourmohamad Department of Mathematics De Anza College Spring 2015 Objectives By the end of this set of slides,
Groups and Positions in Complete Networks
 86 Groups and Positions in Complete Networks OBJECTIVES The objective of this chapter is to show how a complete network can be analyzed further by using different algorithms to identify its groups and
WebFOCUS RStat. RStat. Predict the Future and Make Effective Decisions Today. WebFOCUS RStat
 Information Builders enables agile information solutions with business intelligence (BI) and integration technologies. WebFOCUS the most widely utilized business intelligence platform connects to any enterprise
Improving the Performance of Data Mining Models with Data Preparation Using SAS Enterprise Miner Ricardo Galante, SAS Institute Brasil, São Paulo, SP
 Improving the Performance of Data Mining Models with Data Preparation Using SAS Enterprise Miner Ricardo Galante, SAS Institute Brasil, São Paulo, SP ABSTRACT In data mining modelling, data preparation
Linear functions Increasing Linear Functions. Decreasing Linear Functions
 3.5 Increasing, Decreasing, Max, and Min So far we have been describing graphs using quantitative information. That s just a fancy way to say that we ve been using numbers. Specifically, we have described
Systems and Algorithms for Big Data Analytics
 Systems and Algorithms for Big Data Analytics YAN, Da Email: yanda@cse.cuhk.edu.hk My Research Graph Data Distributed Graph Processing Spatial Data Spatial Query Processing Uncertain Data Querying & Mining
Cluster Analysis: Advanced Concepts
 Cluster Analysis: Advanced Concepts and dalgorithms Dr. Hui Xiong Rutgers University Introduction to Data Mining 08/06/2006 1 Introduction to Data Mining 08/06/2006 1 Outline Prototype-based Fuzzy c-means
Homework 11. Part 1. Name: Score: / null
 Name: Score: / Homework 11 Part 1 null 1 For which of the following correlations would the data points be clustered most closely around a straight line? A. r = 0.50 B. r = -0.80 C. r = 0.10 D. There is
Multivariate Normal Distribution
 Multivariate Normal Distribution Lecture 4 July 21, 2011 Advanced Multivariate Statistical Methods ICPSR Summer Session #2 Lecture #4-7/21/2011 Slide 1 of 41 Last Time Matrices and vectors Eigenvalues
Self similarity of complex networks & hidden metric spaces
 Self similarity of complex networks & hidden metric spaces M. ÁNGELES SERRANO Departament de Química Física Universitat de Barcelona TERA-NET: Toward Evolutive Routing Algorithms for scale-free/internet-like
Complex Networks Analysis: Clustering Methods
 Complex Networks Analysis: Clustering Methods Nikolai Nefedov Spring 2013 ISI ETH Zurich nefedov@isi.ee.ethz.ch 1 Outline Purpose to give an overview of modern graph-clustering methods and their applications
How To Understand Multivariate Models
 Neil H. Timm Applied Multivariate Analysis With 42 Figures Springer Contents Preface Acknowledgments List of Tables List of Figures vii ix xix xxiii 1 Introduction 1 1.1 Overview 1 1.2 Multivariate Models
Virtual Landmarks for the Internet
 Virtual Landmarks for the Internet Liying Tang Mark Crovella Boston University Computer Science Internet Distance Matters! Useful for configuring Content delivery networks Peer to peer applications Multiuser
Improving Experiments by Optimal Blocking: Minimizing the Maximum Within-block Distance
 Improving Experiments by Optimal Blocking: Minimizing the Maximum Within-block Distance Michael J. Higgins Jasjeet Sekhon April 12, 2014 EGAP XI A New Blocking Method A new blocking method with nice theoretical
5. Linear Regression
 5. Linear Regression Outline.................................................................... 2 Simple linear regression 3 Linear model............................................................. 4
Using Excel for inferential statistics
 FACT SHEET Using Excel for inferential statistics Introduction When you collect data, you expect a certain amount of variation, just caused by chance. A wide variety of statistical tests can be applied
Cluster Analysis. Isabel M. Rodrigues. Lisboa, 2014. Instituto Superior Técnico
 Instituto Superior Técnico Lisboa, 2014 Introduction: Cluster analysis What is? Finding groups of objects such that the objects in a group will be similar (or related) to one another and different from
Data Mining Cluster Analysis: Basic Concepts and Algorithms. Lecture Notes for Chapter 8. Introduction to Data Mining
 Data Mining Cluster Analysis: Basic Concepts and Algorithms Lecture Notes for Chapter 8 by Tan, Steinbach, Kumar 1 What is Cluster Analysis? Finding groups of objects such that the objects in a group will
Network Analysis Basics and applications to online data
 Network Analysis Basics and applications to online data Katherine Ognyanova University of Southern California Prepared for the Annenberg Program for Online Communities, 2010. Relational data Node (actor,
Course Text. Required Computing Software. Course Description. Course Objectives. StraighterLine. Business Statistics
 Course Text Business Statistics Lind, Douglas A., Marchal, William A. and Samuel A. Wathen. Basic Statistics for Business and Economics, 7th edition, McGraw-Hill/Irwin, 2010, ISBN: 9780077384470 [This
Class #6: Non-linear classification. ML4Bio 2012 February 17 th, 2012 Quaid Morris
 Class #6: Non-linear classification ML4Bio 2012 February 17 th, 2012 Quaid Morris 1 Module #: Title of Module 2 Review Overview Linear separability Non-linear classification Linear Support Vector Machines
The Goldberg Rao Algorithm for the Maximum Flow Problem
 The Goldberg Rao Algorithm for the Maximum Flow Problem COS 528 class notes October 18, 2006 Scribe: Dávid Papp Main idea: use of the blocking flow paradigm to achieve essentially O(min{m 2/3, n 1/2 }
Sampling Biases in IP Topology Measurements
 Sampling Biases in IP Topology Measurements Anukool Lakhina with John Byers, Mark Crovella and Peng Xie Department of Boston University Discovering the Internet topology Goal: Discover the Internet Router
Statistics. Measurement. Scales of Measurement 7/18/2012
 Statistics Measurement Measurement is defined as a set of rules for assigning numbers to represent objects, traits, attributes, or behaviors A variableis something that varies (eye color), a constant does
Lecture 15 An Arithmetic Circuit Lowerbound and Flows in Graphs
 CSE599s: Extremal Combinatorics November 21, 2011 Lecture 15 An Arithmetic Circuit Lowerbound and Flows in Graphs Lecturer: Anup Rao 1 An Arithmetic Circuit Lower Bound An arithmetic circuit is just like
Section Format Day Begin End Building Rm# Instructor. 001 Lecture Tue 6:45 PM 8:40 PM Silver 401 Ballerini
 NEW YORK UNIVERSITY ROBERT F. WAGNER GRADUATE SCHOOL OF PUBLIC SERVICE Course Syllabus Spring 2016 Statistical Methods for Public, Nonprofit, and Health Management Section Format Day Begin End Building
430 Statistics and Financial Mathematics for Business
 Prescription: 430 Statistics and Financial Mathematics for Business Elective prescription Level 4 Credit 20 Version 2 Aim Students will be able to summarise, analyse, interpret and present data, make predictions
An Empirical Study of Two MIS Algorithms
 An Empirical Study of Two MIS Algorithms Email: Tushar Bisht and Kishore Kothapalli International Institute of Information Technology, Hyderabad Hyderabad, Andhra Pradesh, India 32. tushar.bisht@research.iiit.ac.in,
DATA MINING CLUSTER ANALYSIS: BASIC CONCEPTS
 DATA MINING CLUSTER ANALYSIS: BASIC CONCEPTS 1 AND ALGORITHMS Chiara Renso KDD-LAB ISTI- CNR, Pisa, Italy WHAT IS CLUSTER ANALYSIS? Finding groups of objects such that the objects in a group will be similar
The right edge of the box is the third quartile, Q 3, which is the median of the data values above the median. Maximum Median
 CONDENSED LESSON 2.1 Box Plots In this lesson you will create and interpret box plots for sets of data use the interquartile range (IQR) to identify potential outliers and graph them on a modified box
HISTOGRAMS, CUMULATIVE FREQUENCY AND BOX PLOTS
 Mathematics Revision Guides Histograms, Cumulative Frequency and Box Plots Page 1 of 25 M.K. HOME TUITION Mathematics Revision Guides Level: GCSE Higher Tier HISTOGRAMS, CUMULATIVE FREQUENCY AND BOX PLOTS
Overview of Violations of the Basic Assumptions in the Classical Normal Linear Regression Model
 Overview of Violations of the Basic Assumptions in the Classical Normal Linear Regression Model 1 September 004 A. Introduction and assumptions The classical normal linear regression model can be written
Review Jeopardy. Blue vs. Orange. Review Jeopardy
 Review Jeopardy Blue vs. Orange Review Jeopardy Jeopardy Round Lectures 0-3 Jeopardy Round $200 How could I measure how far apart (i.e. how different) two observations, y 1 and y 2, are from each other?
BNG 202 Biomechanics Lab. Descriptive statistics and probability distributions I
 BNG 202 Biomechanics Lab Descriptive statistics and probability distributions I Overview The overall goal of this short course in statistics is to provide an introduction to descriptive and inferential
List of Examples. Examples 319
 Examples 319 List of Examples DiMaggio and Mantle. 6 Weed seeds. 6, 23, 37, 38 Vole reproduction. 7, 24, 37 Wooly bear caterpillar cocoons. 7 Homophone confusion and Alzheimer s disease. 8 Gear tooth strength.
Logistic Regression (a type of Generalized Linear Model)
") Logistic Regression (a type of Generalized Linear Model) 1/36 Today Review of GLMs Logistic Regression 2/36 How do we find patterns in data? We begin with a model of how the world works We use our knowledge
Logistic Regression (a type of Generalized Linear Model) 1/36 Today Review of GLMs Logistic Regression 2/36 How do we find patterns in data? We begin with a model of how the world works We use our knowledge
WAN Wide Area Networks. Packet Switch Operation. Packet Switches. COMP476 Networked Computer Systems. WANs are made of store and forward switches.
 Routing WAN Wide Area Networks WANs are made of store and forward switches. To there and back again COMP476 Networked Computer Systems A packet switch with two types of I/O connectors: one type is used
Distance Degree Sequences for Network Analysis
 Universität Konstanz Computer & Information Science Algorithmics Group 15 Mar 2005 based on Palmer, Gibbons, and Faloutsos: ANF A Fast and Scalable Tool for Data Mining in Massive Graphs, SIGKDD 02. Motivation
Design & Analysis of Ecological Data. Landscape of Statistical Methods...
 Design & Analysis of Ecological Data Landscape of Statistical Methods: Part 3 Topics: 1. Multivariate statistics 2. Finding groups - cluster analysis 3. Testing/describing group differences 4. Unconstratined
Network Analysis For Sustainability Management
 Network Analysis For Sustainability Management 1 Cátia Vaz 1º Summer Course in E4SD Outline Motivation Networks representation Structural network analysis Behavior network analysis 2 Networks Over the
Information Network or Social Network? The Structure of the Twitter Follow Graph
 Information Network or Social Network? The Structure of the Twitter Follow Graph Seth A. Myers, Aneesh Sharma, Pankaj Gupta, and Jimmy Lin Twitter, Inc. @seth_a_myers @aneeshs @pankaj @lintool ABSTRACT
AP STATISTICS REVIEW (YMS Chapters 1-8)
") AP STATISTICS REVIEW (YMS Chapters 1-8) Exploring Data (Chapter 1) Categorical Data nominal scale, names e.g. male/female or eye color or breeds of dogs Quantitative Data rational scale (can +,,, with
AP STATISTICS REVIEW (YMS Chapters 1-8) Exploring Data (Chapter 1) Categorical Data nominal scale, names e.g. male/female or eye color or breeds of dogs Quantitative Data rational scale (can +,,, with
Protein Protein Interaction Networks
 Functional Pattern Mining from Genome Scale Protein Protein Interaction Networks Young-Rae Cho, Ph.D. Assistant Professor Department of Computer Science Baylor University it My Definition of Bioinformatics
Algebra 1 Course Information
 Course Information Course Description: Students will study patterns, relations, and functions, and focus on the use of mathematical models to understand and analyze quantitative relationships. Through