Reporting with Pentaho. Gabriele Pozzani
|
|
|
- Debra Lawrence
- 7 years ago
- Views:
Transcription

1 Reporting with Pentaho Gabriele Pozzani
2 A key feature Reporting is a key feature for a BI solution Used and delivered contents consist of Reporting 75-80% Analytical tools for OLAP 15-20% Data mining tools 0-5%
3 Tools Pentaho provides two ways to design reports: WAQR: Web Ad-hoc Query and Reporting client Web based Included in the Pentaho User Console PRD: Pentaho Report Designer Graphical standalone tool
4 WAQR

5 WAQR Based on a four-steps wizard Limited to grouped lists No graphs No charts Works only with metadata models

6 Example Consider contacts occurred in 2002 or later and consisting of visit in a jail Report the contacts and their number for each type of contact
7 Step 1: select data source Select a data source Select a template

8 Step 1.1: add a database source 1.1.3: select the connection 1.1.2: source name 1.1.4: insert query to retrieve data for the report 1.1.1: click add 1.1.5: edit metadata
9 Step 2: make selections Data elements (column names) Group fields (sub)headers (sub)totals Details for lowest group level Fields to filter on and to not display

10 Step 3: customize selections Add filters on fields in Groups, Details, Filters Add sorting criterias Specify format settings
11 Step 4: report settings Paper settings Page settings

12 Output Choose the output format and then Go
13 PRD
14 PRD Organizes data in (sub)groups Allows subreports Based on the structure view Let you work on a canvas Let you to see a preview Allows to export reports in PDF, HTML, XLS, RTF, and CSV Reports can be published to the Pentaho server
15 Building ways PRD provides two ways of building a new report: The Report Wizard Similar to WAQR Takes you through 4 steps for creating a report The New option Creates an empty report
16 Report structure A report is divided in sections: Page header/footer: add h/f to each page Report header/footer: add h/f only once Group header/footer: add h/f to each group Details body: where individual rows are placed No data Watermark: add a watermark to be printed as a background on each page

17 Main window Structure tab Building blocks Design screen Properties screen
18 Report elements Inside sections several elements can be placed Each element has properties: Style properties determine what an element looks like Attributes determine content and behaviour of an element
19 Elements Some available elements are: Label Text-field: display text value from a data set Number-field Content-field: display an image from a data set Image: display an image from local resource/url Geometric figures Horizontal-/Vertical-line Charts Barcode sub-report
20 1 step: create the data set The most important part of creating a report is to determine Which data shoud be displayed How data are grouped How data are aggregated A report can contain only one data set But subreports can have their own data sets Possible data sources include JDBC connection Pentaho metadata file

21 Create data set from JDBC Choose/add the query Choose the connection Design a query Write a query

22 Query designer Add conditions, expressions, Grouping and ordering Drag tables Choose columns to retrieve
23 Data set Once the query and data set has been defined they appear in the Data tab Double-clicking on the data set allow to modify it
24 Adding parameters Parameters enable a user to choose certain values each time the report runs Use the Add parameter function in the Data tab Parameters Based on a set of values a user can choose from Free text parameter List of values should come from a data source Existing connection New table

25 Tables Tables allow one to define custom Ids and values IDs will be passed to the query Values will be displayed to the user
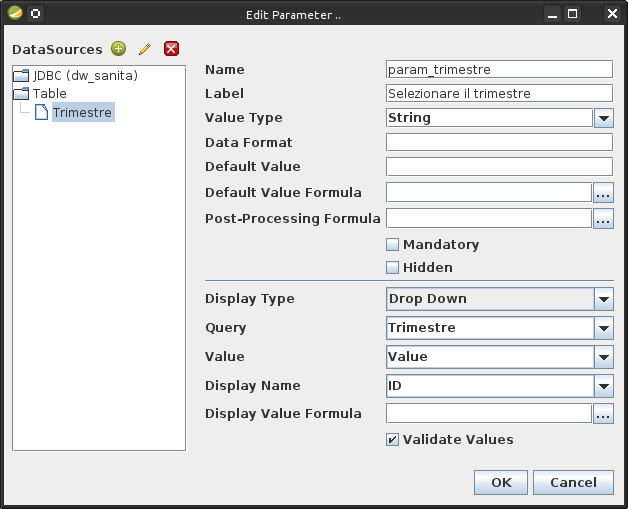
26 Tables
27 Parameters Once parameters have been defined they can be used in queries Parameters are referred in a query as ${parameter_id}
28 Layout Style properties are usually inherited The style tab has a column Inherit It means that the property is inherited from a higher level Elements are added in the structure or the Design screen composing the report The page and elements can be formatted Row-banding is supported for alternating row coloring
29 Grouping and summarizing A group is used to organize content in different levels Sub-headers and sub-totals can be added Groups are defined hierarchically Each group has its own header and footer Labels, fields, total can be placed there
30 Functions Functions can be used to insert calculations into the report e.g.: summaries in group footers Function list contains expressions for: Conversion Aggregation Layout Aggregation functions are divided in: Summary: aggregation with the group it is defined Running: aggregation up to the group it is defined
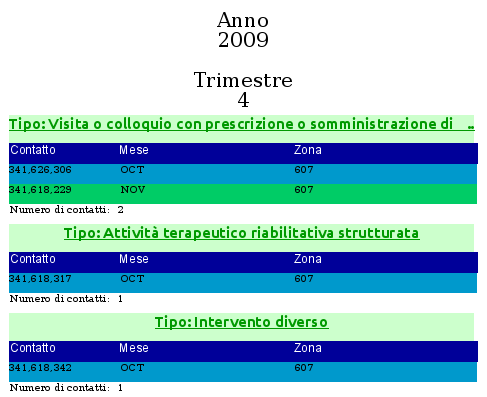
31 Example
32 Charts PRD provides 14 chart types PRD cannot use data fields from a query Collector functions have to be used to transform data for usage in a chart 6 collector functions Each chart type has its own collector function In this way more charts can be created from a single data set Charts can be positioned in report h/f or in groups h/t High-level charts vs. Detailed charts
 2.")
33 Design a chart 1.Define a query to retrieve data 1.From a result set more charts can be generated (at different levels of detail) 2.Add a chart and then edit it Chart types Chart properties Data source definition

34 Publishing PRD reports can be published directly to the Pentaho BI Server
35 Exporting PRD reports can be exported in several formats: PDF HTML XLS RTF CSV The same formats can be used for previewing a report
How To Learn To Write A Report In A Database On A Microsoft Powerbook
 Crystal Reports XI: Level 1 Course Specifications Course number: 085517 Software: Crystal Reports? Course length: 2.0 day(s) Course Description Crystal Reports XI: Level 1 is the primary recommended course
Oracle Business Intelligence Publisher: Create Reports and Data Models. Part 1 - Layout Editor
 Oracle Business Intelligence Publisher: Create Reports and Data Models Part 1 - Layout Editor Pradeep Kumar Sharma Senior Principal Product Manager, Oracle Business Intelligence Kasturi Shekhar Director,
ORACLE BUSINESS INTELLIGENCE WORKSHOP
 ORACLE BUSINESS INTELLIGENCE WORKSHOP Integration of Oracle BI Publisher with Oracle Business Intelligence Enterprise Edition Purpose This tutorial mainly covers how Oracle BI Publisher is integrated with
Designing Reports in Access
 Designing Reports in Access This document provides basic techniques for designing reports in Microsoft Access. Opening Comments about Reports Reports are a great way to organize and present data from your
Pentaho Reporting Overview
 Pentaho Reporting Copyright 2006 Pentaho Corporation. Redistribution permitted. All trademarks are the property of their respective owners. For the latest information, please visit our web site at www.pentaho.org
CHAPTER 6: ANALYZE MICROSOFT DYNAMICS NAV 5.0 DATA IN MICROSOFT EXCEL
 Chapter 6: Analyze Microsoft Dynamics NAV 5.0 Data in Microsoft Excel CHAPTER 6: ANALYZE MICROSOFT DYNAMICS NAV 5.0 DATA IN MICROSOFT EXCEL Objectives The objectives are: Explain the process of exporting
Create Analysis, Interactive Reports, and Dashboards
 Create Analysis, Interactive Reports, and Dashboards This document supports Pentaho Business Analytics Suite 5.0 GA and Pentaho Data Integration 5.0 GA, documentation revision February 3, 2014, copyright
Sophos Reporting Interface Creating Reports using Crystal Reports 2008
 Sophos Reporting Interface Creating Reports using Crystal Reports 2008 Creating Reports using Crystal Reports 2008 This document describes how to use Crystal Reports to create reports from data provided
6 th Annual EclipseCon Introduction to BIRT Report Development. John Ward
 6 th Annual EclipseCon Introduction to BIRT Report Development John Ward BIRT and Us Who am I? Who are you? Who am I? John Ward, BIRT user Independent BIRT Enthusiast Author: Practical Data Analysis and
Welcome to the topic on Master Data and Documents.
 Welcome to the topic on Master Data and Documents. In this topic, we will look at master data in SAP Business One. After this session you will be able to view a customer record to explain the concept of
Microsoft Excel 2010 Pivot Tables
 Microsoft Excel 2010 Pivot Tables Email: training@health.ufl.edu Web Page: http://training.health.ufl.edu Microsoft Excel 2010: Pivot Tables 1.5 hours Topics include data groupings, pivot tables, pivot
Business Insight Report Authoring Getting Started Guide
 Business Insight Report Authoring Getting Started Guide Version: 6.6 Written by: Product Documentation, R&D Date: February 2011 ImageNow and CaptureNow are registered trademarks of Perceptive Software,
Using the SAS Enterprise Guide (Version 4.2)
") 2011-2012 Using the SAS Enterprise Guide (Version 4.2) Table of Contents Overview of the User Interface... 1 Navigating the Initial Contents of the Workspace... 3 Useful Pull-Down Menus... 3 Working with
2011-2012 Using the SAS Enterprise Guide (Version 4.2) Table of Contents Overview of the User Interface... 1 Navigating the Initial Contents of the Workspace... 3 Useful Pull-Down Menus... 3 Working with
COGNOS 8 Business Intelligence
 COGNOS 8 Business Intelligence QUERY STUDIO USER GUIDE Query Studio is the reporting tool for creating simple queries and reports in Cognos 8, the Web-based reporting solution. In Query Studio, you can
CS1100: Access Reports
 CS1100: Access Reports A (Very) Short Tutorial on Microsoft Access Report Construction Created By Martin Schedlbauer With contributions from Matthew Ekstrand-Abueg CS1100 Microsoft Access 1 Reports Reports
MicroStrategy Desktop
 MicroStrategy Desktop Quick Start Guide MicroStrategy Desktop is designed to enable business professionals like you to explore data, simply and without needing direct support from IT. 1 Import data from
About PivotTable reports
 Page 1 of 8 Excel Home > PivotTable reports and PivotChart reports > Basics Overview of PivotTable and PivotChart reports Show All Use a PivotTable report to summarize, analyze, explore, and present summary
Course Descriptions for Focused Learning Classes
 Course Descriptions for Focused Learning Classes Excel Word PowerPoint Access Outlook Adobe Visio Publisher FrontPage Dreamweaver EXCEL Classes Excel Pivot Tables 2 hours Understanding Pivot Tables Examining
Importing TSM Data into Microsoft Excel using Microsoft Query
 Importing TSM Data into Microsoft Excel using Microsoft Query An alternate way to report on TSM information is to use Microsoft Excel s import facilities using Microsoft Query to selectively import the
Release 2.1 of SAS Add-In for Microsoft Office Bringing Microsoft PowerPoint into the Mix ABSTRACT INTRODUCTION Data Access
 Release 2.1 of SAS Add-In for Microsoft Office Bringing Microsoft PowerPoint into the Mix Jennifer Clegg, SAS Institute Inc., Cary, NC Eric Hill, SAS Institute Inc., Cary, NC ABSTRACT Release 2.1 of SAS
Microsoft SQL Server is great for storing departmental or company data. It. A Quick Guide to Report Builder - 2013. In association with
 In association with A Quick Guide to Report Builder - 2013 Simon Jones explains how to put business information into the hands of your employees thanks to Microsoft SQL Server is great for storing departmental
Microsoft Office PowerPoint 2003. Creating a new presentation from a design template. Creating a new presentation from a design template
 Microsoft Office PowerPoint 2003 Tutorial 2 Applying and Modifying Text and Graphic Objects 1 Creating a new presentation from a design template Click File on the menu bar, and then click New Click the
University of Rochester
 University of Rochester User s Guide to URGEMS Ad Hoc Reporting Guide Using IBM Cognos Workspace Advanced, Version 10.2.1 Version 1.0 April, 2016 1 P age Table of Contents Table of Contents... Error! Bookmark
An Oracle White Paper May 2013. Creating Custom PDF Reports with Oracle Application Express and the APEX Listener
 An Oracle White Paper May 2013 Creating Custom PDF Reports with Oracle Application Express and the APEX Listener Disclaimer The following is intended to outline our general product direction. It is intended
Kaseya 2. Quick Start Guide. for VSA 6.3
 Kaseya 2 Custom Reports Quick Start Guide for VSA 6.3 December 9, 2013 Agreement The purchase and use of all Software and Services is subject to the Agreement as defined in Kaseya s Click-Accept EULA as
Market Pricing Override
 Market Pricing Override MARKET PRICING OVERRIDE Market Pricing: Copy Override Market price overrides can be copied from one match year to another Market Price Override can be accessed from the Job Matches
A database is a collection of data organised in a manner that allows access, retrieval, and use of that data.
 Microsoft Access A database is a collection of data organised in a manner that allows access, retrieval, and use of that data. A Database Management System (DBMS) allows users to create a database; add,
HOW TO COLLECT AND USE DATA IN EXCEL. Brendon Riggs Texas Juvenile Probation Commission Data Coordinators Conference 2008
 HOW TO COLLECT AND USE DATA IN EXCEL Brendon Riggs Texas Juvenile Probation Commission Data Coordinators Conference 2008 Goals To be able to gather and organize information in Excel To be able to perform
How To Create A Report In Excel
 Table of Contents Overview... 1 Smartlists with Export Solutions... 2 Smartlist Builder/Excel Reporter... 3 Analysis Cubes... 4 MS Query... 7 SQL Reporting Services... 10 MS Dynamics GP Report Templates...
Course Title: Microsoft Access 2007- Basic Duration: 12 hours
 Course Title: Microsoft Access 2007- Basic Duration: 12 hours Getting started Topic A: Database concepts A-1: Identifying database components A-2: Identifying the advantages of relational databases Topic
Microsoft. Access HOW TO GET STARTED WITH
 Microsoft Access HOW TO GET STARTED WITH 2015 The Continuing Education Center, Inc., d/b/a National Seminars Training. All rights reserved, including the right to reproduce this material or any part thereof
Open Source Business Intelligence Intro
 Open Source Business Intelligence Intro Stefano Scamuzzo Senior Technical Manager Architecture & Consulting Research & Innovation Division Engineering Ingegneria Informatica The Open Source Question In
How To Create A Powerpoint Intelligence Report In A Pivot Table In A Powerpoints.Com
 Sage 500 ERP Intelligence Reporting Getting Started Guide 27.11.2012 Table of Contents 1.0 Getting started 3 2.0 Managing your reports 10 3.0 Defining report properties 18 4.0 Creating a simple PivotTable
RIFIS Ad Hoc Reports
 RIFIS Ad Hoc Reports To retrieve the entire list of all Ad Hoc Reports, including the Base reports and any additional reports published to your Role, select Ad Hoc for the Type under Filter Report By and
Business Objects Enterprise version 4.1. Report Viewing
 Business Objects Enterprise version 4.1 Note about Java: With earlier versions, the Java run-time was not needed for report viewing; but was needed for report writing. The default behavior in version 4.1
DESKTOP PRODUCTIVITY SOFTWARE
 USING WINDOWS 8 UNIT 1: INTRODUCTION TO COMPUTERS Topic A: Overview of computers Topic B: How computers work Topic C: Starting the computer UNIT 2: INPUT DEVICES Topic A: Mouse and keyboard basics Topic
Microsoft Excel: Pivot Tables
 Microsoft Excel: Pivot Tables Pivot Table Reports A PivotTable report is an interactive table that you can use to quickly summarize large amounts of data. You can rotate its rows and columns to see different
Introduction to Microsoft Access 2010
 Introduction to Microsoft Access 2010 A database is a collection of information that is related. Access allows you to manage your information in one database file. Within Access there are four major objects:
Microsoft Excel 2007 Level 2
 Information Technology Services Kennesaw State University Microsoft Excel 2007 Level 2 Copyright 2008 KSU Dept. of Information Technology Services This document may be downloaded, printed or copied for
Dashboard Overview. Bernd Schneider. Technical Solution Professional BI Microsoft Switzerland bernd.schneider@microsoft.com
 Dashboard Overview Bernd Schneider Technical Solution Professional BI Microsoft Switzerland bernd.schneider@microsoft.com Techdays Bern (8./9. April) http://www.techdays.ch + * Including Microsoft Office
Learn About Analysis, Interactive Reports, and Dashboards
 Learn About Analysis, Interactive Reports, and Dashboards This document supports Pentaho Business Analytics Suite 5.0 GA and Pentaho Data Integration 5.0 GA, documentation revision February 3, 2014, copyright
COGNOS Query Studio Ad Hoc Reporting
 COGNOS Query Studio Ad Hoc Reporting Copyright 2008, the California Institute of Technology. All rights reserved. This documentation contains proprietary information of the California Institute of Technology
2. Building Cross-Tabs in Your Reports Create a Cross-Tab Create a Specified Group Order Filter Cross-Tab by Group Keep Groups Together
 Crystal Reports Level 2 Computer Training Solutions Course Outline 1. Creating Running Totals Create a Running Total Field Modify a Running Total Field Create a Manual Running Total on Either Detail Data
Microsoft Word 2007 - Mail Merge
 Microsoft Word 2007 - Mail Merge Mail merge is a tool which allows you to create form letters, mailing labels and envelopes by linking a main document to a set of data or data source. It is the process
PhonEX ONE Microsoft Sample Reports November 2010
 PhonEX ONE Microsoft Sample Reports November 2010 MIND CTI Ltd. Table of Contents PhonEX ONE Call Management Solution... 1 PhonEX ONE Reports... 1 Standard Query Reports... 1 Availability Report by Departments
Introduction to Microsoft Access 2013
 Introduction to Microsoft Access 2013 A database is a collection of information that is related. Access allows you to manage your information in one database file. Within Access there are four major objects:
Microsoft Word 2013: Mail Merge
 Microsoft Word 2013: Mail Merge Mail merge is a tool which allows you to create form letters, mailing labels and envelopes by linking a main document to a data source. It is the process of combining a
Taking Advantage of Crystal Reports
 What You Will Need ArcGIS 8.3 (ArcInfo, ArcEditor, or ArcView license) with Crystal Reports installed Sample data downloaded from ArcUser Online Taking Advantage of Crystal Reports In addition to maps,
Toad for Data Analysts, Tips n Tricks
 Toad for Data Analysts, Tips n Tricks or Things Everyone Should Know about TDA Just what is Toad for Data Analysts? Toad is a brand at Quest. We have several tools that have been built explicitly for developers
CambridgeSoft s Biology Solutions -
 CambridgeSoft s Biology Solutions - Workflow CambridgeSoft s ChemOffice WebServer suite includes two products which are focused on the biologist s needs. THese two products: BioAssay HTS and BioSAR Browser,
Microsoft Office Word 2010: Level 1
 Microsoft Office Word 2010: Level 1 Workshop Objectives: In this workshop, you will learn fundamental Word 2010 skills. You will start by getting acquainted with the Word user interface, creating a new
SAS BI Dashboard 4.3. User's Guide. SAS Documentation
 SAS BI Dashboard 4.3 User's Guide SAS Documentation The correct bibliographic citation for this manual is as follows: SAS Institute Inc. 2010. SAS BI Dashboard 4.3: User s Guide. Cary, NC: SAS Institute
Creating a Patch Management Dashboard with IT Analytics Hands-On Lab
 Creating a Patch Management Dashboard with IT Analytics Hands-On Lab Description This lab provides a hands-on overview of the IT Analytics Solution. Students will learn how to browse cubes and configure
Intellicus Enterprise Reporting and BI Platform
 Designing Adhoc Reports Intellicus Enterprise Reporting and BI Platform Intellicus Technologies info@intellicus.com www.intellicus.com Copyright 2013 Intellicus Technologies This document and its content
Reporting Manual. Prepared by. NUIT Support Center Northwestern University
 Reporting Manual Prepared by NUIT Support Center Northwestern University Updated: February 2013 CONTENTS 1. Introduction... 1 2. Reporting... 1 2.1 Reporting Functionality... 1 2.2 Creating Reports...
Work with the MiniBase App
 Work with the MiniBase App Trademark Notice Blackboard, the Blackboard logos, and the unique trade dress of Blackboard are the trademarks, service marks, trade dress and logos of Blackboard, Inc. All other
Stored Documents and the FileCabinet
 Stored Documents and the FileCabinet Introduction The stored document features have been greatly enhanced to allow easier storage and retrieval of a clinic s electronic documents. Individual or multiple
for Sage 100 ERP Business Insights Overview Document
 for Sage 100 ERP Business Insights Document 2012 Sage Software, Inc. All rights reserved. Sage Software, Sage Software logos, and the Sage Software product and service names mentioned herein are registered
How to Create Your Own Crystal Report
 How to Create Your Own Crystal Report Step 1 Figure out what table you need to use for your report. Click on Resources, then File Layouts and Program Information. Click on File Layouts to see the available
The document may be freely distributed in its entirety, either digitally or in printed format, to all EPiServer Mail users.
 Copyright This document is protected by the Copyright Act. Changes to the contents, or partial copying of the contents, may not be done without permission from the copyright holder. The document may be
Mail Merge: Create Mailing Labels Using Excel Data and Filtering the Contents in the Data
 Mail Merge: Create Mailing Labels Using Excel Data and Filtering the Contents in the Data Prior to starting this, please save the.csv file that you exported as an excel file (example: xxxx.csv will now
Business Objects 4.1 Quick User Guide
 Business Objects 4.1 Quick User Guide Log into SCEIS Business Objects (BOBJ) 1. https://sceisreporting.sc.gov 2. Choose Windows AD for Authentication. 3. Enter your SCEIS User Name and Password: Home Screen
Business Analytics Enhancements June 2013
 Business Analytics Enhancements June 03 Enhancement Summary June 03 Item # Site Location Enhancement Welcome Page New style - Fonts and colors have changed as a result of the enhanced reporting engine
HRS 750: UDW+ Ad Hoc Reports Training 2015 Version 1.1
 HRS 750: UDW+ Ad Hoc Reports Training 2015 Version 1.1 Program Services Office & Decision Support Group Table of Contents Create New Analysis... 4 Criteria Tab... 5 Key Fact (Measurement) and Dimension
P6 Professional Report Writer
 P6 Professional Report Writer Don McNatty, PSP June 25, 2014 2014 Technical Webinar Series Thank you for joining today s technical webinar Mute all call in phones are automatically muted in order to preserve
Computer Training Centre University College Cork. Excel 2013 Pivot Tables
 Computer Training Centre University College Cork Excel 2013 Pivot Tables Table of Contents Pivot Tables... 1 Changing the Value Field Settings... 2 Refreshing the Data... 3 Refresh Data when opening a
Lesson 9. Reports. 1. Create a Visual Report. Create a visual report. Customize a visual report. Create a visual report template.
 Lesson 9. s Create a visual report. Customize a visual report. Create a visual report template. Introduction You have updated the cost information in your project plan. When presenting such varied information
Click to edit Master text styles. FA Web Ad Hoc Query. Second level. Third level. Fourth level Fifth level. Training Material. www.assetworks.
 Click to edit Master text styles Second level Third level Fourth level Fifth level FA Web Ad Hoc Query Training Material Contents Navigation 3-6 Security 7-9 Field Options 10-15 Calculated Fields 11-12
CLOCKWORK Training Manual and Reference: Inventory. TechnoPro Computer Solutions, Inc.
 CLOCKWORK Training Manual and Reference: Inventory TechnoPro Computer Solutions, Inc. Table of Contents Inventory Learning Objectives License Key 5 Create a Catalog 6 Assign Permissions 9 Categories and
The software shall provide the necessary tools to allow a user to create a Dashboard based on the queries created.
 IWS BI Dashboard Template User Guide Introduction This document describes the features of the Dashboard Template application, and contains a manual the user can follow to use the application, connecting
Sending a Document via Email Working with Graphics & Using Section Breaks, Envelopes and Labels
 MICROSOFT WORD BASIC FULL DAY COURSE This course is suitable for users with no (or little) previous experience of using Word. Keyboard, mouse and Windows skills are prerequisite for this course. Practice
IBM Unica emessage Version 8 Release 6 February 13, 2015. User's Guide
 IBM Unica emessage Version 8 Release 6 February 13, 2015 User's Guide Note Before using this information and the product it supports, read the information in Notices on page 403. This edition applies to
emarketing Manual- Creating a New Email
 emarketing Manual- Creating a New Email Create a new email: You can create a new email by clicking the button labeled Create New Email located at the top of the main page. Once you click this button, a
Excel 2007 - Using Pivot Tables
 Overview A PivotTable report is an interactive table that allows you to quickly group and summarise information from a data source. You can rearrange (or pivot) the table to display different perspectives
joalmeida@microsoft.com João Diogo Almeida Premier Field Engineer Microsoft Corporation
 joalmeida@microsoft.com João Diogo Almeida Premier Field Engineer Microsoft Corporation Reporting Services Overview SSRS Architecture SSRS Configuration Reporting Services Authoring Report Builder Report
CREATING FORMAL REPORT. using MICROSOFT WORD. and EXCEL
 CREATING a FORMAL REPORT using MICROSOFT WORD and EXCEL TABLE OF CONTENTS TABLE OF CONTENTS... 2 1 INTRODUCTION... 4 1.1 Aim... 4 1.2 Authorisation... 4 1.3 Sources of Information... 4 2 FINDINGS... 4
TheEducationEdge. Export Guide
 TheEducationEdge Export Guide 102111 2011 Blackbaud, Inc. This publication, or any part thereof, may not be reproduced or transmitted in any form or by any means, electronic, or mechanical, including photocopying,
Publisher 2010 Cheat Sheet
 April 20, 2012 Publisher 2010 Cheat Sheet Toolbar customize click on arrow and then check the ones you want a shortcut for File Tab (has new, open save, print, and shows recent documents, and has choices
Designing Adhoc Reports
 Designing Adhoc Reports Intellicus Enterprise Reporting and BI Platform Intellicus Technologies info@intellicus.com www.intellicus.com Designing Adhoc Reports i Copyright 2010 Intellicus Technologies This
BIRT: A Field Guide to Reporting
 BIRT: A Field Guide to Reporting x:.-. ^ 11 Diana Peh Alethea Hannemann Nola Hague AAddison-Wesley Upper Saddle River, NJ Boston Indianapolis San Francisco New York Toronto Montreal London Munich Parts
Pastel Evolution BIC. Getting Started Guide
 Pastel Evolution BIC Getting Started Guide Table of Contents System Requirements... 4 How it Works... 5 Getting Started Guide... 6 Standard Reports Available... 6 Accessing the Pastel Evolution (BIC) Reports...
s@lm@n SAS Institute Exam A00-270 SAS BI Content Developmentfor SAS 9 Version: 7.0 [ Total Questions: 107 ]
![s@lm@n SAS Institute Exam A00-270 SAS BI Content Developmentfor SAS 9 Version: 7.0 [ Total Questions: 107 ]](/thumbs/27/10238818.jpg "s@lm@n SAS Institute Exam A00-270 SAS BI Content Developmentfor SAS 9 Version: 7.0 [ Total Questions: 107 ]") s@lm@n SAS Institute Exam A00-270 SAS BI Content Developmentfor SAS 9 Version: 7.0 [ Total Questions: 107 ] SAS Institute A00-270 : Practice Test Question No : 1 When a SAS Web Report Studio report is
s@lm@n SAS Institute Exam A00-270 SAS BI Content Developmentfor SAS 9 Version: 7.0 [ Total Questions: 107 ] SAS Institute A00-270 : Practice Test Question No : 1 When a SAS Web Report Studio report is
2. Metadata Modeling Best Practices with Cognos Framework Manager
 IBM Cognos 10.1 DWH Basics 1 Cognos System Administration 2 Metadata Modeling Best Practices With Cognos Framework Manager 3 OLAP Modeling With Cognos Transformer (Power Play Tranformer) 4 Multidimensional
Branding Guidelines - Interactive Info Wall
 Phase I: Design We will need the following items from you to create the mockup for your design:. A high resolution version of your logo (.jpg,.tiff, or.bmp). A high resolution image for the Welcome screen
Practical Example: Building Reports for Bugzilla
 Practical Example: Building Reports for Bugzilla We have seen all the components of building reports with BIRT. By this time, we are now familiar with how to navigate the Eclipse BIRT Report Designer perspective,
ITS Training Class Charts and PivotTables Using Excel 2007
 When you have a large amount of data and you need to get summary information and graph it, the PivotTable and PivotChart tools in Microsoft Excel will be the answer. The data does not need to be in one
Microsoft Access 2010 handout
 Microsoft Access 2010 handout Access 2010 is a relational database program you can use to create and manage large quantities of data. You can use Access to manage anything from a home inventory to a giant
Microsoft SQL Server 2005 Reporting Services Step by Step
 Microsoft SQL Server 2005 Reporting Services Step by Step Stacia Misner; Hitachi Consulting To learn more about this book, visit Microsoft Learning at http://www.microsoft.com/mspress/books/9153.aspx 9780735622500
Advanced Excel Charts : Tables : Pivots : Macros
 Advanced Excel Charts : Tables : Pivots : Macros Charts In Excel, charts are a great way to visualize your data. However, it is always good to remember some charts are not meant to display particular types
Reporting and Analysis with SAP BusinessObjects
 Ingo Hilgefort Reporting and Analysis with SAP BusinessObjects Bonn Boston Contents at a Glance 1 Introduction to the SAP BusinessObjects Reporting and Analysis Tools... 19 2 Customer Requirements and
Timeless Time and Expense Version 3.0. Copyright 1997-2009 MAG Softwrx, Inc.
 Timeless Time and Expense Version 3.0 Timeless Time and Expense All rights reserved. No parts of this work may be reproduced in any form or by any means - graphic, electronic, or mechanical, including
History Explorer. View and Export Logged Print Job Information WHITE PAPER
 History Explorer View and Export Logged Print Job Information WHITE PAPER Contents Overview 3 Logging Information to the System Database 4 Logging Print Job Information from BarTender Designer 4 Logging
BRIO QUERY FUNCTIONALITY IN COMPARISION TO CRYSTAL REPORTS
 BRIO QUERY FUNCTIONALITY IN COMPARISION TO CRYSTAL REPORTS Category Downstream Analysis Nested Queries Brio Functionality Ability to create data sets Ability to create tables and upload tables Available
MICROSOFT ACCESS 2007 BOOK 2
 MICROSOFT ACCESS 2007 BOOK 2 4.1 INTRODUCTION TO ACCESS FIRST ENCOUNTER WITH ACCESS 2007 P 205 Access is activated by means of Start, Programs, Microsoft Access or clicking on the icon. The window opened
Decreases the magnification of your chart. Changes the magnification of the displayed chart.
 OrgPlus Guide 1) Logging In 2) Icon Key 3) Views a. Org Chart b. Salary Org Chart c. Head Count/Span of Control 4) Viewing Profile/Explore/Bookmarks Panels a. Creating Bookmarks 5) Searching a. From the
Getting Started Guide
 Getting Started Guide Introduction... 3 What is Pastel Partner (BIC)?... 3 System Requirements... 4 Getting Started Guide... 6 Standard Reports Available... 6 Accessing the Pastel Partner (BIC) Reports...
Vendor: Crystal Decisions Product: Crystal Reports and Crystal Enterprise
 1 Ability to access the database platforms desired (text, spreadsheet, Oracle, Sybase and other databases, OLAP engines.) Y Y 2 Ability to access relational data base Y Y 3 Ability to access dimensional
By: Peter K. Mulwa MSc (UoN), PGDE (KU), BSc (KU) Email: Peter.kyalo@uonbi.ac.ke
, PGDE (KU), BSc (KU) Email: Peter.kyalo@uonbi.ac.ke") SPREADSHEETS FOR MARKETING & SALES TRACKING - DATA ANALYSIS TOOLS USING MS EXCEL By: Peter K. Mulwa MSc (UoN), PGDE (KU), BSc (KU) Email: Peter.kyalo@uonbi.ac.ke Objectives By the end of the session, participants
SPREADSHEETS FOR MARKETING & SALES TRACKING - DATA ANALYSIS TOOLS USING MS EXCEL By: Peter K. Mulwa MSc (UoN), PGDE (KU), BSc (KU) Email: Peter.kyalo@uonbi.ac.ke Objectives By the end of the session, participants
Creating forms in Microsoft Access 2007
 Platform: Windows PC Ref no: USER 166 Date: 14 th January 2008 Version: 1 Authors: Derek Sheward, Claire Napier Creating forms in Microsoft Access 2007 This is the fourth document in a series of five on
INTRODUCING ORACLE APPLICATION EXPRESS. Keywords: database, Oracle, web application, forms, reports
 INTRODUCING ORACLE APPLICATION EXPRESS Cristina-Loredana Alexe 1 Abstract Everyone knows that having a database is not enough. You need a way of interacting with it, a way for doing the most common of