Getting Started Guide
|
|
|
- Jason Walton
- 9 years ago
- Views:
Transcription
1 Getting Started Guide

2 Introduction... 3 What is Pastel Partner (BIC)?... 3 System Requirements... 4 Getting Started Guide... 6 Standard Reports Available... 6 Accessing the Pastel Partner (BIC) Reports... 7 Running a Report from the Report Manager... 9 Copying, Pasting and Renaming Reports Creating and Linking a Report Adding & Creating a New report Defining Report Properties Exporting Reports Importing Reports Creating a Simple Pivot Table in Excel Pivot Tables Excel Pivot Tables Excel GETTING SUPPORT... 46

3 INTRODUCTION WHAT IS PASTEL PARTNER (BIC)? Organizations are increasingly suffering from information frustration, having to manage large volumes of data, and needing to report from several databases, using inflexible reporting tools. Information delivery and user empowerment is increasingly taking centre stage in all enterprises with a resultant growth in the end user query and reporting (EUQR) category of the business intelligence market. Pastel Partner (BIC) is an innovative software reporting solution that offers users in organizations of all sizes a powerful and intuitive reporting tool to take control of their own reports. It introduces a revolutionary approach to leveraging the reporting power of Microsoft Excel and protects and extends organizations existing IT skills and investment. What are the benefits of using Pastel Partner (BIC)? Work with a standard windows look and feel Reduces the need for IT department intervention Reduces the need for expensive consultants and specialist software training Consistent format (MS Excel) for reporting across multiple data sources Business intelligence can become a standard desktop tool Avoids inefficiencies in the report development life cycle thereby improving productivity Empowers the user thereby improving overall productivity Optimizes your return on investment by leveraging your existing IT infrastructure Extends MS Excel skills rather than requiring learning of a new set of software skills Pastel Partner (BIC) is a cost effective, high value reporting tool that allows people to spend more time doing things that directly translate into business value. It offers flexible access to business intelligence and empowers the user to create and customise operational and analytical reports on a real time basis. Pastel Partner (BIC) allows an organization to track information more effectively and delivers a rapid return on investment at a moderate total cost of ownership.

4 SYSTEM REQUIREMENTS Recommended System Requirements Operating System : Windows XP SP3, Windows Vista, Windows 7, Windows Server 2003, Windows Server 2008, Windows Terminal Server Microsoft Excel 2003 and higher. Note : to run BIC Genie reports, you need to have Excel 2007 or higher. Hardware: CPU > 1.3 GHz Memory: 512MB RAM Hard Drive Space: 200MB Database Connectivity Supported Pastel Partner (BIC) uses ODBC and OLEDB technology to gain access to Open Database Systems. Pastel Partner (BIC) includes direct support for most popular database systems and Connection Types for these are included within the Administrator. For systems where a Connection Type does not exist but where the system has an ODBC driver these can be accessed via the System DSN connection types within the Administrator. Some of the more common Database types supported are: Microsoft SQL Server Pervasive Oracle Sybase Microsoft Access Microsoft Visual Foxpro Dbase MySQL Sage50 Paradox
 includes direct support for most popular database systems and Connection Types for these are included within the Administrator.")
5 How it Works Pastel Partner (BIC) uses an ODBC connection to access data and offers the system administrator and user, separate interfaces to manage the report creation process. Pastel Partner (BIC) is then integrated with Microsoft Excel which is used as a powerful and familiar desktop reporting platform.
 is then integrated with Microsoft Excel which is used")
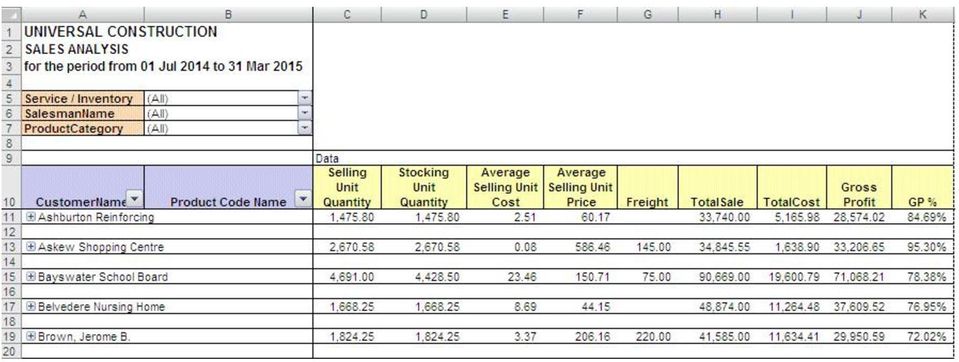
6 GETTING STARTED GUIDE STANDARD REPORTS AVAILABLE Pastel Partner (BIC) comes with sample reports that you can use as templates when creating your own reports. Financial Ratio Calculator Dashboard Analysis The Dashboard Analysis report contains a one-page summary of key business information. The report features Top 5 Reporting on customers, items, expenses, and contains both text and graphics to help with daily and long-term planning. In addition, comparative Profit and Loss figures are displayed for both the current month and year-to-date figures from the start of the current financial year. Income Statements Balance Sheets Sales Master This report highlights pertinent sales information including item sales quantities, costs, and gross profits by customer and product. Inventory Master Displays item cost and quantity information over any given date range, as well as relevant item location details. Purchase Order Master This report lists relevant purchase information by vendor and item number for any given date range. The report can be filtered by vendor, item number, or unit of measure.

7 ACCESSING THE PASTEL PARTNER (BIC) REPORTS To access the reports: 1. From within Pastel Partner, Click on View, Business Intelligence Centre, Launch, Report Manager Or 1. From within Pastel Partner, Click on ViewBusiness Intelligence Centre, Run Reports, and choose the report you would like to run.

8
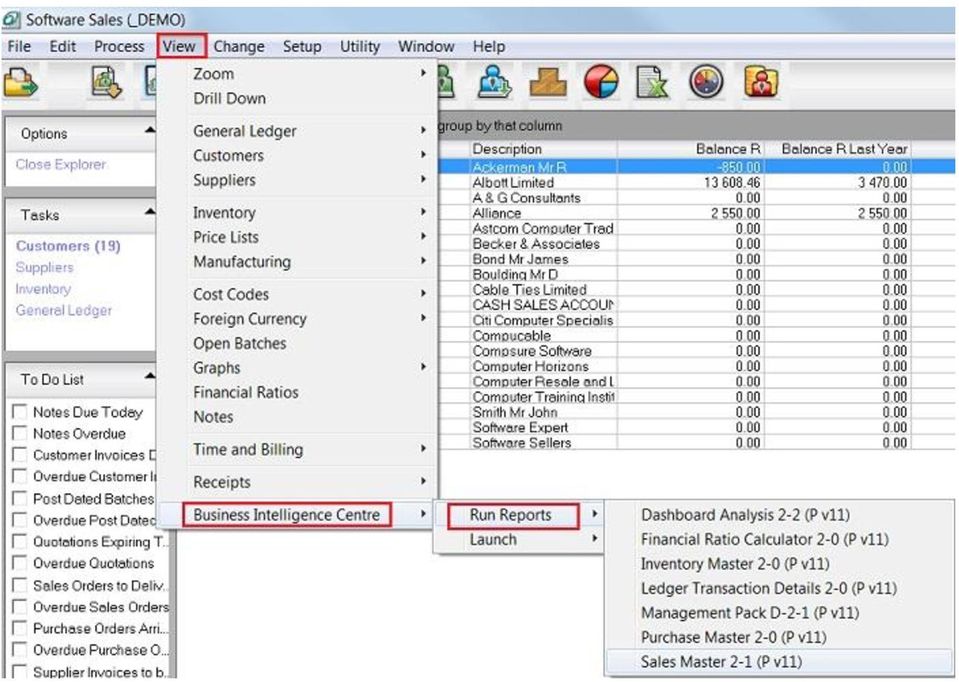
9 RUNNING A REPORT FROM THE REPORT MANAGER 1. Select the report you want to run. For this example, choose Sales Master under Sales 2. To run the report click on the green Run icon, You can also right-click and select Run or press Ctrl+R 3. Enter Report Parameter. (Date/ Month) 4. Click OK 5. The progress Status is displayed on the right of your screen and indicates the process of your report. Depending on the size of your company data, running a report may take some time. You can sometimes cancel the report. 6. Once the process has finished, the report opens in a new Microsoft Excel Workbook

10
11 COPYING, PASTING AND RENAMING REPORTS You can copy and paste a report, at any stage, in the report manager. These functions are useful in Pastel Partner (BIC) because all the Master reports are locked and you need to make a copy of these master reports. Use the copy, paste, and renaming methods so you can create new reports from an existing report and therefore not corrupt the master report. You may have a sales report that shows a customer analysis on sales; however, you want to create another report that shows sales analyzed by Reps. You can create a copy of the original report, and then rename the copy to Sales by Rep, and then customize the new Sales by Rep report. You have the benefit of re-using all the containers and expressions in the original report without having to create them from scratch. To create a new report from an existing report 1. Open the Report Manager. 2. Right-click on the report you want to make a copy of; e.g. Sales Master 3. Select Copy to copy that report to the Clipboard. 4. Now paste the copied report onto a folder.

12 5. Select a folder. You can choose the same folder that contains the original report or a different folder. 6. Right-click on the selected folder and select Paste. 7. Rename the newly copied report. By default, the report s name is Copy of <report name>. Note You can use the short-cut keys of Ctrl+C to copy the report, and Ctrl+V to paste instead of using the menus. Right-click on the report and select Rename to give the report a different name. You now have an exact duplicate of the original report that will obtain its data from the same place, and deliver it in the same format, until you make any changes to this new report.

13 CREATING AND LINKING A REPORT It is entirely possible to customize the look and layout of the Pastel Partner (BIC) Standard Reports. Although these reports are designed to encompass the needs of most business organizations, you may want to change the appearance (colors, text style, etc.) to reflect your company image, and perhaps change the order or inclusion of columns to suit your company processes. These changes can be saved for the next time you run the report. Creating Excel templates enables the user to create a template from an open Excel workbook and link it to an existing report so as to standardize the output format of the chosen report for every run instance in future. Note: If you are unsure of making changes to any of the Standard Reports, you should create a copy of the report before you make any changes. Pastel Partner (BIC) users must make a copy of a report in order to edit the standard reports. To copy a report 1. Open the Pastel Partner (BIC) Report Manager. 2. Right-click the report you want to copy and select Copy. 3. Right-click on the report folder in which you want to paste the copy and select Paste. The copy of the report is renamed as Copy of and the original report name. To create and link the Report 1. Open the Pastel Partner (BIC) Report Manager. 2. Select and run the report you want to customize.

14 3. Make the changes to the report; ensure that Sheet1 (where Pastel Partner (BIC) puts the Raw Data) and Sheet2 (where Pastel Partner (BIC) puts the report parameters) are unchanged. 4. After completing the changes, leave the workbook open and go back to the Report Manager. 5. Right-click on the report for which the changes were made and select Create and Link Template. 6. Select the workbook with the changes in the window that appears. 7. Click OK.

15 8. When prompted with the following message, click Yes to link the workbook. Clicking No will not link the workbook. 9. When prompted to specify the template name, change the name of the template. Doing so ensures that the original template is not overwritten with the copy 10. Click OK. Once the template has been successfully linked, a message is displayed.

16 ADDING & CREATING A NEW REPORT To create a new report from existing containers, you must first create a new folder. Remember that folders contain all the reports related to a particular topic. For example, all reports related to Sales. You cannot create sub folders. Creating a New Report from Existing Containers This process consists of two steps: Adding a folder Adding a report To add a folder 1. Open the Pastel Partner (BIC) Report Manager. 2. Select Home. 3. Right click and select Add Folder. The Enter a Name for the Folder window opens 4. Enter a name for your folder; e.g., Sales Test. 5. Click OK. To add a report 1. Select the Folder where you want to add the report; e.g., Sales Test. 2. Right-click and select Add Report. 3. Select the type of report to add when prompted. You will add a standard report

17 4. Enter a new name for the report; e.g., Sales Report. 5. Click OK and the Select Data Container window opens. 6. Select the data container from which you want to source your data; e.g., Sales Details. The Choose Column fields window opens.

18 7. Select the columns you require in your report. 8. (Optional) Click Select All to select all of the Expressions. 9. Click OK. Your new report is now in your specified folder. To Run the Report, in the object window select the report you have just created and click on the Run icon on the Report Manager Toolbar. Pastel Partner (BIC) will launch the report and your data will be rendered to Excel.

19 DEFINING REPORT PROPERTIES Pastel Partner (BIC) Report Properties The report type (Standard, Dataless, Sub query or Union) mainly determines which standard tabs are available on the selected Properties window. A typical Properties window of Standard report types has, besides the Properties tab also a tab for each report output property, namely Columns, Filters, Parameters, Sort Fields, and Aggregate Filters. Report Properties Overview We will look at the properties and columns of a standard report. When selecting a report, tabs appear on the right of the screen. These tabs allow you to modify the report s display output. Properties Tab The Properties tab enables you to view and change general report details such as the report name and description. To confirm any change select the Apply button on the top right of the properties window

20 Columns Tab The columns window lists the columns that make up the Excel report. You are able to Add, Remove or change the order of the columns using the buttons on the top right of the window.

21 Adding Additional Columns 1. Select the Columns tab from the Properties window. 2. Click Add 3. Select the desired column. 4. Click OK. The new column appears in the Columns window.
22
23 Moving and Deleting Columns Moving Columns If you want the columns to appear in a certain order in Microsoft Excel, you can change their order in the Properties window. 1. From the Properties window, select the Columns tab 2. Select the desired column/s 3. Click Move Up or Move Down OR 4. Select the desired column/s 5. Drag to the appropriate position. Deleting Columns 1. From the Properties window, right click on the desired column. 2. Click Delete.
24 or 1. From the Properties window, Click on the desired column. 2. Click Remove.
25 EXPORTING REPORTS Reports can be exported from one system and imported into another. The export function creates a compressed file with an.al_ extension which can be imported into other systems. The uncompressed version of the file will create a file with the extension.alx 1. From the Object window, right click on the desired report and select Export Report or click on Tools, Export Report. 2. Select the Export folder when prompted. 3. Click Save. You will get a message to confirm your Export Succeeded. 4. Click OK. To import a Report into Pastel Partner (BIC) from an export file see Importing a Report. Note: If you are running a Third Party Developer License of Pastel Partner (BIC) then it is possible for you to protect your export files. See Exporting Reports with Protection in the user's guide for more details.
26 IMPORTING REPORTS Reports can be exported from one system and imported into another. The export function creates a compressed file with an.al_ extension which can be imported into other systems. The uncompressed version of the file will create a file with the extension.alx Report export files (.alx files) and compressed export files (.al_ files - version 3.5 and later) created using the Export Report facility can be imported into Pastel Partner (BIC). Using this facility, Reports can be created in one Pastel Partner (BIC) system and distributed to other Pastel Partner (BIC) systems. 1. Right-click on the Home object in the Object window and Select Import Report or click on Tools, Import Report. 2. Select the report to be imported (with the _al extension) and click Open 3. In the Import Report window, select the Target Connection (Administrator) 4. Then select the Report Destination (the folder)
27 5. Click Import 6. Click OK. 7. Double-click on the Sales Reports folder to refresh Below is a list of the information that is supplied to you for an import and a description of each element:
28 Report Name Created By Company Report Container Source Creation Time Original Template Name Template File Size Original Connection Name Export Library Version Import Library Version Target Connection Target Connection Type Report Destination The original name of the Report in the Source Pastel Partner (BIC) System The Company that created the Export File The Source Container for the Report in the Source Pastel Partner (BIC) System The Date and time that the Export File was created The name of the Report Template in the Source Pastel Partner (BIC) System The size (in bytes) of the Report Template File The name of the Source Data Connection in the Pastel Partner (BIC) Source System The Version of the Export Program Library used to create the export file The Version of the Import Program Library being used to perform the import The Connection that you have selected as the Source for the new report that will be created by the import The Source Connection Type of the Connection that you have selected as the Source for the new report that will be created by the import The Report Manager Folder into which the new report will be imported
29 CREATING A SIMPLE PIVOT TABLE IN EXCEL Reasons for Organizing Data into a Pivot Table Four key reasons for organizing data into a Pivot Table are: To summarize the data contained in a lengthy list into a compact format To find relationships within the data that are otherwise hard to see because of the amount of detail To organise the data into a format that s easy to chart View the same data in many different ways quickly and easily Pivot Table reports use functions, allowing you to total, average and count data. These functions also provide subtotals and grand totals automatically, where you choose to show them. Original Worksheet Pivot Table
30 Pivot Chart
31 PIVOT TABLES EXCEL 2007 Pivot Table Concept and Layout An important point to remember when working with Pivot Tables is that you are working within a layout slightly different to a normal Microsoft Excel worksheet. A Pivot Table has its own Ribbon and that alone provides functionality specific to the Pivot Table and not to a normal Microsoft Excel cell on the worksheet. Although one can format a cell using the format tools on the Home tab of the Ribbon, a Pivot Table provides its own format cells option on its Ribbon as it is treated as a separate entity. A Pivot Table has its own layout and is split up into 4 sections. Each of the above sections is used to show fields from the Pivot Table source data, each section having its own purpose.
32 Report Filter Column Labels Row Labels Values This section assists in providing a third dimension to your data. It can also provide a more summarised/filtered view of the rest of the fields displayed in the other sections. When placing a field in this section it therefore reduces the number of items within a Pivot Table and in some instances prevents the Pivot Tables number of items limitation from being reached. If you include a page field in your Pivot Table you can choose to display the Pivot Table pages on separate worksheets. Select the show pages button on the drop down menu of the Pivot Table toolbar button. Microsoft Excel will automatically replicate each page s data on a separate worksheet. One would place fields in this section when wanting to group the data by a specific field e.g. by customer. Your customers will appear in the columns going across. One would place fields in this section when wanting to group the data by a specific field. E.g. by Customer. Your customers will appear in the rows going down. One would normally place fields in this section where their values are numbers such as a qty or amount field e.g. Customer Sales. Calculations such as sum, average, min, max etc can be used on such fields. This section has to contain at least one field.
33 Create a Pivot Table Report To create a Pivot Table you need to identify these two elements in your data: Have a list in Microsoft Excel with data fields (headings) and rows of related data Identify which fields are going to go where in your design Method 1. Select any cell in the data list 2. From the Insert tab, in the Tables group, select Pivot Table 3. Make sure that Select a table or range is selected 4. Make sure your data is listed in the Table/Range box
34 5. Select where you want the Pivot Table to go, either in an Existing Worksheet or New Worksheet 6. Select OK 7. A blank Pivot Table will now be displayed. 8. In the Field List either select the fields you want in the Row Labels or drag them into the Row Labels area on the Field List box 9. Repeat for Report Filter, Columns Labels and Values.
35 Pivot Table Field List Pivot Table Field List The Pivot Table Field List contains the fields available for your Pivot Table, based on the fields in the data range that the Pivot Table is based on. In addition there are areas where you can add Report Filter (Page Area fields), sections that list the row and column fields and a section for the Data Area fields.
36 Turn the Field List On/Off The Pivot Table Field List is only visible while you are within the Pivot Table. If you are within the Pivot Table and it is still not visible, right click and select Show Field List. You can also turn the field list on and off from the Ribbon. Method 1. Select any cell in the Pivot Table 2. From the Options tab, in the Show/Hide group, select Field List OR 1. Select any cell in the Pivot Table 2. Right click and select Show Field List
37 Remove, add and move fields When selecting a field from the data area to move or remove, you need to select the field by placing the mouse pointer on the border of the field and clicking when the pointer changes to the normal arrow pointer. Fields that appear in the Pivot Table will have a tick in their check box on the Field List. Deselecting this check box will remove the field from the Pivot Table. Remove a Field Method 1. From the Field List select the check box next to the field you wish to remove OR 1. From the Field List, select the drop down arrow next to the field 2. Select Remove Field Add a Field Method 1. Select the check box next to the field in the Field List OR 1. Select the Field in the Field List and drag it to the desired area e.g. Report Filter
38 Move Fields within the Table Method 1. From the Field List, drag the field to the desired area OR 1. From the Field List, select the drop down arrow next to the field 2. Select Move Up, Move down etc.
39 PIVOT TABLES EXCEL 2003 Pivot Table Concept and Layout 2003 An important point to remember when working with Pivot Tables is that you are working within a layout slightly different to a normal Excel worksheet. A Pivot Table has its own toolbar and that alone provides functionality specific to the Pivot Table and not to a normal Excel cell on the worksheet. Although one can format a cell using the format menu, a Pivot Table provides its own format cells option on its toolbar as it is treated as a separate entity. A Pivot Table has its own layout and is split up into 4 sections. With reference to the diagrams below you can see the layouts in two different ways. The one on the left being the layout which is visible on the Excel worksheet, the one on the right being the same layout but with its appearance when working within the Pivot Table Wizard. Layout as per a Pivot Table displayed on a worksheet Layout as per the Pivot Table wizard
40 Each of the above sections are used to show fields from the Pivot Table source data, each section having its own purpose. The Row Area The Data Area The Column Area The Page Area One would place fields in this section when wanting to group the data by a specific field. E.g. by Customer. Your customers will appear in the rows going down. One would normally place fields in this section where their values are numbers such as a amount field e.g. Customer Sales. Calculations such as sum, average, min, max etc can be used on such fields. This section has to contain at least one field. One would place fields in this section when wanting to group the data by a specific field e.g. by customer. Your customers will appear in the columns going across This section assists in providing a third dimension to your data. It can also provide a more summarized/filtered view of the rest of the fields displayed in the other sections. When placing a field in this section it therefore reduces the number of items within a Pivot Table and in some instances prevents the Pivot Tables number of items limitation from being reached.
41 Create a Pivot Table Report To create a Pivot Table you need to identify these two elements in your data: Have a list in Excel with data fields (headings) and rows of related data Identify which fields are going to go where in your design Method 1. Select any cell in the data list 2. On the Menu bar select Data 3. Select Pivot Table and Pivot Chart Wizard. 4. Make sure that Microsoft Excel list or database is selected as the data to analyze 5. Make sure the kind of report is selected as Pivot Table. 6. Select Next 7. Select the collapse icon in the range box
42 8. Select the data range on the worksheet that contains the source data 9. The selected range will appear in the range box 10. Select the collapse icon again to return to your active worksheet. 11. Select Next 12. On the next screen, select where you want to place the Pivot Table, select New Worksheet 13. Choose another cell if you do not want the current cell as the position on the worksheet
43 14. Select Layout The Pivot Table and Pivot Chart Wizard layout window appears 15. The column headings from the source data will now appear as fields on the right 16. Drag the fields to the relevant positions on the layout
44 17. Select OK 18. Select Options 19. Select your required options 20. Select OK 21. Select Finish The Pivot Table will be now be displayed
45 Remove, Add and Move fields When selecting a field from the data area to move or remove, you need to select the field by placing the mouse pointer on the border of the field and clicking when the pointer changes to the normal arrow pointer. Remove a Field Method 1. Select a Field and drag it outside of the Pivot Table area and drop it OR 1. Right click on a Field 2. Select Hide Add a Field Method 1. Select a Field from the Field List 2. Drag it into the Pivot Table area and drop it in the appropriate position OR 1. On the Pivot Table toolbar select Pivot Table 2. Pivot Table Wizard, select the Layout button 3. Drag the fields to the appropriate position OR 1. Select the Field in the Field List 2. From the drop down, select the Area you would like to add it to
46 GETTING SUPPORT Pastel Sales Pastel Training Pastel Evolution Sales Pastel Support 0861 EVOLUTION (386588) COVER (26837) Pastel Registrations Pastel Renewals Pastel Seminars Pastel International Pastel E-Business Pastel Payroll
47
Pastel Evolution BIC. Getting Started Guide
 Pastel Evolution BIC Getting Started Guide Table of Contents System Requirements... 4 How it Works... 5 Getting Started Guide... 6 Standard Reports Available... 6 Accessing the Pastel Evolution (BIC) Reports...
Getting Started Guide SAGE ACCPAC INTELLIGENCE
 Getting Started Guide SAGE ACCPAC INTELLIGENCE Table of Contents Introduction... 1 What is Sage Accpac Intelligence?... 1 What are the benefits of using Sage Accpac Intelligence?... 1 System Requirements...
Business Intelligence Getting Started Guide
 Business Intelligence Getting Started Guide 2013 Table of Contents Introduction... 1 Introduction... 1 What is Sage Business Intelligence?... 1 System Requirements... 2 Recommended System Requirements...
How To Create A Powerpoint Intelligence Report In A Pivot Table In A Powerpoints.Com
 Sage 500 ERP Intelligence Reporting Getting Started Guide 27.11.2012 Table of Contents 1.0 Getting started 3 2.0 Managing your reports 10 3.0 Defining report properties 18 4.0 Creating a simple PivotTable
MAS 500 Intelligence Tips and Tricks Booklet Vol. 1
 MAS 500 Intelligence Tips and Tricks Booklet Vol. 1 1 Contents Accessing the Sage MAS Intelligence Reports... 3 Copying, Pasting and Renaming Reports... 4 To create a new report from an existing report...
Simply Accounting Intelligence Tips and Tricks Booklet Vol. 1
 Simply Accounting Intelligence Tips and Tricks Booklet Vol. 1 1 Contents Accessing the SAI reports... 3 Running, Copying and Pasting reports... 4 Creating and linking a report... 5 Auto e-mailing reports...
Analyzing Excel Data Using Pivot Tables
 NDUS Training and Documentation Analyzing Excel Data Using Pivot Tables Pivot Tables are interactive worksheet tables you can use to quickly and easily summarize, organize, analyze, and compare large amounts
How To Create A Report In Excel
 Table of Contents Overview... 1 Smartlists with Export Solutions... 2 Smartlist Builder/Excel Reporter... 3 Analysis Cubes... 4 MS Query... 7 SQL Reporting Services... 10 MS Dynamics GP Report Templates...
Monthly Payroll to Finance Reconciliation Report: Access and Instructions
 Monthly Payroll to Finance Reconciliation Report: Access and Instructions VCU Reporting Center... 2 Log in... 2 Open Folder... 3 Other Useful Information: Copying Sheets... 5 Creating Subtotals... 5 Outlining
Tips and Tricks SAGE ACCPAC INTELLIGENCE
 Tips and Tricks SAGE ACCPAC INTELLIGENCE 1 Table of Contents Auto e-mailing reports... 4 Automatically Running Macros... 7 Creating new Macros from Excel... 8 Compact Metadata Functionality... 9 Copying,
CREATING EXCEL PIVOT TABLES AND PIVOT CHARTS FOR LIBRARY QUESTIONNAIRE RESULTS
 CREATING EXCEL PIVOT TABLES AND PIVOT CHARTS FOR LIBRARY QUESTIONNAIRE RESULTS An Excel Pivot Table is an interactive table that summarizes large amounts of data. It allows the user to view and manipulate
Produced by Flinders University Centre for Educational ICT. PivotTables Excel 2010
 Produced by Flinders University Centre for Educational ICT PivotTables Excel 2010 CONTENTS Layout... 1 The Ribbon Bar... 2 Minimising the Ribbon Bar... 2 The File Tab... 3 What the Commands and Buttons
Microsoft Excel 2007 Consolidate Data & Analyze with Pivot Table Windows XP
 Microsoft Excel 2007 Consolidate Data & Analyze with Pivot Table Windows XP Consolidate Data in Multiple Worksheets Example data is saved under Consolidation.xlsx workbook under ProductA through ProductD
Importing TSM Data into Microsoft Excel using Microsoft Query
 Importing TSM Data into Microsoft Excel using Microsoft Query An alternate way to report on TSM information is to use Microsoft Excel s import facilities using Microsoft Query to selectively import the
Using Delphi Data with Excel and Access
 $FDGHPLF&RPSXWLQJ &RPSXWHU 7UDLQLQJ 6XSSRUW 6HUYLFHV 1HWZRUNLQJ6HUYLFHV :HEHU%XLOGLQJ Using Delphi Data with Excel and Access Using Delphi Data The raw data used to create the CSU financial, human resource,
Search help. More on Office.com: images templates
 Page 1 of 14 Access 2010 Home > Access 2010 Help and How-to > Getting started Search help More on Office.com: images templates Access 2010: database tasks Here are some basic database tasks that you can
for Sage 100 ERP Business Insights Overview Document
 for Sage 100 ERP Business Insights Document 2012 Sage Software, Inc. All rights reserved. Sage Software, Sage Software logos, and the Sage Software product and service names mentioned herein are registered
Microsoft Access 2010 handout
 Microsoft Access 2010 handout Access 2010 is a relational database program you can use to create and manage large quantities of data. You can use Access to manage anything from a home inventory to a giant
Sage 300 ERP Intelligence Reporting Getting Started Guide. Debra Holder March 2014
 Sage 300 ERP Intelligence Reporting Getting Started Guide Debra Holder March 2014 Table of Contents Introduction... 1 Who Should Read This Guide... 1 About Sage Intelligence Reporting... 1 Benefits of
How to Create Your Own Crystal Report
 How to Create Your Own Crystal Report Step 1 Figure out what table you need to use for your report. Click on Resources, then File Layouts and Program Information. Click on File Layouts to see the available
Using Excel as a Management Reporting Tool with your Minotaur Data. Exercise 1 Customer Item Profitability Reporting Tool for Management
 Using Excel as a Management Reporting Tool with your Minotaur Data with Judith Kirkness These instruction sheets will help you learn: 1. How to export reports from Minotaur to Excel (these instructions
Release 2.1 of SAS Add-In for Microsoft Office Bringing Microsoft PowerPoint into the Mix ABSTRACT INTRODUCTION Data Access
 Release 2.1 of SAS Add-In for Microsoft Office Bringing Microsoft PowerPoint into the Mix Jennifer Clegg, SAS Institute Inc., Cary, NC Eric Hill, SAS Institute Inc., Cary, NC ABSTRACT Release 2.1 of SAS
Decision Support AITS University Administration. Web Intelligence Rich Client 4.1 User Guide
 Decision Support AITS University Administration Web Intelligence Rich Client 4.1 User Guide 2 P age Web Intelligence 4.1 User Guide Web Intelligence 4.1 User Guide Contents Getting Started in Web Intelligence
Table of Contents. Pg 2
 Table of Contents Hiding and Showing Reports 3 Debugging Reports 4 Date Formats 6 Selecting Dates in Report Parameters 7 Time Formats with Dates 8 Selecting Date and Times in Report Parameters 9 Add-In
EXCEL PIVOT TABLE David Geffen School of Medicine, UCLA Dean s Office Oct 2002
 EXCEL PIVOT TABLE David Geffen School of Medicine, UCLA Dean s Office Oct 2002 Table of Contents Part I Creating a Pivot Table Excel Database......3 What is a Pivot Table...... 3 Creating Pivot Tables
Frequently Asked Questions Sage Pastel Intelligence Reporting
 Frequently Asked Questions Sage Pastel Intelligence Reporting The software described in this document is protected by copyright, and may not be copied on any medium except as specifically authorized in
Microsoft Excel 2010 Pivot Tables
 Microsoft Excel 2010 Pivot Tables Email: [email protected] Web Page: http://training.health.ufl.edu Microsoft Excel 2010: Pivot Tables 1.5 hours Topics include data groupings, pivot tables, pivot
Sage Intelligence Financial Reporting for Sage ERP X3 Version 6.5 Installation Guide
 Sage Intelligence Financial Reporting for Sage ERP X3 Version 6.5 Installation Guide Table of Contents TABLE OF CONTENTS... 3 1.0 INTRODUCTION... 1 1.1 HOW TO USE THIS GUIDE... 1 1.2 TOPIC SUMMARY...
BAT Smart View for Budget Users. Miami-Dade County. BAT Smart View Training Activity Guide
 Miami-Dade County BAT Smart View Training Activity Guide 1 Table of Contents Activity 1: Launch Microsoft Excel, Check User Options and Use the Connection Panel.... 3 Activity 2: Opening BAT Web Forms
Task Force on Technology / EXCEL
 Task Force on Technology EXCEL Basic terminology Spreadsheet A spreadsheet is an electronic document that stores various types of data. There are vertical columns and horizontal rows. A cell is where the
Advanced Excel 10/20/2011 1
 Advanced Excel Data Validation Excel has a feature called Data Validation, which will allow you to control what kind of information is typed into cells. 1. Select the cell(s) you wish to control. 2. Click
Excel Database Management Microsoft Excel 2003
 Excel Database Management Microsoft Reference Guide University Technology Services Computer Training Copyright Notice Copyright 2003 EBook Publishing. All rights reserved. No part of this publication may
Create a PivotTable or PivotChart report
 Page 1 of 5 Excel Home > PivotTable reports and PivotChart reports > Basics Create or delete a PivotTable or PivotChart report Show All To analyze numerical data in depth and to answer unanticipated questions
Microsoft Access 2010 Overview of Basics
 Opening Screen Access 2010 launches with a window allowing you to: create a new database from a template; create a new template from scratch; or open an existing database. Open existing Templates Create
Microsoft Office Access 2007 which I refer to as Access throughout this book
 Chapter 1 Getting Started with Access In This Chapter What is a database? Opening Access Checking out the Access interface Exploring Office Online Finding help on Access topics Microsoft Office Access
Sage Intelligence Report Designer Add-In
 Sage Intelligence Report Designer Add-In Q: What is Sage Intelligence Reporting? A: Sage Intelligence Reporting helps you to easily control, automate and analyze your data to make better informed decision,
Business Insight Report Authoring Getting Started Guide
 Business Insight Report Authoring Getting Started Guide Version: 6.6 Written by: Product Documentation, R&D Date: February 2011 ImageNow and CaptureNow are registered trademarks of Perceptive Software,
CHAPTER 6: ANALYZE MICROSOFT DYNAMICS NAV 5.0 DATA IN MICROSOFT EXCEL
 Chapter 6: Analyze Microsoft Dynamics NAV 5.0 Data in Microsoft Excel CHAPTER 6: ANALYZE MICROSOFT DYNAMICS NAV 5.0 DATA IN MICROSOFT EXCEL Objectives The objectives are: Explain the process of exporting
Overview What is a PivotTable? Benefits
 Overview What is a PivotTable? Benefits Create a PivotTable Select Row & Column labels & Values Filtering & Sorting Calculations Data Details Refresh Data Design options Create a PivotChart Slicers Charts
Learn About Analysis, Interactive Reports, and Dashboards
 Learn About Analysis, Interactive Reports, and Dashboards This document supports Pentaho Business Analytics Suite 5.0 GA and Pentaho Data Integration 5.0 GA, documentation revision February 3, 2014, copyright
3 What s New in Excel 2007
 3 What s New in Excel 2007 3.1 Overview of Excel 2007 Microsoft Office Excel 2007 is a spreadsheet program that enables you to enter, manipulate, calculate, and chart data. An Excel file is referred to
Excel Dashboard. Scott Witteveen [email protected] (517) 323 7500
 323 7500") Excel Dashboard with Dynamics GP Excel Reports Scott Witteveen [email protected] (517) 323 7500 Creating an Excel Dashboard with Dynamics GP Excel Reports Step 1 Set up a new workbook Open Excel,
Excel Dashboard with Dynamics GP Excel Reports Scott Witteveen [email protected] (517) 323 7500 Creating an Excel Dashboard with Dynamics GP Excel Reports Step 1 Set up a new workbook Open Excel,
Introduction to Microsoft Access 2003
 Introduction to Microsoft Access 2003 Zhi Liu School of Information Fall/2006 Introduction and Objectives Microsoft Access 2003 is a powerful, yet easy to learn, relational database application for Microsoft
MS Excel: Analysing Data using Pivot Tables
 Centre for Learning and Academic Development (CLAD) Technology Skills Development Team MS Excel: Analysing Data using Pivot Tables www.intranet.birmingham.ac.uk/itskills MS Excel: Analysing Data using
Legal Notes. Regarding Trademarks. 2012 KYOCERA Document Solutions Inc.
 Legal Notes Unauthorized reproduction of all or part of this guide is prohibited. The information in this guide is subject to change without notice. We cannot be held liable for any problems arising from
Computer Training Centre University College Cork. Excel 2013 Pivot Tables
 Computer Training Centre University College Cork Excel 2013 Pivot Tables Table of Contents Pivot Tables... 1 Changing the Value Field Settings... 2 Refreshing the Data... 3 Refresh Data when opening a
BID2WIN Workshop. Advanced Report Writing
 BID2WIN Workshop Advanced Report Writing Please Note: Please feel free to take this workbook home with you! Electronic copies of all lab documentation are available for download at http://www.bid2win.com/userconf/2011/labs/
Excel 2007 - Using Pivot Tables
 Overview A PivotTable report is an interactive table that allows you to quickly group and summarise information from a data source. You can rearrange (or pivot) the table to display different perspectives
MICROSOFT OFFICE ACCESS 2007 - NEW FEATURES
 MICROSOFT OFFICE 2007 MICROSOFT OFFICE ACCESS 2007 - NEW FEATURES Exploring Access Creating and Working with Tables Finding and Filtering Data Working with Queries and Recordsets Working with Forms Working
Microsoft Query, the helper application included with Microsoft Office, allows
 3 RETRIEVING ISERIES DATA WITH MICROSOFT QUERY Microsoft Query, the helper application included with Microsoft Office, allows Office applications such as Word and Excel to read data from ODBC data sources.
User Guide. Analytics Desktop Document Number: 09619414
 User Guide Analytics Desktop Document Number: 09619414 CONTENTS Guide Overview Description of this guide... ix What s new in this guide...x 1. Getting Started with Analytics Desktop Introduction... 1
Create a New Database in Access 2010
 Create a New Database in Access 2010 Table of Contents OVERVIEW... 1 CREATING A DATABASE... 1 ADDING TO A DATABASE... 2 CREATE A DATABASE BY USING A TEMPLATE... 2 CREATE A DATABASE WITHOUT USING A TEMPLATE...
Pastel Evolution Business Intelligence Centre
 Get 12 ready-to-use reports that give you immediate insight into and across your business. Delivered in the familiar environment of Microsoft Excel, the reports are fully customisable, and flexible with
Working together with Word, Excel and PowerPoint
 Working together with Word, Excel and PowerPoint Have you ever wanted your Word document to include data from an Excel spreadsheet, or diagrams you ve created in PowerPoint? This note shows you how to
Create an Excel BI report and share on SharePoint 2013
 2013 Create an Excel BI report and share on SharePoint 2013 Hands-On Lab Lab Manual This document is provided as-is. Information and views expressed in this document, including URL and other Internet Web
Analyzing Data Using Excel
 Analyzing Data Using Excel What you will do: Create a spreadsheet Use formulas and basic formatting Import text files Save worksheets as web pages Add interactivity to web worksheets Use pivot tables Create
Instructions for Creating an Outlook E-mail Distribution List from an Excel File
 Instructions for Creating an Outlook E-mail Distribution List from an Excel File 1.0 Importing Excel Data to an Outlook Distribution List 1.1 Create an Outlook Personal Folders File (.pst) Notes: 1) If
warpct.com Working with MS Excel 2003 Workbook courseware by WARP! Computer Training
 warpct.com courseware by WARP! Computer Training Working with MS Excel 2003 Workbook Welcome! Thank you for evaluating a portion of this workbook. If you have any questions or comments regarding our training
Excel 2010: Create your first spreadsheet
 Excel 2010: Create your first spreadsheet Goals: After completing this course you will be able to: Create a new spreadsheet. Add, subtract, multiply, and divide in a spreadsheet. Enter and format column
Excel PivotTables Basics and Beyond
 Excel PivotTables Basics and Beyond Improving Productivity with Excel s Most Powerful Feature L. A. McClelland K2 Enterprises Introduction to PivotTables PivotTables are the most powerful feature of Excel,
Word 2010: Mail Merge to Email with Attachments
 Word 2010: Mail Merge to Email with Attachments Table of Contents TO SEE THE SECTION FOR MACROS, YOU MUST TURN ON THE DEVELOPER TAB:... 2 SET REFERENCE IN VISUAL BASIC:... 2 CREATE THE MACRO TO USE WITHIN
DataPA OpenAnalytics End User Training
 DataPA OpenAnalytics End User Training DataPA End User Training Lesson 1 Course Overview DataPA Chapter 1 Course Overview Introduction This course covers the skills required to use DataPA OpenAnalytics
Basic Pivot Tables. To begin your pivot table, choose Data, Pivot Table and Pivot Chart Report. 1 of 18
 Basic Pivot Tables Pivot tables summarize data in a quick and easy way. In your job, you could use pivot tables to summarize actual expenses by fund type by object or total amounts. Make sure you do not
FileMaker Pro and Microsoft Office Integration
 FileMaker Pro and Microsoft Office Integration page Table of Contents Executive Summary...3 Introduction...3 Top Reasons to Read This Guide...3 Before You Get Started...4 Downloading the FileMaker Trial
How to Excel with CUFS Part 2 Excel 2010
 How to Excel with CUFS Part 2 Excel 2010 Course Manual Finance Training Contents 1. Working with multiple worksheets 1.1 Inserting new worksheets 3 1.2 Deleting sheets 3 1.3 Moving and copying Excel worksheets
EXCEL FINANCIAL USES
 EXCEL FINANCIAL USES Table of Contents Page LESSON 1: FINANCIAL DOCUMENTS...1 Worksheet Design...1 Selecting a Template...2 Adding Data to a Template...3 Modifying Templates...3 Saving a New Workbook as
MicroStrategy Desktop
 MicroStrategy Desktop Quick Start Guide MicroStrategy Desktop is designed to enable business professionals like you to explore data, simply and without needing direct support from IT. 1 Import data from
Creating tables in Microsoft Access 2007
 Platform: Windows PC Ref no: USER 164 Date: 25 th October 2007 Version: 1 Authors: D.R.Sheward, C.L.Napier Creating tables in Microsoft Access 2007 The aim of this guide is to provide information on using
CONTACTS SYNCHRONIZER FOR IPAD USER GUIDE
 User Guide CONTACTS SYNCHRONIZER FOR IPAD USER GUIDE Product Version: 1.0 CONTENTS 1. INTRODUCTION...4 2. INSTALLATION...5 2.1 DESKTOP INSTALLATION...5 2.2 IPAD INSTALLATION...9 3. USING THE CONTACTS SYNCHRONIZER
Pivot Tables & Pivot Charts
 Pivot Tables & Pivot Charts Pivot tables... 2 Creating pivot table using the wizard...2 The pivot table toolbar...5 Analysing data in a pivot table...5 Pivot Charts... 6 Creating a pivot chart using the
Lesson 07: MS ACCESS - Handout. Introduction to database (30 mins)
") Lesson 07: MS ACCESS - Handout Handout Introduction to database (30 mins) Microsoft Access is a database application. A database is a collection of related information put together in database objects.
Lesson 07: MS ACCESS - Handout Handout Introduction to database (30 mins) Microsoft Access is a database application. A database is a collection of related information put together in database objects.
Excel Reports and Macros
 Excel Reports and Macros Within Microsoft Excel it is possible to create a macro. This is a set of commands that Excel follows to automatically make certain changes to data in a spreadsheet. By adding
Excel 2003 Tutorial I
 This tutorial was adapted from a tutorial by see its complete version at http://www.fgcu.edu/support/office2000/excel/index.html Excel 2003 Tutorial I Spreadsheet Basics Screen Layout Title bar Menu bar
Reporting Tips and Tricks
 Chapter 16 Reporting Tips and Tricks Intuit Statement Writer New for 2009! Company Snapshot New for 2009! Using the Report Center Reporting Preferences Modifying Reports Report Groups Memorized Reports
Almyta Control System Advanced Reference Contents
 Almyta Control System Advanced Reference Contents Almyta Control System Advanced Reference... 1 Software Maintenance... 2 Sharing Your Local Company with Other Users. Networked Installation.... 5 Connecting
Business Objects 4.1 Quick User Guide
 Business Objects 4.1 Quick User Guide Log into SCEIS Business Objects (BOBJ) 1. https://sceisreporting.sc.gov 2. Choose Windows AD for Authentication. 3. Enter your SCEIS User Name and Password: Home Screen
NETWORK PRINT MONITOR User Guide
 NETWORK PRINT MONITOR User Guide Legal Notes Unauthorized reproduction of all or part of this guide is prohibited. The information in this guide is subject to change without notice. We cannot be held liable
Build Your First Web-based Report Using the SAS 9.2 Business Intelligence Clients
 Technical Paper Build Your First Web-based Report Using the SAS 9.2 Business Intelligence Clients A practical introduction to SAS Information Map Studio and SAS Web Report Studio for new and experienced
Microsoft Office Access 2007 Basics
 Access(ing) A Database Project PRESENTED BY THE TECHNOLOGY TRAINERS OF THE MONROE COUNTY LIBRARY SYSTEM EMAIL: [email protected] MONROE COUNTY LIBRARY SYSTEM 734-241-5770 1 840 SOUTH ROESSLER
Excel 2013 - Using Pivot Tables
 Overview A PivotTable report is an interactive table that allows you to quickly group and summarise information from a data source. You can rearrange (or pivot) the table to display different perspectives
HRS 750: UDW+ Ad Hoc Reports Training 2015 Version 1.1
 HRS 750: UDW+ Ad Hoc Reports Training 2015 Version 1.1 Program Services Office & Decision Support Group Table of Contents Create New Analysis... 4 Criteria Tab... 5 Key Fact (Measurement) and Dimension
Advanced Excel Charts : Tables : Pivots : Macros
 Advanced Excel Charts : Tables : Pivots : Macros Charts In Excel, charts are a great way to visualize your data. However, it is always good to remember some charts are not meant to display particular types
Outlook Tips & Tricks. Training For Current & New Employees
 Outlook Tips & Tricks Training For Current & New Employees The workshop will help build the necessary skills needed to begin using Microsoft Outlook 2010. The participant will learn how to create e-mail
Creating a Patch Management Dashboard with IT Analytics Hands-On Lab
 Creating a Patch Management Dashboard with IT Analytics Hands-On Lab Description This lab provides a hands-on overview of the IT Analytics Solution. Students will learn how to browse cubes and configure
STATEMENT OF TRANSACTION REPORT ANALYSIS USING EXCEL
 STATEMENT OF TRANSACTION REPORT ANALYSIS USING EXCEL Excel can be used to analyze the MCPS Statement of Transaction EXCEL Report Selected Fields to more easily track expenses through the procurement cycle.
Business Explorer (BEx)
") SAP Business Warehouse/Business Intelligence Reporting Business Explorer (BEx) Washington State HRMS Business Warehouse/Business Intelligence (BW/BI) BW/BI Power User Workshop Materials General Topics
SAP Business Warehouse/Business Intelligence Reporting Business Explorer (BEx) Washington State HRMS Business Warehouse/Business Intelligence (BW/BI) BW/BI Power User Workshop Materials General Topics
Microsoft Excel 2010. Understanding the Basics
 Microsoft Excel 2010 Understanding the Basics Table of Contents Opening Excel 2010 2 Components of Excel 2 The Ribbon 3 o Contextual Tabs 3 o Dialog Box Launcher 4 o Quick Access Toolbar 4 Key Tips 5 The
A Quick Tour of F9 1
 A Quick Tour of F9 1 Table of Contents I. A Quick Tour of F9... 3 1. Getting Started... 3 2. Quick Trial Balance... 7 3. A More Dynamic Table Report... 10 II. The Fundamental F9 Formula... 14 The GL Formula...
The Microsoft Access 2007 Screen
 1 of 1 Office Button The Microsoft Access 2007 Screen Title Bar Help Ribbon Quick Access Toolbar Database Components Active Component NOTE: THIS HELP DOCUMENT EXPLAINS THE LAYOUT OF ACCESS. FOR MORE INFORMATION
An Introduction to Excel Pivot Tables
 An Introduction to Excel Pivot Tables EXCEL REVIEW 2001-2002 This brief introduction to Excel Pivot Tables addresses the English version of MS Excel 2000. Microsoft revised the Pivot Tables feature with
A Beginning Guide to the Excel 2007 Pivot Table
 A Beginning Guide to the Excel 2007 Pivot Table Paula Ecklund Summer 2008 Page 1 Contents I. What is a Pivot Table?...1 II. Basic Excel 2007 Pivot Table Creation Source data requirements...2 Pivot Table
To complete this workbook, you will need the following file:
 CHAPTER 4 Excel More Skills 13 Create PivotTable Reports A PivotTable report is an interactive, crosstabulated Excel report that summarizes and analyzes data such as database records from various sources,
TIBCO Spotfire Business Author Essentials Quick Reference Guide. Table of contents:
 Table of contents: Access Data for Analysis Data file types Format assumptions Data from Excel Information links Add multiple data tables Create & Interpret Visualizations Table Pie Chart Cross Table Treemap
Census Data with Tableau Public
 Census Data with Tableau Public Before you begin, download the template at http://public.tableausoftware.com/views/census-template/dashboard?:embed=yes&:toolbar=yes&:tabs=no Get your data together 1. Gather
Creating and Using Databases with Microsoft Access
 CHAPTER A Creating and Using Databases with Microsoft Access In this chapter, you will Use Access to explore a simple database Design and create a new database Create and use forms Create and use queries
Database Concepts (3 rd Edition) APPENDIX D Getting Started with Microsoft Access 2007
 APPENDIX D Getting Started with Microsoft Access 2007") David M. Kroenke and David J. Auer Database Concepts (3 rd Edition) APPENDIX D Getting Started with Microsoft Access 2007 Prepared by David J. Auer Western Washington University Page D-1 Microsoft product
David M. Kroenke and David J. Auer Database Concepts (3 rd Edition) APPENDIX D Getting Started with Microsoft Access 2007 Prepared by David J. Auer Western Washington University Page D-1 Microsoft product
Sage ERP MAS. Everything you want to know about Sage ERP MAS Intelligence. What is Sage ERP MAS Intelligence? benefits
 Sage ERP MAS Everything you want to know about Sage ERP MAS Intelligence What is Sage ERP MAS Intelligence? Sage ERP MAS Intelligence (or Intelligence) empowers managers to quickly and easily obtain operations
Release Document Version: 1.4-2013-05-30. User Guide: SAP BusinessObjects Analysis, edition for Microsoft Office
 Release Document Version: 1.4-2013-05-30 User Guide: SAP BusinessObjects Analysis, edition for Microsoft Office Table of Contents 1 About this guide....6 1.1 Who should read this guide?....6 1.2 User profiles....6
Microsoft Access 2010 Part 1: Introduction to Access
 CALIFORNIA STATE UNIVERSITY, LOS ANGELES INFORMATION TECHNOLOGY SERVICES Microsoft Access 2010 Part 1: Introduction to Access Fall 2014, Version 1.2 Table of Contents Introduction...3 Starting Access...3
BI 4.1 Quick Start Java User s Guide
 BI 4.1 Quick Start Java User s Guide BI 4.1 Quick Start Guide... 1 Introduction... 4 Logging in... 4 Home Screen... 5 Documents... 6 Preferences... 8 Web Intelligence... 12 Create a New Web Intelligence