Stat 412/512 CASE INFLUENCE STATISTICS. Charlotte Wickham. stat512.cwick.co.nz. Feb
|
|
|
- Bertha Booth
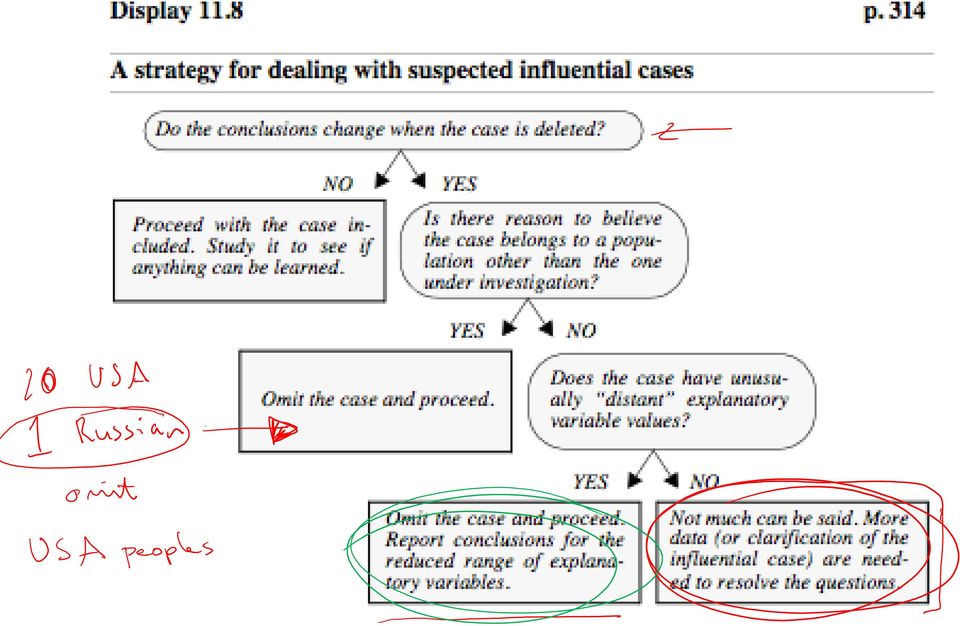
- 10 years ago
- Views:
Transcription
1 Stat 412/512 CASE INFLUENCE STATISTICS Feb Charlotte Wickham stat512.cwick.co.nz

2 Regression in your field See website. You may complete this assignment in pairs. Find a journal article in your field of study (or a field of interest) that uses multiple linear regression to answer their question of interest. Write a one page report that includes: a citation to the article a brief summary of the background of the problem and their question of interest a full specification of their regression model (i.e. full β form) defining all the variables included a statement about how their question of interest translates into questions about parameters in their regression model a summary of the results they report Due Feb 27th
 defining all the variables included a statement about how their question of interest translates into")
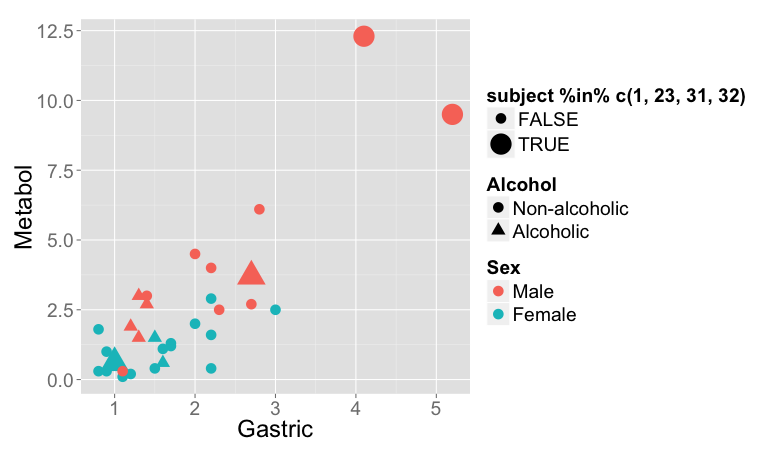
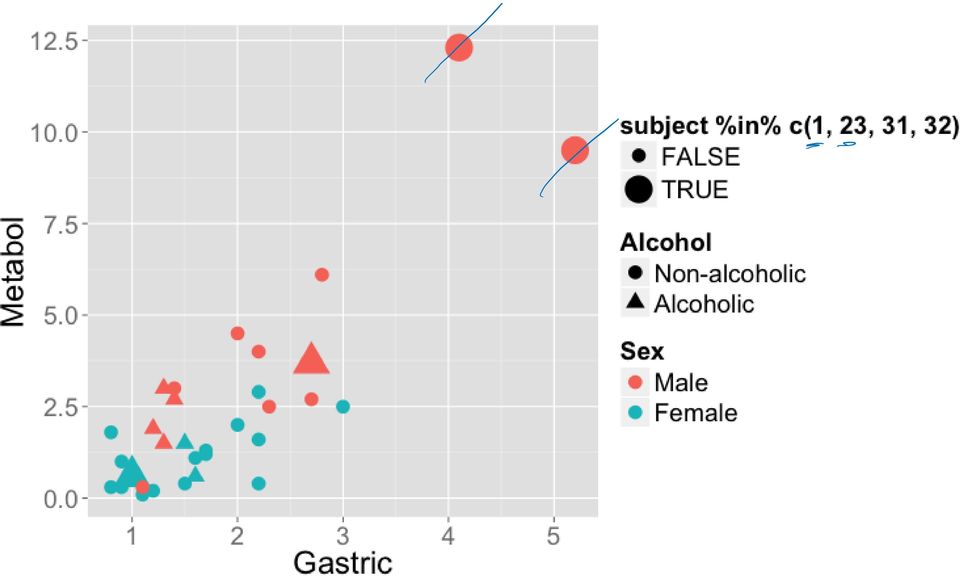
3 Case Alcohol Metabolism Women get drunk quicker than men. Women also develop alcohol related liver disease more readily. Theory: a particular enzyme responsible for alcohol metabolism in the stomach is more active in men. "first pass metabolism" = alcohol metabolized in the stomach so it doesn't reach the bloodstream To determine first pass metabolism, compare blood alcohol levels after drinking to after intravenous alcohol. Also measure enzyme activity.

4 { First pass metabolism gast, female, alcoholic} = gast + female + alcoholic + female x alcoholic + gast x female + gast x alcoholic + gast x female x alcoholic

5 Outliers Least squares estimates are not resistant to outliers. Identify outliers early on, so you don't end up tailoring the model to to fit a few unusual observations. An observation is said to be influential if the fitted model depends unduly on its value. For example, removing it: changes the estimate of parameters greatly, changes conclusions, or changes which terms are included in the model.

6
7 with 31 & 32 Coefficients: Estimate Std. Error t value Pr(> t ) (Intercept) Gastric e-07 *** SexFemale AlcoholAlcoholic Gastric:SexFemale * Gastric:AlcoholAlcoholic SexFemale:AlcoholAlcoholic Gastric:SexFemale:AlcoholAlcoholic without 31 & 32 Coefficients: Estimate Std. Error t value Pr(> t ) (Intercept) Gastric ** SexFemale AlcoholAlcoholic Gastric:SexFemale Gastric:AlcoholAlcoholic SexFemale:AlcoholAlcoholic Gastric:SexFemale:AlcoholAlcoholic

8 Whether we have evidence males and females have different slopes depends heavily on if observations 31 and 32 are included. Safe option, drop 31 & 32 and only make inferences for people with a Gastric AD activity level < 3

9 Case influence statistics Case influence statistics help identify observations that may be influential. Sometimes influential observations won't show up in our usual plots.

10 Leverage Case influence statistics Measures the distance of the observation from the average explanatory values (taking correlation into account). High leverage = unusual combination of explanatory values = possibility to be influential. Studentized residuals The residual divided by its expected variation. High residual = observation far from fitted line. Cook's distance a number for every observation The effect on estimated parameters when the observation is dropped out. High Cook s distance = influential on parameter estimates. you don't need to know the formulas use them together to understand influential points

11 High Cook's distance, means point changes regression estimates High leverage, means point has potential to be influential High studentized residual, means point is unusual compared to the modelled mean.

12 Your turn Which would you expect to be large for observations 31 & 32?


13 Sleuth fits a different model

14
15 Next step: Find a simple, good fitting model. You can test whether terms are necessary with F-tests. Generally, if you think something is important, leave it in whether it is significant or not. Some people say (and I agree): if it was important enough for you to think about including it, leave it in. Be careful about interpreting individual t-tests, especially if it involves a term that is elsewhere in the model.

16 Case Alcohol Metabolism Not many alcoholics, and an extra sum of square F-test with reduced model: μ{ First pass metabolism gast, female, alcoholic} = gast + female + gast x female has a p-value of So, use this reduced model, i.e. no effect of alcoholism.

17 Coefficients: Estimate Std. Error t value Pr(> t ) (Intercept) Gastric *** SexFemale Gastric:SexFemale No evidence of different intercepts, if different slopes are in the model. No evidence of different slopes, if different intercepts are in the model. Here: a multiplicative rather than additive difference makes more sense, both having the same zero intercept makes sense, μ{ First pass metabolism gast, female, alcoholic} = β1gast + β2gast x female

18 Estimate Std. Error t value Pr(> t ) Gastric e-13 *** Gastric:SexFemale e-05 *** "Males had a higher first-pass metabolism than females even after accounting for differences in gastric AD activity (two-sided p-value = for a t-test for equality of male and female slopes when both intercepts are zero.) For a given level of gastric AD activity the mean first-pass metabolism for men is estimated to be 2.20 times as large as the mean first-pass alcohol metabolism for women." a different way to interpret a difference in slopes, but only if there are no intercepts.
 For a given level of gastric AD activity the mean first-pass metabolism for men is estimated to be 2.")
Chapter 7: Simple linear regression Learning Objectives
 Chapter 7: Simple linear regression Learning Objectives Reading: Section 7.1 of OpenIntro Statistics Video: Correlation vs. causation, YouTube (2:19) Video: Intro to Linear Regression, YouTube (5:18) -
Multiple Linear Regression
 Multiple Linear Regression A regression with two or more explanatory variables is called a multiple regression. Rather than modeling the mean response as a straight line, as in simple regression, it is
1. What is the critical value for this 95% confidence interval? CV = z.025 = invnorm(0.025) = 1.96
 = 1.96") 1 Final Review 2 Review 2.1 CI 1-propZint Scenario 1 A TV manufacturer claims in its warranty brochure that in the past not more than 10 percent of its TV sets needed any repair during the first two years
1 Final Review 2 Review 2.1 CI 1-propZint Scenario 1 A TV manufacturer claims in its warranty brochure that in the past not more than 10 percent of its TV sets needed any repair during the first two years
Chapter 23. Inferences for Regression
 Chapter 23. Inferences for Regression Topics covered in this chapter: Simple Linear Regression Simple Linear Regression Example 23.1: Crying and IQ The Problem: Infants who cry easily may be more easily
Linear Regression. Chapter 5. Prediction via Regression Line Number of new birds and Percent returning. Least Squares
 Linear Regression Chapter 5 Regression Objective: To quantify the linear relationship between an explanatory variable (x) and response variable (y). We can then predict the average response for all subjects
Using R for Linear Regression
 Using R for Linear Regression In the following handout words and symbols in bold are R functions and words and symbols in italics are entries supplied by the user; underlined words and symbols are optional
Chapter 13 Introduction to Linear Regression and Correlation Analysis
 Chapter 3 Student Lecture Notes 3- Chapter 3 Introduction to Linear Regression and Correlation Analsis Fall 2006 Fundamentals of Business Statistics Chapter Goals To understand the methods for displaing
Comparing Nested Models
 Comparing Nested Models ST 430/514 Two models are nested if one model contains all the terms of the other, and at least one additional term. The larger model is the complete (or full) model, and the smaller
11. Analysis of Case-control Studies Logistic Regression
 Research methods II 113 11. Analysis of Case-control Studies Logistic Regression This chapter builds upon and further develops the concepts and strategies described in Ch.6 of Mother and Child Health:
Example: Boats and Manatees
 Figure 9-6 Example: Boats and Manatees Slide 1 Given the sample data in Table 9-1, find the value of the linear correlation coefficient r, then refer to Table A-6 to determine whether there is a significant
Section 14 Simple Linear Regression: Introduction to Least Squares Regression
 Slide 1 Section 14 Simple Linear Regression: Introduction to Least Squares Regression There are several different measures of statistical association used for understanding the quantitative relationship
Basic Statistics and Data Analysis for Health Researchers from Foreign Countries
 Basic Statistics and Data Analysis for Health Researchers from Foreign Countries Volkert Siersma [email protected] The Research Unit for General Practice in Copenhagen Dias 1 Content Quantifying association
EDUCATION AND VOCABULARY MULTIPLE REGRESSION IN ACTION
 EDUCATION AND VOCABULARY MULTIPLE REGRESSION IN ACTION EDUCATION AND VOCABULARY 5-10 hours of input weekly is enough to pick up a new language (Schiff & Myers, 1988). Dutch children spend 5.5 hours/day
Unit 31 A Hypothesis Test about Correlation and Slope in a Simple Linear Regression
 Unit 31 A Hypothesis Test about Correlation and Slope in a Simple Linear Regression Objectives: To perform a hypothesis test concerning the slope of a least squares line To recognize that testing for a
Multiple Regression in SPSS This example shows you how to perform multiple regression. The basic command is regression : linear.
 Multiple Regression in SPSS This example shows you how to perform multiple regression. The basic command is regression : linear. In the main dialog box, input the dependent variable and several predictors.
DEPARTMENT OF PSYCHOLOGY UNIVERSITY OF LANCASTER MSC IN PSYCHOLOGICAL RESEARCH METHODS ANALYSING AND INTERPRETING DATA 2 PART 1 WEEK 9
 DEPARTMENT OF PSYCHOLOGY UNIVERSITY OF LANCASTER MSC IN PSYCHOLOGICAL RESEARCH METHODS ANALYSING AND INTERPRETING DATA 2 PART 1 WEEK 9 Analysis of covariance and multiple regression So far in this course,
SPSS Guide: Regression Analysis
 SPSS Guide: Regression Analysis I put this together to give you a step-by-step guide for replicating what we did in the computer lab. It should help you run the tests we covered. The best way to get familiar
Exercise 1.12 (Pg. 22-23)
") Individuals: The objects that are described by a set of data. They may be people, animals, things, etc. (Also referred to as Cases or Records) Variables: The characteristics recorded about each individual.
Individuals: The objects that are described by a set of data. They may be people, animals, things, etc. (Also referred to as Cases or Records) Variables: The characteristics recorded about each individual.
Premaster Statistics Tutorial 4 Full solutions
 Premaster Statistics Tutorial 4 Full solutions Regression analysis Q1 (based on Doane & Seward, 4/E, 12.7) a. Interpret the slope of the fitted regression = 125,000 + 150. b. What is the prediction for
5. Linear Regression
 5. Linear Regression Outline.................................................................... 2 Simple linear regression 3 Linear model............................................................. 4
Module 5: Multiple Regression Analysis
 Using Statistical Data Using to Make Statistical Decisions: Data Multiple to Make Regression Decisions Analysis Page 1 Module 5: Multiple Regression Analysis Tom Ilvento, University of Delaware, College
MULTIPLE CHOICE. Choose the one alternative that best completes the statement or answers the question.
 Module 7 Test Name MULTIPLE CHOICE. Choose the one alternative that best completes the statement or answers the question. You are given information about a straight line. Use two points to graph the equation.
Statistical Models in R
 Statistical Models in R Some Examples Steven Buechler Department of Mathematics 276B Hurley Hall; 1-6233 Fall, 2007 Outline Statistical Models Linear Models in R Regression Regression analysis is the appropriate
STAT 350 Practice Final Exam Solution (Spring 2015)
") PART 1: Multiple Choice Questions: 1) A study was conducted to compare five different training programs for improving endurance. Forty subjects were randomly divided into five groups of eight subjects
PART 1: Multiple Choice Questions: 1) A study was conducted to compare five different training programs for improving endurance. Forty subjects were randomly divided into five groups of eight subjects
2. Simple Linear Regression
 Research methods - II 3 2. Simple Linear Regression Simple linear regression is a technique in parametric statistics that is commonly used for analyzing mean response of a variable Y which changes according
Part 2: Analysis of Relationship Between Two Variables
 Part 2: Analysis of Relationship Between Two Variables Linear Regression Linear correlation Significance Tests Multiple regression Linear Regression Y = a X + b Dependent Variable Independent Variable
X X X a) perfect linear correlation b) no correlation c) positive correlation (r = 1) (r = 0) (0 < r < 1)
 perfect linear correlation b) no correlation c) positive correlation (r = 1) (r = 0) (0 < r < 1)") CORRELATION AND REGRESSION / 47 CHAPTER EIGHT CORRELATION AND REGRESSION Correlation and regression are statistical methods that are commonly used in the medical literature to compare two or more variables.
CORRELATION AND REGRESSION / 47 CHAPTER EIGHT CORRELATION AND REGRESSION Correlation and regression are statistical methods that are commonly used in the medical literature to compare two or more variables.
CHAPTER 13 SIMPLE LINEAR REGRESSION. Opening Example. Simple Regression. Linear Regression
 Opening Example CHAPTER 13 SIMPLE LINEAR REGREION SIMPLE LINEAR REGREION! Simple Regression! Linear Regression Simple Regression Definition A regression model is a mathematical equation that descries the
Simple linear regression
 Simple linear regression Introduction Simple linear regression is a statistical method for obtaining a formula to predict values of one variable from another where there is a causal relationship between
Univariate Regression
 Univariate Regression Correlation and Regression The regression line summarizes the linear relationship between 2 variables Correlation coefficient, r, measures strength of relationship: the closer r is
Simple Linear Regression Inference
 Simple Linear Regression Inference 1 Inference requirements The Normality assumption of the stochastic term e is needed for inference even if it is not a OLS requirement. Therefore we have: Interpretation
Stat 5303 (Oehlert): Tukey One Degree of Freedom 1
: Tukey One Degree of Freedom 1") Stat 5303 (Oehlert): Tukey One Degree of Freedom 1 > catch
Stat 5303 (Oehlert): Tukey One Degree of Freedom 1 > catch
17. SIMPLE LINEAR REGRESSION II
 17. SIMPLE LINEAR REGRESSION II The Model In linear regression analysis, we assume that the relationship between X and Y is linear. This does not mean, however, that Y can be perfectly predicted from X.
Simple Predictive Analytics Curtis Seare
 Using Excel to Solve Business Problems: Simple Predictive Analytics Curtis Seare Copyright: Vault Analytics July 2010 Contents Section I: Background Information Why use Predictive Analytics? How to use
Correlation and Regression
 Correlation and Regression Scatterplots Correlation Explanatory and response variables Simple linear regression General Principles of Data Analysis First plot the data, then add numerical summaries Look
5. Multiple regression
 5. Multiple regression QBUS6840 Predictive Analytics https://www.otexts.org/fpp/5 QBUS6840 Predictive Analytics 5. Multiple regression 2/39 Outline Introduction to multiple linear regression Some useful
Chapter 10. Key Ideas Correlation, Correlation Coefficient (r),
,") Chapter 0 Key Ideas Correlation, Correlation Coefficient (r), Section 0-: Overview We have already explored the basics of describing single variable data sets. However, when two quantitative variables
Chapter 0 Key Ideas Correlation, Correlation Coefficient (r), Section 0-: Overview We have already explored the basics of describing single variable data sets. However, when two quantitative variables
General Method: Difference of Means. 3. Calculate df: either Welch-Satterthwaite formula or simpler df = min(n 1, n 2 ) 1.
 1.") General Method: Difference of Means 1. Calculate x 1, x 2, SE 1, SE 2. 2. Combined SE = SE1 2 + SE2 2. ASSUMES INDEPENDENT SAMPLES. 3. Calculate df: either Welch-Satterthwaite formula or simpler df = min(n
General Method: Difference of Means 1. Calculate x 1, x 2, SE 1, SE 2. 2. Combined SE = SE1 2 + SE2 2. ASSUMES INDEPENDENT SAMPLES. 3. Calculate df: either Welch-Satterthwaite formula or simpler df = min(n
The importance of graphing the data: Anscombe s regression examples
 The importance of graphing the data: Anscombe s regression examples Bruce Weaver Northern Health Research Conference Nipissing University, North Bay May 30-31, 2008 B. Weaver, NHRC 2008 1 The Objective
Answer: C. The strength of a correlation does not change if units change by a linear transformation such as: Fahrenheit = 32 + (5/9) * Centigrade
 * Centigrade") Statistics Quiz Correlation and Regression -- ANSWERS 1. Temperature and air pollution are known to be correlated. We collect data from two laboratories, in Boston and Montreal. Boston makes their measurements
Statistics Quiz Correlation and Regression -- ANSWERS 1. Temperature and air pollution are known to be correlated. We collect data from two laboratories, in Boston and Montreal. Boston makes their measurements
Interaction between quantitative predictors
 Interaction between quantitative predictors In a first-order model like the ones we have discussed, the association between E(y) and a predictor x j does not depend on the value of the other predictors
We extended the additive model in two variables to the interaction model by adding a third term to the equation.
 Quadratic Models We extended the additive model in two variables to the interaction model by adding a third term to the equation. Similarly, we can extend the linear model in one variable to the quadratic
Outline. Topic 4 - Analysis of Variance Approach to Regression. Partitioning Sums of Squares. Total Sum of Squares. Partitioning sums of squares
 Topic 4 - Analysis of Variance Approach to Regression Outline Partitioning sums of squares Degrees of freedom Expected mean squares General linear test - Fall 2013 R 2 and the coefficient of correlation
Copyright 2007 by Laura Schultz. All rights reserved. Page 1 of 5
 Using Your TI-83/84 Calculator: Linear Correlation and Regression Elementary Statistics Dr. Laura Schultz This handout describes how to use your calculator for various linear correlation and regression
Course Objective This course is designed to give you a basic understanding of how to run regressions in SPSS.
 SPSS Regressions Social Science Research Lab American University, Washington, D.C. Web. www.american.edu/provost/ctrl/pclabs.cfm Tel. x3862 Email. [email protected] Course Objective This course is designed
Regression Analysis: A Complete Example
 Regression Analysis: A Complete Example This section works out an example that includes all the topics we have discussed so far in this chapter. A complete example of regression analysis. PhotoDisc, Inc./Getty
Lecture 5: Model Checking. Prof. Sharyn O Halloran Sustainable Development U9611 Econometrics II
 Lecture 5: Model Checking Prof. Sharyn O Halloran Sustainable Development U9611 Econometrics II Regression Diagnostics Unusual and Influential Data Outliers Leverage Influence Heterosckedasticity Non-constant
Principles of Hypothesis Testing for Public Health
 Principles of Hypothesis Testing for Public Health Laura Lee Johnson, Ph.D. Statistician National Center for Complementary and Alternative Medicine [email protected] Fall 2011 Answers to Questions
MTH 140 Statistics Videos
 MTH 140 Statistics Videos Chapter 1 Picturing Distributions with Graphs Individuals and Variables Categorical Variables: Pie Charts and Bar Graphs Categorical Variables: Pie Charts and Bar Graphs Quantitative
Predictor Coef StDev T P Constant 970667056 616256122 1.58 0.154 X 0.00293 0.06163 0.05 0.963. S = 0.5597 R-Sq = 0.0% R-Sq(adj) = 0.
 = 0.") Statistical analysis using Microsoft Excel Microsoft Excel spreadsheets have become somewhat of a standard for data storage, at least for smaller data sets. This, along with the program often being packaged
Statistical analysis using Microsoft Excel Microsoft Excel spreadsheets have become somewhat of a standard for data storage, at least for smaller data sets. This, along with the program often being packaged
Testing for Lack of Fit
 Chapter 6 Testing for Lack of Fit How can we tell if a model fits the data? If the model is correct then ˆσ 2 should be an unbiased estimate of σ 2. If we have a model which is not complex enough to fit
Chapter 7: Dummy variable regression
 Chapter 7: Dummy variable regression Why include a qualitative independent variable?........................................ 2 Simplest model 3 Simplest case.............................................................
Logs Transformation in a Regression Equation
 Fall, 2001 1 Logs as the Predictor Logs Transformation in a Regression Equation The interpretation of the slope and intercept in a regression change when the predictor (X) is put on a log scale. In this

Correlation and Simple Linear Regression
 Correlation and Simple Linear Regression We are often interested in studying the relationship among variables to determine whether they are associated with one another. When we think that changes in a
MULTIPLE REGRESSION EXAMPLE
 MULTIPLE REGRESSION EXAMPLE For a sample of n = 166 college students, the following variables were measured: Y = height X 1 = mother s height ( momheight ) X 2 = father s height ( dadheight ) X 3 = 1 if
Data Analysis Tools. Tools for Summarizing Data
 Data Analysis Tools This section of the notes is meant to introduce you to many of the tools that are provided by Excel under the Tools/Data Analysis menu item. If your computer does not have that tool
2013 MBA Jump Start Program. Statistics Module Part 3
 2013 MBA Jump Start Program Module 1: Statistics Thomas Gilbert Part 3 Statistics Module Part 3 Hypothesis Testing (Inference) Regressions 2 1 Making an Investment Decision A researcher in your firm just
Bill Burton Albert Einstein College of Medicine [email protected] April 28, 2014 EERS: Managing the Tension Between Rigor and Resources 1
 Bill Burton Albert Einstein College of Medicine [email protected] April 28, 2014 EERS: Managing the Tension Between Rigor and Resources 1 Calculate counts, means, and standard deviations Produce
Forecasting in STATA: Tools and Tricks
 Forecasting in STATA: Tools and Tricks Introduction This manual is intended to be a reference guide for time series forecasting in STATA. It will be updated periodically during the semester, and will be
Multivariate Logistic Regression
 1 Multivariate Logistic Regression As in univariate logistic regression, let π(x) represent the probability of an event that depends on p covariates or independent variables. Then, using an inv.logit formulation
Factors affecting online sales
 Factors affecting online sales Table of contents Summary... 1 Research questions... 1 The dataset... 2 Descriptive statistics: The exploratory stage... 3 Confidence intervals... 4 Hypothesis tests... 4
ch12 practice test SHORT ANSWER. Write the word or phrase that best completes each statement or answers the question.
 ch12 practice test 1) The null hypothesis that x and y are is H0: = 0. 1) 2) When a two-sided significance test about a population slope has a P-value below 0.05, the 95% confidence interval for A) does
Logistic Regression (a type of Generalized Linear Model)
") Logistic Regression (a type of Generalized Linear Model) 1/36 Today Review of GLMs Logistic Regression 2/36 How do we find patterns in data? We begin with a model of how the world works We use our knowledge
Logistic Regression (a type of Generalized Linear Model) 1/36 Today Review of GLMs Logistic Regression 2/36 How do we find patterns in data? We begin with a model of how the world works We use our knowledge
Categorical Data Analysis
 Richard L. Scheaffer University of Florida The reference material and many examples for this section are based on Chapter 8, Analyzing Association Between Categorical Variables, from Statistical Methods
E(y i ) = x T i β. yield of the refined product as a percentage of crude specific gravity vapour pressure ASTM 10% point ASTM end point in degrees F
 = x T i β. yield of the refined product as a percentage of crude specific gravity vapour pressure ASTM 10% point ASTM end point in degrees F") Random and Mixed Effects Models (Ch. 10) Random effects models are very useful when the observations are sampled in a highly structured way. The basic idea is that the error associated with any linear,
Random and Mixed Effects Models (Ch. 10) Random effects models are very useful when the observations are sampled in a highly structured way. The basic idea is that the error associated with any linear,
Section A. Index. Section A. Planning, Budgeting and Forecasting Section A.2 Forecasting techniques... 1. Page 1 of 11. EduPristine CMA - Part I
 Index Section A. Planning, Budgeting and Forecasting Section A.2 Forecasting techniques... 1 EduPristine CMA - Part I Page 1 of 11 Section A. Planning, Budgeting and Forecasting Section A.2 Forecasting
Simple Linear Regression
 STAT 101 Dr. Kari Lock Morgan Simple Linear Regression SECTIONS 9.3 Confidence and prediction intervals (9.3) Conditions for inference (9.1) Want More Stats??? If you have enjoyed learning how to analyze
List of Examples. Examples 319
 Examples 319 List of Examples DiMaggio and Mantle. 6 Weed seeds. 6, 23, 37, 38 Vole reproduction. 7, 24, 37 Wooly bear caterpillar cocoons. 7 Homophone confusion and Alzheimer s disease. 8 Gear tooth strength.
Causal Forecasting Models
 CTL.SC1x -Supply Chain & Logistics Fundamentals Causal Forecasting Models MIT Center for Transportation & Logistics Causal Models Used when demand is correlated with some known and measurable environmental
Forecast. Forecast is the linear function with estimated coefficients. Compute with predict command
 Forecast Forecast is the linear function with estimated coefficients T T + h = b0 + b1timet + h Compute with predict command Compute residuals Forecast Intervals eˆ t = = y y t+ h t+ h yˆ b t+ h 0 b Time
Week TSX Index 1 8480 2 8470 3 8475 4 8510 5 8500 6 8480
 1) The S & P/TSX Composite Index is based on common stock prices of a group of Canadian stocks. The weekly close level of the TSX for 6 weeks are shown: Week TSX Index 1 8480 2 8470 3 8475 4 8510 5 8500
Week 5: Multiple Linear Regression
 BUS41100 Applied Regression Analysis Week 5: Multiple Linear Regression Parameter estimation and inference, forecasting, diagnostics, dummy variables Robert B. Gramacy The University of Chicago Booth School
Unit 26: Small Sample Inference for One Mean
 Unit 26: Small Sample Inference for One Mean Prerequisites Students need the background on confidence intervals and significance tests covered in Units 24 and 25. Additional Topic Coverage Additional coverage
Name: Date: Use the following to answer questions 2-3:
 Name: Date: 1. A study is conducted on students taking a statistics class. Several variables are recorded in the survey. Identify each variable as categorical or quantitative. A) Type of car the student
Discussion Section 4 ECON 139/239 2010 Summer Term II
 Discussion Section 4 ECON 139/239 2010 Summer Term II 1. Let s use the CollegeDistance.csv data again. (a) An education advocacy group argues that, on average, a person s educational attainment would increase
POLYNOMIAL AND MULTIPLE REGRESSION. Polynomial regression used to fit nonlinear (e.g. curvilinear) data into a least squares linear regression model.
 data into a least squares linear regression model.") Polynomial Regression POLYNOMIAL AND MULTIPLE REGRESSION Polynomial regression used to fit nonlinear (e.g. curvilinear) data into a least squares linear regression model. It is a form of linear regression
Polynomial Regression POLYNOMIAL AND MULTIPLE REGRESSION Polynomial regression used to fit nonlinear (e.g. curvilinear) data into a least squares linear regression model. It is a form of linear regression
Regression step-by-step using Microsoft Excel
 Step 1: Regression step-by-step using Microsoft Excel Notes prepared by Pamela Peterson Drake, James Madison University Type the data into the spreadsheet The example used throughout this How to is a regression
Scatter Plot, Correlation, and Regression on the TI-83/84
 Scatter Plot, Correlation, and Regression on the TI-83/84 Summary: When you have a set of (x,y) data points and want to find the best equation to describe them, you are performing a regression. This page
Introduction to Regression and Data Analysis
 Statlab Workshop Introduction to Regression and Data Analysis with Dan Campbell and Sherlock Campbell October 28, 2008 I. The basics A. Types of variables Your variables may take several forms, and it
DATA INTERPRETATION AND STATISTICS
 PholC60 September 001 DATA INTERPRETATION AND STATISTICS Books A easy and systematic introductory text is Essentials of Medical Statistics by Betty Kirkwood, published by Blackwell at about 14. DESCRIPTIVE
Chapter Seven. Multiple regression An introduction to multiple regression Performing a multiple regression on SPSS
 Chapter Seven Multiple regression An introduction to multiple regression Performing a multiple regression on SPSS Section : An introduction to multiple regression WHAT IS MULTIPLE REGRESSION? Multiple
MULTIPLE REGRESSION WITH CATEGORICAL DATA
 DEPARTMENT OF POLITICAL SCIENCE AND INTERNATIONAL RELATIONS Posc/Uapp 86 MULTIPLE REGRESSION WITH CATEGORICAL DATA I. AGENDA: A. Multiple regression with categorical variables. Coding schemes. Interpreting
An analysis appropriate for a quantitative outcome and a single quantitative explanatory. 9.1 The model behind linear regression
 Chapter 9 Simple Linear Regression An analysis appropriate for a quantitative outcome and a single quantitative explanatory variable. 9.1 The model behind linear regression When we are examining the relationship
A Handbook of Statistical Analyses Using R. Brian S. Everitt and Torsten Hothorn
 A Handbook of Statistical Analyses Using R Brian S. Everitt and Torsten Hothorn CHAPTER 6 Logistic Regression and Generalised Linear Models: Blood Screening, Women s Role in Society, and Colonic Polyps
Institute of Actuaries of India Subject CT3 Probability and Mathematical Statistics
 Institute of Actuaries of India Subject CT3 Probability and Mathematical Statistics For 2015 Examinations Aim The aim of the Probability and Mathematical Statistics subject is to provide a grounding in
Final Exam Practice Problem Answers
 Final Exam Practice Problem Answers The following data set consists of data gathered from 77 popular breakfast cereals. The variables in the data set are as follows: Brand: The brand name of the cereal
Homework 8 Solutions
 Math 17, Section 2 Spring 2011 Homework 8 Solutions Assignment Chapter 7: 7.36, 7.40 Chapter 8: 8.14, 8.16, 8.28, 8.36 (a-d), 8.38, 8.62 Chapter 9: 9.4, 9.14 Chapter 7 7.36] a) A scatterplot is given below.
Analyzing Intervention Effects: Multilevel & Other Approaches. Simplest Intervention Design. Better Design: Have Pretest
 Analyzing Intervention Effects: Multilevel & Other Approaches Joop Hox Methodology & Statistics, Utrecht Simplest Intervention Design R X Y E Random assignment Experimental + Control group Analysis: t
II. DISTRIBUTIONS distribution normal distribution. standard scores
 Appendix D Basic Measurement And Statistics The following information was developed by Steven Rothke, PhD, Department of Psychology, Rehabilitation Institute of Chicago (RIC) and expanded by Mary F. Schmidt,
Statistics 151 Practice Midterm 1 Mike Kowalski
 Statistics 151 Practice Midterm 1 Mike Kowalski Statistics 151 Practice Midterm 1 Multiple Choice (50 minutes) Instructions: 1. This is a closed book exam. 2. You may use the STAT 151 formula sheets and
Simple Regression Theory II 2010 Samuel L. Baker
 SIMPLE REGRESSION THEORY II 1 Simple Regression Theory II 2010 Samuel L. Baker Assessing how good the regression equation is likely to be Assignment 1A gets into drawing inferences about how close the
1) Write the following as an algebraic expression using x as the variable: Triple a number subtracted from the number
 Write the following as an algebraic expression using x as the variable: Triple a number subtracted from the number") 1) Write the following as an algebraic expression using x as the variable: Triple a number subtracted from the number A. 3(x - x) B. x 3 x C. 3x - x D. x - 3x 2) Write the following as an algebraic expression
1) Write the following as an algebraic expression using x as the variable: Triple a number subtracted from the number A. 3(x - x) B. x 3 x C. 3x - x D. x - 3x 2) Write the following as an algebraic expression
Chapter 3 Quantitative Demand Analysis
 Managerial Economics & Business Strategy Chapter 3 uantitative Demand Analysis McGraw-Hill/Irwin Copyright 2010 by the McGraw-Hill Companies, Inc. All rights reserved. Overview I. The Elasticity Concept
How Far is too Far? Statistical Outlier Detection
 How Far is too Far? Statistical Outlier Detection Steven Walfish President, Statistical Outsourcing Services [email protected] 30-325-329 Outline What is an Outlier, and Why are
Correlation. What Is Correlation? Perfect Correlation. Perfect Correlation. Greg C Elvers
 Correlation Greg C Elvers What Is Correlation? Correlation is a descriptive statistic that tells you if two variables are related to each other E.g. Is your related to how much you study? When two variables
Lets suppose we rolled a six-sided die 150 times and recorded the number of times each outcome (1-6) occured. The data is
 occured. The data is") In this lab we will look at how R can eliminate most of the annoying calculations involved in (a) using Chi-Squared tests to check for homogeneity in two-way tables of catagorical data and (b) computing
In this lab we will look at how R can eliminate most of the annoying calculations involved in (a) using Chi-Squared tests to check for homogeneity in two-way tables of catagorical data and (b) computing
Algebra 1 Course Title
 Algebra 1 Course Title Course- wide 1. What patterns and methods are being used? Course- wide 1. Students will be adept at solving and graphing linear and quadratic equations 2. Students will be adept