HOW TO USE MINITAB: DESIGN OF EXPERIMENTS. Noelle M. Richard 08/27/14
|
|
|
- Margaret Parsons
- 10 years ago
- Views:
Transcription
1 HOW TO USE MINITAB: DESIGN OF EXPERIMENTS 1 Noelle M. Richard 08/27/14

2 CONTENTS 1. Terminology 2. Factorial Designs When to Use? (preliminary experiments) Full Factorial Design General Full Factorial Design Fractional Factorial Design Creating a Factorial Design Replication Blocking Analyzing a Factorial Design Interaction Plots 3. Split Plot Designs When to Use? (hard to change factors) Creating a Split Plot Design 4. Response Surface Designs When to Use? (optimization) Central Composite Design Box Behnken Design Creating a Response Surface Design Analyzing a Response Surface Design Contour/Surface Plots Optimization 2
 Creating a Split Plot Design 4. Response Surface Designs When to Use?")
3 TERMINOLOGY Controlled Experiment: a study where treatments are imposed on experimental units, in order to observe a response Factor: a variable that potentially affects the response ex. temperature, time, chemical composition, etc. Treatment: a combination of one or more factors Levels: the values a factor can take on Effect: how much a main factor or interaction between factors influences the mean response 3

4 TERMINOLOGY Design Space: range of values over which factors are to be varied Design Points: the values of the factors at which the experiment is conducted One design point = one treatment Usually, points are coded to more convenient values ex. 1 factor with 2 levels levels coded as (-1) for low level and (+1) for high level Response Surface: unknown; represents the mean response at any given level of the factors in the design space. Center Point: used to measure process stability/variability, as well as check for curvature of the response surface. Not necessary, but highly recommended. Level coded as 0. 4

5 WHEN DO YOU USE A FACTORIAL DESIGN? Factorial designs are good preliminary experiments A type of factorial design, known as the fractional factorial design, are often used to find the vital few significant factors out of a large group of potential factors. This is also known as a screening experiment Also used to determine curvature of the response surface 5

6 FULL FACTORIAL DESIGNS Every combination of factor levels (i.e., every possible treatment) is measured. 2 k design = k factors, each with 2 levels, 2 k total runs 3 3 design = 3 factors, each with 3 levels, 3 3 = 27 total runs Every factor effect can be estimated Can include center points, but not necessary 2 k designs are the most popular High Level (+1) and Low Level (-1) Example: 2 2 design 4 runs Run Factor A Level Factor B Level
 and Low Level (-1) Example: 2 2 design 4 runs Run Factor A Level Factor B Level 1-1 -1")
7 FULL FACTORIAL DESIGNS Full factorials can also allows factors to have different # of levels = 4 factors total (sum of exponents) One factor has 2 levels, two have 3 levels, one has 4 levels Total of 2*3*3*4 = 72 runs Ex design 6 runs Run Factor A Level Factor B Level

8 FRACTIONAL FACTORIAL DESIGNS Sometimes, there aren t enough resources to run a Full Factorial Design. Instead, you can run a fraction of the total # of treatments. 2 k-p design = k factors, each with 2 levels, but run only 2 k-p treatments (as opposed to 2 k ) design = 4 factors, but run only 2 3 = 8 treatments (instead of 16) 8/16 = 1/2 design known as a ½ replicate or half replicate However, not all factor effects can be estimated Factors are aliased with one another. In other words, factors are confounded, and you cannot estimate their effects separately. Ex. Suppose factors A and D are aliased. When you estimate the effect for A, you actually estimate the effect for A and D together. Only further experimentation can separate the two. Main effects and low order interactions are of most interest, and are usually more significant that high order interaction terms. Why? See So, by aliasing main effects with high order interactions, you can obtain fairly accurate estimates of the main effects. 8

9 FRACTIONAL FACTORIAL DESIGNS Certain fractional factorial designs are better than others Determine the best ones based on the design s Resolution Resolution: the ability to separate main effects and low-order interactions from one another The higher the Resolution, the better the design Resolution I II III IV Ability Not useful: an experiment of exactly one run only tests one level of a factor and hence can't even distinguish between the high and low levels of that factor Not useful: main effects are confounded with other main effects Can estimate main effects, but these may be confounded with two-factor interactions Can estimate main effects, and they are unconfounded with two-factor interactions Can estimate two-factor interaction effects, but these may be confounded with other two-factor interactions V Can estimate main effects, and they are unconfounded with three-factor (or less) interactions Can estimate two-factor interaction effects, and they are unconfounded with two-factor interactions Can estimate three-factor interaction effects, but these may be confounded with other three-factor interactions VI Can estimate main effects, and they are unconfounded with four-factor (or less) interactions Can estimate two-factor interaction effects, and they are unconfounded with three-factor (or less) interactions Can estimate three-factor interaction effects, but these may be confounded with other three-factor interactions 9


10 CREATING A FACTORIAL DESIGN Choosing the default generators option means that Minitab will select what effects are aliased with one another for you. You can see what designs are available for a specific # of runs or factors, as well as the corresponding design resolution. 10

 4. Select how many replicates for each treatment (corner points). See Slide 12 5.")
11 CREATING A FACTORIAL DESIGN 1. Select the # of factors 2. Select your design (full or fractional) Select the # of center points (not required, but a good idea) 4. Select how many replicates for each treatment (corner points). See Slide Select # of blocks See Slide
.")
12 REPLICATION Replicates NOT the same as repeated measurements Repeated measurements is when you take multiple measurements on the same unit. Replication is when you repeat your design a 2 nd, 3 rd, 4 th, etc. time. Ex. Say you have a 2 2 design (2 factors, 4 runs) and want 3 replicates. Your experiment will have 3*2 2 = 12 runs. Replication will help give you more accurate effect estimates. Replicates should be run at the same time as your original design (to ensure all controlled conditions are the same). If that s not possible, consider blocking 12

13 BLOCKING Blocking Grouping together experimental units that are similar to one another the groups are called blocks Blocking reduces known, but irrelevant sources of variation between units and thus allows greater precision In Factorial Designs, blocks are confounded with higher order interactions. This means you don t know if an observed relationship between a block and the response variable is due to the block itself, or due to the factor interaction. Assuming the higher order interactions are insignificant (see Slide 7), one canestimate the block effect. 13
, one canestimate the block effect. 13 http://en.wikipedia.")
14 CREATING A FACTORIAL DESIGN (CONTINUED) You can name factors, select what type, and give what CODED values you want for each level. You should make sure to have the alias table printed out in the session window. This information is important for interpretation 14

: 4 Design Generators: E = ABCD Alias Structure I + ABCDE A +")
15 OUTPUT Just add another column (C10) for your observations. Fractional Factorial Design Factors: 5 Base Design: 5, 16 Resolution: V Runs: 20 Replicates: 1 Fraction: 1/2 Blocks: 1 Center pts (total): 4 Design Generators: E = ABCD Alias Structure I + ABCDE A + BCDE B + ACDE C + ABDE D + ABCE E + ABCD AB + CDE AC + BDE AD + BCE AE + BCD BC + ADE BD + ACE BE + ACD CD + ABE CE + ABD DE + ABC I stands for Identity Identity is another word for control i.e. no treatments. The effect estimate for factor A is actually the effect for A and BCDE 15


16 CREATING GENERAL FACTORIAL DESIGNS 1. Specify # of factors 2. Add # of levels for each factor 3. Select # of replicates After you enter in the # of levels, the Factors tab in the Create Factorial Design window should be clickable. 16


17 OUTPUT Multilevel Factorial Design Factors: 3 Replicates: 1 Base runs: 12 Total runs: 12 Base blocks: 1 Total blocks: 1 Number of levels: 2, 3, 2 17

18 ANALYZING A FACTORIAL DESIGN Enter in your measurement(s) column(s) as responses 18
")

19 ANALYZING A FACTORIAL DESIGN When you analyze an experiment, you are actually fitting a model to the data. You estimate the effects of main factors and interaction terms. Here, you can choose how high of an interaction term you want to estimate. Selected Terms are the main factor/interaction effects that will be estimated. Available Terms are other interaction terms that are not being estimated (but could be). You can pick and choose specific effects to estimate using the arrow buttons in the middle. 19


20 ANALYSIS OUTPUT Factorial Fit: Response versus A, B, C, D, E Estimated Effects and Coefficients for Response (coded units) Term Effect Coef SE Coef T P Constant A B C D E A*B A*C A*D A*E B*C B*D B*E C*D C*E D*E Ct Pt S = PRESS = * R-Sq = 81.65% R-Sq(pred) = *% R-Sq(adj) = 0.00% Effect Estimates Which are the vital few significant effects? Determine this using p-values. 1. Select your confidence level. Usually, L = P-values < 0.05 indicate the effect is significant. There is a little leeway: If you choose L = 0.1, effects with p-values < 0.1 are considered significant. What confidence level you choose depends on how many factors you want to keep. In this example, no effect is significant at the 0.1 level. I would re-fit the model, removing interaction terms that have large p-values (such as AD, AE, etc.) Then, reexamine p-values vs. Analysis of Variance for Response (coded units) Source DF Seq SS Adj SS Adj MS F P Main Effects A B C D E Way Interactions A*B A*C A*D A*E B*C B*D B*E C*D C*E D*E Curvature Residual Error Pure Error Total Is your response surface simply a multi-dimensional plane? Or does it have curvature? The p-values < 0.05 indicate significant curvature. 0 20
 = *% R-Sq(adj) = 0.")

21 ANALYSIS OUTPUT (CONTINUED) Unusual Observations for Response St Obs StdOrder Response Fit SE Fit Residual Resid * X * X * X * X * X * X * X * X * X * X * X * X * X * X * X * X Can also look at R-sq. values and residuals to determine how well the model fits. See Regression Analysis for an explanation on how to interpret residuals X denotes an observation whose X value gives it large leverage. Alias Structure I + A*B*C*D*E A + B*C*D*E B + A*C*D*E C + A*B*D*E D + A*B*C*E E + A*B*C*D A*B + C*D*E A*C + B*D*E A*D + B*C*E A*E + B*C*D B*C + A*D*E B*D + A*C*E B*E + A*C*D C*D + A*B*E C*E + A*B*D D*E + A*B*C Outliers in the X (independent) variables are called high leverage points. Remember, in 2 k designs, the independent variables are the factors, and they take on either a high or low level. It makes sense that those runs have large leverage, whereas the center points do not. 21

22 INTERACTION PLOTS How do certain factors interact with one another? Interaction plots will help answer this. 22
, the mean response decreases when factor C changes from it s low level (-1) to it s high level (+1).")
23 INTERACTION PLOTS Interpretation: Black Line: When factor A is at it s low level (-1), the mean response increases when factor C changes from it s low level (-1) to it s high level (+1). Green Line: When factor A is at it s high level (+1), the mean response decreases when factor C changes from it s low level (-1) to it s high level (+1). Interpretation: Black Line: The change in mean response when factor C changes from it s low level (-1) to it s high level (+1), assuming all other factors are kept constant Black and green lines with considerably different slopes indicate an interaction between the two factors. 23
24 SPLIT PLOT DESIGNS If one or more of your factors are hard to change, consider using a split plot design The levels of the hard-to-change factors are held constant for several runs, which are collectively treated as a whole plot, while easy-to-change factors are varied over these runs, each of which is a subplot. Minitab Help Split Plot designs contain an embedded factorial (full or fractional) design. Example: 3 factors each with 2 levels: Temperature, Chocolate, Sugar Temperature is the hard to change factor. Run whole plot 1 on day 1, whole plot 2 on day 2 24

25 CREATING SPLIT PLOT DESIGNS You can view all available split plot designs, as well as the resolution 1 HTC = 1 Hard to Change Factor 2 HTC = 2 Hard to Change Factors 3 HTC = 3 Hard to Change Factors ETC = Easy to Change Factor WP = Whole Plot SP = Subplot 3FI = 3 factor interaction, confounded with whole plots for some designs 1/8, ¼, ½, Full Refers to the type of factorial design used within the split plot design 25

26 CREATING SPLIT PLOT DESIGNS Select how many hard to change factors, the particular design, etc. 26

27 OUTPUT Fractional Factorial Split-Plot Design Factors: 5 Whole plots: 4 Resolution: V Hard-to-change: 2 Runs per whole plot: 4 Fraction: 1/2 Runs: 16 Whole-plot replicates: 1 Blocks: 1 Subplot replicates: 1 Design Generators: E = ABCD Hard-to-change factors: A, B Whole Plot Generators: A, B Alias Structure I + ABCDE A + BCDE B + ACDE C + ABDE D + ABCE E + ABCD AB + CDE AC + BDE AD + BCE AE + BCD BC + ADE BD + ACE BE + ACD CD + ABE CE + ABD DE + ABC 27 Analysis: Follow the same steps as for the factorial design. See Here
28 RESPONSE SURFACE DESIGNS As mentioned before, factorial designs are useful when determining the vital few significant factors Once you have determined those vital factors, you may want to map the response surface. Why? 1. To find the factor settings that optimize the response (max./min. problem, or hitting a specific target) 2. In order to improve a process, you ll need to understand how certain factors influence the response 3. Find out what tradeoffs can be made in factor settings, while staying near the optimal response Essentially, you are finding a model that describes the relationship between the vital factors and the response. 28
29 CENTRAL COMPOSITE DESIGNS (CCD) A CCD design is one type of response surface design. It is a factorial design (2 k or 2 k-p ) with 2k additional points. The additional points are known as star points or axial points Axial points have coded values (±a, 0, 0, 0), (0, ±a, 0, 0), (0, 0, 0, ±a) The design is rotatable if All points are the same distance from the center point, so the quality of predication is the same in any direction. See here for more. The design is face centered if a =1 Only three factor levels (-1, 0, +1) are needed as opposed to five levels (-1, -a, 0, +a, +1) (+1, +1) 29 (-1, -1)
30 BOX BEHNKEN DESIGNS Another type of response surface design. Does not contain an embedded factorial design like the CCD. Instead, design points are the midpoints Requires 3 levels (-1, 0, +1) for each factor Less expensive to run than the CCD (less points) Does not contain axial points, so all design points are sure to be within safe operating limits (+1, +1, 0) Box Behnken design for 3 factors 30 (0, -1, -1)
31 CREATING A RESPONSE SURFACE DESIGN Click on Designs to select the specific design you wish to use for a specified number of factors. See Here You can view all available designs Full, Half, Quarter, and Eighth refers to the factorial design piece of the CCD. Full = 2 k Half = 2 k-1 Quarter = 2 k-2 Eighth = 2 k-3 31

32 OUTPUT Central Composite Design Factors: 2 Replicates: 1 Base runs: 13 Total runs: 13 Base blocks: 1 Total blocks: 1 Two-level factorial: Full factorial Cube points: 4 Center points in cube: 5 Axial points: 4 Center points in axial: 0 Alpha: Enter measurements into C7 column 32
33 ANALYZING RESPONSE SURFACE DESIGNS If your preliminary screening experiments indicated curvature, then you should use a quadratic equation. If there was no significant curvature, then try fitting a linear model. 33

34 OUTPUT Response Surface Regression: Response versus A, B The analysis was done using coded units. Estimated Regression Coefficients for Response Term Coef SE Coef T P Constant A B A*A B*B A*B Once again, you can use p-values to determine the significant effects. AA and AB are not significant. So, you could reduce your model to only include the A, B, and BB terms. S = PRESS = R-Sq = 93.99% R-Sq(pred) = 66.09% R-Sq(adj) = 89.69% Analysis of Variance for Response Source DF Seq SS Adj SS Adj MS F P Regression Linear A B Square A*A B*B Interaction A*B Residual Error Lack-of-Fit Pure Error Total Estimated Regression Coefficients for Response using data in uncoded units Term Coef Constant A B A*A B*B A*B Can also look at R-sq. values and residuals to determine how well the model fits. See Regression Analysis for an explanation on how to interpret residuals 34
 If you do not click on")
35 CONTOUR/SURFACE PLOTS Can draw these AFTER you fit a model to the data. You will need to click setup in order for Minitab to draw the plot(s) If you do not click on setup, this error will pop up. 35
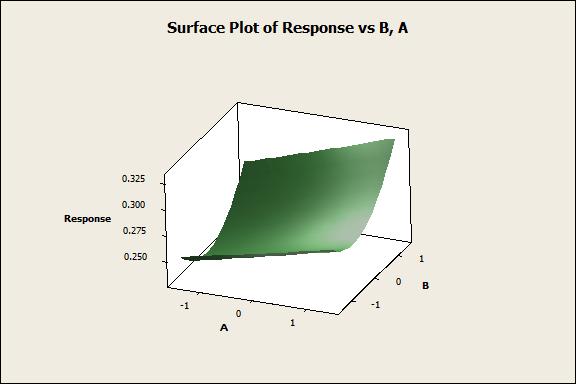
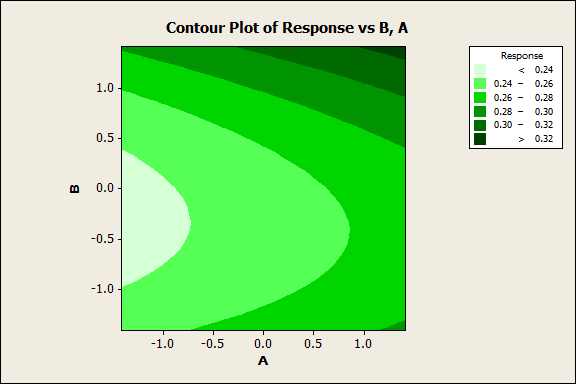
36 OUTPUT 36
37 OPTIMIZATION Response Surface Analysis involves 2 steps 1. Initial search for the region that contains the optimum (max, min, or target) 2. Detailed search of the region from #1, to find the optimum Basically, you find the region where you believe the optimum to be. Then, you zoom in on that area and model it in more detail On page 34, a fitted model was outputted as part of the analysis. This model is an equation that describes the surface in that specific region. From the model, you can find the direction where the surface increases (or decreases) most quickly - the gradient A secondary experiment could then be run by using factor settings along the gradient 1. Find the gradient vector. 2. Divide the gradient vector by it s length (Euclidean norm) to obtain a unit vector 3. New Experiment Points = Initial Factor Settings Vector + m * Step Size * Unit Vector for m = 1, 2, Note: This is all in terms of CODED units Caution: In step 1, it s possible you will be looking at a region that contains a LOCAL optimum as opposed to the overall GLOBAL optimum. In step 2, you may discover that the region does NOT contain the optimum. Repeating steps 1 and 2 in other regions may be necessary. 37

38 REFERENCES Khan, R. M. (2013). Problem solving and data analysis using minitab: A clear and easy guide to six sigma methodology (1st ed.). West Sussex, United Kingdom: Wiley. olution les_of_experimental_design.2c_following_ronald_a._fisher Minitab s Help Section 38
Minitab Tutorials for Design and Analysis of Experiments. Table of Contents
 Table of Contents Introduction to Minitab...2 Example 1 One-Way ANOVA...3 Determining Sample Size in One-way ANOVA...8 Example 2 Two-factor Factorial Design...9 Example 3: Randomized Complete Block Design...14
17. SIMPLE LINEAR REGRESSION II
 17. SIMPLE LINEAR REGRESSION II The Model In linear regression analysis, we assume that the relationship between X and Y is linear. This does not mean, however, that Y can be perfectly predicted from X.
Regression Analysis: A Complete Example
 Regression Analysis: A Complete Example This section works out an example that includes all the topics we have discussed so far in this chapter. A complete example of regression analysis. PhotoDisc, Inc./Getty
1.1. Simple Regression in Excel (Excel 2010).
.") .. Simple Regression in Excel (Excel 200). To get the Data Analysis tool, first click on File > Options > Add-Ins > Go > Select Data Analysis Toolpack & Toolpack VBA. Data Analysis is now available under
.. Simple Regression in Excel (Excel 200). To get the Data Analysis tool, first click on File > Options > Add-Ins > Go > Select Data Analysis Toolpack & Toolpack VBA. Data Analysis is now available under
Multiple Optimization Using the JMP Statistical Software Kodak Research Conference May 9, 2005
 Multiple Optimization Using the JMP Statistical Software Kodak Research Conference May 9, 2005 Philip J. Ramsey, Ph.D., Mia L. Stephens, MS, Marie Gaudard, Ph.D. North Haven Group, http://www.northhavengroup.com/
Chapter 4 and 5 solutions
 Chapter 4 and 5 solutions 4.4. Three different washing solutions are being compared to study their effectiveness in retarding bacteria growth in five gallon milk containers. The analysis is done in a laboratory,
2. Simple Linear Regression
 Research methods - II 3 2. Simple Linear Regression Simple linear regression is a technique in parametric statistics that is commonly used for analyzing mean response of a variable Y which changes according
c 2015, Jeffrey S. Simonoff 1
 Modeling Lowe s sales Forecasting sales is obviously of crucial importance to businesses. Revenue streams are random, of course, but in some industries general economic factors would be expected to have
Copyright 2010-2011 PEOPLECERT Int. Ltd and IASSC
 PEOPLECERT - Personnel Certification Body 3 Korai st., 105 64 Athens, Greece, Tel.: +30 210 372 9100, Fax: +30 210 372 9101, e-mail: [email protected], www.peoplecert.org Copyright 2010-2011 PEOPLECERT
Getting Started with Minitab 17
 2014 by Minitab Inc. All rights reserved. Minitab, Quality. Analysis. Results. and the Minitab logo are registered trademarks of Minitab, Inc., in the United States and other countries. Additional trademarks
Analysis of Variance. MINITAB User s Guide 2 3-1
 3 Analysis of Variance Analysis of Variance Overview, 3-2 One-Way Analysis of Variance, 3-5 Two-Way Analysis of Variance, 3-11 Analysis of Means, 3-13 Overview of Balanced ANOVA and GLM, 3-18 Balanced
MULTIPLE LINEAR REGRESSION ANALYSIS USING MICROSOFT EXCEL. by Michael L. Orlov Chemistry Department, Oregon State University (1996)
") MULTIPLE LINEAR REGRESSION ANALYSIS USING MICROSOFT EXCEL by Michael L. Orlov Chemistry Department, Oregon State University (1996) INTRODUCTION In modern science, regression analysis is a necessary part
MULTIPLE LINEAR REGRESSION ANALYSIS USING MICROSOFT EXCEL by Michael L. Orlov Chemistry Department, Oregon State University (1996) INTRODUCTION In modern science, regression analysis is a necessary part
1. What is the critical value for this 95% confidence interval? CV = z.025 = invnorm(0.025) = 1.96
 = 1.96") 1 Final Review 2 Review 2.1 CI 1-propZint Scenario 1 A TV manufacturer claims in its warranty brochure that in the past not more than 10 percent of its TV sets needed any repair during the first two years
1 Final Review 2 Review 2.1 CI 1-propZint Scenario 1 A TV manufacturer claims in its warranty brochure that in the past not more than 10 percent of its TV sets needed any repair during the first two years
1. The parameters to be estimated in the simple linear regression model Y=α+βx+ε ε~n(0,σ) are: a) α, β, σ b) α, β, ε c) a, b, s d) ε, 0, σ
 are: a) α, β, σ b) α, β, ε c) a, b, s d) ε, 0, σ") STA 3024 Practice Problems Exam 2 NOTE: These are just Practice Problems. This is NOT meant to look just like the test, and it is NOT the only thing that you should study. Make sure you know all the material
STA 3024 Practice Problems Exam 2 NOTE: These are just Practice Problems. This is NOT meant to look just like the test, and it is NOT the only thing that you should study. Make sure you know all the material
Unique column combinations
 Unique column combinations Arvid Heise Guest lecture in Data Profiling and Data Cleansing Prof. Dr. Felix Naumann Agenda 2 Introduction and problem statement Unique column combinations Exponential search
Design of Experiments (DOE)
") MINITAB ASSISTANT WHITE PAPER This paper explains the research conducted by Minitab statisticians to develop the methods and data checks used in the Assistant in Minitab 17 Statistical Software. Design
MINITAB ASSISTANT WHITE PAPER This paper explains the research conducted by Minitab statisticians to develop the methods and data checks used in the Assistant in Minitab 17 Statistical Software. Design
Lecture Notes on Database Normalization
 Lecture Notes on Database Normalization Chengkai Li Department of Computer Science and Engineering The University of Texas at Arlington April 15, 2012 I decided to write this document, because many students
Data Analysis Tools. Tools for Summarizing Data
 Data Analysis Tools This section of the notes is meant to introduce you to many of the tools that are provided by Excel under the Tools/Data Analysis menu item. If your computer does not have that tool
Univariate Regression
 Univariate Regression Correlation and Regression The regression line summarizes the linear relationship between 2 variables Correlation coefficient, r, measures strength of relationship: the closer r is
Predictor Coef StDev T P Constant 970667056 616256122 1.58 0.154 X 0.00293 0.06163 0.05 0.963. S = 0.5597 R-Sq = 0.0% R-Sq(adj) = 0.
 = 0.") Statistical analysis using Microsoft Excel Microsoft Excel spreadsheets have become somewhat of a standard for data storage, at least for smaller data sets. This, along with the program often being packaged
Statistical analysis using Microsoft Excel Microsoft Excel spreadsheets have become somewhat of a standard for data storage, at least for smaller data sets. This, along with the program often being packaged
KSTAT MINI-MANUAL. Decision Sciences 434 Kellogg Graduate School of Management
 KSTAT MINI-MANUAL Decision Sciences 434 Kellogg Graduate School of Management Kstat is a set of macros added to Excel and it will enable you to do the statistics required for this course very easily. To
Chapter 13. Fractional Factorials. 13.1 Fractional replicates
 244 Chapter 13 Fractional Factorials 13.1 Fractional replicates A factorial design is a fractional replicate if not all possible combinations of the treatment factors occur. A fractional replicate can
The Volatility Index Stefan Iacono University System of Maryland Foundation
 1 The Volatility Index Stefan Iacono University System of Maryland Foundation 28 May, 2014 Mr. Joe Rinaldi 2 The Volatility Index Introduction The CBOE s VIX, often called the market fear gauge, measures
Using Excel (Microsoft Office 2007 Version) for Graphical Analysis of Data
 for Graphical Analysis of Data") Using Excel (Microsoft Office 2007 Version) for Graphical Analysis of Data Introduction In several upcoming labs, a primary goal will be to determine the mathematical relationship between two variable
Using Excel (Microsoft Office 2007 Version) for Graphical Analysis of Data Introduction In several upcoming labs, a primary goal will be to determine the mathematical relationship between two variable
Topic 11. Statistics 514: Design of Experiments. Topic Overview. This topic will cover. 2 k Factorial Design. Blocking/Confounding
 Topic Overview This topic will cover 2 k Factorial Design Blocking/Confounding Fractional Factorial Designs 3 k Factorial Design Statistics 514: Design of Experiments Topic 11 2 k Factorial Design Each
Final Exam Practice Problem Answers
 Final Exam Practice Problem Answers The following data set consists of data gathered from 77 popular breakfast cereals. The variables in the data set are as follows: Brand: The brand name of the cereal
MGT 267 PROJECT. Forecasting the United States Retail Sales of the Pharmacies and Drug Stores. Done by: Shunwei Wang & Mohammad Zainal
 MGT 267 PROJECT Forecasting the United States Retail Sales of the Pharmacies and Drug Stores Done by: Shunwei Wang & Mohammad Zainal Dec. 2002 The retail sale (Million) ABSTRACT The present study aims
Data Mining: Partially from: Introduction to Data Mining by Tan, Steinbach, Kumar
 Data Mining: Association Analysis Partially from: Introduction to Data Mining by Tan, Steinbach, Kumar Association Rule Mining Given a set of transactions, find rules that will predict the occurrence of
10. Analysis of Longitudinal Studies Repeat-measures analysis
 Research Methods II 99 10. Analysis of Longitudinal Studies Repeat-measures analysis This chapter builds on the concepts and methods described in Chapters 7 and 8 of Mother and Child Health: Research methods.
Machine Learning and Data Mining. Regression Problem. (adapted from) Prof. Alexander Ihler
 Prof. Alexander Ihler") Machine Learning and Data Mining Regression Problem (adapted from) Prof. Alexander Ihler Overview Regression Problem Definition and define parameters ϴ. Prediction using ϴ as parameters Measure the error
Machine Learning and Data Mining Regression Problem (adapted from) Prof. Alexander Ihler Overview Regression Problem Definition and define parameters ϴ. Prediction using ϴ as parameters Measure the error
The Design and Analysis of D-optimal Split-Plot Designs Using JMP Version 6 Software
 The Design and Analysis of D-optimal Split-Plot Designs Using JMP Version 6 Software A SAS White Paper Table of Contents Introduction... 1 Basic Concepts of Experimental Design... 1 Split-Plot Designs...
PRIMARY CONTENT MODULE Algebra I -Linear Equations & Inequalities T-71. Applications. F = mc + b.
 PRIMARY CONTENT MODULE Algebra I -Linear Equations & Inequalities T-71 Applications The formula y = mx + b sometimes appears with different symbols. For example, instead of x, we could use the letter C.
How To Run Statistical Tests in Excel
 How To Run Statistical Tests in Excel Microsoft Excel is your best tool for storing and manipulating data, calculating basic descriptive statistics such as means and standard deviations, and conducting
Design of Experiments. Study Support. Josef Tošenovský
 VYSOKÁ ŠKOLA BÁŇSKÁ TECHNICKÁ UNIVERZITA OSTRAVA FAKULTA METALURGIE A MATERIÁLOVÉHO INŽENÝRSTVÍ Design of Experiments Study Support Josef Tošenovský Ostrava 15 1 Title: Design of Experiments Code: Author:
Basic Statistics and Data Analysis for Health Researchers from Foreign Countries
 Basic Statistics and Data Analysis for Health Researchers from Foreign Countries Volkert Siersma [email protected] The Research Unit for General Practice in Copenhagen Dias 1 Content Quantifying association
NCSS Statistical Software Principal Components Regression. In ordinary least squares, the regression coefficients are estimated using the formula ( )
") Chapter 340 Principal Components Regression Introduction is a technique for analyzing multiple regression data that suffer from multicollinearity. When multicollinearity occurs, least squares estimates
Chapter 340 Principal Components Regression Introduction is a technique for analyzing multiple regression data that suffer from multicollinearity. When multicollinearity occurs, least squares estimates
Multiple Linear Regression in Data Mining
 Multiple Linear Regression in Data Mining Contents 2.1. A Review of Multiple Linear Regression 2.2. Illustration of the Regression Process 2.3. Subset Selection in Linear Regression 1 2 Chap. 2 Multiple
Approach to Evaluation of Solvent Extraction of Oil from Neem Seed
 International Journal of Applied Science and Technology Vol. 3 No. 6; August 13 Approach to Evaluation of Solvent Extraction of Oil from Neem Seed Okonkwo P.C and Mukhtar B. Department of Chemical Engineering,
Randomized Block Analysis of Variance
 Chapter 565 Randomized Block Analysis of Variance Introduction This module analyzes a randomized block analysis of variance with up to two treatment factors and their interaction. It provides tables of
2013 MBA Jump Start Program. Statistics Module Part 3
 2013 MBA Jump Start Program Module 1: Statistics Thomas Gilbert Part 3 Statistics Module Part 3 Hypothesis Testing (Inference) Regressions 2 1 Making an Investment Decision A researcher in your firm just
Boolean Algebra (cont d) UNIT 3 BOOLEAN ALGEBRA (CONT D) Guidelines for Multiplying Out and Factoring. Objectives. Iris Hui-Ru Jiang Spring 2010
 UNIT 3 BOOLEAN ALGEBRA (CONT D) Guidelines for Multiplying Out and Factoring. Objectives. Iris Hui-Ru Jiang Spring 2010") Boolean Algebra (cont d) 2 Contents Multiplying out and factoring expressions Exclusive-OR and Exclusive-NOR operations The consensus theorem Summary of algebraic simplification Proving validity of an
Boolean Algebra (cont d) 2 Contents Multiplying out and factoring expressions Exclusive-OR and Exclusive-NOR operations The consensus theorem Summary of algebraic simplification Proving validity of an
Vector Notation: AB represents the vector from point A to point B on a graph. The vector can be computed by B A.
 1 Linear Transformations Prepared by: Robin Michelle King A transformation of an object is a change in position or dimension (or both) of the object. The resulting object after the transformation is called
Below is a very brief tutorial on the basic capabilities of Excel. Refer to the Excel help files for more information.
 Excel Tutorial Below is a very brief tutorial on the basic capabilities of Excel. Refer to the Excel help files for more information. Working with Data Entering and Formatting Data Before entering data
How to bet using different NairaBet Bet Combinations (Combo)
") How to bet using different NairaBet Bet Combinations (Combo) SINGLES Singles consists of single bets. I.e. it will contain just a single selection of any sport. The bet slip of a singles will look like
How to bet using different NairaBet Bet Combinations (Combo) SINGLES Singles consists of single bets. I.e. it will contain just a single selection of any sport. The bet slip of a singles will look like
Scatter Plot, Correlation, and Regression on the TI-83/84
 Scatter Plot, Correlation, and Regression on the TI-83/84 Summary: When you have a set of (x,y) data points and want to find the best equation to describe them, you are performing a regression. This page
Statistical Models in R
 Statistical Models in R Some Examples Steven Buechler Department of Mathematics 276B Hurley Hall; 1-6233 Fall, 2007 Outline Statistical Models Linear Models in R Regression Regression analysis is the appropriate
Algebra I Vocabulary Cards
 Algebra I Vocabulary Cards Table of Contents Expressions and Operations Natural Numbers Whole Numbers Integers Rational Numbers Irrational Numbers Real Numbers Absolute Value Order of Operations Expression
TRINITY COLLEGE. Faculty of Engineering, Mathematics and Science. School of Computer Science & Statistics
 UNIVERSITY OF DUBLIN TRINITY COLLEGE Faculty of Engineering, Mathematics and Science School of Computer Science & Statistics BA (Mod) Enter Course Title Trinity Term 2013 Junior/Senior Sophister ST7002
4. Multiple Regression in Practice
 30 Multiple Regression in Practice 4. Multiple Regression in Practice The preceding chapters have helped define the broad principles on which regression analysis is based. What features one should look
Soccer Bet Types Content
 Soccer Bet Types Content Content 1 1. Asian Handicap 2 Examples on Asian Handicap All-Up Win bets 3 2. Win/Draw/Win 5 3. All-Up Win 6 Banker Combo 9 Multiple Combo 12 4. Over/Under 14 5. Correct Scores
Directions for using SPSS
 Directions for using SPSS Table of Contents Connecting and Working with Files 1. Accessing SPSS... 2 2. Transferring Files to N:\drive or your computer... 3 3. Importing Data from Another File Format...
Simple Methods and Procedures Used in Forecasting
 Simple Methods and Procedures Used in Forecasting The project prepared by : Sven Gingelmaier Michael Richter Under direction of the Maria Jadamus-Hacura What Is Forecasting? Prediction of future events
澳 門 彩 票 有 限 公 司 SLOT Sociedade de Lotarias e Apostas Mútuas de Macau, Lda. Soccer Bet Types
 Soccer Bet Types 1. Asian Handicap Bet on a team to win in a designated match. Bets will be fully refunded in the case of a draw result after calculating handicap-goal*. *Handicap-goal Handicap-goal applies
Assignment objectives:
 Assignment objectives: Regression Pivot table Exercise #1- Simple Linear Regression Often the relationship between two variables, Y and X, can be adequately represented by a simple linear equation of the
Introducing Design-Expert Software, v9, with Split Plots!
 Workshop Schedule Experiment Design Made Easy (EDME) Jun 16-17: Edison, NJ Aug 5-6: Minneapolis, MN Sep 29-30: San Francisco, CA Factorial Split-Plot Designs for Hard-to-Change Factors (FSPD Half Day)
Summary of important mathematical operations and formulas (from first tutorial):
:") EXCEL Intermediate Tutorial Summary of important mathematical operations and formulas (from first tutorial): Operation Key Addition + Subtraction - Multiplication * Division / Exponential ^ To enter a
EXCEL Intermediate Tutorial Summary of important mathematical operations and formulas (from first tutorial): Operation Key Addition + Subtraction - Multiplication * Division / Exponential ^ To enter a
POLYNOMIAL AND MULTIPLE REGRESSION. Polynomial regression used to fit nonlinear (e.g. curvilinear) data into a least squares linear regression model.
 data into a least squares linear regression model.") Polynomial Regression POLYNOMIAL AND MULTIPLE REGRESSION Polynomial regression used to fit nonlinear (e.g. curvilinear) data into a least squares linear regression model. It is a form of linear regression
Polynomial Regression POLYNOMIAL AND MULTIPLE REGRESSION Polynomial regression used to fit nonlinear (e.g. curvilinear) data into a least squares linear regression model. It is a form of linear regression
Confidence Intervals for the Difference Between Two Means
 Chapter 47 Confidence Intervals for the Difference Between Two Means Introduction This procedure calculates the sample size necessary to achieve a specified distance from the difference in sample means
Multiple Linear Regression
 Multiple Linear Regression A regression with two or more explanatory variables is called a multiple regression. Rather than modeling the mean response as a straight line, as in simple regression, it is
Testing for Lack of Fit
 Chapter 6 Testing for Lack of Fit How can we tell if a model fits the data? If the model is correct then ˆσ 2 should be an unbiased estimate of σ 2. If we have a model which is not complex enough to fit
Analysing Questionnaires using Minitab (for SPSS queries contact -) [email protected]
 Graham.Currell@uwe.ac.uk") Analysing Questionnaires using Minitab (for SPSS queries contact -) [email protected] Structure As a starting point it is useful to consider a basic questionnaire as containing three main sections:
Analysing Questionnaires using Minitab (for SPSS queries contact -) [email protected] Structure As a starting point it is useful to consider a basic questionnaire as containing three main sections:
STATISTICA Formula Guide: Logistic Regression. Table of Contents
 : Table of Contents... 1 Overview of Model... 1 Dispersion... 2 Parameterization... 3 Sigma-Restricted Model... 3 Overparameterized Model... 4 Reference Coding... 4 Model Summary (Summary Tab)... 5 Summary
TSI College Level Math Practice Test
 TSI College Level Math Practice Test Tutorial Services Mission del Paso Campus. Factor the Following Polynomials 4 a. 6 8 b. c. 7 d. ab + a + b + 6 e. 9 f. 6 9. Perform the indicated operation a. ( +7y)
Confidence Intervals for One Standard Deviation Using Standard Deviation
 Chapter 640 Confidence Intervals for One Standard Deviation Using Standard Deviation Introduction This routine calculates the sample size necessary to achieve a specified interval width or distance from
Chapter 7: Simple linear regression Learning Objectives
 Chapter 7: Simple linear regression Learning Objectives Reading: Section 7.1 of OpenIntro Statistics Video: Correlation vs. causation, YouTube (2:19) Video: Intro to Linear Regression, YouTube (5:18) -
MODEL I: DRINK REGRESSED ON GPA & MALE, WITHOUT CENTERING
 Interpreting Interaction Effects; Interaction Effects and Centering Richard Williams, University of Notre Dame, http://www3.nd.edu/~rwilliam/ Last revised February 20, 2015 Models with interaction effects
The importance of graphing the data: Anscombe s regression examples
 The importance of graphing the data: Anscombe s regression examples Bruce Weaver Northern Health Research Conference Nipissing University, North Bay May 30-31, 2008 B. Weaver, NHRC 2008 1 The Objective
Solution Let us regress percentage of games versus total payroll.
 Assignment 3, MATH 2560, Due November 16th Question 1: all graphs and calculations have to be done using the computer The following table gives the 1999 payroll (rounded to the nearest million dolars)
Section 14 Simple Linear Regression: Introduction to Least Squares Regression
 Slide 1 Section 14 Simple Linear Regression: Introduction to Least Squares Regression There are several different measures of statistical association used for understanding the quantitative relationship
Supplementary Materials. Dispersive micro-solid-phase extraction of dopamine, epinephrine and norepinephrine
 Electronic Supplementary Material (ESI) for RSC Advances. This journal is The Royal Society of Chemistry 201 Supplementary Materials Dispersive micro-solid-phase extraction of dopamine, epinephrine and
Simple Linear Regression Inference
 Simple Linear Regression Inference 1 Inference requirements The Normality assumption of the stochastic term e is needed for inference even if it is not a OLS requirement. Therefore we have: Interpretation
Figure 1. An embedded chart on a worksheet.
 8. Excel Charts and Analysis ToolPak Charts, also known as graphs, have been an integral part of spreadsheets since the early days of Lotus 1-2-3. Charting features have improved significantly over the
Correlating PSI and CUP Denton Bramwell
 Correlating PSI and CUP Denton Bramwell Having inherited the curiosity gene, I just can t resist fiddling with things. And one of the things I can t resist fiddling with is firearms. I think I am the only
A Statistical Experimental Study on Shrinkage of Injection-Molded Part
 A Statistical Experimental Study on Shrinkage of Injection-Molded Part S.Rajalingam 1, Awang Bono 2 and Jumat bin Sulaiman 3 Abstract Plastic injection molding is an important process to produce plastic
Confidence Intervals for Cp
 Chapter 296 Confidence Intervals for Cp Introduction This routine calculates the sample size needed to obtain a specified width of a Cp confidence interval at a stated confidence level. Cp is a process
Die Welt Multimedia-Reichweite
 Die Welt Multimedia-Reichweite 1) Background The quantification of Die Welt s average daily audience (known as Multimedia-Reichweite, MMR) has been developed by Die Welt management, including the research
" Y. Notation and Equations for Regression Lecture 11/4. Notation:
 Notation: Notation and Equations for Regression Lecture 11/4 m: The number of predictor variables in a regression Xi: One of multiple predictor variables. The subscript i represents any number from 1 through
FX 115 MS Training guide. FX 115 MS Calculator. Applicable activities. Quick Reference Guide (inside the calculator cover)
") Tools FX 115 MS Calculator Handouts Other materials Applicable activities Quick Reference Guide (inside the calculator cover) Key Points/ Overview Advanced scientific calculator Two line display VPAM to
Tools FX 115 MS Calculator Handouts Other materials Applicable activities Quick Reference Guide (inside the calculator cover) Key Points/ Overview Advanced scientific calculator Two line display VPAM to
Multivariate Analysis of Variance (MANOVA)
") Chapter 415 Multivariate Analysis of Variance (MANOVA) Introduction Multivariate analysis of variance (MANOVA) is an extension of common analysis of variance (ANOVA). In ANOVA, differences among various
Chapter 415 Multivariate Analysis of Variance (MANOVA) Introduction Multivariate analysis of variance (MANOVA) is an extension of common analysis of variance (ANOVA). In ANOVA, differences among various
11. Analysis of Case-control Studies Logistic Regression
 Research methods II 113 11. Analysis of Case-control Studies Logistic Regression This chapter builds upon and further develops the concepts and strategies described in Ch.6 of Mother and Child Health:
How Does My TI-84 Do That
 How Does My TI-84 Do That A guide to using the TI-84 for statistics Austin Peay State University Clarksville, Tennessee How Does My TI-84 Do That A guide to using the TI-84 for statistics Table of Contents
KNOWLEDGE IS POWER The BEST first-timers guide to betting on and winning at the races you ll EVER encounter
 KNOWLEDGE IS POWER The BEST first-timers guide to betting on and winning at the races you ll EVER encounter Copyright 2013 James Witherite. All Rights Reserved.. WELCOME TO THE RACES! If you re new to
An analysis method for a quantitative outcome and two categorical explanatory variables.
 Chapter 11 Two-Way ANOVA An analysis method for a quantitative outcome and two categorical explanatory variables. If an experiment has a quantitative outcome and two categorical explanatory variables that
5. Linear Regression
 5. Linear Regression Outline.................................................................... 2 Simple linear regression 3 Linear model............................................................. 4
Robust Parameter Design Using Statgraphics Centurion. Dr. Neil W. Polhemus Copy right 2011 by StatPoint Technologies, Inc.
 Robust Parameter Design Using Statgraphics Centurion Dr. Neil W. Polhemus Copy right 2011 by StatPoint Technologies, Inc. 1 Robust Parameter Designs Experimental designs containing 2 types of factors:
Introduction to General and Generalized Linear Models
 Introduction to General and Generalized Linear Models General Linear Models - part I Henrik Madsen Poul Thyregod Informatics and Mathematical Modelling Technical University of Denmark DK-2800 Kgs. Lyngby
Multiple Regression. Page 24
 Multiple Regression Multiple regression is an extension of simple (bi-variate) regression. The goal of multiple regression is to enable a researcher to assess the relationship between a dependent (predicted)
Response Surface Methods (RSM) for Peak Process Performance at the Most Robust Operating Conditions
 for Peak Process Performance at the Most Robust Operating Conditions") 1 Response Surface Methods (RSM) for Peak Process Performance at the Most Robust Operating Conditions Mark J. Anderson ([email protected]) and Patrick J. Whitcomb Summary Response surface methods (RSM)
1 Response Surface Methods (RSM) for Peak Process Performance at the Most Robust Operating Conditions Mark J. Anderson ([email protected]) and Patrick J. Whitcomb Summary Response surface methods (RSM)
4. How many integers between 2004 and 4002 are perfect squares?
 5 is 0% of what number? What is the value of + 3 4 + 99 00? (alternating signs) 3 A frog is at the bottom of a well 0 feet deep It climbs up 3 feet every day, but slides back feet each night If it started
Regression step-by-step using Microsoft Excel
 Step 1: Regression step-by-step using Microsoft Excel Notes prepared by Pamela Peterson Drake, James Madison University Type the data into the spreadsheet The example used throughout this How to is a regression
Using R for Linear Regression
 Using R for Linear Regression In the following handout words and symbols in bold are R functions and words and symbols in italics are entries supplied by the user; underlined words and symbols are optional
Topic 9. Factorial Experiments [ST&D Chapter 15]
![Topic 9. Factorial Experiments [ST&D Chapter 15]](/thumbs/40/21752510.jpg "Topic 9. Factorial Experiments [ST&D Chapter 15]") Topic 9. Factorial Experiments [ST&D Chapter 5] 9.. Introduction In earlier times factors were studied one at a time, with separate experiments devoted to each factor. In the factorial approach, the investigator
Topic 9. Factorial Experiments [ST&D Chapter 5] 9.. Introduction In earlier times factors were studied one at a time, with separate experiments devoted to each factor. In the factorial approach, the investigator
13. Write the decimal approximation of 9,000,001 9,000,000, rounded to three significant
 æ If 3 + 4 = x, then x = 2 gold bar is a rectangular solid measuring 2 3 4 It is melted down, and three equal cubes are constructed from this gold What is the length of a side of each cube? 3 What is the
August 2012 EXAMINATIONS Solution Part I
 August 01 EXAMINATIONS Solution Part I (1) In a random sample of 600 eligible voters, the probability that less than 38% will be in favour of this policy is closest to (B) () In a large random sample,
MULTIPLE REGRESSION WITH CATEGORICAL DATA
 DEPARTMENT OF POLITICAL SCIENCE AND INTERNATIONAL RELATIONS Posc/Uapp 86 MULTIPLE REGRESSION WITH CATEGORICAL DATA I. AGENDA: A. Multiple regression with categorical variables. Coding schemes. Interpreting
Simple Predictive Analytics Curtis Seare
 Using Excel to Solve Business Problems: Simple Predictive Analytics Curtis Seare Copyright: Vault Analytics July 2010 Contents Section I: Background Information Why use Predictive Analytics? How to use