In order to solve this problem it is first necessary to use Equation 5.5: x 2 Dt. = 1 erf. = 1.30, and x = 2 mm = m. Thus,
|
|
|
- Oswald Randall
- 10 years ago
- Views:
Transcription
1 5.3 (a) Compare interstitial and vacancy atomic mechanisms for diffusion. (b) Cite two reasons why interstitial diffusion is normally more rapid than vacancy diffusion. Solution (a) With vacancy diffusion, atomic motion is from one lattice site to an adjacent vacancy. Self-diffusion and the diffusion of substitutional impurities proceed via this mechanism. On the other hand, atomic motion is from interstitial site to adjacent interstitial site for the interstitial diffusion mechanism. (b) Interstitial diffusion is normally more rapid than vacancy diffusion because: (1) interstitial atoms, being smaller, are more mobile; and (2) the probability of an empty adjacent interstitial site is greater than for a vacancy adjacent to a host (or substitutional impurity) atom.
 Interstitial diffusion is normally more rapid than vacancy diffusion because: (1) interstitial atoms, being smaller, are more mobile; and (2) the probability of an empty adjacent")
2 5.10 Show that C x = B exp x2 Dt 4 Dt is also a solution to Equation 5.4b. The parameter B is a constant, being independent of both x and t. Solution It can be shown that C x = B Dt exp x2 4 Dt is a solution to C t = D 2 C x 2 simply by taking appropriate derivatives of the C x expression. When this is carried out, C t = D 2 C x 2 = B x 2 2D 1/2 t 3/2 2Dt 1 x2 exp 4Dt

3 5.11 Determine the carburizing time necessary to achieve a carbon concentration of 0.45 wt% at a position 2 mm into an iron carbon alloy that initially contains 0.20 wt% C. The surface concentration is to be maintained at 1.30 wt% C, and the treatment is to be conducted at 1000 C. Use the diffusion data for γ-fe in Table 5.2. Solution In order to solve this problem it is first necessary to use Equation 5.5: C x C 0 C s C 0 = 1 erf x 2 Dt wherein, C x = 0.45, C 0 = 0.20, C s = 1.30, and x = 2 mm = m. Thus, C x C 0 C s C 0 = = = 1 erf x 2 Dt or x erf = = Dt By linear interpolation using data from Table 5.1 z erf(z) z z = From which z = = x 2 Dt Now, from Table 5.2, at 1000 C (1273 K)
 0.85 0.7707 z 0.7727 0.90 0.7970 z 0.")
4 D = ( m 2 148, 000 J/mol /s) exp (8.31 J/mol- K)(1273 K) Thus, = m 2 /s = m (2) ( m 2 /s) (t) Solving for t yields t = s = 19.7 h
 (t) Solving for t yields t")
5 5.D3 The wear resistance of a steel shaft is to be improved by hardening its surface. This is to be accomplished by increasing the nitrogen content within an outer surface layer as a result of nitrogen diffusion into the steel. The nitrogen is to be supplied from an external nitrogen-rich gas at an elevated and constant temperature. The initial nitrogen content of the steel is wt%, whereas the surface concentration is to be maintained at 0.50 wt%. For this treatment to be effective, a nitrogen content of 0.10 wt% must be established at a position 0.40 mm below the surface. Specify appropriate heat treatments in terms of temperature and time for temperatures between 475 C and 625 C. The preexponential and activation energy for the diffusion of nitrogen in iron are m 2 /s and 76,150 J/mol, respectively, over this temperature range. Solution This is a nonsteady-state diffusion situation; thus, it is necessary to employ Equation 5.5, utilizing the following values for the concentration parameters: C 0 = wt% N C s = 0.50 wt% N C x = 0.10 wt% N Therefore C x C 0 C s C 0 = x = = 1 erf 2 Dt And thus x = = erf 2 Dt Using linear interpolation and the data presented in Table 5.1 z erf (z) y

6 = y From which y = x 2 Dt = The problem stipulates that x = 0.40 mm = m. Therefore m 2 Dt = Which leads to Dt = m 2 Furthermore, the diffusion coefficient depends on temperature according to Equation 5.8; and, as stipulated in the problem statement, D 0 = m 2 /s and Q d = 76,150 J/mol. Hence Dt = D 0 exp Q d (t) = m 2 RT ( m 2 76,150 J/mol /s)exp (t) = m 2 (8.31 J/mol - K)(T) And solving for the time t t (in s) = exp T Thus, the required diffusion time may be computed for some specified temperature (in K). Below are tabulated t values for three different temperatures that lie within the range stipulated in the problem.
(T) And solving for the time t t (in s) = 0.160 exp 9163.7 T Thus, the required diffusion time may be computed for some specified temperature (in K).")
7 Temperature Time ( C) s h , ,

8 5.22 The diffusion coefficients for silver in copper are given at two temperatures: T ( C) D (m 2 /s) (a) Determine the values of D 0 and Q d. (b) What is the magnitude of D at 875 C? follows: Solution (a) Using Equation 5.9a, we set up two simultaneous equations with Q d and D 0 as unknowns as ln D 1 = lnd 0 Q d R 1 T 1 ln D 2 = lnd 0 Q d R 1 T 2 Solving for Q d in terms of temperatures T 1 and T 2 (923 K [650 C] and 1173 K [900 C]) and D 1 and D 2 ( and m 2 /s), we get Q d = R ln D 1 ln D 2 1 T 1 1 T 2 = (8.31 J/mol- K) [ ln ( ) ln ( )] K K = 196,700 J/mol Now, solving for D 0 from Equation 5.8 (and using the 650 C value of D)
 and D 1 and D 2 (5.5 10-16 and 1.3 10-13 m 2 /s), we get Q d = R ln D 1 ln D 2 1 T 1 1 T 2 = (8.31 J/mol- K) [ ln (5.5 10-16 ) ln (1.")
9 D 0 = D 1 exp Q d RT 1 = ( m 2 196, 700 J/mol /s)exp (8.31 J/mol - K)(923 K) = m 2 /s (b) Using these values of D 0 and Q d, D at 1148 K (875 C) is just D = ( m 2 196, 700 J/mol /s)exp (8.31 J/mol - K)(1148 K) = m 2 /s Note: this problem may also be solved using the Diffusion module in the VMSE software. Open the Diffusion module, click on the D0 and Qd from Experimental Data submodule, and then do the following: 1. In the left-hand window that appears, enter the two temperatures from the table in the book (converted from degrees Celsius to Kelvins) (viz. 923 (650ºC) and 1173 (900ºC), in the first two boxes under the column labeled T (K). Next, enter the corresponding diffusion coefficient values (viz. 5.5e-16 and 1.3e-13 ). 3. Next, at the bottom of this window, click the Plot data button. 4. A log D versus 1/T plot then appears, with a line for the temperature dependence for this diffusion system. At the top of this window are give values for D 0 and Q d ; for this specific problem these values are m 2 /s and 196 kj/mol, respectively
 (viz.")
10 5. To solve the (b) part of the problem we utilize the diamond-shaped cursor that is located at the top of the line on this plot. Click-and-drag this cursor down the line to the point at which the entry under the Temperature (T): label reads 1148 (i.e., 875ºC). The value of the diffusion coefficient at this temperature is given under the label Diff Coeff (D):. For our problem, this value is m 2 /s.
.")
11 5.23 Below is shown a plot of the logarithm (to the base 10) of the diffusion coefficient versus reciprocal of the absolute temperature, for the diffusion of iron in chromium. Determine values for the activation energy and preexponential. Solution This problem asks us to determine the values of Q d and D 0 for the diffusion of Fe in Cr from the plot of log D versus 1/T. According to Equation 5.9b the slope of this plot is equal to Q d 2.3R (rather than Q d R since we are using log D rather than ln D) and the intercept at 1/T = 0 gives the value of log D 0. The slope is equal to slope = Δ (log D) Δ 1 T = log D 1 log D 2 1 T 1 1 T 2 Taking 1/T 1 and 1/T 2 as and K -1, respectively, then the corresponding values of D 1 and D 2 are and , as noted in the figure below.
 Δ 1 T = log D 1 log D 2 1 T 1 1 T 2 Taking 1/T 1 and 1/T 2 as 0.65 10-3 and 0.60 10-3 K -1, respectively, then the corresponding values of D 1 and D 2 are 2.")
12 The values of log D 1 and log D 2 are and 14.74, and therefore, Q d = 2.3 R (slope) Q d = 2.3 R log D 1 log D 2 1 T 1 1 T ( 14.74) = (2.3)(8.31 J/mol- K) ( ) K 1 = 329,000 J/mol Rather than trying to make a graphical extrapolation to determine D 0, a more accurate value is obtained analytically using Equation 5.9b taking a specific value of both D and T (from 1/T) from the plot given in the problem; for example, D = m 2 /s at T = 1626 K (1/T = K -1 ). Therefore D 0 = D exp Q d RT = ( m 2 329, 000 J/mol /s)exp (8.31 J/mol - K)(1626 K) = m 2 /s
 from the plot given in the problem; for example, D = 1.")
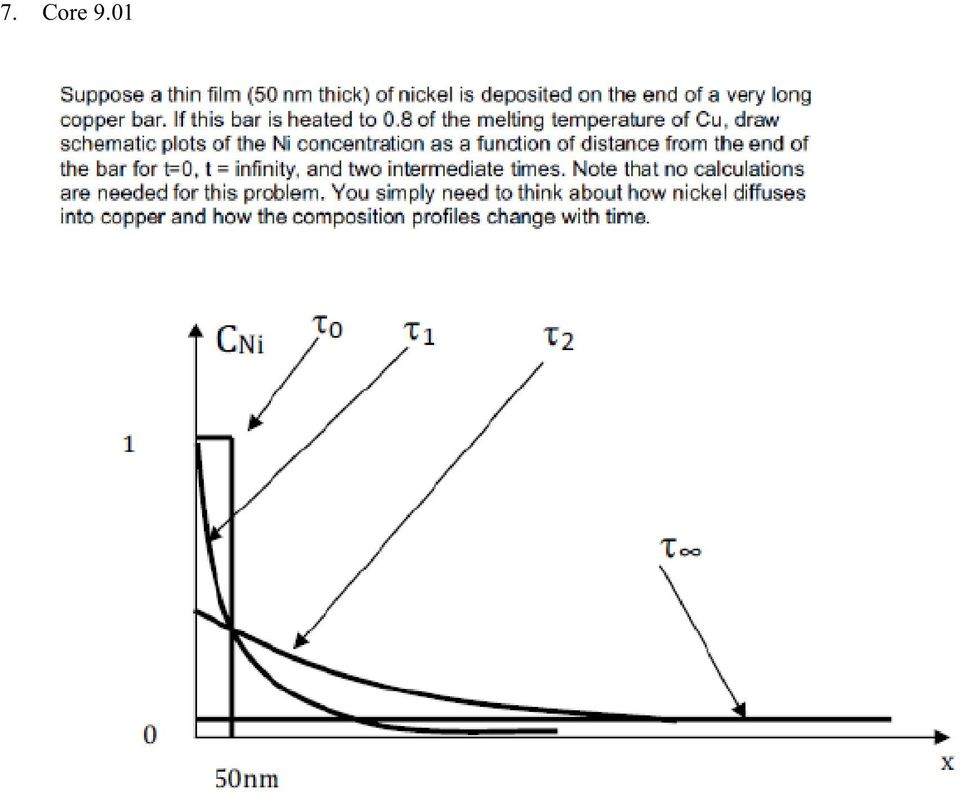
13 7. Core 9.01
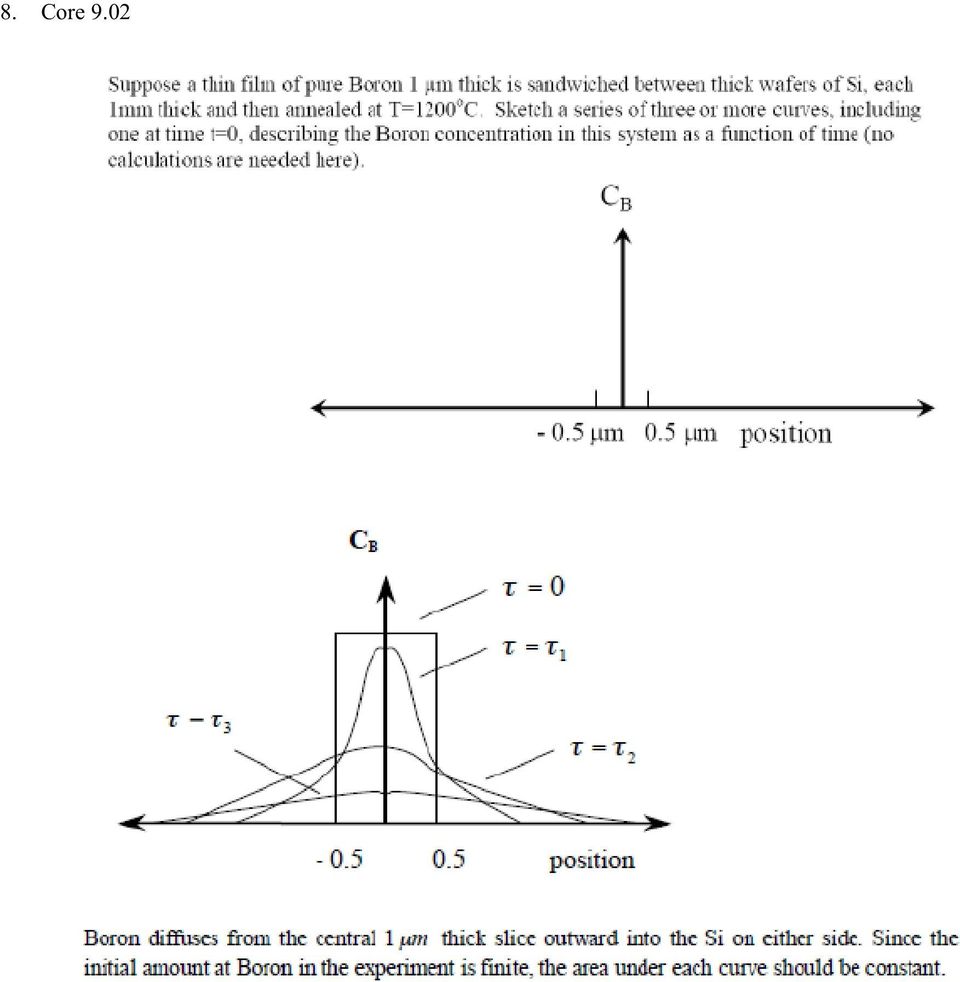
14 8. Core 9.02
15 9. (A) Conc. of Al 10E-18/cm 3 0 t

16 E (B) D = D0 exp( ) RT ln D = ln D0 + ( E / RT ) Solve this equation at both 1100 o C and 1000 o C, 5 E = J / mol Here we use E and provided diffusivity at 1300 o C to calculate D at 900 o C 16 D 900 = cm 2 / sec

17 9.1 Consider the sugar water phase diagram of Figure 9.1. (a) How much sugar will dissolve in 1500 g water at 90 C (194 F)? (b) If the saturated liquid solution in part (a) is cooled to 20 C (68 F), some of the sugar will precipitate out as a solid. What will be the composition of the saturated liquid solution (in wt% sugar) at 20 C? (c) How much of the solid sugar will come out of solution upon cooling to 20 C? Solution (a) We are asked to determine how much sugar will dissolve in 1000 g of water at 90 C. From the solubility limit curve in Figure 9.1, at 90 C the maximum concentration of sugar in the syrup is about 77 wt%. It is now possible to calculate the mass of sugar using Equation 4.3 as C sugar (wt%) = m sugar m sugar + m water wt% = m sugar m sugar g 100 Solving for m sugar yields m sugar = 5022 g (b) Again using this same plot, at 20 C the solubility limit (or the concentration of the saturated solution) is about 64 wt% sugar. (c) The mass of sugar in this saturated solution at 20 C (m' sugar ) may also be calculated using Equation 4.3 as follows: 64 wt% = m' sugar m' sugar g 100 which yields a value for m' sugar of 2667 g. Subtracting the latter from the former of these sugar concentrations yields the amount of sugar that precipitated out of the solution upon cooling m" sugar ; that is m" sugar = m sugar mõ sugar = 5022 g 2667 g = 2355 g
 We are asked to determine how much sugar will dissolve in 1000 g of water at 90 C. From the solubility limit curve in Figure 9.")
18 9.11 A copper-nickel alloy of composition 70 wt% Ni-30 wt% Cu is slowly heated from a temperature of 1300 C (2370 F). (a) At what temperature does the first liquid phase form? (b) What is the composition of this liquid phase? (c) At what temperature does complete melting of the alloy occur? (d) What is the composition of the last solid remaining prior to complete melting? Solution Shown below is the Cu-Ni phase diagram (Figure 9.3a) and a vertical line constructed at a composition of 70 wt% Ni-30 wt% Cu. (a) Upon heating from 1300 C, the first liquid phase forms at the temperature at which this vertical line intersects the α-(α + L) phase boundary--i.e., about 1345 C. (b) The composition of this liquid phase corresponds to the intersection with the (α + L)-L phase boundary, of a tie line constructed across the α + L phase region at 1345 C--i.e., 59 wt% Ni; (c) Complete melting of the alloy occurs at the intersection of this same vertical line at 70 wt% Ni with the (α + L)-L phase boundary--i.e., about 1380 C;
 Upon heating from 1300 C, the first liquid phase forms at the temperature at which this vertical line intersects the α-(α + L) phase boundary--i.e., about 1345 C.")
19 (d) The composition of the last solid remaining prior to complete melting corresponds to the intersection with α-(α + L) phase boundary, of the tie line constructed across the α + L phase region at 1380 C--i.e., about 79 wt% Ni.

14:635:407:02 Homework III Solutions
 14:635:407:0 Homework III Solutions 4.1 Calculate the fraction of atom sites that are vacant for lead at its melting temperature of 37 C (600 K). Assume an energy for vacancy formation of 0.55 ev/atom.
The atomic packing factor is defined as the ratio of sphere volume to the total unit cell volume, or APF = V S V C. = 2(sphere volume) = 2 = V C = 4R
 = 2 = V C = 4R") 3.5 Show that the atomic packing factor for BCC is 0.68. The atomic packing factor is defined as the ratio of sphere volume to the total unit cell volume, or APF = V S V C Since there are two spheres associated
3.5 Show that the atomic packing factor for BCC is 0.68. The atomic packing factor is defined as the ratio of sphere volume to the total unit cell volume, or APF = V S V C Since there are two spheres associated
CHAPTER 9 Part 1. = 5 wt% Sn-95 wt% Pb C β. = 98 wt% Sn-2 wt% Pb. = 77 wt% Ag-23 wt% Cu. = 51 wt% Zn-49 wt% Cu C γ. = 58 wt% Zn-42 wt% Cu
 CHAPTER 9 Part 1 9.5 This problem asks that we cite the phase or phases present for several alloys at specified temperatures. (a) For an alloy composed of 15 wt% Sn-85 wt% Pb and at 100 C, from Figure
Chapter 5: Diffusion. 5.1 Steady-State Diffusion
 : Diffusion Diffusion: the movement of particles in a solid from an area of high concentration to an area of low concentration, resulting in the uniform distribution of the substance Diffusion is process
Introduction To Materials Science FOR ENGINEERS, Ch. 5. Diffusion. MSE 201 Callister Chapter 5
 Diffusion MSE 21 Callister Chapter 5 1 Goals: Diffusion - how do atoms move through solids? Fundamental concepts and language Diffusion mechanisms Vacancy diffusion Interstitial diffusion Impurities Diffusion
Chapter Outline. Diffusion - how do atoms move through solids?
 Chapter Outline iffusion - how do atoms move through solids? iffusion mechanisms Vacancy diffusion Interstitial diffusion Impurities The mathematics of diffusion Steady-state diffusion (Fick s first law)
9.11 Upon heating a lead-tin alloy of composition 30 wt% Sn-70 wt% Pb from 150 C and utilizing Figure
 9-13 9.8: 9.11 Upon heating a lead-tin alloy of composition 30 wt% Sn-70 wt% Pb from 150 C and utilizing Figure (a) The first liquid forms at the temperature at which a vertical line at this composition
Ch. 4: Imperfections in Solids Part 1. Dr. Feras Fraige
 Ch. 4: Imperfections in Solids Part 1 Dr. Feras Fraige Outline Defects in Solids 0D, Point defects vacancies Interstitials impurities, weight and atomic composition 1D, Dislocations edge screw 2D, Grain
CHAPTER 6: DIFFUSION IN SOLIDS. Inter-diffusion. Simple Diffusion. Diffusion- Steady and Non-Steady State ISSUES TO ADDRESS...
 CHAPTER 6: DIFFUSION IN SOLIDS Diffusion- Steady and Non-Steady State ISSUES TO ADDRESS... Gear from case-hardened steel (C diffusion) Diffusion - Mass transport by atomic motion How does diffusion occur?
Surface Treatments. Corrosion Protective coatings for harsh environments (catalytic converters, electrochemical cells )
") Surface Treatments Applications Biomedical (biocompatible coatings on implants, drug coatings for sustained release ) Mechanical Tribological friction and wear (tool steels, implants ) Fatigue minimize
Surface Treatments Applications Biomedical (biocompatible coatings on implants, drug coatings for sustained release ) Mechanical Tribological friction and wear (tool steels, implants ) Fatigue minimize
Using Excel (Microsoft Office 2007 Version) for Graphical Analysis of Data
 for Graphical Analysis of Data") Using Excel (Microsoft Office 2007 Version) for Graphical Analysis of Data Introduction In several upcoming labs, a primary goal will be to determine the mathematical relationship between two variable
Using Excel (Microsoft Office 2007 Version) for Graphical Analysis of Data Introduction In several upcoming labs, a primary goal will be to determine the mathematical relationship between two variable
Alloys & Their Phase Diagrams
 Alloys & Their Phase Diagrams Objectives of the class Gibbs phase rule Introduction to phase diagram Practice phase diagram Lever rule Important Observation: One question in the midterm Consider the Earth
Defects Introduction. Bonding + Structure + Defects. Properties
 Defects Introduction Bonding + Structure + Defects Properties The processing determines the defects Composition Bonding type Structure of Crystalline Processing factors Defects Microstructure Types of
CHAPTER 7 DISLOCATIONS AND STRENGTHENING MECHANISMS PROBLEM SOLUTIONS
 7-1 CHAPTER 7 DISLOCATIONS AND STRENGTHENING MECHANISMS PROBLEM SOLUTIONS Basic Concepts of Dislocations Characteristics of Dislocations 7.1 The dislocation density is just the total dislocation length
The mechanical properties of metal affected by heat treatment are:
 Training Objective After watching this video and reviewing the printed material, the student/trainee will learn the basic concepts of the heat treating processes as they pertain to carbon and alloy steels.
Introduction to Materials Science, Chapter 9, Phase Diagrams. Phase Diagrams. University of Tennessee, Dept. of Materials Science and Engineering 1
 Phase Diagrams University of Tennessee, Dept. of Materials Science and Engineering 1 Chapter Outline: Phase Diagrams Microstructure and Phase Transformations in Multicomponent Systems Definitions and basic
Chapter Outline: Phase Transformations in Metals
 Chapter Outline: Phase Transformations in Metals Heat Treatment (time and temperature) Microstructure Mechanical Properties Kinetics of phase transformations Multiphase Transformations Phase transformations
Iron-Carbon Phase Diagram (a review) see Callister Chapter 9
 see Callister Chapter 9") Iron-Carbon Phase Diagram (a review) see Callister Chapter 9 University of Tennessee, Dept. of Materials Science and Engineering 1 The Iron Iron Carbide (Fe Fe 3 C) Phase Diagram In their simplest form,
Iron-Carbon Phase Diagram (a review) see Callister Chapter 9 University of Tennessee, Dept. of Materials Science and Engineering 1 The Iron Iron Carbide (Fe Fe 3 C) Phase Diagram In their simplest form,
Chapter Outline Dislocations and Strengthening Mechanisms
 Chapter Outline Dislocations and Strengthening Mechanisms What is happening in material during plastic deformation? Dislocations and Plastic Deformation Motion of dislocations in response to stress Slip
= 1.038 atm. 760 mm Hg. = 0.989 atm. d. 767 torr = 767 mm Hg. = 1.01 atm
 Chapter 13 Gases 1. Solids and liquids have essentially fixed volumes and are not able to be compressed easily. Gases have volumes that depend on their conditions, and can be compressed or expanded by
MSE 528 - PRECIPITATION HARDENING IN 7075 ALUMINUM ALLOY
 MSE 528 - PRECIPITATION HARDENING IN 7075 ALUMINUM ALLOY Objective To study the time and temperature variations in the hardness and electrical conductivity of Al-Zn-Mg-Cu high strength alloy on isothermal
Chapter 8. Phase Diagrams
 Phase Diagrams A phase in a material is a region that differ in its microstructure and or composition from another region Al Al 2 CuMg H 2 O(solid, ice) in H 2 O (liquid) 2 phases homogeneous in crystal
Reaction Rates and Chemical Kinetics. Factors Affecting Reaction Rate [O 2. CHAPTER 13 Page 1
 CHAPTER 13 Page 1 Reaction Rates and Chemical Kinetics Several factors affect the rate at which a reaction occurs. Some reactions are instantaneous while others are extremely slow. Whether a commercial
Lecture 19: Eutectoid Transformation in Steels: a typical case of Cellular
 Lecture 19: Eutectoid Transformation in Steels: a typical case of Cellular Precipitation Today s topics Understanding of Cellular transformation (or precipitation): when applied to phase transformation
Chemical Kinetics. Reaction Rate: The change in the concentration of a reactant or a product with time (M/s). Reactant Products A B
. Reactant Products A B") Reaction Rates: Chemical Kinetics Reaction Rate: The change in the concentration of a reactant or a product with time (M/s). Reactant Products A B change in number of moles of B Average rate = change in
Reaction Rates: Chemical Kinetics Reaction Rate: The change in the concentration of a reactant or a product with time (M/s). Reactant Products A B change in number of moles of B Average rate = change in
Phase. Gibbs Phase rule
 Phase diagrams Phase A phase can be defined as a physically distinct and chemically homogeneous portion of a system that has a particular chemical composition and structure. Water in liquid or vapor state
DIFFUSION IN SOLIDS. Materials often heat treated to improve properties. Atomic diffusion occurs during heat treatment
 DIFFUSION IN SOLIDS WHY STUDY DIFFUSION? Materials often heat treated to improve properties Atomic diffusion occurs during heat treatment Depending on situation higher or lower diffusion rates desired
Fall 2004 Ali Shakouri
 University of California at Santa Cruz Jack Baskin School of Engineering Electrical Engineering Department EE-145L: Properties of Materials Laboratory Lab 5b: Temperature Dependence of Semiconductor Conductivity
THREE MAIN SOLIDIFICATION REACTIONS OF VANADIUM MODIFIED T1 TUNGSTEN HIGH SPEED TOOL STEEL. Hossam Halfa
 THREE MAIN SOLIDIFICATION REACTIONS OF VANADIUM MODIFIED T1 TUNGSTEN HIGH SPEED TOOL STEEL Hossam Halfa Steel Technology Department, Central Metallurgical R&D Institute (CMRDI), Helwan, Egypt, [email protected];
Experiment 1: Colligative Properties
 Experiment 1: Colligative Properties Determination of the Molar Mass of a Compound by Freezing Point Depression. Objective: The objective of this experiment is to determine the molar mass of an unknown
Lecture 14. Chapter 8-1
 Lecture 14 Fatigue & Creep in Engineering Materials (Chapter 8) Chapter 8-1 Fatigue Fatigue = failure under applied cyclic stress. specimen compression on top bearing bearing motor counter flex coupling
Concepts of Stress and Strain
 CHAPTER 6 MECHANICAL PROPERTIES OF METALS PROBLEM SOLUTIONS Concepts of Stress and Strain 6.4 A cylindrical specimen of a titanium alloy having an elastic modulus of 107 GPa (15.5 10 6 psi) and an original
M n = (DP)m = (25,000)(104.14 g/mol) = 2.60! 10 6 g/mol
m = (25,000)(104.14 g/mol) = 2.60! 10 6 g/mol") 14.4 (a) Compute the repeat unit molecular weight of polystyrene. (b) Compute the number-average molecular weight for a polystyrene for which the degree of polymerization is 25,000. (a) The repeat unit
14.4 (a) Compute the repeat unit molecular weight of polystyrene. (b) Compute the number-average molecular weight for a polystyrene for which the degree of polymerization is 25,000. (a) The repeat unit
Calorimetry: Heat of Vaporization
 Calorimetry: Heat of Vaporization OBJECTIVES INTRODUCTION - Learn what is meant by the heat of vaporization of a liquid or solid. - Discuss the connection between heat of vaporization and intermolecular
vap H = RT 1T 2 = 30.850 kj mol 1 100 kpa = 341 K
 Thermodynamics: Examples for chapter 6. 1. The boiling point of hexane at 1 atm is 68.7 C. What is the boiling point at 1 bar? The vapor pressure of hexane at 49.6 C is 53.32 kpa. Assume that the vapor
Freezing Point Depression: Why Don t Oceans Freeze? Teacher Advanced Version
 Freezing Point Depression: Why Don t Oceans Freeze? Teacher Advanced Version Freezing point depression describes the process where the temperature at which a liquid freezes is lowered by adding another
SQUADS #4 CPW. 9 th Grade Science
 SQUADS #4 CPW 9 th Grade Science Learning Intentions - Today, I am going to address these College Readiness Standards in Science: 1. Interpretation of Data 13-15 2. Interpretation of Data 24-27 3. Scientific
Integration of a fin experiment into the undergraduate heat transfer laboratory
 Integration of a fin experiment into the undergraduate heat transfer laboratory H. I. Abu-Mulaweh Mechanical Engineering Department, Purdue University at Fort Wayne, Fort Wayne, IN 46805, USA E-mail: [email protected]
Scatter Plot, Correlation, and Regression on the TI-83/84
 Scatter Plot, Correlation, and Regression on the TI-83/84 Summary: When you have a set of (x,y) data points and want to find the best equation to describe them, you are performing a regression. This page
IDEAL AND NON-IDEAL GASES
 2/2016 ideal gas 1/8 IDEAL AND NON-IDEAL GASES PURPOSE: To measure how the pressure of a low-density gas varies with temperature, to determine the absolute zero of temperature by making a linear fit to
Phase Equilibria & Phase Diagrams
 Phase Equilibria & Phase Diagrams Week7 Material Sciences and Engineering MatE271 1 Motivation Phase diagram (Ch 9) Temperature Time Kinematics (Ch 10) New structure, concentration (mixing level) (at what
LIGHTSTICK KINETICS. INTRODUCTION: General background on rate, activation energy, absolute temperature, and graphing.
 LIGHTSTICK KINETICS From Advancing Science, Gettysburg College INTRODUCTION: General background on rate, activation energy, absolute temperature, and graphing. THE RATE LAW: The rate of a chemical reaction
Release notes: Thermo-Calc software package 4.1
 Release notes: Thermo-Calc software package 4.1 1995-2014 Foundation of Computational Thermodynamics Stockholm, Sweden Introduction Contents Release notes This document provides information on new products,
7. 1.00 atm = 760 torr = 760 mm Hg = 101.325 kpa = 14.70 psi. = 0.446 atm. = 0.993 atm. = 107 kpa 760 torr 1 atm 760 mm Hg = 790.
 CHATER 3. The atmosphere is a homogeneous mixture (a solution) of gases.. Solids and liquids have essentially fixed volumes and are not able to be compressed easily. have volumes that depend on their conditions,
EVERYDAY ENGINEERING EXAMPLES FOR SIMPLE CONCEPTS
 EVERYDAY ENGINEERING EXAMPLES FOR SIMPLE CONCEPTS Thermal Properties ENGR 3350 - Materials Science Dr. Nedim Vardar Copyright 2015 Thermal Properties of Materials Engage: MSEIP Engineering Everyday Engineering
IB Chemistry. DP Chemistry Review
 DP Chemistry Review Topic 1: Quantitative chemistry 1.1 The mole concept and Avogadro s constant Assessment statement Apply the mole concept to substances. Determine the number of particles and the amount
Experiment 6 ~ Joule Heating of a Resistor
 Experiment 6 ~ Joule Heating of a Resistor Introduction: The power P absorbed in an electrical resistor of resistance R, current I, and voltage V is given by P = I 2 R = V 2 /R = VI. Despite the fact that
Electrochemistry Revised 04/29/15
 INTRODUCTION TO ELECTROCHEMISTRY: CURRENT, VOLTAGE, BATTERIES, & THE NERNST EQUATION Experiment partially adapted from J. Chem. Educ., 2008, 85 (8), p 1116 Introduction Electrochemical cell In this experiment,
Indiana's Academic Standards 2010 ICP Indiana's Academic Standards 2016 ICP. map) that describe the relationship acceleration, velocity and distance.
 that describe the relationship acceleration, velocity and distance.") .1.1 Measure the motion of objects to understand.1.1 Develop graphical, the relationships among distance, velocity and mathematical, and pictorial acceleration. Develop deeper understanding through representations
.1.1 Measure the motion of objects to understand.1.1 Develop graphical, the relationships among distance, velocity and mathematical, and pictorial acceleration. Develop deeper understanding through representations
The final numerical answer given is correct but the math shown does not give that answer.
 Note added to Homework set 7: The solution to Problem 16 has an error in it. The specific heat of water is listed as c 1 J/g K but should be c 4.186 J/g K The final numerical answer given is correct but
Experiment 12E LIQUID-VAPOR EQUILIBRIUM OF WATER 1
 Experiment 12E LIQUID-VAPOR EQUILIBRIUM OF WATER 1 FV 6/26/13 MATERIALS: PURPOSE: 1000 ml tall-form beaker, 10 ml graduated cylinder, -10 to 110 o C thermometer, thermometer clamp, plastic pipet, long
Electrochemical Kinetics ( Ref. :Bard and Faulkner, Oldham and Myland, Liebhafsky and Cairns) R f = k f * C A (2) R b = k b * C B (3)
 R f = k f * C A (2) R b = k b * C B (3)") Electrochemical Kinetics ( Ref. :Bard and Faulkner, Oldham and Myland, Liebhafsky and Cairns) 1. Background Consider the reaction given below: A B (1) If k f and k b are the rate constants of the forward
Electrochemical Kinetics ( Ref. :Bard and Faulkner, Oldham and Myland, Liebhafsky and Cairns) 1. Background Consider the reaction given below: A B (1) If k f and k b are the rate constants of the forward
Heterogeneous Catalysis and Catalytic Processes Prof. K. K. Pant Department of Chemical Engineering Indian Institute of Technology, Delhi
 Heterogeneous Catalysis and Catalytic Processes Prof. K. K. Pant Department of Chemical Engineering Indian Institute of Technology, Delhi Module - 03 Lecture 10 Good morning. In my last lecture, I was
Problem Set 4 Solutions
 Chemistry 360 Dr Jean M Standard Problem Set 4 Solutions 1 Two moles of an ideal gas are compressed isothermally and reversibly at 98 K from 1 atm to 00 atm Calculate q, w, ΔU, and ΔH For an isothermal
Corrosion experiments in amine solutions
 Corrosion experiments in amine solutions Andreas Grimstvedt Process technology SINTEF Materials and chemistry Wenle He Applied mechanics and corrosion SINTEF Materials and chemistry 1 Contents of presentation
HW 2. Q v. kt Step 1: Calculate N using one of two equivalent methods. Problem 4.2. a. To Find:
 HW 2 Proble 4.2 a. To Find: Nuber of vacancies per cubic eter at a given teperature. b. Given: T 850 degrees C 1123 K Q v 1.08 ev/ato Density of Fe ( ρ ) 7.65 g/cc Fe toic weight of iron ( c. ssuptions:
We will study the temperature-pressure diagram of nitrogen, in particular the triple point.
 K4. Triple Point of Nitrogen I. OBJECTIVE OF THE EXPERIMENT We will study the temperature-pressure diagram of nitrogen, in particular the triple point. II. BAKGROUND THOERY States of matter Matter is made
Chapter Outline Dislocations and Strengthening Mechanisms
 Chapter Outline Dislocations and Strengthening Mechanisms What is happening in material during plastic deformation? Dislocations and Plastic Deformation Motion of dislocations in response to stress Slip
Module 34. Heat Treatment of steel IV. Lecture 34. Heat Treatment of steel IV
 Module 34 Heat reatment of steel IV Lecture 34 Heat reatment of steel IV 1 Keywords : Austenitization of hypo & hyper eutectoid steel, austenization temperature, effect of heat treatment on structure &
CHAPTER 14 THE CLAUSIUS-CLAPEYRON EQUATION
 CHAPTER 4 THE CAUIU-CAPEYRON EQUATION Before starting this chapter, it would probably be a good idea to re-read ections 9. and 9.3 of Chapter 9. The Clausius-Clapeyron equation relates the latent heat
Chem 420/523 Chemical Thermodynamics Homework Assignment # 6
 Chem 420/523 Chemical hermodynamics Homework Assignment # 6 1. * Solid monoclinic sulfur (S α ) spontaneously converts to solid rhombic sulfur (S β ) at 298.15 K and 0.101 MPa pressure. For the conversion
Thermodynamic database of the phase diagrams in copper base alloy systems
 Journal of Physics and Chemistry of Solids 66 (2005) 256 260 www.elsevier.com/locate/jpcs Thermodynamic database of the phase diagrams in copper base alloy systems C.P. Wang a, X.J. Liu b, M. Jiang b,
Steady Heat Conduction
 Steady Heat Conduction In thermodynamics, we considered the amount of heat transfer as a system undergoes a process from one equilibrium state to another. hermodynamics gives no indication of how long
Chemistry 212 VAPOR PRESSURE OF WATER LEARNING OBJECTIVES
 Chemistry 212 VAPOR PRESSURE OF WATER LEARNING OBJECTIVES The learning objectives of this experiment are to explore the relationship between the temperature and vapor pressure of water. determine the molar
Vapor Pressure of Liquids
 Vapor Pressure of Liquids Experiment 10 In this experiment, you will investigate the relationship between the vapor pressure of a liquid and its temperature. When a liquid is added to the Erlenmeyer flask
Tutorial 2: Using Excel in Data Analysis
 Tutorial 2: Using Excel in Data Analysis This tutorial guide addresses several issues particularly relevant in the context of the level 1 Physics lab sessions at Durham: organising your work sheet neatly,
Phase Transformations in Metals and Alloys
 Phase Transformations in Metals and Alloys THIRD EDITION DAVID A. PORTER, KENNETH E. EASTERLING, and MOHAMED Y. SHERIF ( г йс) CRC Press ^ ^ ) Taylor & Francis Group Boca Raton London New York CRC Press
Mathematical Modeling and Engineering Problem Solving
 Mathematical Modeling and Engineering Problem Solving Berlin Chen Department of Computer Science & Information Engineering National Taiwan Normal University Reference: 1. Applied Numerical Methods with
Heat Transfer Prof. Dr. Aloke Kumar Ghosal Department of Chemical Engineering Indian Institute of Technology, Guwahati
 Heat Transfer Prof. Dr. Aloke Kumar Ghosal Department of Chemical Engineering Indian Institute of Technology, Guwahati Module No. # 02 One Dimensional Steady State Heat Transfer Lecture No. # 05 Extended
Adsorption and Catalysis
 Adsorption and Catalysis Dr. King Lun Yeung Department of Chemical Engineering Hong Kong University of Science and Technology CENG 511 Lecture 3 Adsorption versus Absorption H H H H H H H H H Adsorption
Solution for Homework #1
 Solution for Homework #1 Chapter 2: Multiple Choice Questions (2.5, 2.6, 2.8, 2.11) 2.5 Which of the following bond types are classified as primary bonds (more than one)? (a) covalent bonding, (b) hydrogen
Physical Chemistry Practical Course, Oxford University. Determination of the Surface Area of Alumina by Nitrogen Adsorption at 77K (4 points)
") Physical Chemistry Practical Course, Oxford University 1.06 Determination of the Surface Area of Alumina by Nitrogen Adsorption at 77K (4 points) What you will do In this experiment you will study the
Physical Chemistry Practical Course, Oxford University 1.06 Determination of the Surface Area of Alumina by Nitrogen Adsorption at 77K (4 points) What you will do In this experiment you will study the
North American Stainless
 North American Stainless Flat Products Stainless Steel Grade Sheet 310S (S31008)/ EN 1.4845 Introduction: SS310 is a highly alloyed austenitic stainless steel designed for elevated-temperature service.
Plots, Curve-Fitting, and Data Modeling in Microsoft Excel
 Plots, Curve-Fitting, and Data Modeling in Microsoft Excel This handout offers some tips on making nice plots of data collected in your lab experiments, as well as instruction on how to use the built-in
Experiment #4, Ohmic Heat
 Experiment #4, Ohmic Heat 1 Purpose Physics 18 - Fall 013 - Experiment #4 1 1. To demonstrate the conversion of the electric energy into heat.. To demonstrate that the rate of heat generation in an electrical
Lösungen Übung Verformung
 Lösungen Übung Verformung 1. (a) What is the meaning of T G? (b) To which materials does it apply? (c) What effect does it have on the toughness and on the stress- strain diagram? 2. Name the four main
EXPERIMENT 2 THE HYDROLYSIS OF t-butyl CHLORIDE. PURPOSE: To verify a proposed mechanism for the hydrolysis of t-butyl Chloride.
 PURPOSE: To verify a proposed mechanism for the hydrolysis of t-butyl Chloride. PRINCIPLES: Once the Rate Law for a reaction has been experimentally established the next step is its explanation in terms
6.2 Solving Nonlinear Equations
 6.2. SOLVING NONLINEAR EQUATIONS 399 6.2 Solving Nonlinear Equations We begin by introducing a property that will be used extensively in this and future sections. The zero product property. If the product
Experiment 5: Phase diagram for a three-component system (Dated: April 12, 2010)
") Experiment 5: Phase diagram for a three-component system (Dated: April 12, 2010) I. INTRODUCTION It is sometimes necessary to know the mutual solubilities of liquids in a two-phase system. For example,
Experiment 5: Phase diagram for a three-component system (Dated: April 12, 2010) I. INTRODUCTION It is sometimes necessary to know the mutual solubilities of liquids in a two-phase system. For example,
Chapter 10 Temperature and Heat
 Chapter 10 Temperature and Heat What are temperature and heat? Are they the same? What causes heat? What Is Temperature? How do we measure temperature? What are we actually measuring? Temperature and Its
EXPERIMENTAL METHODS IN COLLOIDS AND SURFACES
 EXPERIMENTAL METHODS IN COLLOIDS AND SURFACES PARTICLE SURFACE AREA FROM GAS ADSORPTION TYPES OF ADSORPTION Physical adsorption: rapid, depends on adsorbate bulk concentration, multiple molecular layers
To measure the solubility of a salt in water over a range of temperatures and to construct a graph representing the salt solubility.
 THE SOLUBILITY OF A SALT IN WATER AT VARIOUS TEMPERATURES 2007, 1995, 1991 by David A. Katz. All rights reserved. Permission for academic use provided the original copyright is included. OBJECTIVE To measure
Scholars Research Library
 Available online at www.scholarsresearchlibrary.com Scholars Research Library Archives of Physics Research, 2010, 1 (2):103-111 (http://scholarsresearchlibrary.com/archive.html) ISSN 0976-0970 Lubricating
Why? Intermolecular Forces. Intermolecular Forces. Chapter 12 IM Forces and Liquids. Covalent Bonding Forces for Comparison of Magnitude
 1 Why? Chapter 1 Intermolecular Forces and Liquids Why is water usually a liquid and not a gas? Why does liquid water boil at such a high temperature for such a small molecule? Why does ice float on water?
3. Solve the equation containing only one variable for that variable.
 Question : How do you solve a system of linear equations? There are two basic strategies for solving a system of two linear equations and two variables. In each strategy, one of the variables is eliminated
2. Write the chemical formula(s) of the product(s) and balance the following spontaneous reactions.
 of the product(s) and balance the following spontaneous reactions.") 1. Using the Activity Series on the Useful Information pages of the exam write the chemical formula(s) of the product(s) and balance the following reactions. Identify all products phases as either (g)as,
1. Using the Activity Series on the Useful Information pages of the exam write the chemical formula(s) of the product(s) and balance the following reactions. Identify all products phases as either (g)as,
Chapter 18 Homework Answers
 Chapter 18 Homework Answers 18.22. 18.24. 18.26. a. Since G RT lnk, as long as the temperature remains constant, the value of G also remains constant. b. In this case, G G + RT lnq. Since the reaction
CHAPTER 12. Gases and the Kinetic-Molecular Theory
 CHAPTER 12 Gases and the Kinetic-Molecular Theory 1 Gases vs. Liquids & Solids Gases Weak interactions between molecules Molecules move rapidly Fast diffusion rates Low densities Easy to compress Liquids
States of Matter and the Kinetic Molecular Theory - Gr10 [CAPS]
![States of Matter and the Kinetic Molecular Theory - Gr10 [CAPS]](/thumbs/40/21739317.jpg "States of Matter and the Kinetic Molecular Theory - Gr10 [CAPS]") OpenStax-CNX module: m38210 1 States of Matter and the Kinetic Molecular Theory - Gr10 [CAPS] Free High School Science Texts Project This work is produced by OpenStax-CNX and licensed under the Creative
OpenStax-CNX module: m38210 1 States of Matter and the Kinetic Molecular Theory - Gr10 [CAPS] Free High School Science Texts Project This work is produced by OpenStax-CNX and licensed under the Creative
NTC Thermistor theory TABLE OF CONTENTS
 NTC Thermistor theory TABLE OF CONTENTS NTC Thermistor Theory................. Chip Configuration............................ Volume Resistivity-............................3 Resistance..................................
Materials Issues in Fatigue and Fracture
 Materials Issues in Fatigue and Fracture 5.1 Fundamental Concepts 5.2 Ensuring Infinite Life 5.3 Finite Life 5.4 Summary FCP 1 5.1 Fundamental Concepts Structural metals Process of fatigue A simple view
Designer: Nathan Kimball. Stage 1 Desired Results
 Interpolation Subject: Science, math Grade: 6-8 Time: 4 minutes Topic: Reading Graphs Designer: Nathan Kimball Stage 1 Desired Results Lesson Overview: In this activity students work with the direct linear
Chemistry 13: States of Matter
 Chemistry 13: States of Matter Name: Period: Date: Chemistry Content Standard: Gases and Their Properties The kinetic molecular theory describes the motion of atoms and molecules and explains the properties
SOLUBILITY, IONIC STRENGTH AND ACTIVITY COEFFICIENTS
 SOLUBILITY, IONIC STRENGTH AND ACTIVITY COEFFICIENTS References: 1. See `References to Experiments' for text references.. W. C. Wise and C. W. Davies, J. Chem. Soc., 73 (1938), "The Conductivity of Calcium
Chemistry B11 Chapter 4 Chemical reactions
 Chemistry B11 Chapter 4 Chemical reactions Chemical reactions are classified into five groups: A + B AB Synthesis reactions (Combination) H + O H O AB A + B Decomposition reactions (Analysis) NaCl Na +Cl
Evaluation copy. Build a Temperature Sensor. Project PROJECT DESIGN REQUIREMENTS
 Build a emperature Sensor Project A sensor is a device that measures a physical quantity and converts it into an electrical signal. Some sensors measure physical properties directly, while other sensors
Solidification, Crystallization & Glass Transition
 Solidification, Crystallization & Glass Transition Cooling the Melt solidification Crystallization versus Formation of Glass Parameters related to the formaton of glass Effect of cooling rate Glass transition
Using Freezing-Point Depression to Find Molecular Weight
 Usin Freezin-Point Depression to Find Molecular Weiht Experiment 15 When a solute is dissolved in a solvent, the freezin temperature is lowered in proportion to the number of moles of solute added. This
Stability of Evaporating Polymer Films. For: Dr. Roger Bonnecaze Surface Phenomena (ChE 385M)
") Stability of Evaporating Polymer Films For: Dr. Roger Bonnecaze Surface Phenomena (ChE 385M) Submitted by: Ted Moore 4 May 2000 Motivation This problem was selected because the writer observed a dependence
Stability of Evaporating Polymer Films For: Dr. Roger Bonnecaze Surface Phenomena (ChE 385M) Submitted by: Ted Moore 4 May 2000 Motivation This problem was selected because the writer observed a dependence
Figure 1. A voltaic cell Cu,Cu 2+ Ag +, Ag. gas is, by convention, assigned a reduction potential of 0.00 V.
 Voltaic Cells Introduction In this lab you will first prepare a set of simple standard half-cells and then measure the voltage between the half-cells with a voltmeter. From this data you will be able to