1 of 6 9/30/15, 4:49 PM
|
|
|
- Raymond Hubert Eaton
- 10 years ago
- Views:
Transcription
1 Student: Date: Instructor: Doug Ensley Course: MAT Applied Statistics - Ensley Assignment: Online 09 - Section In January 2011, the average monthly rental rate for one-bedroom apartments in a certain city was $ 811. Suppose rental rates across all one-bedroom apartments in this city follow approximately a normal distribution, with a standard deviation of $ 160. Find the approximate proportion of one-bedroom apartments for which the rental rate: a. is at least $1000 a month. b. is less than $500 a month. c. is between $500 and $1000 a month. a. The proportion of apartments with rent that is at least $1000 a month is. b. The proportion of apartments with rent less than $500 a month is. c. The proportion of apartments with rent between $500 and $1000 a month is. 2. A new roller coaster at an amusement park requires individuals to be at least 4' 8" ( 56 inches) tall to ride. It is estimated that the heights of 10-year-old boys are normally distributed with μ = 53.5 inches and σ = 5 inches. a. What proportion of 10-year-old boys is tall enough to ride the coaster? b. A smaller coaster has a height requirement of 50 inches to ride. What proportion of 10-year-old boys is tall enough to ride this coaster? c. What proportion of 10-year-old boys is tall enough to ride the coaster in part b but not tall enough to ride the coaster in part a? a. The proportion of 10-year-old boys tall enough to ride the coaster is. b. The proportion of 10 year-old-boys tall enough to ride the smaller coaster is. c. The proportion of 10-year-old boys tall enough to ride the coaster in part b but not tall enough to ride the coaster in part a is. 3. For one test's distribution ( μ = 386, σ = 109) and another test's distribution ( μ = 24, σ = 5) which score is relatively higher, a score of 672 on the first test or a score of 26 on the second test? Explain. Select the most appropriate answer from those below. A. The first score is relatively higher than the second score because the z-score of the score on the first test is equal to the z-score of the score on the second test. B. The test scores are equally high because the z-score of the score on the first test the z-score of the score on the second test. is equal to C. The first score is relatively higher than the second score because the z-score of the score on the first test is greater than the z-score of the score on the second test. D. The second score is relatively higher than the first score because the z-score of the score on the first test is less than the z-score of the score on the second test. 1 of 6 9/30/15, 4:49 PM

2 4. In January 2011, the average monthly rental rate for one-bedroom apartments in a certain city was $ 758. Suppose rental rates across all one-bedroom apartments in this city follow approximately a normal distribution, with a standard deviation of $ 180. Find the approximate proportion of one-bedroom apartments for which the rental rate: a. is at least $1000 a month. b. is less than $500 a month. c. is between $500 and $1000 a month. a. The proportion of apartments with rent that is at least $1000 a month is. b. The proportion of apartments with rent less than $500 a month is. c. The proportion of apartments with rent between $500 and $1000 a month is. 5. A new roller coaster at an amusement park requires individuals to be at least 4' 8" ( 56 inches) tall to ride. It is estimated that the heights of 10-year-old boys are normally distributed with μ = 53.5 inches and σ = 4 inches. a. What proportion of 10-year-old boys is tall enough to ride the coaster? b. A smaller coaster has a height requirement of 50 inches to ride. What proportion of 10-year-old boys is tall enough to ride this coaster? c. What proportion of 10-year-old boys is tall enough to ride the coaster in part b but not tall enough to ride the coaster in part a? a. The proportion of 10-year-old boys tall enough to ride the coaster is. b. The proportion of 10 year-old-boys tall enough to ride the smaller coaster is. c. The proportion of 10-year-old boys tall enough to ride the coaster in part b but not tall enough to ride the coaster in part a is. 6. A health study reported that, in one country, systolic blood pressure readings have a mean of 124 and a standard deviation of 13. A reading above 140 is considered to be high blood pressure. Complete parts a through d below. a. What is the z-score for a blood pressure reading of 140? z = (Round to two decimal places as needed.) b. If systolic blood pressure in that country has a normal distribution, what proportion of the population suffers from high blood pressure? The proportion with high blood pressure is. c. What proportion of the population has systolic blood pressure in the range from 102 to 140? The proportion with systolic blood pressure between 102 and 140 is. d. Find the 90th percentile of blood pressure readings. The 90th percentile of blood pressure readings is. (Round to the nearest whole number as needed.) 2 of 6 9/30/15, 4:49 PM

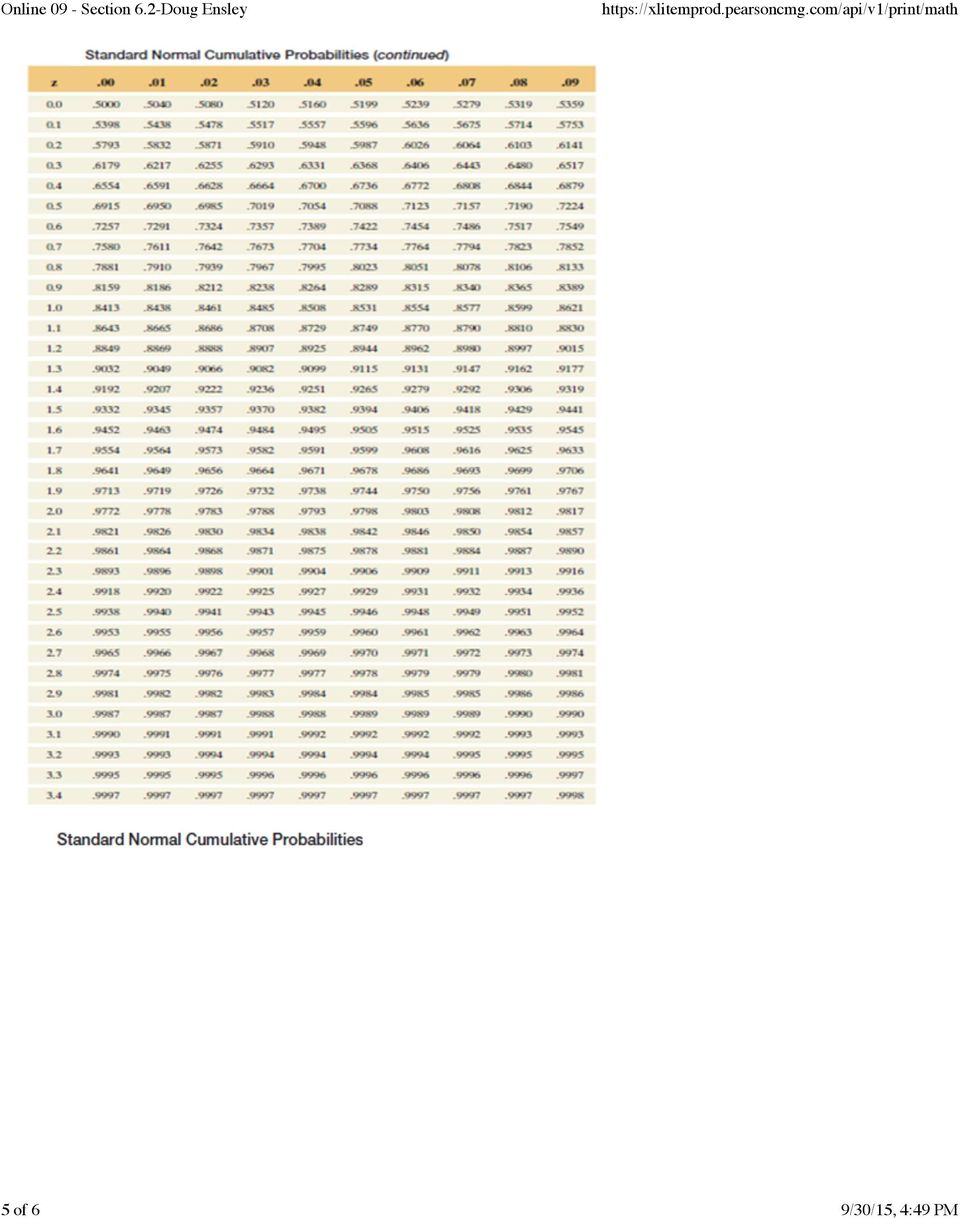
3 7. An index that is a standardized measure used in observing infants over time is approximately normal with a mean of 95 and a standard deviation of 12. Answer the questions below. Click here to view page 1 of the standard normal table. 1 Click here to view page 2 of the standard normal table. 2 a. What proportion of children have an index of (i) at least 119? (ii) at least 74? (i) The proportion of children having an index of at least 119 is. (ii) The proportion of children having an index of at least 74 is. b. Find the index score that is the 93rd percentile. The 93rd percentile index score is. (Round to two decimal places as needed.) c. Find the index score such that only 7% of the population has an index below it. 7% of the population have an index score below. (Round to two decimal places as needed.) 1: Standard normal table 3 of 6 9/30/15, 4:49 PM
 c. Find the index score such that only 7% of the population has an index below it.")
4 2: Standard normal table 4 of 6 9/30/15, 4:49 PM

5 5 of 6 9/30/15, 4:49 PM
6 C. The first score is relatively higher than the second score because the z-score of the score on the first test is greater than the z-score of the score on the second test of 6 9/30/15, 4:49 PM

MULTIPLE CHOICE. Choose the one alternative that best completes the statement or answers the question.
 Exam Name MULTIPLE CHOICE. Choose the one alternative that best completes the statement or answers the question. Find the mean for the given sample data. 1) Frank's Furniture employees earned the following
Def: The standard normal distribution is a normal probability distribution that has a mean of 0 and a standard deviation of 1.
 Lecture 6: Chapter 6: Normal Probability Distributions A normal distribution is a continuous probability distribution for a random variable x. The graph of a normal distribution is called the normal curve.
5) The table below describes the smoking habits of a group of asthma sufferers. two way table ( ( cell cell ) (cell cell) (cell cell) )
 The table below describes the smoking habits of a group of asthma sufferers. two way table ( ( cell cell ) (cell cell) (cell cell) )") MULTIPLE CHOICE. Choose the one alternative that best completes the statement or answers the question. Determine which score corresponds to the higher relative position. 1) Which score has a better relative
MULTIPLE CHOICE. Choose the one alternative that best completes the statement or answers the question. Determine which score corresponds to the higher relative position. 1) Which score has a better relative
MATH 103/GRACEY PRACTICE EXAM/CHAPTERS 2-3. MULTIPLE CHOICE. Choose the one alternative that best completes the statement or answers the question.
 MATH 3/GRACEY PRACTICE EXAM/CHAPTERS 2-3 Name MULTIPLE CHOICE. Choose the one alternative that best completes the statement or answers the question. Provide an appropriate response. 1) The frequency distribution
6.2 Normal distribution. Standard Normal Distribution:
 6.2 Normal distribution Slide Heights of Adult Men and Women Slide 2 Area= Mean = µ Standard Deviation = σ Donation: X ~ N(µ,σ 2 ) Standard Normal Distribution: Slide 3 Slide 4 a normal probability distribution
ALGEBRA 2/ TRIGONOMETRY
 The University of the State of New York REGENTS HIGH SCHOOL EXAMINATION ALGEBRA 2/ TRIGONOMETRY Wednesday, June 18, 2014 1:15 4:15 p.m. SAMPLE RESPONSE SET Table of Contents Question 28...................
Probability Distributions
 Learning Objectives Probability Distributions Section 1: How Can We Summarize Possible Outcomes and Their Probabilities? 1. Random variable 2. Probability distributions for discrete random variables 3.
UNIVERSITY OF TORONTO SCARBOROUGH Department of Computer and Mathematical Sciences Midterm Test March 2014
 UNIVERSITY OF TORONTO SCARBOROUGH Department of Computer and Mathematical Sciences Midterm Test March 2014 STAB22H3 Statistics I Duration: 1 hour and 45 minutes Last Name: First Name: Student number: Aids
Chapter 7 - Practice Problems 1
 Chapter 7 - Practice Problems 1 SHORT ANSWER. Write the word or phrase that best completes each statement or answers the question. Provide an appropriate response. 1) Define a point estimate. What is the
Classify the data as either discrete or continuous. 2) An athlete runs 100 meters in 10.5 seconds. 2) A) Discrete B) Continuous
 An athlete runs 100 meters in 10.5 seconds. 2) A) Discrete B) Continuous") Chapter 2 Overview Name MULTIPLE CHOICE. Choose the one alternative that best completes the statement or answers the question. Classify as categorical or qualitative data. 1) A survey of autos parked in
Chapter 2 Overview Name MULTIPLE CHOICE. Choose the one alternative that best completes the statement or answers the question. Classify as categorical or qualitative data. 1) A survey of autos parked in
The Normal Distribution
 Chapter 6 The Normal Distribution 6.1 The Normal Distribution 1 6.1.1 Student Learning Objectives By the end of this chapter, the student should be able to: Recognize the normal probability distribution
Normal distributions in SPSS
 Normal distributions in SPSS Bro. David E. Brown, BYU Idaho Department of Mathematics February 2, 2012 1 Calculating probabilities and percents from measurements: The CDF.NORMAL command 1. Go to the Variable
MULTIPLE CHOICE. Choose the one alternative that best completes the statement or answers the question.
 Final Exam Review MULTIPLE CHOICE. Choose the one alternative that best completes the statement or answers the question. 1) A researcher for an airline interviews all of the passengers on five randomly
Online 12 - Sections 9.1 and 9.2-Doug Ensley
 Student: Date: Instructor: Doug Ensley Course: MAT117 01 Applied Statistics - Ensley Assignment: Online 12 - Sections 9.1 and 9.2 1. Does a P-value of 0.001 give strong evidence or not especially strong
Chapter 3. The Normal Distribution
 Chapter 3. The Normal Distribution Topics covered in this chapter: Z-scores Normal Probabilities Normal Percentiles Z-scores Example 3.6: The standard normal table The Problem: What proportion of observations
z-scores AND THE NORMAL CURVE MODEL
 z-scores AND THE NORMAL CURVE MODEL 1 Understanding z-scores 2 z-scores A z-score is a location on the distribution. A z- score also automatically communicates the raw score s distance from the mean A
Mind on Statistics. Chapter 8
 Mind on Statistics Chapter 8 Sections 8.1-8.2 Questions 1 to 4: For each situation, decide if the random variable described is a discrete random variable or a continuous random variable. 1. Random variable
STATISTICS 8: CHAPTERS 7 TO 10, SAMPLE MULTIPLE CHOICE QUESTIONS
 STATISTICS 8: CHAPTERS 7 TO 10, SAMPLE MULTIPLE CHOICE QUESTIONS 1. If two events (both with probability greater than 0) are mutually exclusive, then: A. They also must be independent. B. They also could
Math 201: Statistics November 30, 2006
 Math 201: Statistics November 30, 2006 Fall 2006 MidTerm #2 Closed book & notes; only an A4-size formula sheet and a calculator allowed; 90 mins. No questions accepted! Instructions: There are eleven pages
Amusement Park Project
 Amusement Park Project Introduction Astroworld has recently received state and local approval to add two new rollercoasters to their amusement park. The new rides will demonstrate some of the basic laws
16 21 Linear vs. Exponential.notebook May 14, 2014. LT 1c: I can compare linear vs. exponential change.
 LT 1c: I can compare linear vs. exponential change. The Situation: You have $1,000 saved. Now, you need to figure out which bank you want to invest your money in. You can choose from the following two
Healthcare Math: Converting Measurements & Calculating Dosage per Body Weight
 Healthcare Math: Converting Measurements & Calculating Dosage per Body Weight Industry: Healthcare Content Area: Mathematics Core Topics: Using the metric system, converting units of measurement using
Probability. Distribution. Outline
 7 The Normal Probability Distribution Outline 7.1 Properties of the Normal Distribution 7.2 The Standard Normal Distribution 7.3 Applications of the Normal Distribution 7.4 Assessing Normality 7.5 The
EXAM #1 (Example) Instructor: Ela Jackiewicz. Relax and good luck!
 Instructor: Ela Jackiewicz. Relax and good luck!") STP 231 EXAM #1 (Example) Instructor: Ela Jackiewicz Honor Statement: I have neither given nor received information regarding this exam, and I will not do so until all exams have been graded and returned.
STP 231 EXAM #1 (Example) Instructor: Ela Jackiewicz Honor Statement: I have neither given nor received information regarding this exam, and I will not do so until all exams have been graded and returned.
Mean Absolute Deviation
 Lesson 12 Main Idea Find and interpret the mean absolute deviation for a set of data. New Vocabulary mean absolute deviation Math Online glencoe.com 6.SP.c CELL PHONES The table shows the number of contacts
Lecture 2: Discrete Distributions, Normal Distributions. Chapter 1
 Lecture 2: Discrete Distributions, Normal Distributions Chapter 1 Reminders Course website: www. stat.purdue.edu/~xuanyaoh/stat350 Office Hour: Mon 3:30-4:30, Wed 4-5 Bring a calculator, and copy Tables
A Percentile is a number in a SORTED LIST that has a given percentage of the data below it.
 Section 3 3B: Percentiles A Percentile is a number in a SORTED LIST that has a given percentage of the data below it. If n represents the 70 th percentile then 70% of the data is less than n We use the
Lesson 7 Z-Scores and Probability
 Lesson 7 Z-Scores and Probability Outline Introduction Areas Under the Normal Curve Using the Z-table Converting Z-score to area -area less than z/area greater than z/area between two z-values Converting
MULTIPLE CHOICE. Choose the one alternative that best completes the statement or answers the question. C) (a) 2. (b) 1.5. (c) 0.5-2.
 (a) 2. (b) 1.5. (c) 0.5-2.") Stats: Test 1 Review Name MULTIPLE CHOICE. Choose the one alternative that best completes the statement or answers the question. Use the given frequency distribution to find the (a) class width. (b) class
Stats: Test 1 Review Name MULTIPLE CHOICE. Choose the one alternative that best completes the statement or answers the question. Use the given frequency distribution to find the (a) class width. (b) class
Name: Date: Use the following to answer questions 3-4:
 Name: Date: 1. Determine whether each of the following statements is true or false. A) The margin of error for a 95% confidence interval for the mean increases as the sample size increases. B) The margin
MULTIPLE CHOICE. Choose the one alternative that best completes the statement or answers the question. A) 0.4987 B) 0.9987 C) 0.0010 D) 0.
 0.4987 B) 0.9987 C) 0.0010 D) 0.") Ch. 5 Normal Probability Distributions 5.1 Introduction to Normal Distributions and the Standard Normal Distribution 1 Find Areas Under the Standard Normal Curve 1) Find the area under the standard normal
Ch. 5 Normal Probability Distributions 5.1 Introduction to Normal Distributions and the Standard Normal Distribution 1 Find Areas Under the Standard Normal Curve 1) Find the area under the standard normal
How To Calculate Confidence Intervals In A Population Mean
 Chapter 8 Confidence Intervals 8.1 Confidence Intervals 1 8.1.1 Student Learning Objectives By the end of this chapter, the student should be able to: Calculate and interpret confidence intervals for one
consider the number of math classes taken by math 150 students. how can we represent the results in one number?
 ch 3: numerically summarizing data - center, spread, shape 3.1 measure of central tendency or, give me one number that represents all the data consider the number of math classes taken by math 150 students.
Key Concept. Density Curve
 MAT 155 Statistical Analysis Dr. Claude Moore Cape Fear Community College Chapter 6 Normal Probability Distributions 6 1 Review and Preview 6 2 The Standard Normal Distribution 6 3 Applications of Normal
AP Statistics Solutions to Packet 2
 AP Statistics Solutions to Packet 2 The Normal Distributions Density Curves and the Normal Distribution Standard Normal Calculations HW #9 1, 2, 4, 6-8 2.1 DENSITY CURVES (a) Sketch a density curve that
Lesson 1: Posing Statistical Questions
 Student Outcomes Students distinguish between statistical questions and those that are not statistical. Students formulate a statistical question and explain what data could be collected to answer the
Variables. Exploratory Data Analysis
 Exploratory Data Analysis Exploratory Data Analysis involves both graphical displays of data and numerical summaries of data. A common situation is for a data set to be represented as a matrix. There is
Chapter 1: Exploring Data
 Chapter 1: Exploring Data Chapter 1 Review 1. As part of survey of college students a researcher is interested in the variable class standing. She records a 1 if the student is a freshman, a 2 if the student
7. Normal Distributions
 7. Normal Distributions A. Introduction B. History C. Areas of Normal Distributions D. Standard Normal E. Exercises Most of the statistical analyses presented in this book are based on the bell-shaped
Course 2 Summer Packet For students entering 8th grade in the fall
 Course 2 Summer Packet For students entering 8th grade in the fall The summer packet is comprised of important topics upcoming eighth graders should know upon entering math in the fall. Please use your
6.4 Normal Distribution
 Contents 6.4 Normal Distribution....................... 381 6.4.1 Characteristics of the Normal Distribution....... 381 6.4.2 The Standardized Normal Distribution......... 385 6.4.3 Meaning of Areas under
Lecture 14. Chapter 7: Probability. Rule 1: Rule 2: Rule 3: Nancy Pfenning Stats 1000
 Lecture 4 Nancy Pfenning Stats 000 Chapter 7: Probability Last time we established some basic definitions and rules of probability: Rule : P (A C ) = P (A). Rule 2: In general, the probability of one event
Name Please Print MULTIPLE CHOICE. Choose the one alternative that best completes the statement or answers the question.
 Review Problems for Mid-Term 1, Fall 2012 (STA-120 Cal.Poly. Pomona) Name Please Print MULTIPLE CHOICE. Choose the one alternative that best completes the statement or answers the question. Determine whether
Math. Rounding Decimals. Answers. 1) Round to the nearest tenth. 8.54 8.5. 2) Round to the nearest whole number. 99.59 100
 Round to the nearest tenth. 8.54 8.5. 2) Round to the nearest whole number. 99.59 100") 1) Round to the nearest tenth. 8.54 8.5 2) Round to the nearest whole number. 99.59 100 3) Round to the nearest tenth. 310.286 310.3 4) Round to the nearest whole number. 6.4 6 5) Round to the nearest
1) Round to the nearest tenth. 8.54 8.5 2) Round to the nearest whole number. 99.59 100 3) Round to the nearest tenth. 310.286 310.3 4) Round to the nearest whole number. 6.4 6 5) Round to the nearest
Calculating financial position and cash flow indicators
 Calculating financial position and cash flow indicators Introduction When a business is deciding whether to grant credit to a potential customer, or whether to continue to grant credit terms to an existing
Mathematics and Statistics: Apply probability methods in solving problems (91267)
") NCEA Level 2 Mathematics (91267) 2013 page 1 of 5 Assessment Schedule 2013 Mathematics and Statistics: Apply probability methods in solving problems (91267) Evidence Statement with Merit Apply probability
NCEA Level 2 Mathematics (91267) 2013 page 1 of 5 Assessment Schedule 2013 Mathematics and Statistics: Apply probability methods in solving problems (91267) Evidence Statement with Merit Apply probability
2.6. Probability. In general the probability density of a random variable satisfies two conditions:
 2.6. PROBABILITY 66 2.6. Probability 2.6.. Continuous Random Variables. A random variable a real-valued function defined on some set of possible outcomes of a random experiment; e.g. the number of points
Roller Coaster Project December 6, 2008. Tommy Wulz Carson Barnes Aaron Morris Joe Yantis Julianne Swafford
 Roller Coaster Project December 6, 2008 Tommy Wulz Carson Barnes Aaron Morris Joe Yantis Julianne Swafford Abstract Our roller coaster, How the West was Won, is made out of plastic tubing that is ½ inch
. 58 58 60 62 64 66 68 70 72 74 76 78 Father s height (inches)
") PEARSON S FATHER-SON DATA The following scatter diagram shows the heights of 1,0 fathers and their full-grown sons, in England, circa 1900 There is one dot for each father-son pair Heights of fathers and
PEARSON S FATHER-SON DATA The following scatter diagram shows the heights of 1,0 fathers and their full-grown sons, in England, circa 1900 There is one dot for each father-son pair Heights of fathers and
Loans Practice. Math 107 Worksheet #23
 Math 107 Worksheet #23 Loans Practice M P r ( 1 + r) n ( 1 + r) n =, M = the monthly payment; P = the original loan amount; r = the monthly interest rate; n = number of payments 1 For each of the following,
MULTIPLE CHOICE. Choose the one alternative that best completes the statement or answers the question. A) ±1.88 B) ±1.645 C) ±1.96 D) ±2.
 ±1.88 B) ±1.645 C) ±1.96 D) ±2.") Ch. 6 Confidence Intervals 6.1 Confidence Intervals for the Mean (Large Samples) 1 Find a Critical Value 1) Find the critical value zc that corresponds to a 94% confidence level. A) ±1.88 B) ±1.645 C)
Ch. 6 Confidence Intervals 6.1 Confidence Intervals for the Mean (Large Samples) 1 Find a Critical Value 1) Find the critical value zc that corresponds to a 94% confidence level. A) ±1.88 B) ±1.645 C)
Section 7.1 Solving Right Triangles
 Section 7.1 Solving Right Triangles Note that a calculator will be needed for most of the problems we will do in class. Test problems will involve angles for which no calculator is needed (e.g., 30, 45,
Activity 3.7 Statistical Analysis with Excel
 Activity 3.7 Statistical Analysis with Excel Introduction Engineers use various tools to make their jobs easier. Spreadsheets can greatly improve the accuracy and efficiency of repetitive and common calculations;
Review. March 21, 2011. 155S7.1 2_3 Estimating a Population Proportion. Chapter 7 Estimates and Sample Sizes. Test 2 (Chapters 4, 5, & 6) Results
 Results") MAT 155 Statistical Analysis Dr. Claude Moore Cape Fear Community College Chapter 7 Estimates and Sample Sizes 7 1 Review and Preview 7 2 Estimating a Population Proportion 7 3 Estimating a Population
MAT 155 Statistical Analysis Dr. Claude Moore Cape Fear Community College Chapter 7 Estimates and Sample Sizes 7 1 Review and Preview 7 2 Estimating a Population Proportion 7 3 Estimating a Population
Section 1.5 Linear Models
 Section 1.5 Linear Models Some real-life problems can be modeled using linear equations. Now that we know how to find the slope of a line, the equation of a line, and the point of intersection of two lines,
TEST A CHAPTER 6, EQUATIONS, INEQUALITIES, PROBLEM SOLVING. 1. Factor x 2-5x + 6. 2. Factor x 2-4x - 5.
 TEST A CHAPTER 6, EQUATIONS, INEQUALITIES, PROBLEM SOLVING. Factor x 2-5x + 6. 2. Factor x 2-4x - 5. 3. Solve: (x + 2)(x - 3) = 0 x(x - 3)(x + 4) = 0 4. Solve by factoring: x 2 + x + 2 = 0. 5. Solve by
Review #2. Statistics
 Review #2 Statistics Find the mean of the given probability distribution. 1) x P(x) 0 0.19 1 0.37 2 0.16 3 0.26 4 0.02 A) 1.64 B) 1.45 C) 1.55 D) 1.74 2) The number of golf balls ordered by customers of
Sample Problems. Practice Problems
 Lecture Notes Quadratic Word Problems page 1 Sample Problems 1. The sum of two numbers is 31, their di erence is 41. Find these numbers.. The product of two numbers is 640. Their di erence is 1. Find these
Parallel and Perpendicular. We show a small box in one of the angles to show that the lines are perpendicular.
 CONDENSED L E S S O N. Parallel and Perpendicular In this lesson you will learn the meaning of parallel and perpendicular discover how the slopes of parallel and perpendicular lines are related use slopes
WISE Sampling Distribution of the Mean Tutorial
 Name Date Class WISE Sampling Distribution of the Mean Tutorial Exercise 1: How accurate is a sample mean? Overview A friend of yours developed a scale to measure Life Satisfaction. For the population
STATISTICS 8, FINAL EXAM. Last six digits of Student ID#: Circle your Discussion Section: 1 2 3 4
 STATISTICS 8, FINAL EXAM NAME: KEY Seat Number: Last six digits of Student ID#: Circle your Discussion Section: 1 2 3 4 Make sure you have 8 pages. You will be provided with a table as well, as a separate
6 3 The Standard Normal Distribution
 290 Chapter 6 The Normal Distribution Figure 6 5 Areas Under a Normal Distribution Curve 34.13% 34.13% 2.28% 13.59% 13.59% 2.28% 3 2 1 + 1 + 2 + 3 About 68% About 95% About 99.7% 6 3 The Distribution Since
1.1 Practice Worksheet
 Math 1 MPS Instructor: Cheryl Jaeger Balm 1 1.1 Practice Worksheet 1. Write each English phrase as a mathematical expression. (a) Three less than twice a number (b) Four more than half of a number (c)
Second Midterm Exam (MATH1070 Spring 2012)
") Second Midterm Exam (MATH1070 Spring 2012) Instructions: This is a one hour exam. You can use a notecard. Calculators are allowed, but other electronics are prohibited. 1. [60pts] Multiple Choice Problems
Second Midterm Exam (MATH1070 Spring 2012) Instructions: This is a one hour exam. You can use a notecard. Calculators are allowed, but other electronics are prohibited. 1. [60pts] Multiple Choice Problems
School Ranking Business Rules. Short Narrative Version
 School Ranking Business Rules Short Narrative Version Persistently Lowest Achieving Schools for MCL 380.1280c, SFSFII and SIG Applications To identify the persistently lowest performing schools the Michigan
MEASURES OF VARIATION
 NORMAL DISTRIBTIONS MEASURES OF VARIATION In statistics, it is important to measure the spread of data. A simple way to measure spread is to find the range. But statisticians want to know if the data are
Objectives. 6.1, 7.1 Estimating with confidence (CIS: Chapter 10) CI)
 CI)") Objectives 6.1, 7.1 Estimating with confidence (CIS: Chapter 10) Statistical confidence (CIS gives a good explanation of a 95% CI) Confidence intervals. Further reading http://onlinestatbook.com/2/estimation/confidence.html
Objectives 6.1, 7.1 Estimating with confidence (CIS: Chapter 10) Statistical confidence (CIS gives a good explanation of a 95% CI) Confidence intervals. Further reading http://onlinestatbook.com/2/estimation/confidence.html
Calculating performance indicators - liquidity
 Calculating performance indicators - liquidity Introduction When a business is deciding whether to grant credit to a potential customer, or whether to continue to grant credit terms to an existing customer,
Grade 2 Level. Math Common Core Sampler Test
 Grade 2 Level Math Common Core Sampler Test Everyone we come in contact with is scrambling to get their hands on example questions for this grade level. This test sampler is put together to give you an
CSL105: Discrete Mathematical Structures. Ragesh Jaiswal, CSE, IIT Delhi
 Propositional Logic: logical operators Negation ( ) Conjunction ( ) Disjunction ( ). Exclusive or ( ) Conditional statement ( ) Bi-conditional statement ( ): Let p and q be propositions. The biconditional
Ch. 3.1 # 3, 4, 7, 30, 31, 32
 Math Elementary Statistics: A Brief Version, 5/e Bluman Ch. 3. # 3, 4,, 30, 3, 3 Find (a) the mean, (b) the median, (c) the mode, and (d) the midrange. 3) High Temperatures The reported high temperatures
Shape of Data Distributions
 Lesson 13 Main Idea Describe a data distribution by its center, spread, and overall shape. Relate the choice of center and spread to the shape of the distribution. New Vocabulary distribution symmetric
Box-and-Whisker Plots
 Learning Standards HSS-ID.A. HSS-ID.A.3 3 9 23 62 3 COMMON CORE.2 Numbers of First Cousins 0 3 9 3 45 24 8 0 3 3 6 8 32 8 0 5 4 Box-and-Whisker Plots Essential Question How can you use a box-and-whisker
Algebra and Functions Practice Quiz #1
 Help Profile My Bookmarks Logout Algebra and Functions Practice Quiz #1 20 Questions Directions: This quiz contains two types of questions. For questions 1-15, solve each problem and decide which is the
3.2 Measures of Spread
 3.2 Measures of Spread In some data sets the observations are close together, while in others they are more spread out. In addition to measures of the center, it's often important to measure the spread
2. In solving percent problems with a proportion, use the following pattern:
 HFCC Learning Lab PERCENT WORD PROBLEMS Arithmetic - 11 Many percent problems can be solved using a proportion. In order to use this method, you should be familiar with the following ideas about percent:
PERFORMANCE APPRAISAL
 PERFORMANCE APPRAISAL Name: Department: Hire Date: Position Title: Cost Centre: Review Period: RATING SCALE In order to obtain an effective rating, goals need to be Specific, Measurable, Adds Value, Realistic
SHORT ANSWER. Write the word or phrase that best completes each statement or answers the question. Regular smoker
 Exam Chapters 4&5 Review SHORT ANSWER. Write the word or phrase that best completes each statement or answers the question. Provide an appropriate response. 1) A 28-year-old man pays $181 for a one-year
PRACTICE PROBLEMS FOR BIOSTATISTICS
 PRACTICE PROBLEMS FOR BIOSTATISTICS BIOSTATISTICS DESCRIBING DATA, THE NORMAL DISTRIBUTION 1. The duration of time from first exposure to HIV infection to AIDS diagnosis is called the incubation period.
East Los Angeles College. Section 1806 C2 127A MT ThF 10:35AM 12:00noon MyMathLab CourseID:
 East Los Angeles College MATH 105 Arithmetic Section 1806 C2 127A MT ThF 10:35AM 12:00noon MyMathLab CourseID: faradineh12885 Instructor: Office Hours: Rahim Faradineh, Phone: 323-260-8129, email: [email protected]
Math 251: Practice Questions Hints and Answers. Part I. Questions from Chapters 1 3
 I.A: Levels of Data, Types of Samples Math 251: Practice Questions Hints and Answers Part I. Questions from Chapters 1 3 I.A.1. Categorize the following data according to level: nominal, ordinal, interval,
VOLUME of Rectangular Prisms Volume is the measure of occupied by a solid region.
 Math 6 NOTES 7.5 Name VOLUME of Rectangular Prisms Volume is the measure of occupied by a solid region. **The formula for the volume of a rectangular prism is:** l = length w = width h = height Study Tip:
2nd Semester Geometry Final Exam Review
 Class: Date: 2nd Semester Geometry Final Exam Review Multiple Choice Identify the choice that best completes the statement or answers the question. 1. The owner of an amusement park created a circular
MULTIPLE CHOICE. Choose the one alternative that best completes the statement or answers the question.
 Exam Name MULTIPLE CHOICE. Choose the one alternative that best completes the statement or answers the question. 1) The government of a town needs to determine if the city's residents will support the
1) The table lists the smoking habits of a group of college students. Answer: 0.218
 The table lists the smoking habits of a group of college students. Answer: 0.218") FINAL EXAM REVIEW Name ) The table lists the smoking habits of a group of college students. Sex Non-smoker Regular Smoker Heavy Smoker Total Man 5 52 5 92 Woman 8 2 2 220 Total 22 2 If a student is chosen
FINAL EXAM REVIEW Name ) The table lists the smoking habits of a group of college students. Sex Non-smoker Regular Smoker Heavy Smoker Total Man 5 52 5 92 Woman 8 2 2 220 Total 22 2 If a student is chosen
Practice#1(chapter1,2) Name
 Name") Practice#1(chapter1,2) Name Solve the problem. 1) The average age of the students in a statistics class is 22 years. Does this statement describe descriptive or inferential statistics? A) inferential statistics
Practice#1(chapter1,2) Name Solve the problem. 1) The average age of the students in a statistics class is 22 years. Does this statement describe descriptive or inferential statistics? A) inferential statistics
TABLE OF CONTENTS Click on a title to go directly to the handout. Handout 2: Estimating Challenge. Handout 3: Din-O-Rama Exploration
 SCALE CITY The Road to Proportional Reasoning: Dinosaur World Handouts TABLE OF CONTENTS Click on a title to go directly to the handout. Handout 1: Review: Fractions, Decimals, and Percents Problems assessing
Percent, Sales Tax, & Discounts
 Percent, Sales Tax, & Discounts Many applications involving percent are based on the following formula: Note that of implies multiplication. Suppose that the local sales tax rate is 7.5% and you purchase
Exploratory data analysis (Chapter 2) Fall 2011
 Fall 2011") Exploratory data analysis (Chapter 2) Fall 2011 Data Examples Example 1: Survey Data 1 Data collected from a Stat 371 class in Fall 2005 2 They answered questions about their: gender, major, year in school,
Exploratory data analysis (Chapter 2) Fall 2011 Data Examples Example 1: Survey Data 1 Data collected from a Stat 371 class in Fall 2005 2 They answered questions about their: gender, major, year in school,
Final Word Problem Practice #1
 Final Word Problem Practice #1 Beginning Algebra / Math 100 Fall 2013 506 (Prof. Miller) Student Name/ID: Instructor Note: Assignment: Set up a tutoring appointment with one of the campus tutors or with
6. Decide which method of data collection you would use to collect data for the study (observational study, experiment, simulation, or survey):
:") MATH 1040 REVIEW (EXAM I) Chapter 1 1. For the studies described, identify the population, sample, population parameters, and sample statistics: a) The Gallup Organization conducted a poll of 1003 Americans
MATH 1040 REVIEW (EXAM I) Chapter 1 1. For the studies described, identify the population, sample, population parameters, and sample statistics: a) The Gallup Organization conducted a poll of 1003 Americans
MATH 140 HYBRID INTRODUCTORY STATISTICS COURSE SYLLABUS
 MATH 140 HYBRID INTRODUCTORY STATISTICS COURSE SYLLABUS Instructor: Mark Schilling Email: [email protected] (Note: If your CSUN email address is not one you use regularly, be sure to set up automatic
The University of the State of New York REGENTS HIGH SCHOOL EXAMINATION INTEGRATED ALGEBRA. Tuesday, January 22, 2013 9:15 a.m. SAMPLE RESPONSE SET
 The University of the State of New York REGENTS HIGH SCHOOL EXAMINATION INTEGRATED ALGEBRA Tuesday, January 22, 2013 9:15 a.m. SAMPLE RESPONSE SET Table of Contents Practice Papers Question 31.......................
Math Journal HMH Mega Math. itools Number
 Lesson 1.1 Algebra Number Patterns CC.3.OA.9 Identify arithmetic patterns (including patterns in the addition table or multiplication table), and explain them using properties of operations. Identify and
5.4 Solving Percent Problems Using the Percent Equation
 5. Solving Percent Problems Using the Percent Equation In this section we will develop and use a more algebraic equation approach to solving percent equations. Recall the percent proportion from the last
Introduction Assignment
 Physics 11 Introduction Assignment This assignment is intended to familiarize you with some of the basic concepts and skills related to Physics 11. This is the first meaningful assignment for Physics 11,
Descriptive Statistics
 Descriptive Statistics Primer Descriptive statistics Central tendency Variation Relative position Relationships Calculating descriptive statistics Descriptive Statistics Purpose to describe or summarize