Television Optimizers: Did They Change the Way We Do Business?
|
|
|
- Kory Montgomery
- 8 years ago
- Views:
Transcription
1 Journal of Advertising Research Vol. 45, No. 1, Mar Television Optimizers: Did They Change the Way We Do Business? Andrew Green ZenithOptimedia, Inc. INTRODUCTION In the spring of 1997, four U.S. advertising agencies started preparing for an important new business pitch. Procter & Gamble (P&G) had announced that it was putting its $1 billion television agency-of-record assignment up for review one that would encompass not only traditional buying of airtime, but also what was termed tactical planning. Tactical planning of television a role traditionally played by the buyer in markets like the United Kingdom but by the planner in the United States encompasses the discipline of determining the daypart, channel, and program genre mix for a schedule that aims to maximize campaign effectiveness (however defined) for a given budget. The agencies involved were told by P&G that they needed to master a procedure long computerized in northern Europe and parts of Asia that of schedule optimization. Optimization, as practiced in Europe, defined effectiveness as reaching as many of the target audience as possible, at whatever frequency level was required, for a given budget. The optimizer does this by analyzing historical audiences and making recommendations on the appropriate mix of dayparts and programs for the future, taking into account costs, audiences, and any other factors that may be considered important. BACKGROUND: CHALLENGES The challenges were both technical and cultural: technical because the optimizers needed a dataset that had not hitherto been released by Nielsen; cultural because planners and buyers operate on different assumptions and prioritize different metrics in the United States than they do elsewhere. This was important because there were no home-grown optimizers in the market. Systems had been built in other countries: France, Italy, Australia, and Germany to name but a few. But it was to the home of optimizers in the United Kingdom that the U.S. agencies turned. Leading systems in use there X*Pert and Super Midas were identified as prime candidates for adaptation. The process of optimizing media schedules was not exactly new in the United States. As long ago as 1961, David Learner of BBDO had presented to the Eastern Annual Conference of the American Association of Advertising Agencies on the subject (Learner, 1961). A book published a few years later by two professors of American universities had gone into great detail about the optimization procedure. Much of what they said is as relevant today as it was then: Mathematical programming is a systematic approach to problems and represents one of the primary tools or techniques which are grouped loosely under the name of operations research. The essential steps are as follows: 1. A clear statement of definitions and philosophy relating to the problem; 2. Careful formulation of the problem, indicating relationships and weights of the various factors involved and the kinds of data required; 3. Assembly of appropriate data of sufficient accuracy for solving the problem; 4. Choosing or developing a mathematical model or formula which is capable of being solved, with all the variables indicated in the problem formulation; 5. Turning over the materials to a technician to program and solve the problem, usually by means of a high-speed computer; 6. Applying human judgment to examine the outcome to make substitutions or alterations and to arrive at a solution which meets with human judgment and experience" (Lucas and Britt, 1963). With the exception of point 5 computers are far more powerful today than they were then and can as easily be used by media planners as by specialist technicians little has changed. Point 6 can never be emphasized enough. The next issue for the industry was to access the data that these systems needed to carry out their functions. Many European and Asian audience research services provided respondent-level data to customers as a matter of course. Yet although a number of broadcasters had accessed this level of information in the United States, it had not been widely available. Special analysis using these data made up a good

2 part of Nielsen's profit one it was reluctant to give up. In the end, prompted by the agencies, Nielsen released partial datasets starting with national broadcast and later extending to cable and syndication for a hefty fee. If the optimization revolution of the late 1990s achieved anything, this will surely be remembered as one of the most important breakthroughs. The data were partial in the sense that full minute-by-minute data were not released by Nielsen (this only happened finally in October 2005 after a long battle with the industry). Instead, the mid minute of each quarter hour was presented as a surrogate for the full dataset. In order to work, an optimizer must be fed certain other information by its users. This includes cost information, a definition of the dayparts and channels to be used (and in which the output will be set out), the target audience, and the historical period to be used for the analysis. One problem that had to be overcome was how exactly to enter cost data when unit costs as such did not exist in the market. Most advertisers work with pre-negotiated and guaranteed cost-per-thousand exposures (CPMs). Negotiations typically involve agreeing a package of specific programs in return for a schedule CPM related to the advertiser's previous year buy. Changing the program mix means changing the terms of the negotiation, and some buyers questioned the usefulness of going through an essentially hypothetical exercise of trying out different combinations of channels and dayparts when costs are unknown. In addition, there were issues alluded to by Lucas and Britt (1963) of what additional, subjective weights should be applied to different dayparts and programs. MOVING FORWARD Nevertheless, ways were found to address these issues and, at the very least, optimizers could be used to benchmark reach performance. For example, a buyer could check the reach performance of various schedules at a given budget level. He could then judge whether any of the per-mutations were realistic in the market-place using his own judgment. The optimization process makes transparent the inevitable price and quality trade-offs involved in media planning does higher reach lead to higher CPMs or a lower quality of programs? Will the resultant daypart or channel mix be acceptable to the trade distribution partners of the big advertisers? The P&G pitch forced agencies to look at new ways of scheduling airtime. The question we ask several years later is: Did it change the way agencies and the networks did business, or has the media planning and buying world reverted back to its old way of doing things? THE OMD OPTIMIZER STUDY: 1999 VERSUS 1996 Late in 2000, media agency OMD examined the overall experience of the top television advertisers in using optimizers. It was not possible to know for every advertiser the exact extent to which optimizers had been employed on their brand scheduling; instead OMD tested two hypotheses that it was felt would throw light on whether or not optimizers did have an impact on the way television campaigns were planned and bought: H1: Advertisers would lower weekly weight and add weeks to their annual campaigns. The rationale behind this hypothesis was the popularization of recency theory the idea that the number of net weekly reach points [as opposed to gross rating points (GRP)] should be maximized across a year to generate maximum potential opportunities to deliver a message close to purchase (Ephron, 1997, 1998). The role of optimizers would be to show advertisers how to do this. H2: Money and campaign ratings would be dispersed across a wider number of channels and dayparts. The basis of this idea was that reach-oriented schedules would need to use a broader cross section of channels and dayparts. Conversely, schedules that concentrated on a few channels and dayparts would tend to reach the same people more often a frequency strategy. METHODOLOGY To test these hypotheses, OMD carried out an analysis of CMR's advertising expenditure database. At the time, CMR monitored all brand advertising across 11 media types in the U.S. market. In 2000, this encompassed 341,000 different brands. Just under 5,000 brands advertised on national television. Two different years were selected 1996 and was the last full year before optimizers were introduced into the market the preoptimizer year. Most agencies representing the largest television brands would have been able to purchase working systems with respondent-level data access by the second half of As a result, 1999 was chosen as the postoptimizer year. To keep the database manageable, OMD settled on the top 77 brands advertising on national television in This consisted of brands in the top 100 rankings in 1999 that were also present in the top rankings in These brands accounted for a surprisingly large 21 percent of total national television spend in the later year and represented the base. Schedules for this same set of brands were aggregated for both years and compared according to four criteria: the number of active weeks out of 52 (national and local TV)
.")
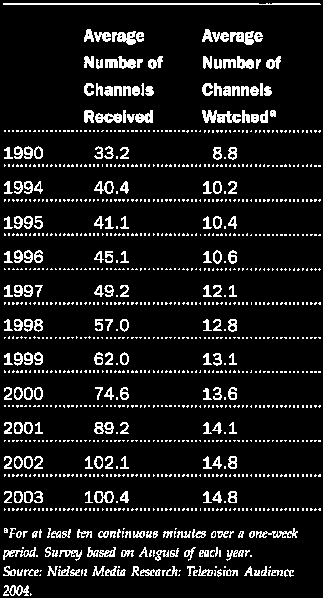
3 average weekly household ratings delivery (national and local TV) number of different channels used during the year (national TV only) percentage of household ratings delivered by daypart (national and local TV) RESULTS Greater Continuity, Higher Weight As Table 1 shows, there was evidence that top television advertisers had extended their presence by 1999 to virtually year-round, with almost no weeks off-air. This does not itself prove that optimizers were suddenly adopted by the industry; however, the strong resonance being provided by the recency planning debate at the time and the fact that optimizers could show advertisers how to maximize the number of weekly reach points over a period of time provide at least circumstantial evidence in its favor. There was no evidence, on the other hand, that advertisers lowered weekly weight to achieve greater continuity of on-air activity. The average top-ranking brand actually increased its weekly weight by more than 20 percent at the same time as adding weeks over this short period. This may have been driven by improving economic prospects, increased competition between brands, and greater on-air message clutter, forcing advertisers to add weight in order to gain cut-through. More Dispersion As for our hypothesis on dispersion, the evidence shows that advertisers were using more channels than before to reach their target audiences. This trend was in line with the kinds of recommendation suggested by the optimizers for obtaining the highest reach for the lowest amount of money. The average number of national channels used by the top 76 brands in 1999 was 23, up from 18 in This trend was apparent no matter how the numbers are viewed. The median number of channels used, for example, was up from 17 to 23. Only 15 brands from both years used fewer channels in The evidence on daypart dispersion was more mixed. The prime component of both local and national network schedules declined slightly overall from 44 percent to 42 percent between 1996 and Network broadcasters such as NBC, CBS, and ABC saw prime-time allocations from the top brands fall from 61 percent to 60 percent. Cable stations experienced a small increase. Forty out of the 77 brands studied increased their prime-time allocation; 36 reduced it. About half the changes were fairly minimal. On the other hand as also illustrated in Table 1 perhaps both these trends would have occurred anyway. The total number of hours viewed changes little over the years and so, if people change how they disperse their viewing across the channels and dayparts available to them, advertisers must follow. Households tuned to more channels in 1999 than they had done three years previously. Table 2 illustrates what has been a long running trend: By the end of 2000, the average U.S. home could receive almost 75 channels, compared with just 45 in By 2003 it would grow to more than 100. Viewers tuned to just under 14 different channels per week in 2000 versus 11 in 1996, and it has since risen to 15. A smaller change compared to the widening options available, but not insignificant. Behind these numbers has been the relentless growth of cable and, more recently, satellite television. The older broadcast networks have seen their audience shares decline inexorably, year after year, leading advertisers to follow the audiences. It is, in short, inevitable that they will need to disperse budgets more widely among a greater number of channels. By daypart, audiences also shifted viewing to some extent (Table 3). Ratings delivery (defined as average hourly program GRPs, unweighted by commercial load) in the evening prime-time hours fell from 30 percent of the total to 28 percent between 1996 and 1999 (and has continued to decline slightly since then). The main beneficiaries of this have been the late night and overnight segments, which have delivered a higher share of the ratings total in recent years. So while it is true that many top brands reduced their reliance on prime time to reach their target audiences as would have been recommended by the optimizers this was very much in line with the overall trend in viewing. DISCUSSION Are there any reasons for us to believe that optimizers ultimately took hold in the U.S. market? Certainly, a whole host of objections were raised by U.S. practitioners at the time to the widespread adoption of imported optimizers. For example: 1. The technical limitations of existing optimizers would prevent them from defining truly optimal solutions.

4 2. Historical audience data were less predictive in the U.S. market than in markets like Australia and the United Kingdom, where optimization has been widely adopted. 3. Optimizers often yielded what were seen as illogical results such as recommending an advertiser put all his money onto the Cartoon Channel. 4. Eighty percent or more of national buying dollars were traditionally placed in a frenzy of activity during a few days in May. Optimizers were too slow to play an important role in this process. Let us examine some of these objections. Technical Limitations Although there is more than one way to approach the optimization process, the goal of the exercise is to find the schedule that delivers the greatest number of net reach points for a given amount of money (or a fixed number of reach points for the lowest amount of money) within what-ever constraints the advertiser wants to set for the system. In theory, the optimizer needs to try out every possible permutation of program combinations to find the single best schedule in reach terms. In practice, such an analysis is computationally untenable. A simple parallel can be made with a lottery contest: Assume that 6 numbers out of a 49 number set are needed to win. There are more than 14 million possible combinations of 6-number sets within this 49-number space. Clearly less complex than the number of combinations available in the 100-channel universe! The most common technical approach to this problem is known as hill-climbing. In essence, the optimizer begins by searching for the program with the lowest cost per rating and builds from there, step-by-step, on the basis of the lowest cost per incremental reach point. Although this approach has the benefit of being computationally efficient, it does not usually lead to a truly optimal solution simply because its scope is limited to building from a fixed starting point on a fairly fixed path. Ultimately, the lowest cost-per-reach programs first selected may not belong in the overall optimal solution. Later optimizers were to employ other techniques such as genetic algorithms that promised better solutions. But ultimately it needs fo be recognized that there are technical limitations in any computer optimizer. Several thousand schedule solutions will probably get sufficiently near to the optimum reach performance to make them indistinguishable from one another in terms of statistical reliability. But arguably it is important to know what this optimal level is, even if other considerations eventually water this down. Technical limitations should not be used as an excuse to banish optimizers from the TV scheduling process. Historical Audience Data Optimizers, like media planners and buyers, rely to a large extent on history for guidance about future audience levels. In countries like the United Kingdom (at least in the early 1990s, when optimizers were first introduced) and Australia, optimizers were widely adopted. Part of the reason for this was that audience levels and channel shares were remarkably stable and thus easy to predict from year-to-year. In the U.S. market this could not be said (indeed, it can no longer be said of the U.K. market). In prime time about two-thirds of new shows introduced every year by the big broadcast networks are not renewed for the following year. Out of 133 different shows running in prime time in the season for example, 51 had no history. In addition, returning programs are often moved to new times and face new competition. This is not to say that predictions could not be made, merely that it was a particular challenge in the U.S. market. In response to this problem, the X*Pert optimizer built a prediction module early on so that buyers could supply their own estimates for programs not in any historical data set. Ultimately, the output of a computer optimizer can only be as good as its input. History is the Achilles heel of the process, more so in 2005 than it was in the late 1990s. But it can still guide us if used sensibly. Illogical results It is not uncommon to hear from planners how an optimizer came up with illogical results when building a schedule for a particular advertiser. Placing prescription drug advertising for seniors on The Children's Channel might be an example of such scheduling. But this happens because the computer considers only what the user asks it to consider. It may well be the case that certain programs deliver cheap incremental reach to a schedule, even if, in the view of some, they do not seem like obvious fits to a product (in the case above, perhaps children were watching with their grandparents). Or perhaps they simply feel inappropriate to an advertiser for subjective reasons. But no media decision-support system comes ready to plug and play. They cannot provide all the answers. Media planning is invariably about more than numbers. Subjective criteria can easily be incorporated into an optimization decision either formally as weights built into the system or later on when the buyer is analyzing the output.

5 Ultimately, media planning is about trade-offs. Trade-offs between GRPs, CPMs, reach, quality, and so on. Often these will conflict with each other, leaving media planners to make the calls. But the optimizer should not be made responsible for bad or illogical media decisions. These are the responsibility of the planner alone. The Upfront A peculiarity of the U.S. national television marketplace is the Upfront. Most years, in a single week every May, more than 80 percent of prime-time inventory is laid down for the program season ahead. During this process, buyers evaluate various program buys offered by the television networks virtually on the fly. They are protected to some extent by the fact that their buys will normally be guaranteed a certain audience delivery, even before the final program mix is agreed, and that much of the buy is subject to cancellation later on in the year if things are not going well for the advertiser. During the Upfront marketplace itself when many of the CPM guarantees have already been locked in buyers will be trying to beat the marketplace by selecting programs that they judge will do well, allowing their schedules to do better than the guarantees. A large number of these programs will be new and untried. Many offers will be made by the networks to which a rapid response is required, based on each buyer's analysis of how well the programs being offered will perform. These decisions are usually measured in minutes and often revolve more around shaving a few points off the CPM guarantees than about delivering reach goals. Optimizers rarely work within these time frames, sometimes taking several hours to complete an analysis. As a result, their practical use tends to be at an earlier stage when setting broad daypart and possibly channel split goals. This helps to give an idea of the sort of reach levels achievable within given budget constraints. Role in Benchmarking Performance Many of these objections can be overcome and worked around if planners and buyers are truly concerned about optimizing reach. Yet focusing only on reach is a one-dimensional approach to a multi-dimensional problem. For most advertisers, this is not their only or even their principal goal. Many advertisers during the late 1990s found it useful to carry out exhaustive analyses using optimizers to validate, challenge, or merely to make transparent the trade-offs they made in their scheduling decisions between higher reach, lower CPMs, and quality control of the programs they appeared in. Some concluded by changing nothing they understood that they were not achieving optimal reach for their budgets, but other considerations proved more important. Some did shift money between dayparts to improve reach performance and CPMs, while moving to what might be perceived as lower quality programs. CONCLUSION There is no doubt in this author's mind that optimizers were a useful addition to the armory of media planners and buyers, even if the process itself is hardly new. There is also little doubt that they have been used far less than the frenzy of headlines in the mid 1990s would have suggested. This has been only partly because they don't work easily in the U.S. market. It has also been because advertisers and media planners that have taken the trouble to use optimizers feel that objectives other than reach have been more important while those that have not are either too lazy or too frightened to change. At the end of the day, the opportunity granted by Nielsen to delve into respondent-level data for the first time, alongside the improvement in computer power, may prove to have been the greatest legacy of the optimizer revolution. Six years later, in the fall of 2005, the company finally agreed to allow the industry to access its entire respondent-level database after years of lobbying. But advertisers will need to follow their audiences. Broadcast prime-time audiences represent less than 15 percent of total viewing time in the United States yet manage to attract more than twice that share of TV advertising dollars. Advertisers continue to pay large and growing premiums for a small and shrinking number of high rating programs (only about 25 shows now generate 5 or more adult ratings in an average month). They may well be worth it, but do we really know? Clutter continues its inexorable rise more than one-fifth of all prime-time output now consists of nonprogramming material. And evidence is growing that viewers skip advertisements when they can or ignore many of them. Optimizers marked the beginning of a more systematic approach to television scheduling. But the world has moved on. Market mix models, holistic media planning approaches, and technology are the new mantras. Television faces fundamental challenges in a world where its role is diminished. There is little evidence that either the networks or media agency buyers have quite grasped it yet. REFERENCES EPHRON, E. Recency Planning. Journal of Advertising Research 37, 4 (1997): EPHRON, E. Point of View: Optimizers and Recency Planning. Journal of Advertising Research 38, 4 (1998): 47 56, LEARNER, D. The Translation from Theory to Practice. Presentation before the Eastern Annual Conference of the American Association of Advertising Agencies, November 16, 1961.


6 LUCAS, D. B., and S. H, BRITT. Measuring Advertising Effectiveness. New York: McGraw-Hill, NOTES & EXHIBITS TABLE 1 TABLE 2

7 TABLE 3


8 Copyright Advertising Research Foundation 2005 Advertising Research Foundation 432 Park Avenue South, 6th Floor, New York, NY Tel: +1 (212) , Fax: +1 (212) All rights reserved including database rights. This electronic file is for the personal use of authorised users based at the subscribing company's office location. It may not be reproduced, posted on intranets, extranets or the internet, ed, archived or shared electronically either within the purchaser s organisation or externally without express written permission from Warc.

TABLE OF CONTENTS TABLE OF CONTENTS I.
 TABLE OF I. Basics...1 Penetration & Access Trends...3 Growth Of TV Penetration: 1950-2014...5 U.S. TV Home Platform Use And Device Ownership...6 Channel Availability...7 Distribution Of Channels Receivable
INCLUDED IN: DIMENSIONS ESSENTIALS
 DIMENSIONS VS. ESSENTIALS: WHICH SUITS YOUR COMPANY S NEEDS? MDI has produced Essentials in response to customer interest in a streamlined, lower-cost publication that emphasizes the basics of research.
THE EVOLUTION OF TV. The Promise of Programmatic TV
 3 THE EVOLUTION OF TV The Promise of Programmatic TV Our Evolution of TV series explores how TV is shifting to internet delivery. Programmatic TV is one dynamic driving the shift and potentially transforming
The dangers of common sense Les Binet Market Leader Quarter 3, June 2009
 The dangers of common sense Les Binet Market Leader Quarter 3, June 2009 Title: The dangers of common sense Author(s): Les Binet Source: Market Leader Issue: Quarter 3, June 2009 The dangers of common
How has UK Television Viewing Behaviour Changed Since the 1980s? Insights for the Australian Market. Virginia Beal, University of South Australia
 How has UK Television Viewing Behaviour Changed Since the 1980s? Insights for the Australian Market Virginia Beal, University of South Australia Abstract This paper concerns changes in television viewing
UK Video Advertising Report November 2012
 UK Video Advertising Report November 2012 BrightRoll UK Video Advertising Report: November 2012 brightroll.co.uk +44 (0)207 550 5580 22, Long Acre London WC2E 9LY Copyright 2012 BrightRoll, Inc. 64% of
Five Questions to Ask Your Mobile Ad Platform Provider. Whitepaper
 June 2014 Whitepaper Five Questions to Ask Your Mobile Ad Platform Provider Use this easy, fool-proof method to evaluate whether your mobile ad platform provider s targeting and measurement are capable
Making Television Commercials Measurable and Affordable for the Performance-Driven Marketer
 Making Television Commercials Measurable and Affordable for the Performance-Driven Marketer November 2011 Making Television Commercials Measurable and Affordable for the Performance-Driven Marketer Introduction
Online measurement: Connecting all the dots Matthew Dodd Admap March 2010
 Online measurement: Connecting all the dots Matthew Dodd Admap March 2010 Online measurement: Connecting all the dots Matthew Dodd Admap March 2010 Connecting all the dots Matthew Dodd Online branding
DIGITAL VIDEO 2013 US VIDEO ADVERTISING: FIRMLY ROOTED AND GROWING
 DIGITAL VIDEO 2013 US VIDEO ADVERTISING: FIRMLY ROOTED AND GROWING BrightRoll US Video Advertising Report: April 2013 www.brightroll.com 415.677.9222 343 Sansome Street, Suite 600, San Francisco, CA 94104
Universal Radio Buying and Selling Terms
 Universal Radio Buying and Selling Terms AM Drive Also known as morning drive, this is the morning broadcast time period for Radio, most often represented by Monday through Friday from 6AM to 10AM as defined
Direct Marketing of Insurance. Integration of Marketing, Pricing and Underwriting
 Direct Marketing of Insurance Integration of Marketing, Pricing and Underwriting As insurers move to direct distribution and database marketing, new approaches to the business, integrating the marketing,
TV + Online Video: The Best of Both Worlds
 WHITE PAPER: Share-shift Analysis TV + Online Video: The Best of Both Worlds FEBRUARY, 2011 EXECUTIVE SUMMARY Online video ad spending increased by 40% 1 in 2010 as an increasing number of advertisers
Advertising media - A
 Advertising media - A There is a large variety of media available to advertisers, and therefore advertisers must choose the medium/media which best deliver their message to potential customers in the most
Measuring Media Efficiency
 Measuring Media Efficiency Assessing Media ROI Throughout the Purchase Funnel All marketers want to optimize their return on investment. Just as consumers are now being forced to make tough choices about
digital GRPs of Digital s New Metric
 digital GRPs The What, Why and How of Digital s New Metric digital GRPs The What, Why and How of Digital s New Metric What is a Digital GRP? See pages 4 6 How is it calculated? See page 6 Why does it matter?
Chapter 19 Advertising. Section 19.1 Advertising Media Section 19.2 Media Measurement and Rates
 Chapter 19 Advertising Section 19.1 Advertising Media Section 19.2 Media Measurement and Rates Advertising Media Key Terms promotional advertising institutional advertising media print media transit advertising
Digital Video Advertising - Advantages and Disadvantages
 A Forrester Consulting Thought Leadership Paper Commissioned By Teads June 2015 Solving Digital Video Advertising s Premium Dilemma Table Of Contents Executive Summary... 1 Digital Video Advertising Is
"SEO vs. PPC The Final Round"
 "SEO vs. PPC The Final Round" A Research Study by Engine Ready, Inc. Examining The Role Traffic Source Plays in Visitor Purchase Behavior January 2008 Table of Contents Introduction 3 Definitions 4 Methodology
How To Set Up A Successful AdWords Campaign
 - 1 - Terms and Conditions LEGAL NOTICE The Publisher has strived to be as accurate and complete as possible in the creation of this report, notwithstanding the fact that he does not warrant or represent
In recent years, many companies have embraced CRM tools and
 The State of Campaign Management in the United States and the United Kingdom To better understand marketing challenges, Accenture surveyed marketing professionals in the United States and United Kingdom
What TV Ratings Really Mean
 What TV Ratings Really Mean You just heard that a TV Show was ranked #1 in the Nielsen Media Research ratings. What does that really mean? How does Nielsen Media Research "rate" TV shows? Why do shows
How to Brief an Agency
 How to Brief an Agency Contents: Introduction - Introduction - What makes a good brief? - Important Steps to take - Finalising the Brief - Evaluating the Agency's proposal Giving a thorough brief to your
2013 ONLINE ADVERTISING PERFORMANCE OUTLOOK. *Survey fielded by:
 2013 ONLINE ADVERTISING PERFORMANCE OUTLOOK *Survey fielded by: EXECUTIVE SUMMARY Over the past several years, digital media has continued to develop as a branding medium, growing beyond its roots as a
Measuring TV s Impact for Mobile Advertisers
 Measuring TV s Impact for Mobile Advertisers Drive new app installations, improve retention of current users, and increase in-app transactions. Presented by: Table of Contents Introduction... How Audience-Targeted
Ratings, Audiences, & Failed Shows
 Ratings, Audiences, & Failed Shows TELEVISION RATINGS Before the Show Airs A New Season TV networks test programs Subjects view pilots or season finales for current shows in theaters. Meters record their
Accountability. Service. Respect. The Customer-Centric World Means The End for Traditional Advertising and Marketing
 Service Respect Accountability The Customer-Centric World Means The End for Traditional Advertising and Marketing Andy Cutler, Equifax Marketing Services July 2008 Equifax is a registered trademark of
Insights from DoubleClick Video advertising momentum
 Insights from DoubleClick What s Inside? Introduction Video ads: a story of growth Brand advertisers dominate the video ad landscape Who are the top publishers in video monetization? What does this mean
WELCOME TO MEDIAOCEAN TRAINING National Ratings 101 TRAINER: GARET LEONARD
 WELCOME TO MEDIAOCEAN TRAINING National Ratings 101 TRAINER: GARET LEONARD Learning Objectives Why we use ratings data Key terms and concepts How ratings data is collected How ratings data is reported
Facebook fans: A fan for life? Karen Nelson-Field and Jennifer Taylor Admap May 2012
 Facebook fans: A fan for life? Karen Nelson-Field and Jennifer Taylor Admap May 2012 Title: Facebook fans: A fan for life? Author(s): Karen Nelson-Field and Jennifer Taylor Source: Admap Issue: May 2012
How are your business programs adapting admissions content to meet today s mobile demands?
 How are your business programs adapting admissions content to meet today s mobile demands? Surveying the Mobile Habits of MBA Applicants Introduction: Mobile Is Even More Important Than You Think Although
Glocal evaluation: Measuring effectiveness Nigel Hollis Admap March 2012
 Glocal evaluation: Measuring effectiveness Nigel Hollis Admap March 2012 Title: Glocal evaluation: Measuring effectiveness Author(s): Nigel Hollis Source: Admap Issue: March 2012 Glocal evaluation: Measuring
/2012 2011/201 EARLY MORNING UPDATE. Fourth Quarter 2011: 9/19 19/1 /11. Strategic Intelligence National Television Report
 2011/201 /2012 EARLY MORNING UPDATE Fourth Quarter 2011: 9/19 19/1 /11 12/25/1 /11 Strategic Intelligence National Television Report Broadcast Networks Overall, ratings in broadcast network early morning
Integrated Marketing Performance Using Analytic Controls and Simulation (IMPACS SM )
") WHITEPAPER Integrated Performance Using Analytic Controls and Simulation (IMPACS SM ) MAY 2007 Don Ryan Senior Partner 35 CORPORATE DRIVE, SUITE 100, BURLINGTON, MA 01803 T 781 494 9989 F 781 494 9766
WHITEPAPER Integrated Performance Using Analytic Controls and Simulation (IMPACS SM ) MAY 2007 Don Ryan Senior Partner 35 CORPORATE DRIVE, SUITE 100, BURLINGTON, MA 01803 T 781 494 9989 F 781 494 9766
The Asian media landscape is turning digital
 The Asian media landscape is turning digital How can marketers maximise their opportunities? Copyright 2012 The Nielsen Company. i The Asian media landscape is turning digital. How can marketers maximise
Display ad clickers are not your customers
 Quantcast Whitepaper January 2013 Display ad clickers are not your customers Konrad Feldman CEO, Quantcast 2013 Quantcast Corporation. All Rights Reserved. Quantcast Whitepaper Display Ad Clickers Are
BREAK-EVEN ANALYSIS. In your business planning, have you asked questions like these?
 BREAK-EVEN ANALYSIS In your business planning, have you asked questions like these? How much do I have to sell to reach my profit goal? How will a change in my fixed costs affect net income? How much do
Point of View: Programmatic Ad Viewability in China
 Presents Point of View: Programmatic Ad Viewability in China Market First Industry Benchmark and Analysis Powered by Introduction In digital advertising, many marketers and agencies assume that ads are
MOBILE BUYER SURVEY 2014. February 25, 2014. Rubicon Project All Rights Reserved
 February 25, 2014 Rubicon Project All Rights Reserved buyers EXECUTIVE representing SUMMARY more than 100,000 globally. Global mobile advertising spending is forecast to reach $18 billion in 2014, and
Discussion Paper. Email Engagement. Often talked about, never defined. Copyright 2013
 Discussion Paper Email Engagement Often talked about, never defined Copyright 2013 FEBRuary 2013 About the document 2 The need for engagement in marketing and in the case of this document, email marketing,
Contact details: Bill Daddi Daddi Brand Communications Inc, Phone: 646-370-1341 917-620-3717 Email: Bill@DaddiBrand.com
 Press Information Contact details: Bill Daddi Daddi Brand Communications Inc, Phone: 646-370-1341 917-620-3717 Email: Bill@DaddiBrand.com Kantar Media Reports U.S. Advertising Expenditures Increased 6.4
THE ORGANIZER S ROLE IN DRIVING EXHIBITOR ROI A Consultative Approach
 7 Hendrickson Avenue, Red Bank, NJ 07701 800.224.3170 732.741.5704 Fax www.exhibitsurveys.com White Paper THE ORGANIZER S ROLE IN DRIVING EXHIBITOR ROI A Consultative Approach Prepared for the 2014 Exhibition
CASE STUDY. The POWER of VISUAL EFFECTS to DRIVE AUDIENCE ENGAGEMENT and VIDEO CONTENT POPULARITY DECEMBER 2011 INTRODUCTION KEY FINDINGS
 CASE STUDY DECEMBER 2011 TABLE OF CONTENTS Situation Analysis... 2 Research Hypothesis... 2 Case Study Context... 2 Methodology...3-8 Business Implications...7-8 The POWER of VISUAL EFFECTS to DRIVE AUDIENCE
Frequency Matters. The keys to optimizing email send frequency
 The keys to optimizing email send frequency Email send frequency requires a delicate balance. Send too little and you miss out on sales opportunities and end up leaving money on the table. Send too much
A Primer in Internet Audience Measurement
 A Primer in Internet Audience Measurement By Bruce Jeffries-Fox Introduction There is a growing trend toward people using the Internet to get their news and to investigate particular issues and organizations.
Trends in online advertising and content Strategies for online newspapers Executive coaching: Digital Training Academy
 Building stronger digital teams Trends in online advertising and content Strategies for online newspapers Executive coaching: Digital Training Academy Danny Meadows-Klue Chief Executive Digital Training
 The Credit Card Report May 4 The Credit Card Report May 4 Contents Visa makes no representations or warranties about the accuracy or suitability of the information or advice provided. You use the information
Bridging Digital with Television Measurement Presentation to the BRC
 Presentation to the BRC May 28, 2013 Rebecca Shropshire, VP Digital Chris Herlihey, VP Research Bridging digital with television measurement Why it s important 25-30 TV hours / 11 internet hours per week
THE ART OF EFFECTIVE ADVERTISING
 FEATURED INSIGHTS DELIVERING CONSUMER CLARITY THE ART OF EFFECTIVE ADVERTISING THE 3-C FRAMEWORK OF CONTENT, CONTEXT AND CONSUMER Only one out of five advertising campaigns on television turn out efficient
Claims 2.0: Rethinking High Performance in Claims. White Paper. Changing Channels. Accenture Multi-Channel Distribution Insurance Consumer Survey
 Claims 2.0: Rethinking High Performance in Claims White Paper Changing Channels Accenture Multi-Channel Distribution Insurance Consumer Survey Effective multi-channel distribution: the solution to an ever-changing
The Quantcast Display Play-By-Play. Unlocking the Value of Display Advertising
 The Quantcast Display Play-By-Play Unlocking the Value of Display Advertising Introduction In 2013, businesses will spend nearly $18 billion on display advertising. Over the past few years, we've seen
Media Efficiency Panel MEP INMA Conference, Lissabon
 GfK Consumer Tracking INMA European Conference, Media Efficiency Panel October 2011 Media Efficiency Panel MEP INMA Conference, Lissabon Laurent de Groof GfK Netherlands 2 Adspend Newspapers and Magazines
DISPLAY AD CLICKERS ARE NOT YOUR CUSTOMERS
 Quantcast Whitepaper December 2012 DISPLAY AD CLICKERS ARE NOT YOUR CUSTOMERS Konrad Feldman CEO, Quantcast 2012 Quantcast Corporation. All Rights Reserved. Quantcast Whitepaper Display Ad Clickers Are
River Pools and Spas: Blogging for Sustainable Business Growth
 River Pools and Spas: Blogging for Sustainable Business Growth (Zhu, Jia Li Lily) July, 2010 River Pools & Spas: Blogging for Sustainable Business Growth by Jia Li Lily Zhu at HubSpot is licensed under
1 Uncertainty and Preferences
 In this chapter, we present the theory of consumer preferences on risky outcomes. The theory is then applied to study the demand for insurance. Consider the following story. John wants to mail a package
Overview of The 2012-13 Upfront. September 25th, 2012
 Overview of The 2012-13 Upfront September 25th, 2012 Upfront Definition The long range purchase of commercial time for the upcoming broadcast year. (Sometimes more than a year or can be a calendar year).
Do TV Ads Wear Out? Millward Brown: Knowledge Point
 Do TV Ads Wear Out? Broadly speaking, the response generated by a TV ad doesn t change much over time. True wearout of a TV ad is rare, and many TV ads could have a longer useful life than advertisers
CHAPTER 9 CONVERSATIONS WITH CONSULTANTS
 CHAPTER 9 CONVERSATIONS WITH CONSULTANTS Throughout the spring of 1994 the Mike Bird for Governor headquarters was besieged with telephone calls from political consultants wanting to handle the Bird campaign.
Section 3. The growth of digital television 3
 Section 3 The growth of digital television 3 Section 3 The growth of digital television Section 3 The growth of digital television 3.1 More than one in every two UK households now have digital TV. Reaching
PIVOTAL. U.S. Equity Research Internet / Advertising. Pivotal Research Group
 PIVOTAL Pivotal Research Group U.S. Equity Research Internet / Advertising Nielsen Data: TV Dominates Time, Other Media Grows March 5, 2014 BOTTOM LINE: Nielsen published its "Cross-Platform" report for
Multivariate testing. Understanding multivariate testing techniques and how to apply them to your email marketing strategies
 Understanding multivariate testing techniques and how to apply them to your email marketing strategies An Experian Marketing Services white paper Testing should be standard operating procedure Whether
Managing working capital in the new economic environment
 IBM Global Business Services Financial Management Managing working capital in the new economic environment Challenging times The problem is acknowledged throughout the world: in difficult economic times,
Variations in Video Advertising Impact
 Variations in Video Advertising Impact Beth Uyenco Global Research Director Microsoft Corporation David Kaplan SVP, Research & Product Development Nielsen IAG The Rise of Online Video In an overall down
Digital TV switchover: Social media
 Digital TV switchover: Social media By Matt Heselden, Social media lead Summary With the growth in popularity of social media, we recognised that increasing numbers of consumers and opinion formers would
Using Online Video to Enhance the Reach and Performance of TV
 WHITE PAPER: Dual-Platform Campaigns: Using Online Video to Enhance the Reach and Performance of TV JANUARY, 2012 EXECUTIVE SUMMARY Advertisers and agencies typically treat TV and online as separate parts
THE EVOLUTION OF TV. Reaching Audiences Across Screens
 2 THE EVOLUTION OF TV Reaching Audiences Across Screens Part one of our Evolution of TV series, 7 Dynamics Transforming TV, introduced the increasing shift of TV to delivery over the internet. Here we
Where have all my marketing investments gone?
 IBM Software Business Analytics Business Analytics for marketing organizations Where have all my marketing investments gone? Addressing accountability with marketing performance analytics 2 Where have
From Web Analytics to Engagement Analytics
 white paper From Web Analytics to Engagement Analytics Table of Contents Executive Summary 1 Engagement Analytics 2 Measuring Quality with Engagement Value Points 2 Engagement Analytics Examples 5 Overall
How to Perform a Break-Even Analysis in a Retail Store A Step by Step Guide
 How to Perform a Break-Even Analysis in a Retail Store A Step by Step Guide By BizMove Management Training Institute Other free books by BizMove that may interest you: Free starting a business books Free
A-B and Multivariate Testing Increasing Increasingly Young
 A/B and Multivariate Testing Landscape July 2008 ZeroDash1 Ascentium Lead Analyst Greg Poffenroth Web Optimization Lead Other Analysts and Contributors Anil Batra Director Analytics and Strategy Kyle Hutchins
Money well spent. How promotional products generate returns.
 SmartPapers At Staples Promotional Products, we re dedicated to helping you meet your marketing and promotional goals. That s why we ve developed our exclusive SmartPapers, expert guides that address realworld
The Real Cost Of Inventory Why You Can Have Too Much Of A Good Thing Prepared by: Dionco Inc. Chicago WINNING STRATEGIES FOR THE RETAIL INDUSTRY
 WINNING STRATEGIES FOR THE RETAIL INDUSTRY The Real Cost Of Inventory Why You Can Have Too Much Of A Good Thing Prepared by: Dionco Inc. Chicago Compliments of Microsoft The Real Cost Of Inventory Microsoft
/ Press Information KEY SPORTING EVENTS AND POLITICAL ADS INCREASE U.S. FULL-YEAR ADVERTISING EXPENDITURES
 / Press Information Contact details: Bill Daddi Daddi Brand Communications Phone: 646-370-1341 Cell: 917-620-3717 Email: Bill@DaddiBrand.com KEY SPORTING EVENTS AND POLITICAL ADS INCREASE U.S. FULL-YEAR
HD TV: The Picture is Getting Clearer. May 2009
 HD TV: The Picture is Getting Clearer May 2009 Not since the introduction of color television more than half-a-century ago has another innovation done as much to enrich the visual quality of television
THE BUSINESS RELATIONSHIP BETWEEN PRODUCERS/STUDIOS AND TELEVISION NETWORKS IN THE UNITED STATES
 THE BUSINESS RELATIONSHIP BETWEEN PRODUCERS/STUDIOS AND TELEVISION NETWORKS IN THE UNITED STATES Presentation notes by Richard Hofstetter, June 28, 2010 I was asked to address the MediaForum panel to examine
Table of Contents. 2010 Brightcove, Inc. and TubeMogul, Inc Page 2
 Table of Contents Table of Contents... 2 Background... 3 Methodology... 3 Key Findings... 4 Platform Usage... 6 Video Stream Trend Data... 6 Player Loads Q1 2010... 8 Video Uploads Q1 2010... 10 Engagement,
Measuring the Effectiveness of Your Content Marketing
 Measuring the Effectiveness of Your Content Marketing 1 Measuring the Effectiveness of Your Content Marketing A 5-Step Process to Prove Value and Grow Your Business Measuring the Effectiveness of Your
Media attribution: Optimising digital marketing spend in Financial Services
 Media : Optimising digital marketing spend in Financial Services A multi touch study on the role of Facebook, display and search marketing in Financial Services. Executive summary Media solves the key
MULTICHANNEL MARKETING
 REPORT Report Multichannel Marketing MULTICHANNEL MARKETING A Study Highlighting Current Approaches and Investment, Opportunities and Key Challenges 1 2 Introduction 4 Key findings 6 Conclusion 19 3 INTRODUCTION
8a business white paper
 Myths about Direct Response Television 8a business white paper Myth # 1 TV is strictly a branding medium. Although arguably the best branding medium, TV is also a significant traffic source. With major
ONLINE GRP. igrp yougrp. wegrp. What You Need to Know About. P1 United States Europe Canada. Copyright 2013 BrightRoll, Inc. All names and logos are
 igrp yougrp wegrp What You Need to Know About ONLINE GRP Copyright 2013, Inc. All names and logos are P1 Digital video advertising is projected to grow 41% in 2013. What You Need to Know About Online GRP
Thank you very much. I am honored to follow one of my heroes
 Earnings, Inflation, and Future Stock and Bond Returns 1 JEREMY J. SIEGEL Russell E. Palmer Professor of Finance The Wharton School University of Pennsylvania Thank you very much. I am honored to follow
Paid Social Media Advertising. Industry update and best practices 2013
 Paid Social Media Advertising Industry update and best practices 2013 Methodology A survey commissioned by Vizu, a Nielsen company, of more than 500 U.S. digital marketing and media professionals was conducted
The Implications of Marketing Trends
 The Implications of Marketing Trends Advertising in Canada plays a significant role in the Canadian economy with expenditures expecting to grow to more than $23.3 billion by 211. Advertising Expenditures
BrightRoll Insights: Mobile Video Advertising Strengthens TV Media Investments
 BrightRoll Insights: Mobile Video Advertising Strengthens TV Media Investments Executive Summary While TV remains a trusted mass market media with the broadest reach, video consumption on mobile devices
The Zendesk Benchmark Q2 2013
 The Zendesk Benchmark Q IN FOCUS: CUSTOMER SELF-SERVICE zendesk.com The Zendesk Benchmark Q/ Table of Contents Global Customer Satisfaction Summary Page Background on Zendesk Benckmark Customer Satisfaction
2015- YEAR END REPORT FOR AMERICA S TELEVISION NETWORK, INC.
 . 2015- YEAR END REPORT FOR AMERICA S TELEVISION NETWORK, INC. Dear Friends, On behalf of the team at America s Television Network, Inc., we want to wish you and yours a very Merry Christmas and a Happy
VIOLENCE IN CABLE-ORIGINATED TELEVISION PROGRAKB A Report to the National Cable Television Association by George Gerbner The AnneDberg School for
 1 VIOLENCE IN CABLE-ORIGINATED TELEVISION PROGRAKB A Report to the National Cable Television Association by George Gerbner The AnneDberg School for Communication university of Pennsylvania How much violence
Media Selling, 4 th Edition
 Media Selling, 4 th Edition Appendix A - Selling Magazines to Agencies By Phil Frank Media buyers are inundated with information. They have more data to consider and understand than ever before. The manner
{the guide} The Small and Midsize Business Email Marketing Survey 2013
 {the guide} The Small and Midsize Business Email Marketing Survey 2013 Introduction Email remains a staple component in the marketing strategies of businesses and organizations of all shapes and sizes.
Chapter Seven STOCK SELECTION
 Chapter Seven STOCK SELECTION 1. Introduction The purpose of Part Two is to examine the patterns of each of the main Dow Jones sectors and establish relationships between the relative strength line of
Exercise 7.1 What are advertising objectives?
 These exercises look at the topics in the context of a communications mix. We start with an examination of what advertising objectives are (Exercise 7.1). We then look at how to set advertising objectives
Divergent Brand Building Strategies: How Do They Match Up? By Kirk L. Wakefield, PhD
 Divergent Brand Building Strategies: How Do They Match Up? By Kirk L. Wakefield, PhD In competitive selling environments, brand identity is an important differentiator for both the sales professional and
Savings Education. CASE HISTORY: A Multi-Organizational Approach to Public Education
 Savings Education CASE HISTORY: A Multi-Organizational Approach to Public Education The seeds for the Choose to Save (CTS) public education program were first planted in 1995 as the Employee Benefit Research
Video Metrix. The Ultimate Video Audience Insights Tool
 Video Metrix The Ultimate Video Audience Insights Tool comscore Video Metrix Already the Reference for the Top Players in the UK Video Marketplace 2 KEY ADVANTAGES comscore Video Metrix Why Video? Measuring
A Model for Making Sense Out of Marketing ROI Measurements
 A Model for Making Sense Out of Marketing ROI Measurements M easuring and improving marketing ROI is a process. It's not a one-shot deal. It's an ongoing effort, an integral part of well-oiled marketing
Management Commentary. Second Quarter 2015 Results
 Management Commentary Second Quarter 2015 Results The RetailMeNot, Inc. ( RetailMeNot ) earnings call will begin on August 5, 2015 at 7:00am central time (8:00am eastern time) and will include prepared
CUSTOMER STORY: TOP 5 U.S. CABLE OPERATOR SCALING AD IMPRESSIONS AND CONVERSIONS WHILE LOWERING COST PER ORDER
 CUSTOMER STORY: TOP 5 U.S. CABLE OPERATOR SCALING AD IMPRESSIONS AND CONVERSIONS WHILE LOWERING COST PER ORDER BACKGROUND One of the top five cable operators in the United States provides digital cable
BENCHMARK REPORT. Research and insights for engaging email subscribers EXCERPT
 BENCHMARK REPORT Research and insights for engaging email subscribers EXCERPT 2012 Email Marketing Benchmark Report Research and insights for engaging email subscribers Author W. Jeffrey Rice, Senior Research
What is the Cost of an Unseen Ad?
 What is the Cost of an Unseen Ad? Steven Millman, comscore ZhiWei Tan, comscore Abstract In order to determine the relationship between viewability and campaign lift, viewable and non-viewable ads - as