TRACER STUDY OF RECENT GRADUATES FROM VOCATIONAL EDUCATION INSTITUTIONS IN KOTAYK AND ARARAT MARZES OF ARMENIA
|
|
|
- Leon Atkinson
- 8 years ago
- Views:
Transcription
1 TRACER STUDY OF RECENT GRADUATES FROM VOCATIONAL EDUCATION INSTITUTIONS IN KOTAYK AND ARARAT MARZES OF ARMENIA Draft Report European Training Foundation & Caucasus Research Resource Centers Armenia, a program of the Eurasia Partnership Foundation

2 ETF, Turin, November 2012

3 Contents LIST OF ABBREVIATIONS... 4 INTRODUCTION EXECUTIVE SUMMARY Research objectives and methodology Findings of the study RESEARCH OBJECTIVES AND METHODOLOGY GENERAL INFORMATION ON SELECTED MARZES Kotayk marz Economy Poverty assessment in Kotayk marz Education system Ararat marz Economy Poverty assessment in Ararat marz Education system RESEARCH RESULTS Employment of graduates by the fields of study General data on employment Employment by type and size of organisations Employment types, relevance of job and qualification, importance of diplomas and job mobility Graduates salaries and types of contracts Job placement Unemployed graduates Self-employment/businesses Formal Education Reasons for choosing the profession and tuition fees Rating of the VET institutions performance by graduates Trainings Migration trends CONCLUSIONS AND RECOMMENDATIONS Conclusions Recommendations ANNEXES... 37

4 LIST OF ABBREVIATIONS AGRO AMD BGE CRRC CS ECON EDU ENG ETF EU GDF GoA HEAL ICT ISCO LLC LM MoES NACE NCVETD NSS OJSC RA RSC SAC SC SCE SEC SERV SMC SME VET Agriculture Armenian Dram Basic General Education The Caucasus Research Resource Centres program of The Eurasia Partnership Foundation in Armenia Craftsmanship School Economy Education Engineering European Training Foundation European Union Global Developments Fund Government of Armenia Healthcare Information and Communication Technologies International Standard Classification of Occupations Limited Liability Company Labour Market Ministry of Education and Science European Classification of Economic Activities National Centre for VET Development National Statistical Service Open Joint Stock Company Republic of Armenia Regional State College State Agricultural College State College State College of Energy State Engineering College Service State Medical College Small and medium enterprises Vocational Education and Training 4

5 INTRODUCTION Vocational institutions in Armenia serve an important role in preparing the labour force, especially those who may not receive any further education, with the necessary skills to be competitive in the labour market. After completing general education, there are two types of vocational colleges students may enter, Preliminary Vocational Education and Training (Pre VET) and Middle Vocational Education and Training (Mid VET). Both of these institution types have been confronted with dramatic changes since independence. Declining attendance, shifting needs in the labour market and changes in funding sources are three of the biggest challenges that VET institutions have faced. According to a UNESCO report published in , since 1991, the number of Pre VET colleges in Armenia had decreased by 43% while enrolment had fallen by 93%. Mid VET institutions faired slightly better, with the number of colleges actually increasing by 13.2%, though attendance still fell by 31%. Before independence, VET colleges were free, but now fees have been introduced in order to make up for the costs that state support does not cover. This means that to attract students and be competitive, VET institutions must provide a quality of service that enables graduates to engage in labour market as well as an ability to adjust their knowledge and skills (including entrepreneurial) in response to the labour market demand side requirements. To accomplish this, VET colleges must offer relevant curricula, which in the quickly changing post independence economy requires knowledge of the current labour market as well as strong leadership and planning. Even with these challenges, VET colleges remain an important part of the education system in Armenia. Over 37,000 students were enrolled in VET colleges in (29,600 in Mid VET and 6,400 in Pre VET) and ensuring that they receive a relevant and high quality education is of great importance for the future of Armenia. In order for VET colleges to be successful in the future, policy makers must first possess a thorough understand of challenges that exist. Moreover, by signing The Mobility Partnership Agreement with the European Union (October 27 th, 2011) and by developing the National Action Program (for ) on migration regulation, Armenia has opened-up prospects for its citizens to become employed outside of the country. This requires actions that will support labour migration and ensure that qualifications earned at Armenian VET colleges will be valid outside of the country, especially in Europe. The government of Armenia recognizes the importance of VET and has taken concrete steps to strengthen it over the last decade. In 2004, the government developed a VET strategy; in 2007, it updated the policy priorities and the underlying action plan; and in October of 2008, the Poverty Reduction Strategy Paper II (it was later renamed Sustainable Development Programme of Armenia - SDPA) was adopted. Furthermore, to promote the reforms and modernization, the Ministry of Education and Science implemented VET sector development and support programs funded by TACIS AP 2006, ENP AP 2007, USAID Enterprise Development and Market Competitiveness (EDMC), GIZ Armenia s Municipal and Economic Development Programme in Armenia, as well as several others. To support Armenia s efforts in collecting reliable information regarding the success of VET graduates in labour market, their attitude on the relevance of acquired skills and to facilitate experience exchange between countries, The European Training Foundation (ETF), among other activities, initiated and funded this tracer study. The project sought to add value by monitoring the reform process as well as identifying developments in the labour market and the employment reform programme. Special attention was paid to 1 UNESCO Teacher Training and Curriculum reform in the South Caucasus, pages 32 and (accessed, October 30 th, 2012) 2 Armenian National Statistical Services website: (accessed, October 30 th, 2012) 5
. Both of these institution types have been confronted with dramatic changes since independence.")
6 mechanisms of cooperation between businesses and VET institutions with the aim to gain new insights and information that could be used to upgrade vocational training curricula, including modular professional skills approaches. The Caucasus Research Resource Centers-Armenia (CRRC-Armenia), of the Eurasia Partnership Foundation was contracted as the local partner for the project. CRRC was responsible for conducting the survey and drafting the country report on the basis of ETF methodology and in close co-operation with ETF staff. The successful completion of the project would not have been possible without the great work and tremendous efforts of the following CRRC staff members and affiliates: Heghine Manasyan, Aram Avagyan, Samvel Pipoyan, Ruben Yeganyan, Veronica Grigoryan, Iskuhi Mkrtchyan, Hermine Mheryan, Anna Sarkisyan, Armida Alvandyan, Robia Charles and Drew Loizeaux. In addition, recognition must be given to the team of supervisors and interviewers who contributed to the trustworthy data collection during the fieldwork. A special thanks is also due to ETF staff, who were invaluable during the entire project by offering their time, resources and expertise. Specifically, recognition is owed to Milena Corradini and Gabriela Platon. 6

7 2. EXECUTIVE SUMMARY 1.1. Research objectives and methodology The Caucasus Research Resource Centres program of The Eurasia Partnership Foundation in Armenia (CRRC-Armenia), within the Consolidation of Support to the Stakeholders of the Republic of Armenia in Implementing Human Capital Development Policies project funded by the European Training Foundation (ETF) and under the auspices of the RA Ministry of Education and Science, carried out a graduates tracer study in Kotayk and Ararat marzes (regions) of Armenia with an objective to improve knowledge and experience in assessing the relevance of VET offerings and outcomes in the regions. The research targeted 2009 and 2010 graduates of VET institutions in Ararat and Kotayk marzes of Armenia. The survey covered 451 graduates (including 278 women) of 6 Colleges (middle VET) and 3 Craftsmanship Schools (preliminary VET) in Kotayk and of 4 Colleges (3 of which provide also preliminary VET) in Ararat. Overall, 23.4% of graduates were reached by the study in both marzes: 21.4% of graduates from Middle VET (hereinafter Mid VET) institutions and 30.8% of graduates from Preliminary VET (hereinafter Pre VET) institutions. Graduates were divided into 7 groups by the field of their study: 1. Economics, Management, Clerical Works 2. Engineering, Technology, Manufacturing, Construction 3. Information and Communication Technologies 4. Services 5. Education 6. Healthcare 7. Agriculture The graduates lists for sampling (including their current contact details such as phone number, address, etc.) were obtained from the relevant colleges and contained 1,924 former students; 947 of them were sampled according to the Mid VET/Pre VET and gender proportions, as well as quotas suggested in the Terms of Reference (TOR). Although the required number of graduates was interviewed, they totalled less than half of those in the sampling set due to the following 2 factors: Shortcomings in the graduates lists provided by the educational institutions: the lack of complete addresses and telephone numbers and/or inaccuracies in them made it impossible to find and contact almost every 4 th respondent. High migration mobility of the respondents: during the fieldwork period, more than 18% of the respondents had migrated, of which 10.3% had left the country. More than ¼ of those who had migrated (or 4.5% of all considered graduates) had left the country indefinitely. More than 2% of all respondents refused interviews: less than 1% in Kotayk but more than 4% in Ararat Findings of the study Employment Slightly more than one-third of graduates 35.9% (162 out of 451 interviewed) considered themselves employed. Reported employment was higher among the Pre VET graduates (40.8% against 34.0% Mid VET graduates). Women made up only 35.8% of employed graduates and were employed at a lower rate than men of only 21%. In general, graduates from rural areas are more successful in finding jobs than those from urban areas. Employment rates varied across fields of study and college. Agriculture graduates reported being employed at the highest rate at 75%, while graduates of Education and Healthcare were employed only 26.3% and 22.6% of the time, respectively. Graduates of Masis State Agricultural College were the most likely to be employed (62.5%), while graduates of Ararat State College (12.5%) and Ararat State Medical College (9.4%) were the least likely. More than half of employed graduates worked in private companies, while only 8% were self-employed or involved in a family business. The share of self-employed women was higher than men. No graduate from Agriculture graduate was self-employed or engaged in a family business. Correspondence between occupations and acquired qualifications The relevance of the graduates qualifications to the job they held at the time of the interview was quite low: 63.6% of employed graduates reported that their qualifications did not match their current work. Mid VET graduates reported working as a skilled worker 13.8% of the time, which is a position that normally only 7
 of Armenia with an objective to improve knowledge and experience in assessing the relevance of VET")
8 requires the qualifications obtained by Pre VET graduates. The role of a diploma in finding a job is also very limited: for more than half of employed graduates, their diplomas were not important for obtaining their job at all. At the same time, a high level of adaptability to the jobs, even those that were not relevant to the graduates qualification, was observed. Job placement and salaries of employed Personal contacts are the most useful channel for the majority of graduates to get jobs, while employment services play a very minor role in job-seeking solutions, with only 7.4% of respondents using this option successfully. The vast majority of employed graduates had an average monthly salary of 50 to 100 thousand AMD (about ). Interestingly, the average salary of Pre VET graduates was more than 20% higher than Mid VET graduates. Men s salaries were higher than women s. How the field of study was selected Most graduates reported that personal interest towards the profession was more important to them when choosing the field of study than the prospective employment opportunities. The role of vocational guidance services in choosing an area for study was extremely small. The rating of the institutions performance by the graduates does not correlate much with their employment, which suggests that many young people do not see an inseparable link between VET and future employment. Unemployed Almost two thirds 64.1% of interviewed graduates were not employed at the time of the survey and 42.4% of all interviewed had never worked before. Only 8.3% of all respondents who were not employed were still studying and not searching for any job. A larger share of Mid VET graduates (46.7%) had never worked before compared to Pre VET graduates (31.5%). For those who had never worked, the most frequent explanation was that it was impossible to find any job (35.6%), which was followed by family circumstances (26.7%). Graduates of Economics composed the largest part (31.9%) of those who had never worked, though Healthcare graduates accounted for nearly the same amount (30.4%). Graduates of Agriculture programmes made up the smallest amount of those who had never worked (1.0%). Training At the time of interviewing, only 80 graduates (17.7% of all interviewed) had participated or were participating in a training course. The largest share of training participants was among Information and Communications Technologies (ICT) graduates (30.6%), who were closely followed by Education graduates (28.9%). Most graduates (60% of those who passed training) either paid for their training personally or were helped by household members. Employers covered the training fees for Engineering graduates more than in any other field, which may be an implication of higher demand towards skilled labour force and/or lower adequacy of competences acquired in the VET institutions in this field. Of those who had not participated in any training at the time of survey, 80 people (the same number as of those who had passed training) reported they were planning to do so in the future. However, the largest share of graduates had no intention to participate in any training. 3. RESEARCH OBJECTIVES AND METHODOLOGY The Caucasus Research Resource Centres program of The Eurasia Partnership Foundation in Armenia (CRRC-Armenia), within the Consolidation of Support to the Stakeholders of the Republic of Armenia in Implementing Human Capital Development Policies project funded by the European Training Foundation (ETF) and under the auspices of the RA Ministry of Education and Science, carried out a graduates tracer study in Kotayk and Ararat marzes of Armenia with an objective to improve knowledge and experience in assessing relevance of the VET offering sand outcomes in the regions. The research targeted 2009 and 2010 graduates of VET institutions in Ararat and Kotayk marzes of Armenia. The survey covered 451 graduates (including 278 women) from 6 Colleges (middle VET) and 3 Craftsmanship Schools (preliminary VET) in Kotayk and of 4 Colleges (3 of which provide also preliminary VET) in Ararat. Overall, 23.4% of graduates were reached by the study in both marzes: 21.4% of graduates from Middle VET (hereinafter Mid VET) institutions and 30.8% of graduates from Preliminary VET (hereinafter Pre VET) institutions. 8

9 According to the Terms of Reference, in order to ensure a confidence level of 90%, out of the graduates from 2010 (according to the official statistics available from the National Statistical Service of Armenia 4 ), no less than 420 (out of which, 255 must be women) had to be interviewed. However, due to the problems with graduates availability (many of them had left their cities of residence or even the country), it was agreed with ETF to also interview 2009 graduates in order to reach the required threshold. The graduates lists (including their current contact details such as phone number, address, etc.) for sampling purposes were obtained from the relevant colleges and contained 1,924 people. A total of 451 graduates were interview, of which 278 were women. The distribution of those interviewed is presented in the Table 1. Table 1. Composition of graduates and the sample, persons MARZ AND VET LEVEL Number of interviews Number of 2011 Number of 2009 To be interviewed graduates and 2010 graduates according to the Interviewed (for comparison) ToR, not less than Total Girls Total Girls Total Girls Total Girls Kotayk Middle VET Preliminary VET Ararat Middle VET Preliminary VET TOTAL To implement the research, CRRC, in collaboration with the ETF responsible person and the project experts, developed the following research tools: a sampling list of the 2009 and 2010 graduates of 13 VET institutions from two marzes; adjusted questionnaire (see Annex 1); instructions for interviewers; structure of the final report. The questionnaire was developed through revision and adjustments of the one used for the ETF funded tracer study implemented by the Global Developments Fund 5. For the implementation of the survey fieldwork, separate groups of interviewers were formed for Ararat and Kotayk marzes. The fieldwork was implemented by 15 people, including the coordinator of the fieldwork, 2 regional team leaders/supervisors and 12 interviewers. Before the fieldwork commenced, they were informed about the research objectives and trained on interviewing and questionnaires completion methods. The fieldwork was carried out within the planned time frame: starting on July 1 and lasting till July 13. This was followed by the telephone verification phase, which checked whether the working group members carried out the interviews as per the requirements. Although the required number of graduates was interviewed, they totalled less than half of those in the sampling list (see Table 2). 3 In the ToR it was mentioned 914 (most probably 47 Pre VET graduates of Ararat marz were omitted), while according to the data obtained directly from the colleges, the real number of 2010 graduates of only 13 institutions out of 15 acting in two marzes was 991. The authors of this report cannot explain this difference between the official statistics and the real data; however it may be due to shortcomings in the colleges statistical data submission activities. 4 Social Situation in Armenia in 2010, page 77. NSS, 2011, 5 The report is available at 9

10 Table 2. Composition of sampling: field work results Number of considered graduates % of total sampled Kotayk Ararat Total Kotayk Ararat Total Number of graduates in general sampling list from which Interviewed Including: Direct interviews Phone interviews Not interviewed Including: Non-permanent migration within the country Permanent migration within the country Non-permanent migration outside the country Permanent migration outside the country The respondents are unreachable in their locality Rejection to be interviewed Non-complete contact details The reason the survey included less respondents from the sample set was due to 2 main factors. The first was the graduates lists provided by the educational institutions lacked complete and or accurate addresses and telephone numbers for many graduates, which made it impossible to find and contact almost each 4 th respondent (20% in Kotayk and around 30% in Ararat). The second, quite predictable, factor was the high migration and mobility of the respondents. During the fieldwork period more than 18% of the respondents had migrated, of which 10.3% had left the country. More than ¼ of those who had left Armenia (or 4.5% of all considered graduates) had done so indefinitely. More than 2% of all respondents refused interviews: less than 1% in Kotayk but more than 4% in Ararat. The average duration of an interview was about half an hour. The response rate was 70% (calculated after excluding "permanent migration within the country", "permanent migration outside the country", "noncomplete contact details", i.e. RR=451/( )x100%, where 194= ). 4. GENERAL INFORMATION ON THE SELECTED MARZES 3.1. Kotayk Marz The territory of RA Kotayk Marz is 2,089 km 2 ; agricultural land is 161,667 ha, including 38,057 arable hectares. It has 7 urban communities: Hrazdan (marz centre), Abovyan, Charentsavan, Byureghavan, Tsaghkadzor, Yeghvard, Nor-Hachn; and 60 rural communities (for the marz map with indication of VET institutions and distribution of graduates, see the next page). Kotayk is situated in the centre of the Republic of Armenia. In the southwest, it borders the capital Yerevan, in the west Aragatsotn Marz, in the North Lori Marz, in the northeast Tavush Marz, in the east Gegharkunik Marz and in the south Ararat Marz. The population is thousand people (8.7% of RA total population), including: thousand people who live in urban areas (56.2%), and thousand people who live in rural areas (43.8%) 6. 6 RA Resident Population as by 1 st of January 2012, NSS, 2012, 10

11 Economy In 2010, the share of Armenia s total economic output for the following sectors that occurred in Kotayk Marz was 7 : Industry 10.3% Agriculture 6.3 % Construction 6.3 % Retail 2.9 % Services 2.7 % Energy production is also a very important part of the economy for Kotayk as there are two large electric power stations within the marz. Another main area of the marz economy is the processing industry, which is comprised of the following branches: a. food and beverage production (meat and meat product processing and canning, fruit and vegetable processing and canning, milk products, flour, and beverage production), b. non-metal mineral production (glass and glass products, cement), c. metal-working industry and metal-goods production (casting of steel and cast iron), d. production of furniture and finished articles such as jewellery and diamonds. In 2010, industrial output was valued at 85,084.3 million AMD, which exceeds 2009 output by 2,750.1 million AMD. However, the marz s share of countrywide output in the industry sector decreased in 2010 by 2% from 12.3% in Poultry farming makes up the largest share of agricultural activity in the marz (3 large poultry farms in the territory of the marz). At the same time, 9.1% of cattle, 6.7% of sheep and goats and 13.2% of pigs raised in Armenia are concentrated in Kotayk 8. As of 1 January 2011, livestock products valued at 27,669.2 million AMD were produced, which accounted for 11.3% of the similar products manufactured in the country. Crop production totalled 12,948.7 million AMD (65.6% of the previous year production), which equalled 3.3% of the country s total output Poverty assessment in Kotayk Marz According to the results of household survey implemented by the RA NSS 9, Kotayk Marz has the high level of poverty (Table 3) in the country. Analysis of survey data shows that in 2010, the poverty rate was 46.8% (increasing from 39.5% in 2008), which was significantly higher than the national average of 35.8%. The depth 10 of poverty in Kotayk marz was 12.4%, which was the highest among all the marzes and significantly more than the national average of 8.1%. The acuteness 11 of poverty in Kotayk marz was 4.0%, which considerably exceeded the national average of 2.5%. According to the Integrated Living Conditions Survey of Households 12, the unemployment rate in Kotayk in 2010 was 19.2%. 7 Marzes of the Republic of Armenia and Yerevan city in figures NSS, 2011, 8 Socio-economic Development Plan of Kotayk Marz for (only in Armenian), 9 Social Snapshot and poverty in Armenia, 2011, RA NSS, 10 Depth of poverty (poverty gap) describes how far below the poverty line are the households. For example, poverty depth of 19% means that if a country is in a position to pool resources equal to 19% of the poverty line and efficiently distribute these among the poor, poverty may theoretically be eradicated. 11 Acuteness (severity) of poverty shows the number of the poor in the lowest level of poverty. Acuteness of poverty is calculated as arithmetical average of the squares of depth. 12 Social Snapshot and Poverty in Armenia, Statistical Analytical Report Based on the Results of the 2010 Integrated Living Conditions Survey of Households, National Statistical Service of the Republic of Armenia, 2011, 11
, b.")
12 12
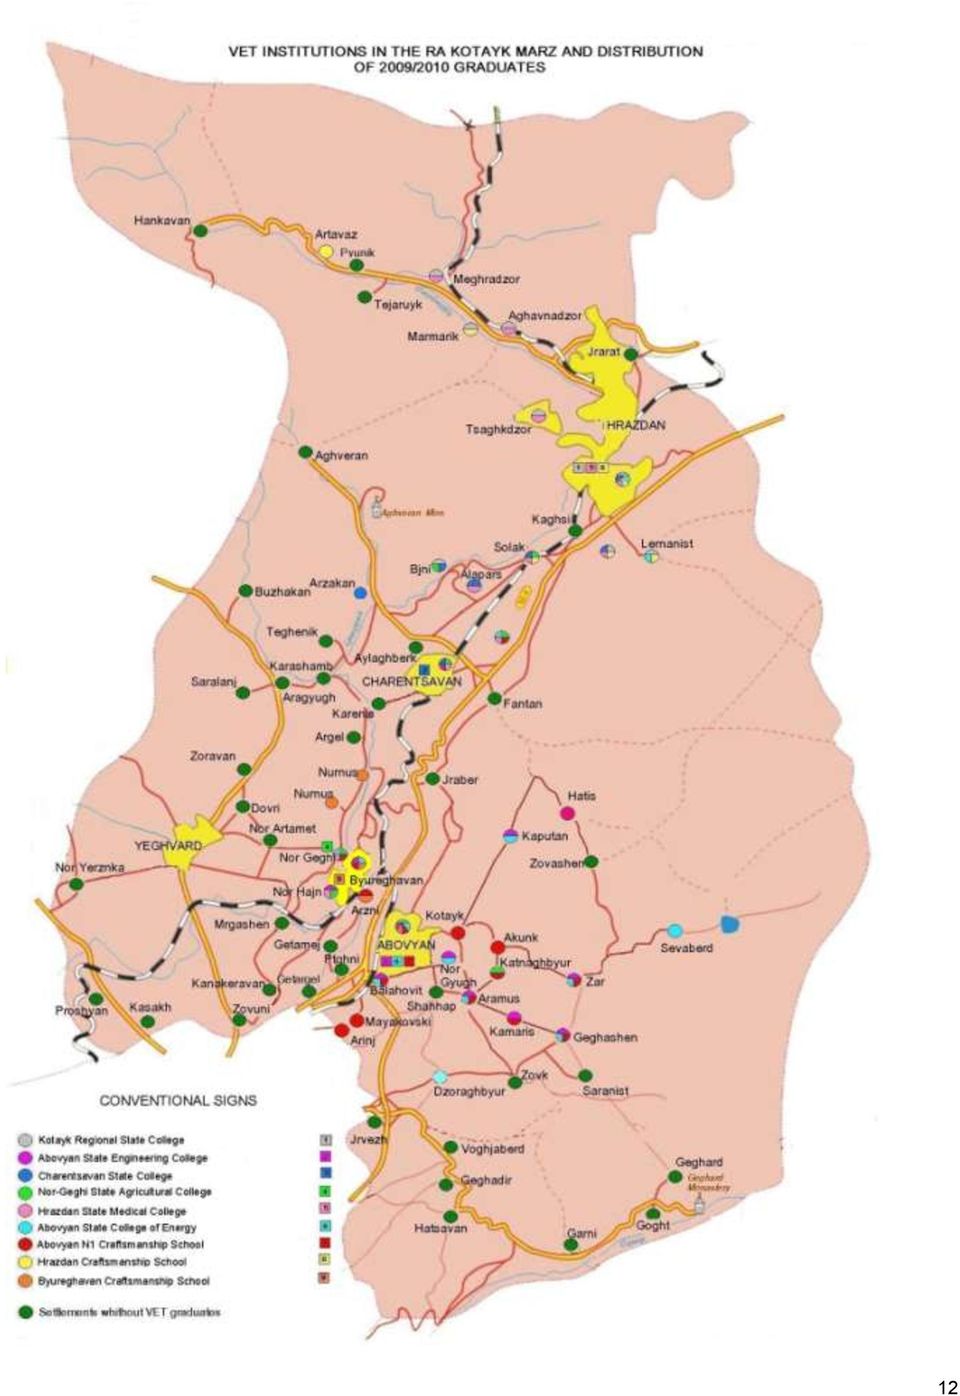
13 Table 3. Basic Poverty Indicators by Marzes and in Yerevan, 2008 and 2010, % Marz Extremely poor Very poor Poor Extremely poor Very poor Poor %, poor population %, total population Poverty depth Poverty acuteness Yerevan Aragatsotn Ararat Armavir Gegharkunik Lori Kotayk Shirak Syunik Vayots Dzor Tavush Total Source: RA NSS Education system For the academic year, the structure of education system in Kotayk Marz was the following 13 : 48 kindergartens with 5,126 children (2,657 girls); 105 general schools (including 1 private), 39 of which were in urban areas; 35,084 pupils, 16,980 of which were girls. Teaching staff of 3,327, of which 2,835 were women. 6 state middle vocational education institutions colleges with a total of 1,401 students (5.1% of country total for middle VET), 594 of which were women: 1. Kotayk Regional State College (in Hrazdan) 2. Abovyan State College of Energy 3. Abovyan State Engineering College 4. Charentsavan State College 5. Nor-Geghi State Agricultural College 6. Hrazdan State Medical College Combined teaching staff of 206 people, 157 (76.2%) of which were women. 5 Preliminary vocational education institutions 14 craftsmanship schools with a total of 567 students (10.1% of country total for Pre VET), 155 of which were women: 1. Byureghavan Craftsmanship School 2. Hrazdan Craftsmanship School 3. Abovyan N1 Craftsmanship School 4. Abovyan N2 Special Craftsmanship School 5. Nairi Craftsmanship School Combined teaching staff of 567 people, 155 (26.9%) of which were women. 24 out-of-school education centres teaching music, arts, etc. that served 3,637 children (2,467 girls). 2 private universities with 472 students, 293 of which were women. Total teaching staff of 19, 8 of which were women. Distribution of the professions by colleges and craftsmanship schools as well as the number of graduates in 2009 and 2010 are presented in the Annex Socio- Economic Situation of RA, January-March 2012 NSS, 2012, 14 Besides, Hrazdan branch of the European College in Armenia is acting in the marz. This college is functioning within the structure of the European Regional Academy established with participation of the Government. In 2012, the branch had only about 20 students and is planned to be closed down from the next academic year. 15 Nairi Craftsmanship School produced no graduates in 2009 and Data on the Abovyan N2 Special Craftsmanship School are not presented due to the special status of this institution (attached to the youth (juvenile offenders ) prison). 13

14 3.2. Ararat Marz The territory of RA Ararat Marz is 2,096km 2 ; agricultural land covers 156,706 ha, of which 26,953 ha are arable. Ararat has 4 urban communities: Artashat (marz centre), Ararat, Vedi and Masis, and 93 rural communities (for the marz map with indication of VET institutions and distribution of graduates, see the next page). RA Ararat Marz is located in the southwestern part of the country. In the north, it borders Yerevan, Armavir and Kotayk Marzes, in the east Gegharkunik, in the southwest Vayots Dzor, and in the south, it has a state border with Turkey. The marz has both mountains and plains, with Ararat valley occupying 40% of the marz territory. The highest point of the marz is the peak of Spitakasar (3,555m). The population is thousand people (8.6% of total RA population), with 83.1 thousand people (29.5%) living in urban areas and thousand (70.5%) living in rural areas Economy In 2010, the share of Armenia s total economic output for the following sectors that occurred in Ararat Marz was 17 : Industry 8.8 %, Agriculture 17.0%, Construction 3.8 %, Retail 1.6 %, Services 1.5 % Agriculture is Ararat s largest economic sector by value of output. Most of the agriculture is centred on the production of wine, fruit and vegetables. In 2011, the volume of gross agricultural production was billion AMD (16.9% of the national), which was an increase of 30.9 billion AMD from Industrial production in the marz faced large structural changes during the economic transition following independence. Machinery and instrument-making production fell dramatically, while food processing became a leading industry. Ararat has both large enterprises (i.e. with more than 250 employees, such as Ararat Cement Factory, Ararat Gold Extraction Plant, Ararat and Artashat Cannery, Vedi Alco, Avshar Wine Factory, International Masis Tobacco, ArmVinkon Wine Factory, etc.) and numerous medium and small enterprises (SME). There were 5,255 SMEs in 2010, out of which 3,732 were individual entrepreneurs, and 1,532 were legal entities. Almost 45% of SMEs were food production enterprises. The SME of Ararat Marz accounted for 6.4% of Armenia s total SME in The processing industry, which now makes up most of industrial production in the marz, can be broken into three main branches: a. food and beverages (processing and canning of fruits and vegetables, manufacturing of distilled alcoholic beverages), b. tobacco products (tobacco fermentation), c. non-metallic mineral products (manufacturing of cement, lime carbonate, asbestos cement products, cutting and processing of stone) Poverty assessment in Ararat Marz According to the results of household survey implemented by the RA NSS 19 (see Table 3 above), Ararat Marz is among the poorest in the nation with a 42.4% poverty rate. Table 3 also shows that poverty is on the rise; in 2010, the poverty rate increased from 2008 when it was 31.4%. The depth of poverty in Ararat Marz (9.7%) was the 4 th highest and above the national average of 8.1%. The poverty acuteness in Ararat Marz was 2.9%, which exceeds the national average of 2.5% and was only lower than Lori (3.6%), Shirak (3.6%) and Kotayk (4.0%) marzes. According to the Integrated Living Conditions Survey of Households 20, the unemployment rate in Ararat of 6.6% was the lowest in the nation in RA Resident Population as by 1 st of January 2012, NSS, 2012, 17 Marzes of the Republic of Armenia and Yerevan city in figures NSS, 2011, 18 Socio-economic Development Plan of Ararat Marz for (available only in Armenian) 19 Social Snapshot and poverty in Armenia, 2011, RA NSS, 20 Social Snapshot and Poverty in Armenia, Statistical Analytical Report Based on the Results of the 2010 Integrated Living Conditions Survey of Households, National Statistical Service of the Republic of Armenia, 2011, 14

15 15
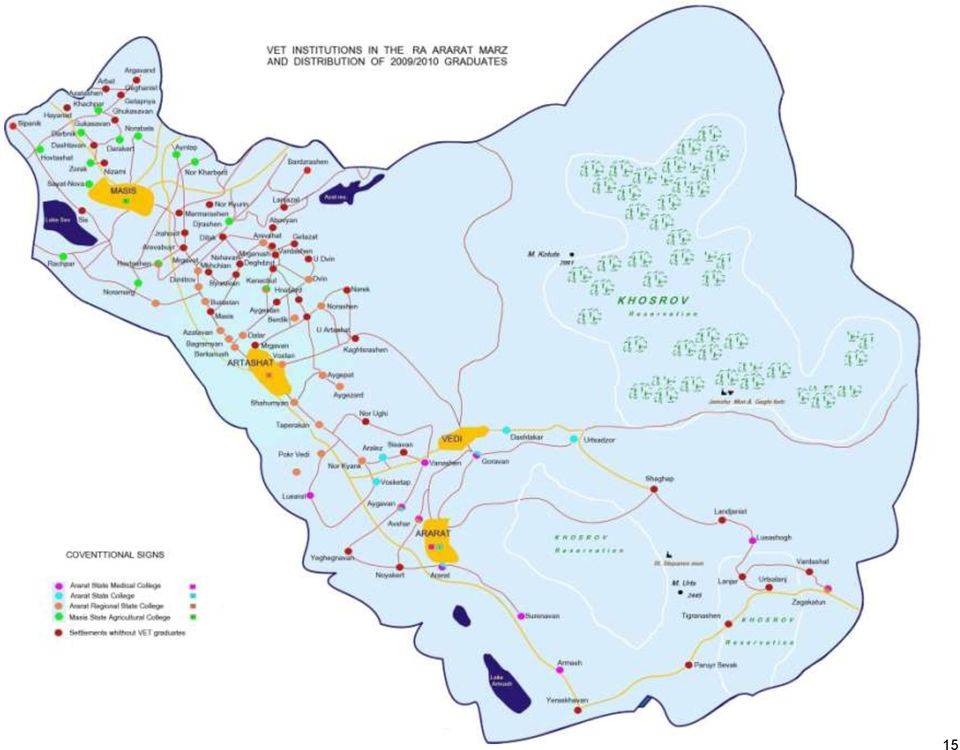
16 Education system For the academic year, the structure of education system in Ararat Marz was the following 21 : 73 kindergartens with 4,940 children (2,485 girls); 112 general schools (all state-run), 21 of which were in urban areas. 34,604 pupils, 16,702 of which were girls. A teaching staff of 3,354 people, 2,852 of which were women. 4 state middle vocational education institutions colleges with a total of 1,252 students (4.6% of country total for middle VET), 549 of which were women: 1. Ararat Regional State College (in Artashat) 2. Ararat State College 3. Masis State Agricultural College 4. Ararat State Medical College Combined teaching staff of 127 people, 88 (69.3%) of which were women. 2 private middle vocational education institutions 22, which had 64 students, of which 51 were women. Teaching staff of 22 people, 19 of which were women. Preliminary vocational education is implemented in the above institutions except the medical college. There were 139 students (2.5% of country total for Pre VET), 3 of which were women; 22 out-of-school education centres teaching music, arts, etc. that served 2,922 children (2,243 girls). There are no universities in the marz. The numbers of formal VET institutions and students ( academic year) by marzes are as follows: Kotayk: 6 State Colleges 1,401 students; 5 State Craftsmanship Schools 567 Ararat: 4 State Colleges 1,252 students; 2 Private Colleges 64 The number of different qualifications offered in VET institutions are as follows: Kotayk: Mid VET 23 qualifications; Pre VET 10 Ararat: Mid VET 17 qualifications; Pre VET 5 Total: Mid VET 30 qualifications; Pre VET 11 Distribution of the professions by colleges and craftsmanship schools, as well as the number of graduates in 2009 and 2010 are presented in Annex Socio- Economic Situation of RA, January-March 2012 NSS, 2012, 22 Besides, Vedi Branch of the European College in Armenia is acting in the marz. This college is functioning within the structure of the European Regional Academy established with participation of the Government. In 2012, the branch had around 90 student. 23 Nairi Craftsmanship School and Abovyan N2 Special Craftsmanship School are not considered. 16
 2. Ararat State College 3. Masis State Agricultural College 4. Ararat State Medical College Combined teaching staff of 127 people, 88 (69.")
17 5. SURVEY RESULTS The graduates were divided into 7 fields of study based on their qualifications (professions 24 ) (for a detailed list, see Annex 4): 1. Economics, Management, Clerical Works (hereinafter Economics) 2. Engineering, Technology, Manufacturing, Construction (hereinafter Engineering) 3. Information and Communication Technologies (hereinafter ICT) 4. Services 5. Education 6. Healthcare 7. Agriculture Grouping by internationally recognised economic activities, e.g. NACE, could not be done as graduates with such qualifications as Accountant, Manager, Technician may be employed in companies with various economic activities, which correlate to different NACE groups. Grouping, in accordance with the formal classifier of occupations (such as ISCO or National Classifier of Occupations), was also impossible because the qualifications titles in the List of Educational Professions defined by the GoA do not provide enough details. Another issue preventing the use of more traditional classification is that graduates with many qualifications may be employed in a wide range of occupations that relate to different groups or subgroups defined by ISCO 25. The final reason for using the chosen grouping was the relatively small number of graduates in the various professions within each field, which would have made judgements based on representative statistical data impossible. The total number of interviewed graduates was 451. Their distribution by marz, level of VET and the field is presented in the Table 4. Table 4. FIELD MARZ Number of interviewed graduates by the year of graduation, education level, field and marz KOTAYK ARARAT Total, % Middle VET Pre VET Middle VET Pre VET 1* 2* 3* Economics % % % % % Engineering % % % % % Healthcare % % % Education % % % ICT % % % Services % % % % % Agriculture % % % Total % % % % % *) 1 graduates of 2009 and 2010; 2 interviewed; 3 interviewed as % of 2009 and 2010 graduates In total, 23.4% of graduates were covered by the study in both marzes: 21.4% of Middle VET (hereinafter Mid VET) graduates and 30.8% of Preliminary VET (hereinafter Pre VET) graduates. The distribution of graduates by the year of graduation, education level, field and marz is presented in Annex Employment of graduates by the fields of study General data on employment At the time of the survey, 104 (37.1%) out of 280 interviewed graduates in Kotayk and 58 (33.9%) out of 171 interviewed graduates in Ararat were employed. When combined, 35.9% of graduates reported being employed (162 employed out of 451 interviewed). 24 In this report the titles of professions and qualifications are presented in strict accordance with the lists approved by the RA Government Decision No 73-N, for Middle VET and No 838-N, for Preliminary VET. 25 For example, those who graduated with the profession 1005 Thermo-power Plants and acquired qualification of Technician can be hired for very different positions (occupations) in a power plant. 17
 4. Services 5. Education 6. Healthcare 7. Agr")
18 A higher percentage of employment was registered among the graduates with Pre VET in both marzes: 39.1% (against 35.9%Mid VET graduates) in Kotayk and 50.0% (against 31.8% Mid VET graduates) in Ararat. Aggregated for both marzes, the percentage of employed with Pre VET was higher than those with Mid VET by almost 7% (40.8% and 34.0%, respectively). Among all employed graduates, only 35.8% (58 out of 162) were women. The share of employed among the interviewed women was only 21.1%, which was significantly lower than among men (59.1%).The share of those employed among rural graduates 26 was slightly larger (36.5%) than among the graduates from urban areas (35.6%). This trend is present in both marzes, with graduates from rural areas in Kotayk being employed 39.3% of the time versus 36.6% of urban respondents and a corresponding 34.8%/32.9% rural/urban split in Ararat marz. Agricultural graduates reported the highest employment rate at 75%, though it should be noted that only 12 people from this field were interviewed. Graduates of Engineering had the second highest percentage of employed graduates at 48.1%. The lowest reported employment rates were among the graduates of Education (26.3%) and Healthcare (22.6%). Distribution of employed graduates by the fields of study is presented in Table 5 and a more detailed distribution by Marz and VET level can be found in Annex 6. Table 5. The share of those employed among interviewed graduates by fields of study, marz and VET level Interviewed and Share of those employed employed Number of Number of By VET level By Marz Field of Study Interviewed Employed Total Mid VET Pre VET Kotayk Ararat Agriculture % 75.0% 75.0% n.r. 75.0% Engineering % 60.8% 35.8% 43.4% 66.7% ICT % 31.3% 45.0% 38.9% n.r. Economics % 36.1% 28.6% 36.3% 32.1% Services % % 47.8% - Education % 26.3% n.r. 30.0% 22.2% Healthcare % 22.6% n.r. 21.1% 23.6% Total % 34.0% 40.8% 37.1% 33.9% Among the various institutions, Masis State Agricultural College had the highest level of graduates who reported being employed (62.5% of interviewed graduates). The next highest performing institutions were Abovyan State Engineering College, Kotayk Regional State College, Abovyan State College of Energy, and Abovyan N1 Craftsmanship School, which all had graduate job placement rates from 42.4% to 44.4% (Table 6). The smallest share of employment reported was among the graduates of Ararat State College (12.5%) and Ararat State Medical College (9.4%). Table 6. The share of those employed among interviewed graduates by institutions Institution Number of interviewed Employed graduates Number % of interviewed Masis State Agricultural College Abovyan State Engineering College Kotayk Regional State College Abovyan State College of Energy Abovyan N1 Craftsmanship School Byureghavan Craftsmanship School Ararat Regional State College Nor-Geghi State Agricultural College Hrazdan Craftsmanship School Charentsavan State College Hrazdan State Medical College Ararat State College Ararat State Medical College Urban and rural graduates are defined on the bases of their residence but not the location of the VET institution from which they graduated. 18
 than among the graduates from urban areas (35.6%).")
19 Out of all the employed graduates, 17.9% (10.5% from Kotayk and 7.4% from Ararat) had been working without interruptions before, during and after their education: 9.3% (5.6% from Kotayk and 3.7% from Ararat) worked without interruptions during and after education and 20.4% (14.2% from Kotayk and 6.2% from Ararat) worked without interruptions only after their education. The remaining 52.5% of employed graduates reported having interruptions in their careers before Employment by type and size of organisations More than half 54.9% of employed graduates (56.7% in Kotayk and 51.7% in Ararat) were working in private companies, 36.4% (33.7% in Kotayk and 41.4% in Ararat) worked for state (public) organisations, 5.6% (6.7% in Kotayk and 3.4% in Ararat) were self-employed and only 2.5% (4 people) were involved in a family business. One female graduate had another type of employment, which she did not specify (Table 7). It is interesting to mention that the share of women employed in private companies (56.9%) and the share of women who were self-employed (6.9%) was higher than the share of men (53.8% and 4.8%,respectively). Table 7. Employees by type of organisations/business and by gender Type of employment Number employed Men Women Total % employed Number employed % employed Number employed % employed State/public employee Private employee Family/personal business Self-employed Other Total Education graduates were the most likely to be employed by public organisations (60%), though they were closely followed by Agriculture graduates (55.6%). The Education graduates engagement in public organisations was quite predictable as they are mostly employed as teachers in public general schools (there is only 1 private school in Kotayk marz and none in Ararat). The high level of public sector employment for Agriculture graduates, coupled with the fact that none reported being self-employed or engaged in family business (see also Annex 7), seems to point that this is not a representative group. The highest level of employment in private companies was registered among the ICT (78.6%) and Services (72.7%) graduates. Half of employed graduates reported working in micro and small enterprises (31.5% and 18.5% correspondingly), 13.6% worked for medium-sized and 11.1% for large enterprises 27. The remaining 25.3% (41 people) did not know the size of the organisation they worked for or refused to answer this question. Services graduates were the most likely to be employed in micro enterprises (54.5% of them). This could be explained 28 by the existence of many small service companies such as restaurants, cafes, small hotels and motels, etc. in the marzes, though the data presented below (part of this report) show very low relevance of the Services graduates qualifications to their current jobs, which indicates other factors could also have caused this. Graduates of Agriculture were the most likely to be employed in large enterprises (44.4%), followed again by Services (18.2%) and Engineering (16.0%). Most employed graduates (61.1%) were working in the organisations providing services (including those providing educational and healthcare services such as schools, hospitals, polyclinics, etc.), followed by industrial (21.6%) and construction companies (10.5%). Only 11 people (6.8%) were employed in agriculture companies (Table 8). These indicators do not seem to correlate with employment rate by field of study. However, this is quite reasonable as some fields of study (e.g. graduates of Economics or ICT) could be employed in any type of organisation. 27 This classification should be considered here with some reservations as, strictly speaking, it should relate only to commercial organisations: according to the RA Law on Support to Small and Medium-sized Entrepreneurship, the commercial organisations and individual entrepreneurs with up to 10 employees and with yearly income up to 100 mln AMD are considered as micro enterprises, with employees and yearly income up to 500 mln AMD are considered as small enterprises, with employees and yearly income up to 1,500 mln AMD are considered as medium-sized enterprises, and with 250 and more employees and yearly income 1,500 mln AMD and more are considered as large enterprises. 28 As the questionnaire didn t foresee a question about the title of the organisation the graduates work in, it is impossible to verify this hypothesis. 19
 were working in private companies, 36.4% (33.7% in Kotayk and 41.4% in Ararat) worked for state (public) organisations, 5.6% (6.7% in Kotayk and 3.")
20 Table 8. Distribution of employed graduates by the fields of the organisations they work in Employed graduates Field of organisation Kotayk Ararat Total Mid VET Pre VET Mid VET Pre VET Mid VET Pre VET Total No % No % No % No % No % No % No % Agriculture Construction Industry Service Total Employment types, relevance of job and qualification, importance of diplomas and job mobility It is worth emphasising that a much larger share of employed Pre VET graduates were working as highly qualified specialists 29 (18.9% against 8.3% of Mid VET graduates). Employed Mid VET graduates, however, were more likely to be working as average qualification specialists (31.2% against 11.3% of Pre VET graduates) or office employees (10.1% against 3.8% of Pre VET% graduates). It is also interesting to note that 13.8% of employed Mid VET graduates were working as skilled workers, a position that normally relates to the qualifications of Pre VET graduates. Meanwhile, only 24.5% of employed Pre VET graduates were employed as skilled workers. The weak conformity between the level and field of education and the positions held by the graduates was confirmed by graduates, who generally reported low relevance of their education to their occupations. Only 26.5% of employed graduates thought that their qualifications were relevant to their current occupations, 9.9% found it partly relevant and 63.6% found their education not relevant to their employment at all. It is interesting that the highest level of relevance was reported among the graduates of Healthcare (71.5% relevant or partly relevant) and Education (70.0% relevant or partly relevant), which also had the lowest job placement levels (Table 9: the last column presents the share of employed by the fields of study for comparison purposes). Table 9. Relevance of employed graduates education to current jobs by fields of study, marz and the VET level, % of employed graduates KOTAYK ARARAT Total Mid VET Pre VET Mid VET Pre VET SoE R PR NR R PR NR R PR NR R PR NR R PR NR Healthcare n.g. n.g. n.g n.g. n.g. n.g Education n.g. n.g. n.g n.g. n.g. n.g ICT n.g. n.g. n.g. n.g. n.g. n.g Agriculture n.g. n.g. n.g. n.g. n.g. n.g Economics n.e. n.e. n.e Engineering Services n.e. n.e. n.e n.e. n.e. n.e. n.e. n.e. n.e Total R Relevant; NR Not relevant; PR Partly relevant; n.g. no graduates; n.e. no employed; SoE share of employed graduates. The lowest level of relevance (18.0% relevant or partly relevant) was registered among the graduates of Engineering, where the level of job placement was the second highest, after Agriculture. No Mid VET Engineering graduate in Ararat Marz had a job relevant to his/her qualifications. Another peak of irrelevance (100%) was registered among Mid VET graduates in the ICT field, though 55.6% of their peers with Pre VET had relevant jobs. Taking into account the level of job relevance to the qualifications in the remaining fields, Chart 1 shows that, in general, this indicator, with some minor deviations, varies inversely to the employment rate. 29 The formulation High quality specialist mentioned in the English version of the questionnaire does not precisely reflect the Armenian wording that was actually used during the interviews. The latter one should be translated as Highly qualified specialist 20

21 Chart 1. Correlation between the level of job to qualification relevance 30 and the shares of the employed by fields of study, % Economics Services Engineering Education Healthcare Agriculture Relevance of the job level to the qualification Share of employed It is important to determine the different reasons why employed graduates felt their education was irrelevant to their jobs. For most, having a job from another field (56.3%), was the main reason while requiring lower level of qualification (22.7%), requiring only a part of acquired competences (10.1%) or requiring higher level of qualification (1.7%) were also reported (9.2% of employed graduates could not or refused to answer). For 86.6% of those who did not have a job relevant to their qualification, an absence of alternative in the labour market was the reported reason, while 4.2% reported a lack of adequate skills (9.2% referred to other not specified reasons). One positive trend observed with those who did not have a job that corresponded with their education was that 65.4% of them had adjusted to it easily. Less than a third (27.2%) adjusted with some difficulty, while 4.9% reported it was difficult to adjust and only 1 graduate could not adjust at all. Only three graduates (4.9%) received some training from the employer. Thus, in the majority of cases, the relevance of qualification did not play a decisive role in job placement for either graduates or employers. This correlates with the results of different studies 31, according to which only a small share of employers consider formal qualifications important while hiring employees. The graduates answers to the question To what extent was the diploma important for finding the job? show similar results to the questions on relevance of their education. Fifty-four percent of graduates thought that their diplomas were not important at all (and 14.8% rather not important) while only 21.0% thought that their diplomas were very important and 9.9% felt it was rather important. As expected, graduates of Education and Healthcare programmes, who reported most often that their qualifications were relevant to their work, felt that their diploma was more important in finding a job than other graduates did (60.0% and 52.4%, respectively). In contrast to the Education and Healthcare graduates, no Services graduates found their diploma was very important for job placement (only 18.2% rather important and the remaining 81.8% not important at all). For ICT, Engineering and Economics graduates, the diploma did not play any role in finding a job for 71.4%, 64.0% and 59.6% of employed graduates, respectively (Chart 2). 30 Based on the sum of Relevant and Partially relevant 31 See particularly: Report on the analysis of the adequacy of competences provided by VET system for labour market requirements, ETF, GDF, Yerevan 2012, 21

22 Chart 2. Importance of diploma in finding a job, % of employed graduates Education Healthcare Agriculture Economics Engineering ICT Services Total Very important Rather important Rather not important Not important at all For more than half of graduates (50.6%), their current job was their first, for 31.5% it was their second, for 8.0% it was their third, and for 8.7% it was their 4 th to 6 th job (Table 10). For two graduates, their current jobs were their 10 th ones. The largest turnover (3 jobs or more) was reported among Agriculture graduates (55.6%), followed by ICT (28.6%) and Engineering (26.0%). The most stable graduates (not more than 2 jobs) were those from Education and Healthcare (both 100%), followed by Economics (89.4%) and Services (81.8%). In aggregate, 82.1% of employed had no more than two jobs after graduation, which again shows their adaptability to a job regardless of their formal qualification. When analysed by gender, men were more likely have had more than two jobs (26%) than women, who reported this just 1.4% of the time. Table 10. Number of jobs after graduation (including self-employment and current job), number and % of employed graduates by field No of jobs ECON ENG ICT EDU SERV HEAL AGRO Total changed No % No % No % No % No % No % No % No % Graduates salaries and types of contracts More than half (53.0%) of the employed graduates reported an average monthly salary of 50 to 100 thousand AMD (about euro). There were, however, a considerable number of respondents (36.6%) who had lower (up to 50 thousand AMD) and 9.7% who had higher (100 to 200 thousand AMD) salaries. Only one graduate from Agriculture had a salary higher than 200 thousand AMD (Chart 3). 22
INTERIM POVERTY REDUCTION STRATEGY PAPER
 INTERIM POVERTY REDUCTION STRATEGY PAPER ARMENIA SOCIAL TRENDS 04 This issue of Armenia Social Trends is devoted to the International Day for the Eradication of Poverty, which is celebrated around the
PART 1 - ARMENIA: ECONOMIC GROWTH, POVERTY, AND LABOR MARKET DEVELOPMENT IN 2004-2007
 - ARMENIA: ECONOMIC GROWTH, POVERTY, AND LABOR MARKET DEVELOPMENT IN 2004-2007 CHAPTER 1: DEMOGRAPHICS AND MIGRATION The continuous decline in Armenia s population during the 1990s was first reversed in
SECTOR ASSESSMENT (SUMMARY): MICRO, SMALL, AND MEDIUM-SIZED ENTERPRISE DEVELOPMENT
: MICRO, SMALL, AND MEDIUM-SIZED ENTERPRISE DEVELOPMENT") Women s Entrepreneurship Support Sector Development Program (RRP ARM 45230) SECTOR ASSESSMENT (SUMMARY): MICRO, SMALL, AND MEDIUM-SIZED ENTERPRISE DEVELOPMENT A. Overview 1. Significance of micro, small,
Women s Entrepreneurship Support Sector Development Program (RRP ARM 45230) SECTOR ASSESSMENT (SUMMARY): MICRO, SMALL, AND MEDIUM-SIZED ENTERPRISE DEVELOPMENT A. Overview 1. Significance of micro, small,
Characteristics of Private Farms and Family Farm Labour in Hungary by Settlement Size
 Characteristics of Private Farms and Family Farm Labour in Hungary by Settlement Size Zsolt Andrási Drafter, HCSO E-mail: Zsolt.Andrasi@ksh.hu Pál Bóday Head of Section, HCSO E-mail: Pal.Boday@ksh.hu The
Summary of the Research on the role of ICT related knowledge and women s labour market situation
 Summary of the Research on the role of ICT related knowledge and women s labour market situation Comparative anlysis of the situation in the five surveyed countries: Analysis of data about employment shows
Ruben Yeganyan. Economist, Demographer, Ph.D.
 Ruben Yeganyan 21 Mashtots Ave Yerevan Republic of Armenia Home phone: (37410) 53-67-87 Cell phone: (37491) 64-91-70 Economist, Demographer, Ph.D. E-mail: rubenyeg@mail.ru Armenian Social - Demographical
RA VAYOTS DZOR MARZ MA
 RA VAYOTS DZOR MARZ MA 261 RA VAYOTS DZOR MARZ Marz centre - Eghegnadzor town Territory 2308 square km Agricultural land 75939 ha including arable land 19857 ha Urban communities 3 Rural communities 41
The VET Systems of Ukraine, Moldova, Georgia, Turkey, Bulgaria and Romania in the context of the Torino Process
 Project 2.3.1.73963.333 MIS ETC 2674 MANAGE.EDU: Efficient Education Management Network for LLL in the Black Sea Basin The VET Systems of Ukraine, Moldova, Georgia, Turkey, Bulgaria and Romania in the
growing sources of employment in the country. In
 SRI LANKA 8,000 7,000 6,000 5,000 Fig. 1: Employment by Major Economic Activity ('000s), 2002-2008 Agriculture, Hunting, Forestry, Mining and Wholesale and Retail Trade Hotels and Restaurants Agriculture,
PART 1 - ARMENIA: ECONOMIC GROWTH, POVERTY, AND LABOR MARKET IN 2004-2006
 PART 1 - ARMENIA: ECONOMIC GROWTH, POVERTY, AND LABOR MARKET IN 2004-2006 CHAPTER 1: DEMOGRAPHICS AND MIGRATION The continuous decline 1 in Armenia s population during the 1990s was first reversed in 2004,
WOMEN ENTREPRENEURSHIP STRATEGY IN ARMENIA
 WOMEN ENTREPRENEURSHIP STRATEGY IN ARMENIA Elaborated in the frame of the ADB financed ARMENIA: WOMEN S ENTREPRENEURSHIP SUPPORT SECTOR DEVELOPMENT PROGRAM Project Number: RRP ARM 45230 for SMEDNC, YEREVAN
Requirements of the Labour market for Education in Economics in the Czech Republic
 DANA KOCKOVA (National Institute of Technical and Vocational Education) Requirements of the Labour market for Education in Economics in the Czech Republic 1 Initial Vocational Qualification Vocational
Business Development for Youth Economic Empowerment in Moldova
 Business Development for Youth Economic Empowerment in Moldova UNICEF Moldova USAID Final report May 2008 May 2010 Contribution Data Name of Project: Business Development for Youth Economic Empowerment
Household Finance and Consumption Survey
 An Phríomh-Oifig Staidrimh Central Statistics Office Household Finance and Consumption Survey 2013 Published by the Stationery Office, Dublin, Ireland. Available from: Central Statistics Office, Information
American University of Armenia
 American University of Armenia Master Paper Agricultural Lending System & Contracts in the Republic of Armenia Prepared by MCLS 2 nd year student Naira Grigoryan Instructor Emil Babayan 2007, Yerevan,
Investment incentives in Bulgaria
 Investment incentives in Bulgaria Types of incentives under the current Bulgarian legislation Tax incentives Incentives under the Investment Promotion Act (IPA) Employment incentives (training and job
ABSA SME INDEX Q2 2013
 ABSA SME INDEX Q2 2013 Theme: Women in Business October 2013 Source: Economists.co.za Highlights Stronger employer performance boosts SME activity in South Africa Absa SME Index rises to highest level
OPPORTUNITIES FOR VOCATIONAL TRAINING AND TRAINING IN INVESTMENT PROJECT MANAGEMENT IN BULGARIA
 Articles 43 Econ Lit I290 OPPORTUNITIES FOR VOCATIONAL TRAINING AND TRAINING IN INVESTMENT PROJECT MANAGEMENT IN BULGARIA Assistant Prof. Vanya Antonova Introduction Arguably, having the necessary knowledge,
Skills for employability and competitiveness
 EUROPEAN COMMISSION CONTRIBUTION TO MINISTERIAL MEETING IN RIGA ON 22 JUNE 2015 Skills for employability and competitiveness The economic crisis led to a massive destruction of jobs - many of them filled
Bottleneck Vacancies in Hungary
 Bottleneck Vacancies in Hungary Skilled and elementary occupations affected Bottleneck vacancies occur both within skilled and elementary occupations, such as retail sellers, stone masons, cooks, truck-drivers
Education Factor and Human Resources Development
 Education Factor and Human Resources Development Albania Case Sonila Berdo, MBA University Pavaresia Vlorë Abstract The article gives a general view of the actual situation and the potential importance
WELCOME AND TAKING CHARGE
 WELCOME AND TAKING CHARGE In this preliminary phase, you will be fully informed by the information point that will be indicated to you by your Region the contents and services provided by the Programme
INSURANCE REGULATORY AUTHORITY
 INSURANCE REGULATORY AUTHORITY RISKS AND MITIGATION STRATEGIES BY MICRO AND SMALL ENTERPRISES IN KENYA: A CASE OF MERU COUNTY VICTOR MOSE, PILLY OSIEMO AND ROBERT KULOBA Policy Research and Development
0.8 Response Burden (Primary
 Quality declaration Post Graduate Education 0 General Information on Statistical Products 0.1 Title Post Graduate Education 0.2 Subject Area Education 0.3 Responsible Authority, Office, Person, etc. Mrs.
How To Teach In Ukmanistan
 PRIMARY AND SECONDARY EDUCATION IN UZBEKISTAN Statistical bulletin FACTS AND FIGURES 2000-2006 Statistics Series 5 PRIMARY AND SECONDARY EDUCATION IN UZBEKISTAN Statistical bulletin FACTS AND FIGURES
Statistical Data on Women Entrepreneurs in Europe
 Statistical Data on Women Entrepreneurs in Europe September 2014 Enterprise and Industry EUROPEAN COMMISSION Directorate-General for Enterprise and Industry Directorate D SMEs and Entrepreneurship Unit
Tailor-made training programmes in Bulgaria
 MUTUAL LEARNING PROGRAMME: PEER COUNTRY COMMENTS PAPER - BULGARIA Tailor-made training programmes in Bulgaria Peer Review on Tailor-made training programmes Luxembourg, 23-24 April 2009 A paper submitted
LATVIA. The national Youth Guarantee Implementation Plan 2014-2018 (YGIP)
") LATVIA The national Youth Guarantee Implementation Plan 2014-2018 (YGIP) 1. Context/Rationale (see SWD section 1.2 and 1.5) Description of youth unemployment in Latvia. The overall youth unemployment rate
LATVIA The national Youth Guarantee Implementation Plan 2014-2018 (YGIP) 1. Context/Rationale (see SWD section 1.2 and 1.5) Description of youth unemployment in Latvia. The overall youth unemployment rate
A Labour Economic Profile of New Brunswick
 A Labour Economic Profile of New Brunswick January 2016 Table of Contents New Brunswick Highlights........................... 2 Current Business Environment....................... 3 GDP Snapshot....................................
Ankara 14 18 March, 2011 Mr. Kari Pitkanen
 1.2.3 Policy Value and Analysis and Evaluation Day 1 Education Sector Ankara 14 18 March, 2011 Mr. Kari Pitkanen Program of the Week Monday: Elements and indicators of national education systems and policies
To the Implementation Plan for the Czech Youth Guarantee programme
 Annex 4/1 To the Implementation Plan for the Czech Youth Guarantee programme (Update of April 2014) Table 1: Key organizations to promote and implement the Youth Guarantee programme Key organization name
Public and Private Sector Earnings - March 2014
 Public and Private Sector Earnings - March 2014 Coverage: UK Date: 10 March 2014 Geographical Area: Region Theme: Labour Market Theme: Government Key Points Average pay levels vary between the public and
Start-up Business Support Program
 Start-up Business Support Program Lilit Apujanyan International Cooperation Programs Coordinator SME Development National Center of Armenia Enterprise Europe Network Correspondence Center in Armenia Tools
Country Profile Finland
 1 Finland Name of full occupational title of the target group e.g. Health Care Assistant (HCA) Regulation for Target Group / Legal Aspects: Regulation Regulations below Registered Nurse! The following
Construction Academies in Southeast Europe: Pilot Projects in the Field of Dual Vocational Training
 Construction Academies in Southeast Europe: Pilot Projects in the Field of Dual Vocational Training Walter Reiter Background Basic assumption: dual vocational education is a successful method of providing
The Activities of the Chair of Social Work and Social Technologies in the Frames of Tempus Project. The aim of Tempus project and its activities
 The Activities of the Chair of Social Work and Social Technologies in the Frames of Tempus Project The aim of Tempus project and its activities TEMPUS is the European Union s programme which supports the
ANNEX E. Czech Republic
 Czech Republic Population: 10.24 m. Fertility rate: 1.18. GDP per capita: USD 15 100. Children under 6years: 540 000. Female labour force participation: Female labour force participation rate for women
Young Italians difficulties in finding work threaten to undermine investment in education.
 Education at a Glance: OECD Indicators is the authoritative source for accurate and relevant information on the state of education around the world. It provides data on the structure, finances, and performance
Evolution of informal employment in the Dominican Republic
 NOTES O N FORMALIZATION Evolution of informal employment in the Dominican Republic According to official estimates, between 2005 and 2010, informal employment fell from 58,6% to 47,9% as a proportion of
BOTSWANA. Contribution to the 2015 United Nations Economic and Social Council (ECOSOC) Integration Segment
 Integration Segment") BOTSWANA Contribution to the 2015 United Nations Economic and Social Council (ECOSOC) Integration Segment 1 2015 ECONOMIC AND SOCIAL COUNCIL (ECOSOC) INTEGRATION SEGMENT: ACHIEVING SUSTAINABLE DEVELOPMENT
BOTSWANA Contribution to the 2015 United Nations Economic and Social Council (ECOSOC) Integration Segment 1 2015 ECONOMIC AND SOCIAL COUNCIL (ECOSOC) INTEGRATION SEGMENT: ACHIEVING SUSTAINABLE DEVELOPMENT
1. Key indicators and benchmarks
 1. Key indicators and benchmarks Italy EU average Europe 2020 target / Europe 2020 headline targets 2009 2012 2009 2012 Benchmark 1. Early leavers from education and training (age 18-24) 2. Tertiary educational
Republic of Macedonia Farm Business Data 2001/2002
 FARM BUSINESS DATA MACEDONIA Provisional data 2001-2002 Skopje, July, 2002 Ben Kamphuis Lazo Dimitrov CONTENTS Preface... 2 1 Introduction... 4 1.1 The Financial Farm Monitoring Program...4 1.2 Project
MINISTRY OF YOUTH, SPORT AND CULTURE
 MINISTRY OF YOUTH, SPORT AND CULTURE DEPARTMENT OF YOUTH YOUTH DEVELOPMENT FUND APPLICATION GUIDELINES DRAFT DEFINITION OF TERMS Out-of-school youth - Any youth who is not currently attending any school
THE TERTIARY TECHNOLOGICAL EDUCATION IN GREECE AND ITS POSITION IN THE SINGLE EUROPEAN HIGHER EDUCATION AREA
 THE TERTIARY TECHNOLOGICAL EDUCATION IN GREECE AND ITS POSITION IN THE SINGLE EUROPEAN HIGHER EDUCATION AREA Chatzichristos Christos 1, Karasavvoglou Anastasios 2, Vassiliadis Spyros 1 1 Technological
Statement by Union Minister for Education at the Conference on Development Policy Options
 Statement by Union Minister for Education at the Conference on Development Policy Options Draft with Special Reference to Education and Health in Myanmar (14-2-2012, MICC, Nay Pyi Taw) Excellencies, Union
Member States Factsheets I R E L A N D CONTENTS. Main figures - Year 2014 4 591 087 inhabitants Area 69 798 km 2
 January 2015 Member States Factsheets I R E L A N D CONTENTS Main figures 2014 1. KEY DATA 2. POPULATION & ECONOMY 3. FINANCIAL ASPECTS 4. ECONOMIC ACCOUNTS 5. AGRICULTURAL TRADE 6. FARM STRUCTURE 1 2
EDUCATION IN THE REPUBLIC OF BULGARIA IN 2011/2012 SCHOOL YEAR
 EDUCATION IN THE REPUBLIC OF BULGARIA IN 2011/2012 SCHOOL YEAR The level of education of population determines every contemporary country and plays an important economic and social role of the present
Member States Factsheets I T A L Y CONTENTS. Main figures - Year 2014 59 685 227 inhabitants Area 302 069 km 2
 January 2015 Member States Factsheets I T A L Y CONTENTS Main figures 2014 1. KEY DATA 2. POPULATION & ECONOMY 3. FINANCIAL ASPECTS 4. ECONOMIC ACCOUNTS 5. AGRICULTURAL TRADE 6. FARM STRUCTURE 1 2 3 4-5
Lithuanian experience: Towards Accessible and Inclusive Early Childhood Education. Teresa Aidukienė Bucharest, 7 8 April 2014
 Lithuanian experience: Towards Accessible and Inclusive Early Childhood Education Teresa Aidukienė Bucharest, 7 8 April 2014 1 Lithuania in Europe 2 Lithuania today Area 65,300 km 2 Population 2,944,000
How To Audit The Smallholder Plantations Entrepreneurship Development Programme
 Smallholder Plantations Entrepreneurship Development Programme - 2013 -------------------------------------------------------------------------------------------- The audit of Financial Statements of the
Health and welfare Humanities and arts Social sciences, bussiness and law. Ireland. Portugal. Denmark. Spain. New Zealand. Argentina 1.
 Indicator to Which fields of education are students attracted? Women represent the majority of students and graduates in almost all OECD countries and largely dominate in the fields of education, health
Creating a business in the digital age developing entrepreneurship competencies for young Europeans through ementorship (CREBUS) PROJECT
 PROJECT") Creating a business in the digital age developing entrepreneurship competencies for young Europeans through ementorship (CREBUS) PROJECT PROJECT NUMBER: 511822 LLP 1 2010 1 RO KA3 KA3MP NATIONAL ANALYSIS:
Creating a business in the digital age developing entrepreneurship competencies for young Europeans through ementorship (CREBUS) PROJECT PROJECT NUMBER: 511822 LLP 1 2010 1 RO KA3 KA3MP NATIONAL ANALYSIS:
Quality of life in the Spanish workplace
 Quality of life in the Spanish workplace Introduction Satisfaction in the workplace Work environment Work organisation Training and career development Job mobility Work-life balance Trends over the period
EQAVET Sectoral Seminar
 EQAVET Sectoral Seminar Quality Assurance in the Healthcare sector in Europe Background paper Introduction Ensuring that the Quality Assurance National Reference Points are supported to engage with stakeholders
Scotland s Class of 99: the early career paths of graduates who studied in Scottish higher education institutions. Summary report
 Scotland s Class of 99: the early career paths of graduates who studied in Scottish higher education institutions Summary report Scotland s Class of 99: the early career paths of graduates who studied
TRQN III needs Armenia Needs Database Armenia Host organization Sector Field of Expertise Location "Darbas" Medical Center CJSC
 TRQN III needs Armenia Needs Database Armenia Host organization Sector Field of Expertise Location 1 "Darbas" Medical Center CJSC Health Family medicine skills for management of pregnancy & chronic diseases
ՀՀ առողջապահության նախարարություն STRENGHTENING QUALITY ASSURANCE IN PRIMARY HEALTH CARE IN THE REPUBLIC OF ARMENIA. Implementation Plan
 ՀՀ առողջապահության նախարարություն STRENGHTENING QUALITY ASSURANCE IN PRIMARY HEALTH CARE IN THE REPUBLIC OF ARMENIA Implementation Plan YEREVAN Strengthening Quality Assurance in Primary Health Care in
Country Presentation 5/23/2005 1
 Country Presentation 5/23/2005 1 General Information About Armenia v Territory - 29.800 km 2 v Population - 3.8 million, 98% of which are Armenians v Capital - Yerevan (1.25 million population) v State
A national Strategy for Entrepreneurship Education and Training.
 UNMIK IPVQ INSTITUCIONET E PËRKOHSHME VETËQEVERISËSE PROVISIONAL INSTITUTIONS OF SELF-GOVERNMENT PRIVREMENE INSTITUCIJE SAMOUPRAVLJANJA QEVERIA E KOSOVËS GOVERNMENT OF KOSOVO VLADA KOSOVA MINISTRIA E TREGTISË
Results of Public Opinion Poll and Review of International Practice About the draft law on Vocational Education (December 2006)
") Results of Public Opinion Poll and Review of International Practice About the draft law on Vocational Education (December 2006) 1.1 Focus group analysis 1 From October through November 2006 Transparency
Results of Public Opinion Poll and Review of International Practice About the draft law on Vocational Education (December 2006) 1.1 Focus group analysis 1 From October through November 2006 Transparency
TECHNICAL EDUCATION AND VOCATIONAL TRAINING REFORM IN THE KNOWLEDGE ECONOMY CHALLENGES AND OPPORTUNITIES AT THE SECONDARY LEVEL
 TECHNICAL EDUCATION AND VOCATIONAL TRAINING REFORM IN THE KNOWLEDGE ECONOMY CHALLENGES AND OPPORTUNITIES AT THE SECONDARY LEVEL SESSION 1: TEVT AND GLOBAL CHALLENGES TEVT: history 1) In the beginning,
The DTU PhD programme: Results from a survey among PhD graduates and recruiters. Technical University of Denmark. Report.
 The DTU PhD programme: Results from a survey among PhD graduates and recruiters Technical University of Denmark Report October 2015 AARHUS COPENHAGEN HAMBURG LONDON MALMÖ NUUK OSLO SAIGON STAVANGER VIENNA
1. VOCATIONAL TRAINING SYSTEM
 1. VOCATIONAL TRAINING SYSTEM University Doctoral degree (Ph.D) Master 1º - 2º Degree 1st 4th High vocational training Languages: High Secondary Education: High School 1st 2nd Intermediate vocational training
REMITTANCE TRANSFERS TO ARMENIA: PRELIMINARY SURVEY DATA ANALYSIS
 REMITTANCE TRANSFERS TO ARMENIA: PRELIMINARY SURVEY DATA ANALYSIS microreport# 117 SEPTEMBER 2008 This publication was produced for review by the United States Agency for International Development. It
MAKE IT MATCH! EASTERN PARTNERSHIP NETWORK 25 27 June 2014. Workshop summary ARMENIA, AZERBAIJAN, BELARUS, GEORGIA, MOLDOVA, UKRAINE
 MAKE IT MATCH! ARMENIA, AZERBAIJAN, BELARUS, GEORGIA, MOLDOVA, UKRAINE EASTERN PARTNERSHIP NETWORK 25 27 June 2014 Workshop summary The initiative is 2 Skills Anticipation and Matching Provide an early
The Role of TVET Providers in Training for Employees: New Zealand paper
 APEC Forum on Human Resources Development, Chiba November 2008 The Role of TVET Providers in Training for Employees: New Zealand paper Executive Summary New Zealand needs to raise labour productivity if
General Information about Georgian Labour Market
 Short Country Survey Findings - GEORGIA Prepared by the Ministry of Education and Science of Georgia for The BFUG Employability Working Group December 2007 General Information about Georgian Labour Market
GCI = OC w + OC l + OC c <
 Analysis of Competitiveness of German Agriculture based on FADN data Thünen Institute of Farm Economics GCI = FNI > = 1 OC w + OC l + OC c < Page IAFE-NRI 0 Conference Werner Kleinhanss CAP and Competitiveness
Screening report Turkey
 13 February 2006 Screening report Turkey Chapter 26 Education and Culture Date of screening meetings: Explanatory meeting: 26 October 2005 Bilateral meeting: 16 November 2005 1 I. CHAPTER CONTENT The areas
CURRICULUM VITAE. Language Speaking Reading Writing Ukrainian native native native Russian native native native English 5 5 5 Polish 3 3 1
 CURRICULUM VITAE 1. Family name: Amerova 2. First names: Elena 3. Nationality: Ukrainian 4. Education: Institution Kiev National Economic University Kiev State University Date: from/ to 2000-2002 1977-1982
Bottleneck Vacancies in Finland
 Bottleneck Vacancies in Finland The health care sector is most affected by recruitment bottlenecks Main bottlenecks appear within the health care sector. Demand for qualified professionals is acute for
Joint conclusions of the Spanish Presidency EU Youth Conference youth employment and social inclusion, Jerez, Spain 13-15 April 2010
 Joint conclusions of the Spanish Presidency EU Youth Conference youth employment and social inclusion, Jerez, Spain 13-15 April 2010 Youth Employment is the common theme of the three EU Youth Conferences
Children in Egypt 2014 A STATISTICAL DIGEST
 Children in Egypt 2014 A STATISTICAL DIGEST CHAPTER 8 EDUCATION Children in Egypt 2014 is a statistical digest produced by UNICEF Egypt to present updated and quality data on major dimensions of child
Labour Force Survey: Q2/2015
 22 September 2015 1100 hrs 172/2015 During the second quarter of 2015, Labour Force Survey estimates indicate an increase of 1.8 per cent in employment when compared to the corresponding quarter of 2014.
Annex 1 STUDY ON TEACHER EDUCATION FOR PRIMARY AND SECONDARY EDUCATION IN SIX EASTERN PARTNERSHIP COUNTRIES ARMENIA
 Annex 1 STUDY ON TEACHER EDUCATION FOR PRIMARY AND SECONDARY EDUCATION IN SIX EASTERN PARTNERSHIP COUNTRIES ARMENIA Contents 1 OVERVIEW OF CURRENT STRUCTURE OF THE EDUCATION SYSTEM... 2 2 THE ROLE OF PRIMARY
ENTREPRENEURIAL COMMUNITIES INITIATIVE. Call for applications for participation
 ENTREPRENEURIAL COMMUNITIES INITIATIVE Call for applications for participation Entrepreneurial Communities Initiative 02 CALL FOR APPLICATIONS FOR PARTICIPATION: ENTREPRENEURIAL COMMUNITIES INITIATIVE
EMPLOYERS PERCEPTIONS OF THE EMPLOYABILITY AND SKILLS OF RECENT GRADUATES IN CATALONIA. Main findings of the AQU Catalunya Employers Survey 2014
 EMPLOYERS PERCEPTIONS OF THE EMPLOYABILITY AND SKILLS OF RECENT GRADUATES IN CATALONIA Main findings of the AQU Catalunya Employers Survey 2014 EMPLOYERS PERCEPTIONS OF THE EMPLOYABILITY AND SKILLS OF
First Pan-European Nurse Educators Conference Udine, November 2007. The Career Pathways of Nurse Educators in Europe: A Collaborative Project
 First Pan-European Nurse Educators Conference Udine, November 2007 The Career Pathways of Nurse Educators in Europe: A Collaborative Project BASELINE INFORMATION GATHERING SHEET One of the important early
2.1 Net enrolment ratio in primary education
 2.1 Net enrolment ratio in primary education GOAL AND TARGET ADDRESSED Goal 2: Achieve universal primary education Target 2.A: Ensure that, by 2015, children everywhere, boys and girls alike, will be able
CREATING AN INNOVATION AGENDA TO GENERATE SUSTAINABLE GROWTH, ENERGY EFFICIENCY AND JOBS IN EUROPE
 CREATING AN INNOVATION AGENDA TO GENERATE SUSTAINABLE GROWTH, ENERGY EFFICIENCY AND JOBS IN EUROPE BERT COLIJN AND BART VAN ARK NEUJOBS DELIVERABLE NO. 3.9 A discussion brief focusing on: Abstract The
Surveying and Land Administration Sustainable Education for Developing Countries
 Surveying and Land Administration Sustainable Education for Developing Countries Chris LUNNAY, Australia Key words: Education, land registration, capacity building, sustainability, Lao PDR, Lao Land Titling
Australian Industry Group Submission to the Queensland Government s Action Plan on Advancing Education, and Coding and Robotics in Queensland Schools
 21 December 2015 Queensland Government Email: advancingeducation@dete.qld.gov.au Australian Industry Group Submission to the Queensland Government s Action Plan on Advancing Education, and Coding and Robotics
CALL FOR SUBMISSION OF PROJECTS WITHIN THE OPEI DEVELOPMENT
 Ministry of Industry and Trade of the Czech Republic Structural Funds Division Managing Authority for the OPEI CALL FOR SUBMISSION OF PROJECTS WITHIN THE OPEI DEVELOPMENT Call identification Programme
Ref: 4.14. 1 5 Aspazijas blvd., Riga, Latvia
 Ref: 4.14 Employability of University Graduates According to their Qualifications and Competencies: the Case of Latvia Working paper Inta Jaunzeme 1 University of Latvia, Faculty of Economics and Management
LEARNING AND COMPETENCE 2020. Strategy of the Finnish National Board of Education (FNBE)
") LEARNING AND COMPETENCE 2020 Strategy of the Finnish National Board of Education (FNBE) Enhancing studies and provision of education and training Strengthening teaching personnel s competence Leading and
LEARNING AND COMPETENCE 2020 Strategy of the Finnish National Board of Education (FNBE) Enhancing studies and provision of education and training Strengthening teaching personnel s competence Leading and
Programming Period 2014-2020 Monitoring and Evaluation of European Cohesion Policy European Social Fund
 Programming Period 2014-2020 Monitoring and Evaluation of European Cohesion Policy European Social Fund Guidance document Annex D - Practical guidance on data collection and validation September 2015 (Based
CURRICULUM. Master of Music (MMus) Cand. musicae. COMPOSITION degree course. Effective as of 2011
 Cand. musicae. COMPOSITION degree course. Effective as of 2011") CURRICULUM Master of Music (MMus) Cand. musicae COMPOSITION degree course Effective as of 2011 Approved by the Board of Studies on April 1st, 2011 1/11 2 Course content, individual subjects, and examinations...
CURRICULUM Master of Music (MMus) Cand. musicae COMPOSITION degree course Effective as of 2011 Approved by the Board of Studies on April 1st, 2011 1/11 2 Course content, individual subjects, and examinations...
Statistical Profile of Lunenburg County
 Statistical Profile of Lunenburg County Prepared by the Nova Scotia Federation of Agriculture 1 Contents 1.0 Introduction... 2 Agriculture in the Local Economy... 2 2.0 Population and Population Change...
CZECH REPUBLIC. Similarities of the good practice with the experience of the Czech Republic
 Promoting social inclusion of children in a disadvantaged rural environment Tomas Habart People in Need Viktor Piorecky Agency for Social Inclusion in Excluded Roma Localities A brief assessment of the
Programming Period 2014-2020 Monitoring and Evaluation of European Cohesion Policy European Social Fund
 Programming Period 2014-2020 Monitoring and Evaluation of European Cohesion Policy European Social Fund Guidance document Annex D - Practical guidance on data collection and validation May 2016 (Based
E. HUMAN RESOURCES IN SCIENCE AND TECHNOLOGY IN SPAIN: A REVIEW OF THE INFORMATION SOURCES
 E. HUMAN RESOURCES IN SCIENCE AND TECHNOLOGY IN SPAIN: A REVIEW OF THE INFORMATION SOURCES by Ms. Carolina Cañibano, Assistant Professor, Alfonso X University of Madrid Dr. Paloma Sánchez, Professor of
Assessment of training needs of winemakers and management systems of the wineries in Armenia
 BIO Web of Conferences 5, 03005 (2015) DOI: 10.1051/bioconf/20150503005 Owned by the authors, published by EDP Sciences, 2015 Assessment of training needs of winemakers and management systems of the wineries
Estimating differences in public and private sector pay
 Estimating differences in public and private sector pay Andrew Damant and Jamie Jenkins, July 2011 Summary It is difficult to make comparisons of the two sectors because of differences in the types of
The National Council of the Slovak Republic has adopted the following Act: Article I. 1 Scope of the act
 Slovak Investment and Trade Development Agency Address: Trnavská cesta 100, 821 01 Bratislava, Slovak Republic Tel.: +421 2 58 260 100, Fax: +421 2 58 260 109, E-mail: invest@sario.sk, www.sario.sk Act
Employment and Wages for Alberta Workers with a Post-Secondary Education
 Employment and Wages for Alberta Workers with a Post-Secondary Education Abstract Between 2013 and 2017, Alberta s economy is expected to add approximately 163,000 new jobs. 1 In addition, approximately
Ministerie van Toerisme, Economische Zaken, Verkeer en Telecommunicatie Ministry of Tourism, Economic Affairs, Transport and Telecommunication
 SME Policy Framework for St. Maarten May, 2014 Department of Economic Affairs, Transportation & P. 1 of 16 TABLE OF CONTENTS 1. Introduction 2. SME Developments in St. Maarten 2.1 Definition 2.2 Government
e-competence in Italy Analysing Gaps and Mismatches for a Stronger ICT Profession
 e-competence in Analysing Gaps and Mismatches for a Stronger ICT Profession About the Grand Coalition for Digital Jobs The an Commission is leading a multi-stakeholder partnership to tackle the lack of
MINISTRY FOR EDUCATION AND EMPLOYMENT
 APPENDIX A MINISTRY FOR EDUCATION AND EMPLOYMENT POSITION OF SUPPLY KINDERGARTEN ASSISTANT IN THE DIRECTORATE FOR EDUCATIONAL SERVICES (DES) IN THE MINISTRY FOR EDUCATION AND EMPLOYMENT (MEDE) (Capacity
Project Fiche No. 8 Implementation and follow-up of the Small Business Act (SBA)
") 1. Basic information Project Fiche No. 8 Implementation and follow-up of the Small Business Act (SBA) 1.1 CRIS Number: 2010/XXXX 1.2 Title: Implementation and follow-up of the Small Business Act (SBA)
1. Basic information Project Fiche No. 8 Implementation and follow-up of the Small Business Act (SBA) 1.1 CRIS Number: 2010/XXXX 1.2 Title: Implementation and follow-up of the Small Business Act (SBA)
FAQ on data collection and data validation, ESF 2014-2020 May 2015
 FAQ on data collection and data validation, ESF 2014-2020 May 2015 Contents Definitions... 2 Definitions of common and YEI indicators... 2 National definitions... 2 Defining operations... 3 Participants...