Methods to control for confounding - Unmeasured confounding - 18 February 2015
|
|
|
- Megan Barrett
- 7 years ago
- Views:
Transcription
1 Methods to control for confounding - Unmeasured confounding - 18 February 2015
2 Objectives At the end of this session about unmeasured confounding, you will be able to: Recognize sources of unmeasured confounding in pharmacoepidemiologic research Indicate different methods to handle unmeasured confounding Mention key assumptions of instrumental variable (IV) analysis to control for confounding State limitations in the application of IV analysis in pharmacoepidemiology 2
3 Outline What is unmeasured confounding? Methods to handle unmeasured confounding Interchanging one assumption for another Instrumental variables IV analysis in pharmacoepidemiology Simulation studies Empirical studies How to IV analysis Take home message 3
4 Unmeasured confounding = confounding by variables that are not measured = unobserved confounding = residual confounding (confounding by variables that are inadequately / inaccurately measured) 4
5 Electronic healthcare records Unmeasured confounders in electronic healthcare records databases: Smoking status Body mass index Blood pressure recordings Family history 5
6 Possible solutions 1. Collect additional confounder information: Two-stage sampling 2. Comparison within individuals (no impact of between-subject differences): Case-crossover design Prior event rate ratio adjustment 6
7 Possible solutions (2) 3. Quantify unmeasured confounding in setting of known associations: Negative control outcome 4. Quantify the impact of a known yet unmeasured confounder: Sensitivity analysis 7
8 Possible solutions (3) 5. Try to mimic a randomized trial: Instrumental variables 8
9 Assumptions Ordinary methods to control for confounding assume that there is no unmeasured confounding Methods to handle unmeasured confounding interchange that assumption for other assumptions There s no free lunch! 9
10 RCT with non-compliance Random treatment allocation Treatment received Outcome Clinical predictors 10
11 Extrapolation of the ITT effect to get the contrast between everybody vs. nobody treated Groenwold, et al. OA Epidemiol
12 A T Y C ITT effect = RD ITT = P(Y A=1) P(Y A=0) But A=1 T= 1 Compliance effect = RD compliance = P(T A=1) P(T A=0) 12
13 Non-compliance analysis A T Y C RD CAUSAL RD RD ITT COMPLIANCE 13
14 Instrumental variables IV Treatment Outcome Confounders 14
15 IVs in pharmacoepidemiology Something different than random treatment allocation.. 1. IV is related to exposure 2. IV is independent of confounders 3. IV affects outcome only through exposure 15

16 IV analysis in pharmacoepidemiology Chen, et al. J Clin Epidemiol
17 IV analysis in PROTECT Simulation studies Studies using empirical data 17
18 Simulation studies Allow to assess impact of design parameters in a controlled way Allow for comparison of effect estimates against a truth 18
19 Bias, if IV is very weakly related to exposure Can partly be remedied by large sample size Uddin, et al. PDS
20 Bias, if IV related to confounders Bias depends on strength IVexposure relation Bias in IV estimator can be larger than in conventional estimator Uddin, et al. PDS
21 PS balance measures can be used to assess balance of observed confounders across IV levels Ali, et al. Epidemiology
22 Simulation studies: Conclusions IV analysis highly sensitive to violations of assumptions Important to check assumptions tools available 22
23 Studies using empirical data Aims: Study ease-of-use of IV methods in real life Assess face validity of IV estimates Investigate different potential IVs 23
24 IV analysis in pharmacoepidemiology 2 examples 1 conclusion: It s hard to find an appropriate IV 24
25 Beta2-agonists and myocardial infarction Study in 2 large EU databases (CPRD and Mondriaan) Asthma and COPD patients Multiple databases CPRD: n= 490,499 Mondriaan: n = 27,459 IV is physician prescribing preference Uddin, et al. submitted 25
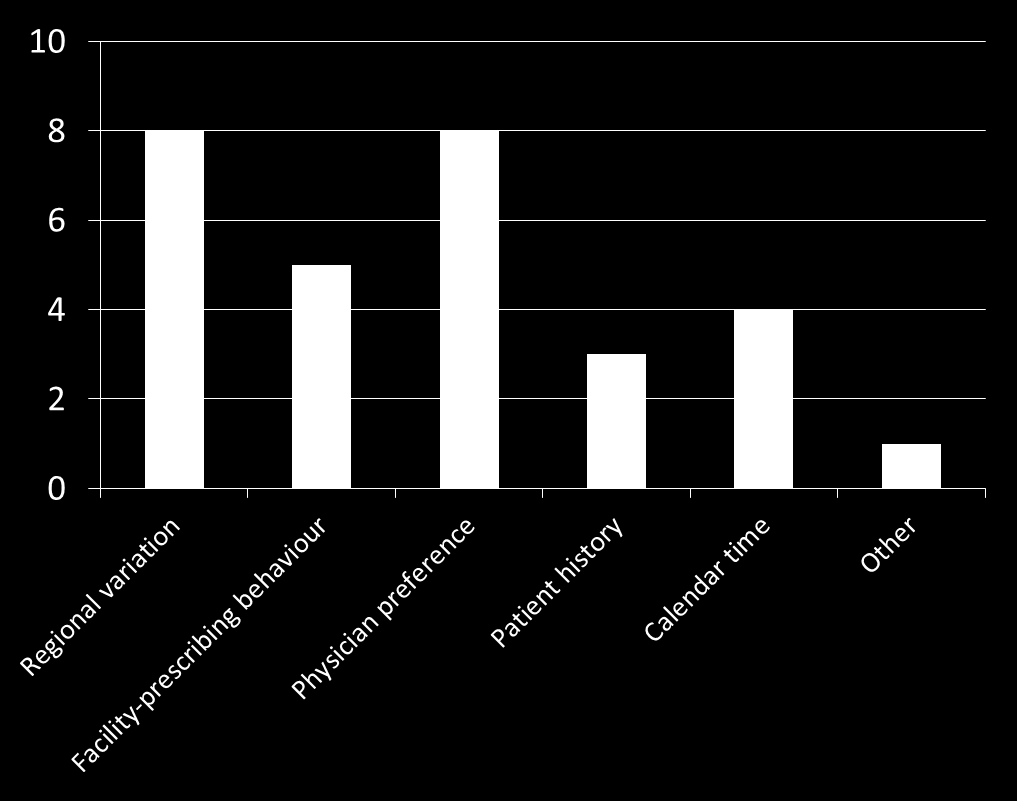
26 How to quantify physician preference Physician A: Preference red drug = 2/6 Physician B: Preference red drug = 6/11 26

27 How to data for IV study 27


28 Quantifying physician preference 28
29 How to checking IV assumption 1 Relation between IV and exposure Stronger relation is better!! Correlation (e.g. ρ>0.2) Point-biserial correlation Odds ratio (e.g. OR > 2) 29
30 Checking assumption 1 CPRD Mondriaan Proportion of prescriptions (r) Last 1 prescription (OR) Last 5 prescriptions (r) Last 10 prescriptions (r) OR > 2 and correlation > 0.2 are considered appropriate 30
31 Checking assumption 1 CPRD Mondriaan Proportion of prescriptions (r) Last 1 prescription (OR) Last 5 prescriptions (r) Last 10 prescriptions (r)
32 How to checking IV assumption 2 Relation between IV and observed confounders There should be no relations Standardized difference (e.g., StD < 0.1) Correlation Mahalanobis distance 32
33 Checking assumption 2 Proportion of prescriptions Last 1 prescription Last 5 prescriptions Last 10 prescriptions CPRD Mondriaan Confounders balanced between IV groups if standardized difference <
34 IV analysis comparing treatment options Swanson et al, AJE 2015: IV methods used to compare a subset of treatment options are prone to substantial biases, even when the proposed instrument appears relatively strong. 34
35 Assumption 1 CPRD Mondriaan Proportion of prescriptions Last 1 prescription Last 5 prescriptions Last 10 prescriptions Assumption 2 CPRD Mondriaan Proportion of prescriptions Last 1 prescription Last 5 prescriptions Last 10 prescriptions 35
36 How to IV analysis 1. Fit a model predicting exposure status, e.g. In R: lm(exposure ~ IV) In SAS: proc reg; model Exposure=IV; run; 36
37 How to IV analysis 2. Fit a model relating the outcome to the predicted exposure status (Exposure.hat), e.g. In R: lm(outcome ~ Exposure.hat) In SAS: proc reg; model Outcome = Exposure.hat; run; Note: requires robust variance estimator or bootstrapping 37
38 IV based on last 10 prescriptions Database Model HR (95%CI) CPRD Crude 1.34 (1.26; 1.44) Adjusted 0.96 (0.89; 1.02) IV analysis 8.65 (5.57; 13.9) Mondriaan Crude 1.43 (1.18; 1.73) Adjusted 1.18 (0.97; 1.43) IV analysis 2.46 (1.03; 5.75) 38
39 2. Antidepressant use and hip fracture Study in 3 large EU databases (BIFAP, THIN, Mondriaan) Patients prescribed an antidepressant drug (SSRI v. TCA) Multiple databases BIFAP: n = 252,203 THIN: n= 570,139 Mondriaan: n = 22,474 IV is physician prescribing preference Uddin, et al. submitted 39
40 Assumption 1 BIFAP THIN Mondriaan Proportion of prescriptions Last 1 prescription Last 5 prescription Last 10 prescription Assumption 2 BIFAP THIN Mondriaan Proportion of prescriptions Last 1 prescription Last 5 prescription Last 10 prescription 40
41 IV based on last 10 prescriptions Database Model HR (95%CI) BIFAP Crude 1.21 (1.06; 1.39) Adjusted 1.35 (1.18; 1.56) IV analysis 2.57 (0.59; 11.93) THIN Crude 0.72 (0.67; 0.77) Adjusted 1.35 (1.26; 1.44) IV analysis 0.57 (0.36; 0.92) Mondriaan Crude 0.75 (0.48; 1.17) Adjusted 1.36 (0.84; 2.15) IV analysis 0.44 (0.04; 5.43) 41
42 Interplay between assumptions If the proportion of explained variation in the treatment due to the IV is relatively large, there is little variation in treatment left that can be attributed to the confounders So, if you find a strong IV, apparently, there s little confounding And vice versa: important confounding hard to find strong IV 42
43 Interplay between assumptions A T Y A T Y L L 43
44 Martens, et al. Epidemiology
45 A bit more on assumption 2 IV is independent of confounders Prognostic patient characteristics equally distributed among physicians; different physicians see more or less similar patients Observed confounders can be controlled for in IV analysis. In that case, assumption 2 is that unobserved confounders are independent of the IV. Back to square one 45
46 Assumption 3. IV affects the outcome only through the exposure In case of the IV physician preference this implies: The only thing the physician differ on is their preference for the exposure of interest Similar standard of care, similar expertise, similar behaviour regarding prescribing concomittant medication 46
47 Take home messages IV analysis in pharmacoepidemiology is challenging Be sceptical about methods that claim to control for unmeasured confounding When reviewing a study that applied IV analysis: Did the authors check (/substantiate ) the assumptions? Did the authors test robustness of IV analysis, e.g. by applying different (related) IVs? 47
48 48
Randomized trials versus observational studies
 Randomized trials versus observational studies The case of postmenopausal hormone therapy and heart disease Miguel Hernán Harvard School of Public Health www.hsph.harvard.edu/causal Joint work with James
Big data size isn t enough! Irene Petersen, PhD Primary Care & Population Health
 Big data size isn t enough! Irene Petersen, PhD Primary Care & Population Health Introduction Reader (Statistics and Epidemiology) Research team epidemiologists/statisticians/phd students Primary care
Simple linear regression
 Simple linear regression Introduction Simple linear regression is a statistical method for obtaining a formula to predict values of one variable from another where there is a causal relationship between
Handling missing data in Stata a whirlwind tour
 Handling missing data in Stata a whirlwind tour 2012 Italian Stata Users Group Meeting Jonathan Bartlett www.missingdata.org.uk 20th September 2012 1/55 Outline The problem of missing data and a principled
Basic Statistics and Data Analysis for Health Researchers from Foreign Countries
 Basic Statistics and Data Analysis for Health Researchers from Foreign Countries Volkert Siersma siersma@sund.ku.dk The Research Unit for General Practice in Copenhagen Dias 1 Content Quantifying association
Multiple Regression: What Is It?
 Multiple Regression Multiple Regression: What Is It? Multiple regression is a collection of techniques in which there are multiple predictors of varying kinds and a single outcome We are interested in
Sample Size and Power in Clinical Trials
 Sample Size and Power in Clinical Trials Version 1.0 May 011 1. Power of a Test. Factors affecting Power 3. Required Sample Size RELATED ISSUES 1. Effect Size. Test Statistics 3. Variation 4. Significance
OUTCOMES RESEARCH USING A LEARNING HEALTH SYSTEM: PROMISE & PITFALLS
 OUTCOMES RESEARCH USING A LEARNING HEALTH SYSTEM: PROMISE & PITFALLS Richard L. Tannen, M.D. University of Pennsylvania Perelman School of Medicine KFF director of Medical research u More than a decade
IAPRI Quantitative Analysis Capacity Building Series. Multiple regression analysis & interpreting results
 IAPRI Quantitative Analysis Capacity Building Series Multiple regression analysis & interpreting results How important is R-squared? R-squared Published in Agricultural Economics 0.45 Best article of the
ECON 142 SKETCH OF SOLUTIONS FOR APPLIED EXERCISE #2
 University of California, Berkeley Prof. Ken Chay Department of Economics Fall Semester, 005 ECON 14 SKETCH OF SOLUTIONS FOR APPLIED EXERCISE # Question 1: a. Below are the scatter plots of hourly wages
Sample Size Planning, Calculation, and Justification
 Sample Size Planning, Calculation, and Justification Theresa A Scott, MS Vanderbilt University Department of Biostatistics theresa.scott@vanderbilt.edu http://biostat.mc.vanderbilt.edu/theresascott Theresa
2. Linear regression with multiple regressors
 2. Linear regression with multiple regressors Aim of this section: Introduction of the multiple regression model OLS estimation in multiple regression Measures-of-fit in multiple regression Assumptions
I L L I N O I S UNIVERSITY OF ILLINOIS AT URBANA-CHAMPAIGN
 Beckman HLM Reading Group: Questions, Answers and Examples Carolyn J. Anderson Department of Educational Psychology I L L I N O I S UNIVERSITY OF ILLINOIS AT URBANA-CHAMPAIGN Linear Algebra Slide 1 of
Introduction to Fixed Effects Methods
 Introduction to Fixed Effects Methods 1 1.1 The Promise of Fixed Effects for Nonexperimental Research... 1 1.2 The Paired-Comparisons t-test as a Fixed Effects Method... 2 1.3 Costs and Benefits of Fixed
NON-PROBABILITY SAMPLING TECHNIQUES
 NON-PROBABILITY SAMPLING TECHNIQUES PRESENTED BY Name: WINNIE MUGERA Reg No: L50/62004/2013 RESEARCH METHODS LDP 603 UNIVERSITY OF NAIROBI Date: APRIL 2013 SAMPLING Sampling is the use of a subset of the
Clinical Study Design and Methods Terminology
 Home College of Veterinary Medicine Washington State University WSU Faculty &Staff Page Page 1 of 5 John Gay, DVM PhD DACVPM AAHP FDIU VCS Clinical Epidemiology & Evidence-Based Medicine Glossary: Clinical
CALCULATIONS & STATISTICS
 CALCULATIONS & STATISTICS CALCULATION OF SCORES Conversion of 1-5 scale to 0-100 scores When you look at your report, you will notice that the scores are reported on a 0-100 scale, even though respondents
Safety & Effectiveness of Drug Therapies for Type 2 Diabetes: Are pharmacoepi studies part of the problem, or part of the solution?
 Safety & Effectiveness of Drug Therapies for Type 2 Diabetes: Are pharmacoepi studies part of the problem, or part of the solution? IDEG Training Workshop Melbourne, Australia November 29, 2013 Jeffrey
Missing Data: Part 1 What to Do? Carol B. Thompson Johns Hopkins Biostatistics Center SON Brown Bag 3/20/13
 Missing Data: Part 1 What to Do? Carol B. Thompson Johns Hopkins Biostatistics Center SON Brown Bag 3/20/13 Overview Missingness and impact on statistical analysis Missing data assumptions/mechanisms Conventional
1. What is the critical value for this 95% confidence interval? CV = z.025 = invnorm(0.025) = 1.96
 = 1.96") 1 Final Review 2 Review 2.1 CI 1-propZint Scenario 1 A TV manufacturer claims in its warranty brochure that in the past not more than 10 percent of its TV sets needed any repair during the first two years
1 Final Review 2 Review 2.1 CI 1-propZint Scenario 1 A TV manufacturer claims in its warranty brochure that in the past not more than 10 percent of its TV sets needed any repair during the first two years
X X X a) perfect linear correlation b) no correlation c) positive correlation (r = 1) (r = 0) (0 < r < 1)
 perfect linear correlation b) no correlation c) positive correlation (r = 1) (r = 0) (0 < r < 1)") CORRELATION AND REGRESSION / 47 CHAPTER EIGHT CORRELATION AND REGRESSION Correlation and regression are statistical methods that are commonly used in the medical literature to compare two or more variables.
CORRELATION AND REGRESSION / 47 CHAPTER EIGHT CORRELATION AND REGRESSION Correlation and regression are statistical methods that are commonly used in the medical literature to compare two or more variables.
Outline. Topic 4 - Analysis of Variance Approach to Regression. Partitioning Sums of Squares. Total Sum of Squares. Partitioning sums of squares
 Topic 4 - Analysis of Variance Approach to Regression Outline Partitioning sums of squares Degrees of freedom Expected mean squares General linear test - Fall 2013 R 2 and the coefficient of correlation
Analyzing Structural Equation Models With Missing Data
 Analyzing Structural Equation Models With Missing Data Craig Enders* Arizona State University cenders@asu.edu based on Enders, C. K. (006). Analyzing structural equation models with missing data. In G.
Lecture 3: Differences-in-Differences
 Lecture 3: Differences-in-Differences Fabian Waldinger Waldinger () 1 / 55 Topics Covered in Lecture 1 Review of fixed effects regression models. 2 Differences-in-Differences Basics: Card & Krueger (1994).
Econometrics Simple Linear Regression
 Econometrics Simple Linear Regression Burcu Eke UC3M Linear equations with one variable Recall what a linear equation is: y = b 0 + b 1 x is a linear equation with one variable, or equivalently, a straight
Multiple logistic regression analysis of cigarette use among high school students
 Multiple logistic regression analysis of cigarette use among high school students ABSTRACT Joseph Adwere-Boamah Alliant International University A binary logistic regression analysis was performed to predict
Correlational Research. Correlational Research. Stephen E. Brock, Ph.D., NCSP EDS 250. Descriptive Research 1. Correlational Research: Scatter Plots
 Correlational Research Stephen E. Brock, Ph.D., NCSP California State University, Sacramento 1 Correlational Research A quantitative methodology used to determine whether, and to what degree, a relationship
The Cross-Sectional Study:
 The Cross-Sectional Study: Investigating Prevalence and Association Ronald A. Thisted Departments of Health Studies and Statistics The University of Chicago CRTP Track I Seminar, Autumn, 2006 Lecture Objectives
Understanding Retrospective vs. Prospective Study designs
 Understanding Retrospective vs. Prospective Study designs Andreas Kalogeropoulos, MD MPH PhD Assistant Professor of Medicine (Cardiology) Emory University School of Medicine Emory University Center for
MISSING DATA TECHNIQUES WITH SAS. IDRE Statistical Consulting Group
 MISSING DATA TECHNIQUES WITH SAS IDRE Statistical Consulting Group ROAD MAP FOR TODAY To discuss: 1. Commonly used techniques for handling missing data, focusing on multiple imputation 2. Issues that could
Web-based Supplementary Materials for Bayesian Effect Estimation. Accounting for Adjustment Uncertainty by Chi Wang, Giovanni
 1 Web-based Supplementary Materials for Bayesian Effect Estimation Accounting for Adjustment Uncertainty by Chi Wang, Giovanni Parmigiani, and Francesca Dominici In Web Appendix A, we provide detailed
Part 2: Analysis of Relationship Between Two Variables
 Part 2: Analysis of Relationship Between Two Variables Linear Regression Linear correlation Significance Tests Multiple regression Linear Regression Y = a X + b Dependent Variable Independent Variable
SENSITIVITY ANALYSIS AND INFERENCE. Lecture 12
 This work is licensed under a Creative Commons Attribution-NonCommercial-ShareAlike License. Your use of this material constitutes acceptance of that license and the conditions of use of materials on this
Guide to Biostatistics
 MedPage Tools Guide to Biostatistics Study Designs Here is a compilation of important epidemiologic and common biostatistical terms used in medical research. You can use it as a reference guide when reading
COMMITTEE FOR VETERINARY MEDICINAL PRODUCTS GUIDELINE FOR THE CONDUCT OF POST-MARKETING SURVEILLANCE STUDIES OF VETERINARY MEDICINAL PRODUCTS
 The European Agency for the Evaluation of Medicinal Products Veterinary Medicines and Information Technology EMEA/CVMP/044/99-FINAL COMMITTEE FOR VETERINARY MEDICINAL PRODUCTS GUIDELINE FOR THE CONDUCT
Simple Linear Regression Inference
 Simple Linear Regression Inference 1 Inference requirements The Normality assumption of the stochastic term e is needed for inference even if it is not a OLS requirement. Therefore we have: Interpretation
PROMISE & PITFALLS OF OUTCOMES RESEARCH USING EMR DATABASES. Richard L. Tannen, M.D., Mark Weiner, Dawei Xie
 PROMISE & PITFALLS OF OUTCOMES RESEARCH USING EMR DATABASES Richard L. Tannen, M.D., Mark Weiner, Dawei Xie GOALS OF STUDY Determine Whether Studies Using EMR Database Yield Valid Outcome Assessment Major
Canonical Correlation Analysis
 Canonical Correlation Analysis LEARNING OBJECTIVES Upon completing this chapter, you should be able to do the following: State the similarities and differences between multiple regression, factor analysis,
FULL COVERAGE FOR PREVENTIVE MEDICATIONS AFTER MYOCARDIAL INFARCTION IMPACT ON RACIAL AND ETHNIC DISPARITIES
 FULL COVERAGE FOR PREVENTIVE MEDICATIONS AFTER MYOCARDIAL INFARCTION IMPACT ON RACIAL AND ETHNIC DISPARITIES Niteesh K. Choudhry, MD, PhD Harvard Medical School Division of Pharmacoepidemiology and Pharmacoeconomics
Chapter 5. Conditional CAPM. 5.1 Conditional CAPM: Theory. 5.1.1 Risk According to the CAPM. The CAPM is not a perfect model of expected returns.
 Chapter 5 Conditional CAPM 5.1 Conditional CAPM: Theory 5.1.1 Risk According to the CAPM The CAPM is not a perfect model of expected returns. In the 40+ years of its history, many systematic deviations
Simple Regression Theory II 2010 Samuel L. Baker
 SIMPLE REGRESSION THEORY II 1 Simple Regression Theory II 2010 Samuel L. Baker Assessing how good the regression equation is likely to be Assignment 1A gets into drawing inferences about how close the
13. Poisson Regression Analysis
 136 Poisson Regression Analysis 13. Poisson Regression Analysis We have so far considered situations where the outcome variable is numeric and Normally distributed, or binary. In clinical work one often
A Study to Predict No Show Probability for a Scheduled Appointment at Free Health Clinic
 A Study to Predict No Show Probability for a Scheduled Appointment at Free Health Clinic Report prepared for Brandon Slama Department of Health Management and Informatics University of Missouri, Columbia
Longitudinal Modeling of Lung Function in Respiratory Drug Development
 Longitudinal Modeling of Lung Function in Respiratory Drug Development Fredrik Öhrn, PhD Senior Clinical Pharmacometrician Quantitative Clinical Pharmacology AstraZeneca R&D Mölndal, Sweden Outline A brief
Chapter 10. Key Ideas Correlation, Correlation Coefficient (r),
,") Chapter 0 Key Ideas Correlation, Correlation Coefficient (r), Section 0-: Overview We have already explored the basics of describing single variable data sets. However, when two quantitative variables
Chapter 0 Key Ideas Correlation, Correlation Coefficient (r), Section 0-: Overview We have already explored the basics of describing single variable data sets. However, when two quantitative variables
A Primer on Mathematical Statistics and Univariate Distributions; The Normal Distribution; The GLM with the Normal Distribution
 A Primer on Mathematical Statistics and Univariate Distributions; The Normal Distribution; The GLM with the Normal Distribution PSYC 943 (930): Fundamentals of Multivariate Modeling Lecture 4: September
Missing Data Sensitivity Analysis of a Continuous Endpoint An Example from a Recent Submission
 Missing Data Sensitivity Analysis of a Continuous Endpoint An Example from a Recent Submission Arno Fritsch Clinical Statistics Europe, Bayer November 21, 2014 ASA NJ Chapter / Bayer Workshop, Whippany
Confounding, interaction, and mediation in multivariable/multivariate regression modeling
 , interaction, and mediation in multivariable/multivariate regression modeling Department of Biostatistics Center, Vanderbilt-Ingram Cancer Center May 21, 2010 Outline 1 Mediation 3 examples Definition
Summary of the risk management plan (RMP) for Rasagiline ratiopharm (rasagiline)
 for Rasagiline ratiopharm (rasagiline)") EMA/744222/2014 Summary of the risk management plan (RMP) for Rasagiline ratiopharm (rasagiline) This is a summary of the risk management plan (RMP) for Rasagiline ratiopharm, which details the measures
EMA/744222/2014 Summary of the risk management plan (RMP) for Rasagiline ratiopharm (rasagiline) This is a summary of the risk management plan (RMP) for Rasagiline ratiopharm, which details the measures
Section 14 Simple Linear Regression: Introduction to Least Squares Regression
 Slide 1 Section 14 Simple Linear Regression: Introduction to Least Squares Regression There are several different measures of statistical association used for understanding the quantitative relationship
The Prevalence and Determinants of Undiagnosed and Diagnosed Type 2 Diabetes in Middle-Aged Irish Adults
 The Prevalence and Determinants of Undiagnosed and Diagnosed Type 2 Diabetes in Middle-Aged Irish Adults Seán R. Millar, Jennifer M. O Connor, Claire M. Buckley, Patricia M. Kearney, Ivan J. Perry Email:
COMP6053 lecture: Relationship between two variables: correlation, covariance and r-squared. jn2@ecs.soton.ac.uk
 COMP6053 lecture: Relationship between two variables: correlation, covariance and r-squared jn2@ecs.soton.ac.uk Relationships between variables So far we have looked at ways of characterizing the distribution
Qualitative and Quantitative Research
 Qualitative and Quantitative Research Dr. Karim Abawi World Health Organization/Geneva Foundation for Medical Education and Research Geneva, Switzerland E-mail: abawik@who.int karim.abawi@gfmer.org Reproductive
A Basic Introduction to Missing Data
 John Fox Sociology 740 Winter 2014 Outline Why Missing Data Arise Why Missing Data Arise Global or unit non-response. In a survey, certain respondents may be unreachable or may refuse to participate. Item
Big data in health research Professor Tony Blakely
 Big data in health research Professor Tony Blakely Burden of Disease Epidemiology, Equity and Cost Effectiveness Programme 1 Structure Added value of big data. Examples: Linked census health data Linked
Mortality Assessment Technology: A New Tool for Life Insurance Underwriting
 Mortality Assessment Technology: A New Tool for Life Insurance Underwriting Guizhou Hu, MD, PhD BioSignia, Inc, Durham, North Carolina Abstract The ability to more accurately predict chronic disease morbidity
Facebook Friend Suggestion Eytan Daniyalzade and Tim Lipus
 Facebook Friend Suggestion Eytan Daniyalzade and Tim Lipus 1. Introduction Facebook is a social networking website with an open platform that enables developers to extract and utilize user information
An Application of the G-formula to Asbestos and Lung Cancer. Stephen R. Cole. Epidemiology, UNC Chapel Hill. Slides: www.unc.
 An Application of the G-formula to Asbestos and Lung Cancer Stephen R. Cole Epidemiology, UNC Chapel Hill Slides: www.unc.edu/~colesr/ 1 Acknowledgements Collaboration with David B. Richardson, Haitao
The Tangent or Efficient Portfolio
 The Tangent or Efficient Portfolio 1 2 Identifying the Tangent Portfolio Sharpe Ratio: Measures the ratio of reward-to-volatility provided by a portfolio Sharpe Ratio Portfolio Excess Return E[ RP ] r
Standardizing the measurement of drug exposure
 Standardizing the measurement of drug exposure The ability to determine drug exposure in real-world clinical practice enables important insights for the optimal use of medicines and healthcare resources.
Moderator and Mediator Analysis
 Moderator and Mediator Analysis Seminar General Statistics Marijtje van Duijn October 8, Overview What is moderation and mediation? What is their relation to statistical concepts? Example(s) October 8,
Organizing Your Approach to a Data Analysis
 Biost/Stat 578 B: Data Analysis Emerson, September 29, 2003 Handout #1 Organizing Your Approach to a Data Analysis The general theme should be to maximize thinking about the data analysis and to minimize
Hedge Effectiveness Testing
 Hedge Effectiveness Testing Using Regression Analysis Ira G. Kawaller, Ph.D. Kawaller & Company, LLC Reva B. Steinberg BDO Seidman LLP When companies use derivative instruments to hedge economic exposures,
How to choose an analysis to handle missing data in longitudinal observational studies
 How to choose an analysis to handle missing data in longitudinal observational studies ICH, 25 th February 2015 Ian White MRC Biostatistics Unit, Cambridge, UK Plan Why are missing data a problem? Methods:
Chapter Seven. Multiple regression An introduction to multiple regression Performing a multiple regression on SPSS
 Chapter Seven Multiple regression An introduction to multiple regression Performing a multiple regression on SPSS Section : An introduction to multiple regression WHAT IS MULTIPLE REGRESSION? Multiple
Understanding Diseases and Treatments with Canadian Real-world Evidence
 Understanding Diseases and Treatments with Canadian Real-world Evidence Real-World Evidence for Successful Market Access WHITEPAPER REAL-WORLD EVIDENCE Generating real-world evidence requires the right
HYPOTHESIS TESTING: CONFIDENCE INTERVALS, T-TESTS, ANOVAS, AND REGRESSION
 HYPOTHESIS TESTING: CONFIDENCE INTERVALS, T-TESTS, ANOVAS, AND REGRESSION HOD 2990 10 November 2010 Lecture Background This is a lightning speed summary of introductory statistical methods for senior undergraduate
Research Methods & Experimental Design
 Research Methods & Experimental Design 16.422 Human Supervisory Control April 2004 Research Methods Qualitative vs. quantitative Understanding the relationship between objectives (research question) and
Regulatory and Economic Capital
 Regulatory and Economic Capital Measurement and Management Swati Agiwal November 18, 2011 What is Economic Capital? Capital available to the bank to absorb losses to stay solvent Probability Unexpected
EMEA RM DRAFT GUIDANCE ISPE RESPONSE 1
 EMEA RM DRAFT GUIDANCE ISPE RESPONSE 1 October 4, 2005 Guideline on Risk Management Systems for Medicinal Products for Human Use DRAFT London, 6 September 2005. This guideline will be included as chapter
The PROTECT project. Introduction. Xavier Kurz Pharmacovigilance and Risk management Patient Health Protection Unit European Medicines Agency
 The PROTECT project Introduction Xavier Kurz Pharmacovigilance and Risk management Patient Health Protection Unit European Medicines Agency Brookings Active Surveillance Implementation Council Meeting
If several different trials are mentioned in one publication, the data of each should be extracted in a separate data extraction form.
 General Remarks This template of a data extraction form is intended to help you to start developing your own data extraction form, it certainly has to be adapted to your specific question. Delete unnecessary
NCSS Statistical Software Principal Components Regression. In ordinary least squares, the regression coefficients are estimated using the formula ( )
") Chapter 340 Principal Components Regression Introduction is a technique for analyzing multiple regression data that suffer from multicollinearity. When multicollinearity occurs, least squares estimates
Chapter 340 Principal Components Regression Introduction is a technique for analyzing multiple regression data that suffer from multicollinearity. When multicollinearity occurs, least squares estimates
Inhaled Corticosteroids and Diabetes Onset
 Inhaled Corticosteroids and the Risks of Diabetes Onset and Progression Journal Club October 13, 2010 By Anya Litvak, Kik Keiko Greenberg, and Jonathan Chrispin Background Inhaled corticosteroids are commonly
Confounding in health research
 Confounding in health research Part 1: Definition and conceptual issues Madhukar Pai, MD, PhD Assistant Professor of Epidemiology McGill University madhukar.pai@mcgill.ca 1 Why is confounding so important
PREDICTIVE ANALYTICS: PROVIDING NOVEL APPROACHES TO ENHANCE OUTCOMES RESEARCH LEVERAGING BIG AND COMPLEX DATA
 PREDICTIVE ANALYTICS: PROVIDING NOVEL APPROACHES TO ENHANCE OUTCOMES RESEARCH LEVERAGING BIG AND COMPLEX DATA IMS Symposium at ISPOR at Montreal June 2 nd, 2014 Agenda Topic Presenter Time Introduction:
Chapter 10: Basic Linear Unobserved Effects Panel Data. Models:
 Chapter 10: Basic Linear Unobserved Effects Panel Data Models: Microeconomic Econometrics I Spring 2010 10.1 Motivation: The Omitted Variables Problem We are interested in the partial effects of the observable
Amy F Subar, PhD, MPH, RD Applied Research Program Risk Factor Monitoring and Methods Branch
 Methods of Measuring Usual Dietary Intake for Risk Assessment Amy F Subar, PhD, MPH, RD Applied Research Program Risk Factor Monitoring and Methods Branch Objectives Describe major dietary assessment approaches
Example: Boats and Manatees
 Figure 9-6 Example: Boats and Manatees Slide 1 Given the sample data in Table 9-1, find the value of the linear correlation coefficient r, then refer to Table A-6 to determine whether there is a significant
IMPACT EVALUATION: INSTRUMENTAL VARIABLE METHOD
 REPUBLIC OF SOUTH AFRICA GOVERNMENT-WIDE MONITORING & IMPACT EVALUATION SEMINAR IMPACT EVALUATION: INSTRUMENTAL VARIABLE METHOD SHAHID KHANDKER World Bank June 2006 ORGANIZED BY THE WORLD BANK AFRICA IMPACT
Univariate Regression
 Univariate Regression Correlation and Regression The regression line summarizes the linear relationship between 2 variables Correlation coefficient, r, measures strength of relationship: the closer r is
Additional sources Compilation of sources: http://lrs.ed.uiuc.edu/tseportal/datacollectionmethodologies/jin-tselink/tselink.htm
 Mgt 540 Research Methods Data Analysis 1 Additional sources Compilation of sources: http://lrs.ed.uiuc.edu/tseportal/datacollectionmethodologies/jin-tselink/tselink.htm http://web.utk.edu/~dap/random/order/start.htm
2. Simple Linear Regression
 Research methods - II 3 2. Simple Linear Regression Simple linear regression is a technique in parametric statistics that is commonly used for analyzing mean response of a variable Y which changes according
A Simple Method for Estimating Relative Risk using Logistic Regression. Fredi Alexander Diaz-Quijano
 1 A Simple Method for Estimating Relative Risk using Logistic Regression. Fredi Alexander Diaz-Quijano Grupo Latinoamericano de Investigaciones Epidemiológicas, Organización Latinoamericana para el Fomento
RATIOS, PROPORTIONS, PERCENTAGES, AND RATES
 RATIOS, PROPORTIOS, PERCETAGES, AD RATES 1. Ratios: ratios are one number expressed in relation to another by dividing the one number by the other. For example, the sex ratio of Delaware in 1990 was: 343,200
Chapter 13 Introduction to Linear Regression and Correlation Analysis
 Chapter 3 Student Lecture Notes 3- Chapter 3 Introduction to Linear Regression and Correlation Analsis Fall 2006 Fundamentals of Business Statistics Chapter Goals To understand the methods for displaing
Introduction to study design
 Introduction to study design Doug Altman EQUATOR Network, Centre for Statistics in Medicine, NDORMS, University of Oxford EQUATOR OUCAGS training course 4 October 2014 Objectives of the day To understand
An introduction to Value-at-Risk Learning Curve September 2003
 An introduction to Value-at-Risk Learning Curve September 2003 Value-at-Risk The introduction of Value-at-Risk (VaR) as an accepted methodology for quantifying market risk is part of the evolution of risk
Introduction to Statistics and Quantitative Research Methods
 Introduction to Statistics and Quantitative Research Methods Purpose of Presentation To aid in the understanding of basic statistics, including terminology, common terms, and common statistical methods.
Response to Critiques of Mortgage Discrimination and FHA Loan Performance
 A Response to Comments Response to Critiques of Mortgage Discrimination and FHA Loan Performance James A. Berkovec Glenn B. Canner Stuart A. Gabriel Timothy H. Hannan Abstract This response discusses the
AVOIDING BIAS AND RANDOM ERROR IN DATA ANALYSIS
 AVOIDING BIAS AND RANDOM ERROR IN DATA ANALYSIS Susan Ellenberg, Ph.D. Perelman School of Medicine University of Pennsylvania School of Medicine FDA Clinical Investigator Course White Oak, MD November
EMR in Support of Smoking Cessation Counseling March 3, 2016
 EMR in Support of Smoking Cessation Counseling March 3, 2016 Eric W. Ford, PhD (Johns Hopkins Bloomberg School of Public Health) Jaeyong Bae, PhD (Northern Illinois University) Conflict of Interest Eric
Module 5: Multiple Regression Analysis
 Using Statistical Data Using to Make Statistical Decisions: Data Multiple to Make Regression Decisions Analysis Page 1 Module 5: Multiple Regression Analysis Tom Ilvento, University of Delaware, College
With Big Data Comes Big Responsibility
 With Big Data Comes Big Responsibility Using health care data to emulate randomized trials when randomized trials are not available Miguel A. Hernán Departments of Epidemiology and Biostatistics Harvard
GN47: Stochastic Modelling of Economic Risks in Life Insurance
 GN47: Stochastic Modelling of Economic Risks in Life Insurance Classification Recommended Practice MEMBERS ARE REMINDED THAT THEY MUST ALWAYS COMPLY WITH THE PROFESSIONAL CONDUCT STANDARDS (PCS) AND THAT
Technical Discussion Paper
 23 June 2015 JC DP 2015 01 Technical Discussion Paper Risk, Performance Scenarios and Cost Disclosures In Key Information Documents for Packaged Retail and Insurance- based Investment Products (PRIIPs)
Introduction to Regression and Data Analysis
 Statlab Workshop Introduction to Regression and Data Analysis with Dan Campbell and Sherlock Campbell October 28, 2008 I. The basics A. Types of variables Your variables may take several forms, and it
Methods for Meta-analysis in Medical Research
 Methods for Meta-analysis in Medical Research Alex J. Sutton University of Leicester, UK Keith R. Abrams University of Leicester, UK David R. Jones University of Leicester, UK Trevor A. Sheldon University
CARE GUIDELINES FROM MCG
 3.0 2.5 2.0 1.5 1.0 CARE GUIDELINES FROM MCG Evidence-based guidelines from MCG span the continuum of care, supporting clinical decisions and care planning, easing transitions between care settings, and