Advanced Introduction to Machine Learning, CMU-10715
|
|
|
- Cassandra Barber
- 9 years ago
- Views:
Transcription
1 Advanced Introduction to Machine Learning, CMU Manifold Learning Barnabás Póczos
2 Motivation Find meaningful low-dimensional structures hidden in high-dimensional observations. The human brain confronts the same problem in perception: 30,000 auditory nerve fibers 10 6 optic nerve fibers ) extract small number of perceptually relevant features. Difficult to visualize data in dimensions greater than three. 2

3 Manifolds Informal definition: Manifold = any object which is nearly "flat" on small scales. 1dim manifolds: 2dim manifolds: 3

4 Manifold Learning R 2 X 2 z x X 1 4
5 Algorithms PCA (1901), kernel PCA Multi-dimensional Scaling (1952) Maximum Variance Unfolding, Colored MVU Mixture of PCA, Mixture of Factor Analyzers Local Linear Embedding (2000) Isomap (2000), C-Isomap Hessian Eigenmaps Laplacian Eigenmaps (2003) Local Tangent Space Alignment and many more 5

6 PCA PCA is a linear method: it fails to find the nonlinear structure in the data 6
7 Issues with PCA A PCA uses the Euclidean distance Nonlinear Manifolds.. What is important is the geodesic distance Unroll the manifold 7
8 Multi-dimensional Scaling 8
9 MultiDimensional Multi-dimensional Scaling Scaling.. In PCA we are given a set of points In MDS we are given pairwise distances instead of the actual data points. Question: If we only preserve the pairwise distances do we preserve the structure? 9
10 How to get dot product matrix from pairwise From Distances to Inner Products distance matrix? i d ki d ij k j d kj 10
11 From Distances to Inner Products MDS.. Similarly: Center the data and then calculate MDS cost function: 11
12 From Distances to Inner Products MDS.. MDS algorithm: Step 1: Build a Gram matrix of inner products Step 2: Find the top k eigenvectors of G with the top k eigenvalues: Step 3: 12
13 Metric MDS = PCA Observation: If the data is centered, then the Gram matrix can be found this way: Though based on a somewhat different geometric intuition, metric MDS yields the same solution as PCA. There are many different versions of MDS which are different from PCA! 13

14 Example of MDS 14
15
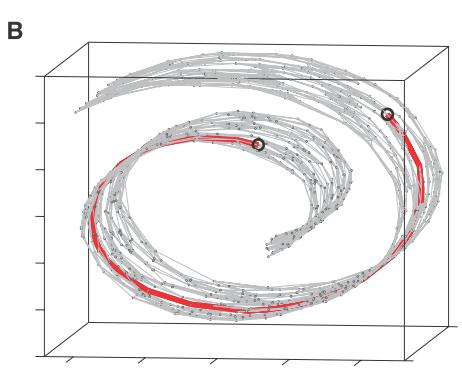
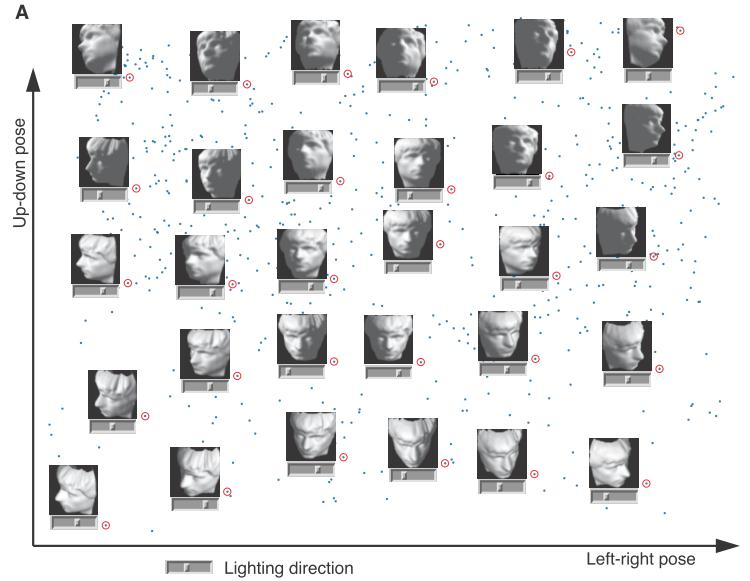
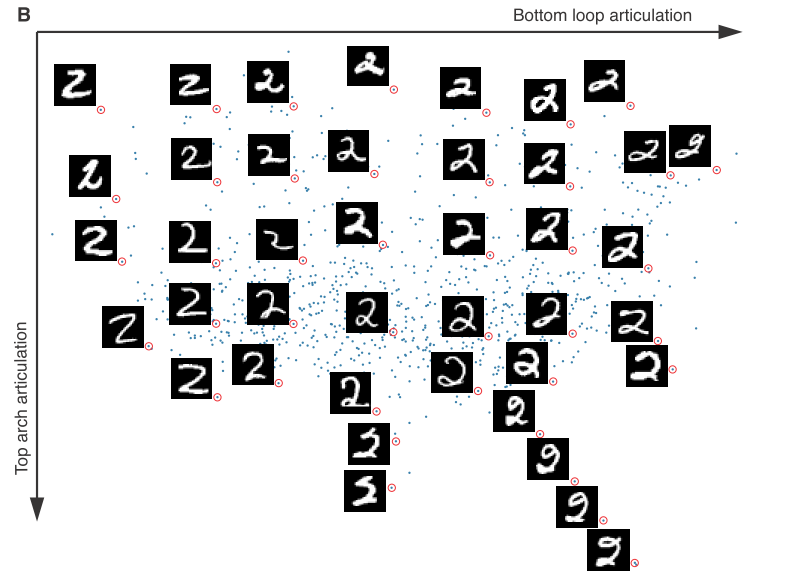
16 Isomap A Global Geometric Framework for Nonlinear Dimensionality Reduction J. B. Tenenbaum, V. de Silva and J. C. Langford Science 290 (5500): , 22 December
17 ISOMAP Comes from Isometric feature mapping Step1: Take a data matrix as input. Step2: Estimate geodesic distance between any two points by a chain of short paths Approximate the geodesic distance by Euclidean distances. Step3: Perform MDS 17
18 Differential Geometry Geodesic: the shortest curve on a manifold that connects two points on the manifold Example (3D sphere) small circle great circle 18

19 Geodesic distance Euclidean distance needs not be a good measure between two points on a manifold Length of geodesic is more appropriate 19
20 The Swiss-role Dataset 20
21 Isomap 21
22 22
23 23

24 ISOMAP Interpolation 24

25 ISOMAP Interpolation 25

26 ISOMAP Interpolation 26
27 ISOMAP Summary Build graph from knn or epsilon neighbors Run MDS Since MDS is slow, ISOMAP will be very slow. Need estimate of k or epsilon. Assumes data set is convex (no holes). 27
28 Local Linear Embedding Nonlinear dimensionality reduction by locally linear embedding. Sam Roweis & Lawrence Saul. Science, v.290 no 5500, Dec.22, pp
29 Local Linear Embedding Assumption: manifold is approximately linear when viewed locally. Data: 1. select neighbors (epsilon or knn) 2. reconstruct with linear weights 29
30 Local Linear Embedding Step 1. Without the constraints the weights that minimize the reconstruction errors are invariant to rotation, rescaling and translation of the data points. 30
31 Local Linear Embedding Step 2. Given the weights W, find the embedded points: The same weights that reconstruct the datapoints in D dimensions should reconstruct it in the manifold in d dimensions. The weights characterize the intrinsic geometric properties of each neighborhood. 31

32 Fit Locally, Think Globally Locally Linear Embedding 32

33 33

34 34

35 35
36 Maximum Variance Unfolding K. Q. Weinberger and L. K. Saul. Unsupervised learning of image manifolds by semidefinite programming. International Journal of Computer Vision, Volume 70 Issue 1, October 2006, Pages
37 Maximum Variance Unfolding Build a graph from knn or epsilon neighbors. Formally, 37
38 Maximum Variance Unfolding Consider the constraint From this, we have 38

39 Maximum Variance Unfolding Consider the cost function: 39
")
40 Maximum Variance Unfolding The final problem is a semi-definite problem (SDP) : 40

41 Maximum Variance Unfolding D= 76*101*3 d=3 N=400 images 41

42 Maximum Variance Unfolding Swiss roll unfolded by maximizing variance subject to constraints that preserve local distances and angles. The middle snap-shots show various feasible (but non-optimal) intermediate solutions. 42

43 Maximum Variance Unfolding 43
44 Laplacian Eigenmap M. Belkin and P. Niyogi. Laplacian eigenmaps for dimensionality reduction and data representation, Neural Comput.,15(6): ,
45 Laplacian Eigenmap Step 1. Build graph from knn or epsilon neighbors Step 2. Choose weights: Special case: 45

46 Laplacian Eigenmap Step 3. Assume the graph is connected, otherwise proceed with Step 3 for each connected component: Lemma: Solve the eigenvector problem: 46
47 Laplacian Eigenmap Solve the eigenvector problem: The first m+1 smallest eigenvalues: The embedding: 47

48 Laplacian Eigenmap (Explanation) Let us embed the neighborhood graph to 1 dim first. A reasonable cost function is: Lemma subject to appropriate constraints to avoid y=0. Proof: 48

49 Laplacian Eigenmap (Explanation) Therefore, our minimization problem is Subject to: Embedding the neighborhood graph to m dimension: Subject to: Solution: 49

50 Variational Variational Inference for Bayesian Mixtures of Factor Analysers Zoubin Ghahramani, Matthew J. Beal, NIPS

51 MANI Matlab demo Todd Wittman: MANIfold learning demonstration GUI Contains a couple of methods and examples. The following results are taken from Todd Wittman 51
52 How do we compare the methods? Speed Manifold Geometry Non-convexity Curvature Corners Noise Non-uniform Sampling Sparse Data Clustering High-Dimensional Data: Can the method process image manifolds? Sensitivity to Parameters K Nearest Neighbors: Isomap, LLE, Hessian, Laplacian, KNN Diffusion Sigma: Diffusion Map, KNN Diffusion 52
53 Testing Examples Swiss Roll Swiss Hole Punctured Sphere Corner Planes 3D Clusters Twin Peaks Toroidal Helix Gaussian Occluded Disks We ll compare the speed and sensitivity to parameters throughout. 53

54 Manifold Geometry First, let s try to unroll the Swiss Roll. We should see a plane. 54

55 Hessian LLE is pretty slow, MDS is very slow, and ISOMAP is extremely slow. MDS and PCA don t can t unroll Swiss Roll, use no manifold information. LLE and Laplacian can t handle this data. Diffusion Maps could not unroll Swiss Roll for any value of Sigma. 55

56 Non-Convexity Can we handle a data set with a hole? Swiss Hole: Can we still unroll the Swiss Roll when it has a hole in the middle? 56

57 Only Hessian LLE can handle non-convexity. ISOMAP, LLE, and Laplacian find the hole but the set is distorted. 57

58 Manifold Geometry Twin Peaks: fold up the corners of a plane. LLE will have trouble because it introduces curvature to plane. 58

59 PCA, LLE, and Hessian LLE distort the mapping the most. 59
60 Curvature & Non-uniform Sampling Gaussian: We can randomly sample a Gaussian distribution. We increase the curvature by decreasing the standard deviation. Coloring on the z-axis, we should map to concentric circles. 60

61 For std = 1 (low curvature), MDS and PCA can project accurately. Laplacian Eigenmap cannot handle the change in sampling. 61
, PCA projects from the side rather")
62 For std = 0.4 (higher curvature), PCA projects from the side rather than top-down. Laplacian looks even worse. 62
, none of the")
63 For std = 0.3 (high curvature), none of the methods can project correctly. 63

64 Corners Corner Planes: We bend a plane with a lift angle A. We want to bend it back down to a plane. A If A > 90, we might see the data points written on top of each other. 64

65 For angle A=75, we see some disortions in PCA and Laplacian. 65

66 For A = 135, MDS, PCA, and Hessian LLE overwrite the data points. Diffusion Maps work very well for Sigma < 1. LLE handles corners surprisingly well. 66
67 Clustering A good mapping should preserve clusters in the original data set. 3D Clusters: Generate M non-overlapping clusters with random centers. Connect the clusters with a line. 67
68 For M = 3 clusters, MDS and PCA can project correctly. Diffusion Maps work well with large Sigma. LLE compresses each cluster into a single point. Hessian LLE has trouble with the sparse connecting lines. 68
69 For M=8 clusters, MDS and PCA can still recover. Diffusion Maps do quite well. LLE and ISOMAP are decent, but Hessian and Laplacian fail. 69

70 Noise & Non-uniform Sampling Can the method handle changes from dense to sparse regions? Toroidal Helix should be unraveled into a circle parametrized by t. We can change the sampling rate along the helix by changing the exponent R on the parameter t and we can add some noise. 70

71 With no noise added, ISOMAP, LLE, Laplacian, and Diffusion Map are correct. MDS and PCA project to an asterisk. What s up with Hessian and KNN Diffusion? 71

72 Adde noise to the Helix sampling. LLE cannot recover the circle. ISOMAP emphasizes outliers more than the other methods. 72
73 When the sampling rate is changed along the torus, Laplacian starts to mess up and Hessian is completely thrown off. Hessian LLE code crashed frequently on this example. Diffusion maps handle it quite well for carefully chosen Sigma=

74 Sparse Data & Non-uniform Sampling Of course, we want as much data as possible. But can the method handle sparse regions in the data? Punctured Sphere: the sampling is very sparse at the bottom and dense at the top. 74

75 Only LLE and Laplacian get decent results. PCA projects the sphere from the side. MDS turns it inside-out. Hessian and Diffusion Maps get correct shape, but give too much emphasis to the sparse region at the bottom of the sphere. 75
76 High-Dimensional Data All of the examples so far have been 3D. But can the data handle high-dimensional data sets, like images? Disks: Create 20x20 images with a disk of fixed radius and random center. We should recover the centers of the circles. 76

77 ??? LLE Crashed LLE crashed on high-dimensional data set. Number of images was not high enough, but ISOMAP did a very good job. 77
78 Occluded Disks We can add a second disk of radius R in the center of every image. 78

79 ??? LLE Crashed Hessian Crashed Both LLE and Hessian crashed, possibly # points is too small. Laplacian failed completely. Is ISOMAP the best for high-dimensional data? 79
80 Sensitivity to Parameters When the number of points is small or the data geometry is complex, it is important to set K appropriately, neither too big nor small. But if the data set is dense enough, we expect K around 8 or 10 to suffice. For Diffusion Maps, the method is very sensitive to the Sigma in Gaussian kernel. Varies from example to example. 80
81 Diffusion Map Sigma depends on manifold. Helix Clusters X Sigma = 10 Sigma =
82 So what have you learned, Dorothy? Speed Infers geometry? Handles nonconvex? Handles nonuniform sampling? Handles curvature? Handles corners? MDS PCA ISOMAP LLE Hessian Laplacian Diffusion Map Very slow Extremely fast Extremely slow Fast Slow Fast Fast Fast KNN Diffusion NO NO YES YES YES YES MAYBE MAYBE NO NO NO MAYBE YES MAYBE MAYBE MAYBE YES YES YES YES MAYBE NO YES YES NO NO YES MAYBE YES YES YES YES NO NO YES YES NO YES YES YES Clusters? YES YES YES YES NO NO YES YES Handles noise? Handles sparsity? Sensitive to parameters? YES YES MAYBE NO YES YES YES YES YES YES YES YES NO may crash YES NO NO NO NO YES YES YES YES VERY VERY 82
83 Some Notes on using MANI Hard to set K and Sigma just right. MDS and ISOMAP are very slow. Hessian LLE is pretty slow. Since Hessian needs a dense data set, this means it takes even longer when the # points is large. Occluded Disks is 400-dimensional data, which takes a long time and a lot of data points to correctly map. Matlab GUIs seem to run better on PC than Linux. 83
84 Credits M. Belkin, P. Niyogi, Todd Wittman 84
85 Thanks for your attention 85
So which is the best?
 Manifold Learning Techniques: So which is the best? Todd Wittman Math 8600: Geometric Data Analysis Instructor: Gilad Lerman Spring 2005 Note: This presentation does not contain information on LTSA, which
Manifold Learning Examples PCA, LLE and ISOMAP
 Manifold Learning Examples PCA, LLE and ISOMAP Dan Ventura October 14, 28 Abstract We try to give a helpful concrete example that demonstrates how to use PCA, LLE and Isomap, attempts to provide some intuition
1 Spectral Methods for Dimensionality
 1 Spectral Methods for Dimensionality Reduction Lawrence K. Saul Kilian Q. Weinberger Fei Sha Jihun Ham Daniel D. Lee How can we search for low dimensional structure in high dimensional data? If the data
Comparison of Non-linear Dimensionality Reduction Techniques for Classification with Gene Expression Microarray Data
 CMPE 59H Comparison of Non-linear Dimensionality Reduction Techniques for Classification with Gene Expression Microarray Data Term Project Report Fatma Güney, Kübra Kalkan 1/15/2013 Keywords: Non-linear
Selection of the Suitable Parameter Value for ISOMAP
 1034 JOURNAL OF SOFTWARE, VOL. 6, NO. 6, JUNE 2011 Selection of the Suitable Parameter Value for ISOMAP Li Jing and Chao Shao School of Computer and Information Engineering, Henan University of Economics
Visualization by Linear Projections as Information Retrieval
 Visualization by Linear Projections as Information Retrieval Jaakko Peltonen Helsinki University of Technology, Department of Information and Computer Science, P. O. Box 5400, FI-0015 TKK, Finland [email protected]
Visualization of Large Font Databases
 Visualization of Large Font Databases Martin Solli and Reiner Lenz Linköping University, Sweden ITN, Campus Norrköping, Linköping University, 60174 Norrköping, Sweden [email protected], [email protected]
Supervised Feature Selection & Unsupervised Dimensionality Reduction
 Supervised Feature Selection & Unsupervised Dimensionality Reduction Feature Subset Selection Supervised: class labels are given Select a subset of the problem features Why? Redundant features much or
Dimension Reduction. Wei-Ta Chu 2014/10/22. Multimedia Content Analysis, CSIE, CCU
 1 Dimension Reduction Wei-Ta Chu 2014/10/22 2 1.1 Principal Component Analysis (PCA) Widely used in dimensionality reduction, lossy data compression, feature extraction, and data visualization Also known
Manifold Learning with Variational Auto-encoder for Medical Image Analysis
 Manifold Learning with Variational Auto-encoder for Medical Image Analysis Eunbyung Park Department of Computer Science University of North Carolina at Chapel Hill [email protected] Abstract Manifold
Visualizing Data using t-sne
 Journal of Machine Learning Research 1 (2008) 1-48 Submitted 4/00; Published 10/00 Visualizing Data using t-sne Laurens van der Maaten MICC-IKAT Maastricht University P.O. Box 616, 6200 MD Maastricht,
Machine Learning in Computer Vision A Tutorial. Ajay Joshi, Anoop Cherian and Ravishankar Shivalingam Dept. of Computer Science, UMN
 Machine Learning in Computer Vision A Tutorial Ajay Joshi, Anoop Cherian and Ravishankar Shivalingam Dept. of Computer Science, UMN Outline Introduction Supervised Learning Unsupervised Learning Semi-Supervised
LABEL PROPAGATION ON GRAPHS. SEMI-SUPERVISED LEARNING. ----Changsheng Liu 10-30-2014
 LABEL PROPAGATION ON GRAPHS. SEMI-SUPERVISED LEARNING ----Changsheng Liu 10-30-2014 Agenda Semi Supervised Learning Topics in Semi Supervised Learning Label Propagation Local and global consistency Graph
A Computational Framework for Exploratory Data Analysis
 A Computational Framework for Exploratory Data Analysis Axel Wismüller Depts. of Radiology and Biomedical Engineering, University of Rochester, New York 601 Elmwood Avenue, Rochester, NY 14642-8648, U.S.A.
Data visualization using nonlinear dimensionality reduction techniques: method review and quality assessment John A. Lee Michel Verleysen
 Data visualization using nonlinear dimensionality reduction techniques: method review and quality assessment John A. Lee Michel Verleysen Machine Learning Group, Université catholique de Louvain Louvain-la-Neuve,
Dimensionality Reduction - Nonlinear Methods
 Chapter 3 Dimensionality Reduction - Nonlinear Methods This chapter covers various methods for nonlinear dimensionality reduction, where the nonlinear aspect refers to the mapping between the highdimensional
Exploratory Data Analysis with MATLAB
 Computer Science and Data Analysis Series Exploratory Data Analysis with MATLAB Second Edition Wendy L Martinez Angel R. Martinez Jeffrey L. Solka ( r ec) CRC Press VV J Taylor & Francis Group Boca Raton
HDDVis: An Interactive Tool for High Dimensional Data Visualization
 HDDVis: An Interactive Tool for High Dimensional Data Visualization Mingyue Tan Department of Computer Science University of British Columbia [email protected] ABSTRACT Current high dimensional data visualization
Distance Metric Learning in Data Mining (Part I) Fei Wang and Jimeng Sun IBM TJ Watson Research Center
 Fei Wang and Jimeng Sun IBM TJ Watson Research Center") Distance Metric Learning in Data Mining (Part I) Fei Wang and Jimeng Sun IBM TJ Watson Research Center 1 Outline Part I - Applications Motivation and Introduction Patient similarity application Part II
Distance Metric Learning in Data Mining (Part I) Fei Wang and Jimeng Sun IBM TJ Watson Research Center 1 Outline Part I - Applications Motivation and Introduction Patient similarity application Part II
Component Ordering in Independent Component Analysis Based on Data Power
 Component Ordering in Independent Component Analysis Based on Data Power Anne Hendrikse Raymond Veldhuis University of Twente University of Twente Fac. EEMCS, Signals and Systems Group Fac. EEMCS, Signals
CS 2750 Machine Learning. Lecture 1. Machine Learning. http://www.cs.pitt.edu/~milos/courses/cs2750/ CS 2750 Machine Learning.
 Lecture Machine Learning Milos Hauskrecht [email protected] 539 Sennott Square, x5 http://www.cs.pitt.edu/~milos/courses/cs75/ Administration Instructor: Milos Hauskrecht [email protected] 539 Sennott
A Survey on Pre-processing and Post-processing Techniques in Data Mining
 , pp. 99-128 http://dx.doi.org/10.14257/ijdta.2014.7.4.09 A Survey on Pre-processing and Post-processing Techniques in Data Mining Divya Tomar and Sonali Agarwal Indian Institute of Information Technology,
Data visualization and dimensionality reduction using kernel maps with a reference point
 Data visualization and dimensionality reduction using kernel maps with a reference point Johan Suykens K.U. Leuven, ESAT-SCD/SISTA Kasteelpark Arenberg 1 B-31 Leuven (Heverlee), Belgium Tel: 32/16/32 18
IEEE TRANSACTIONS ON POWER SYSTEMS, VOL. 23, NO. 3, AUGUST 2008 877
 IEEE TRANSACTIONS ON POWER SYSTEMS, VOL. 23, NO. 3, AUGUST 2008 877 Electricity Price Curve Modeling and Forecasting by Manifold Learning Jie Chen, Student Member, IEEE, Shi-Jie Deng, Senior Member, IEEE,
Visualization of Topology Representing Networks
 Visualization of Topology Representing Networks Agnes Vathy-Fogarassy 1, Agnes Werner-Stark 1, Balazs Gal 1 and Janos Abonyi 2 1 University of Pannonia, Department of Mathematics and Computing, P.O.Box
Machine Learning and Data Analysis overview. Department of Cybernetics, Czech Technical University in Prague. http://ida.felk.cvut.
 Machine Learning and Data Analysis overview Jiří Kléma Department of Cybernetics, Czech Technical University in Prague http://ida.felk.cvut.cz psyllabus Lecture Lecturer Content 1. J. Kléma Introduction,
CATIA Wireframe & Surfaces TABLE OF CONTENTS
 TABLE OF CONTENTS Introduction... 1 Wireframe & Surfaces... 2 Pull Down Menus... 3 Edit... 3 Insert... 4 Tools... 6 Generative Shape Design Workbench... 7 Bottom Toolbar... 9 Tools... 9 Analysis... 10
Accurate and robust image superresolution by neural processing of local image representations
 Accurate and robust image superresolution by neural processing of local image representations Carlos Miravet 1,2 and Francisco B. Rodríguez 1 1 Grupo de Neurocomputación Biológica (GNB), Escuela Politécnica
CS 5614: (Big) Data Management Systems. B. Aditya Prakash Lecture #18: Dimensionality Reduc7on
 Data Management Systems. B. Aditya Prakash Lecture #18: Dimensionality Reduc7on") CS 5614: (Big) Data Management Systems B. Aditya Prakash Lecture #18: Dimensionality Reduc7on Dimensionality Reduc=on Assump=on: Data lies on or near a low d- dimensional subspace Axes of this subspace
CS 5614: (Big) Data Management Systems B. Aditya Prakash Lecture #18: Dimensionality Reduc7on Dimensionality Reduc=on Assump=on: Data lies on or near a low d- dimensional subspace Axes of this subspace
Cluster Analysis: Advanced Concepts
 Cluster Analysis: Advanced Concepts and dalgorithms Dr. Hui Xiong Rutgers University Introduction to Data Mining 08/06/2006 1 Introduction to Data Mining 08/06/2006 1 Outline Prototype-based Fuzzy c-means
EM Clustering Approach for Multi-Dimensional Analysis of Big Data Set
 EM Clustering Approach for Multi-Dimensional Analysis of Big Data Set Amhmed A. Bhih School of Electrical and Electronic Engineering Princy Johnson School of Electrical and Electronic Engineering Martin
Supporting Online Material for
 www.sciencemag.org/cgi/content/full/313/5786/504/dc1 Supporting Online Material for Reducing the Dimensionality of Data with Neural Networks G. E. Hinton* and R. R. Salakhutdinov *To whom correspondence
How To Cluster
 Data Clustering Dec 2nd, 2013 Kyrylo Bessonov Talk outline Introduction to clustering Types of clustering Supervised Unsupervised Similarity measures Main clustering algorithms k-means Hierarchical Main
Visualization of General Defined Space Data
 International Journal of Computer Graphics & Animation (IJCGA) Vol.3, No.4, October 013 Visualization of General Defined Space Data John R Rankin La Trobe University, Australia Abstract A new algorithm
Classification of Fingerprints. Sarat C. Dass Department of Statistics & Probability
 Classification of Fingerprints Sarat C. Dass Department of Statistics & Probability Fingerprint Classification Fingerprint classification is a coarse level partitioning of a fingerprint database into smaller
Machine Learning for Data Science (CS4786) Lecture 1
 Lecture 1") Machine Learning for Data Science (CS4786) Lecture 1 Tu-Th 10:10 to 11:25 AM Hollister B14 Instructors : Lillian Lee and Karthik Sridharan ROUGH DETAILS ABOUT THE COURSE Diagnostic assignment 0 is out:
Machine Learning for Data Science (CS4786) Lecture 1 Tu-Th 10:10 to 11:25 AM Hollister B14 Instructors : Lillian Lee and Karthik Sridharan ROUGH DETAILS ABOUT THE COURSE Diagnostic assignment 0 is out:
Metrics on SO(3) and Inverse Kinematics
 and Inverse Kinematics") Mathematical Foundations of Computer Graphics and Vision Metrics on SO(3) and Inverse Kinematics Luca Ballan Institute of Visual Computing Optimization on Manifolds Descent approach d is a ascent direction
Mathematical Foundations of Computer Graphics and Vision Metrics on SO(3) and Inverse Kinematics Luca Ballan Institute of Visual Computing Optimization on Manifolds Descent approach d is a ascent direction
Dmitri Krioukov CAIDA/UCSD
 Hyperbolic geometry of complex networks Dmitri Krioukov CAIDA/UCSD [email protected] F. Papadopoulos, M. Boguñá, A. Vahdat, and kc claffy Complex networks Technological Internet Transportation Power grid
BIOINF 585 Fall 2015 Machine Learning for Systems Biology & Clinical Informatics http://www.ccmb.med.umich.edu/node/1376
 Course Director: Dr. Kayvan Najarian (DCM&B, [email protected]) Lectures: Labs: Mondays and Wednesdays 9:00 AM -10:30 AM Rm. 2065 Palmer Commons Bldg. Wednesdays 10:30 AM 11:30 AM (alternate weeks) Rm.
View-Invariant Dynamic Texture Recognition using a Bag of Dynamical Systems
 View-Invariant Dynamic Texture Recognition using a Bag of Dynamical Systems Avinash Ravichandran, Rizwan Chaudhry and René Vidal Center for Imaging Science, Johns Hopkins University, Baltimore, MD 21218,
Feature Point Selection using Structural Graph Matching for MLS based Image Registration
 Feature Point Selection using Structural Graph Matching for MLS based Image Registration Hema P Menon Department of CSE Amrita Vishwa Vidyapeetham Coimbatore Tamil Nadu - 641 112, India K A Narayanankutty
Principal components analysis
 CS229 Lecture notes Andrew Ng Part XI Principal components analysis In our discussion of factor analysis, we gave a way to model data x R n as approximately lying in some k-dimension subspace, where k
Unsupervised Data Mining (Clustering)
") Unsupervised Data Mining (Clustering) Javier Béjar KEMLG December 01 Javier Béjar (KEMLG) Unsupervised Data Mining (Clustering) December 01 1 / 51 Introduction Clustering in KDD One of the main tasks in
Unsupervised Data Mining (Clustering) Javier Béjar KEMLG December 01 Javier Béjar (KEMLG) Unsupervised Data Mining (Clustering) December 01 1 / 51 Introduction Clustering in KDD One of the main tasks in
RnavGraph: A visualization tool for navigating through high-dimensional data
 Int. Statistical Inst.: Proc. 58th World Statistical Congress, 2011, Dublin (Session IPS117) p.1852 RnavGraph: A visualization tool for navigating through high-dimensional data Waddell, Adrian University
Neural Networks Lesson 5 - Cluster Analysis
 Neural Networks Lesson 5 - Cluster Analysis Prof. Michele Scarpiniti INFOCOM Dpt. - Sapienza University of Rome http://ispac.ing.uniroma1.it/scarpiniti/index.htm [email protected] Rome, 29
Self Organizing Maps: Fundamentals
 Self Organizing Maps: Fundamentals Introduction to Neural Networks : Lecture 16 John A. Bullinaria, 2004 1. What is a Self Organizing Map? 2. Topographic Maps 3. Setting up a Self Organizing Map 4. Kohonen
Euclidean Heuristic Optimization
 Proceedings of the Twenty-Fifth AAAI Conference on Artificial Intelligence Euclidean Heuristic Optimization Chris Rayner and Michael Bowling Department of Computing Science University of Alberta Edmonton,
ADVANCED MACHINE LEARNING. Introduction
 1 1 Introduction Lecturer: Prof. Aude Billard ([email protected]) Teaching Assistants: Guillaume de Chambrier, Nadia Figueroa, Denys Lamotte, Nicola Sommer 2 2 Course Format Alternate between: Lectures
Medical Information Management & Mining. You Chen Jan,15, 2013 [email protected]
 Medical Information Management & Mining You Chen Jan,15, 2013 [email protected] 1 Trees Building Materials Trees cannot be used to build a house directly. How can we transform trees to building materials?
Unsupervised and supervised dimension reduction: Algorithms and connections
 Unsupervised and supervised dimension reduction: Algorithms and connections Jieping Ye Department of Computer Science and Engineering Evolutionary Functional Genomics Center The Biodesign Institute Arizona
Large-Scale Similarity and Distance Metric Learning
 Large-Scale Similarity and Distance Metric Learning Aurélien Bellet Télécom ParisTech Joint work with K. Liu, Y. Shi and F. Sha (USC), S. Clémençon and I. Colin (Télécom ParisTech) Séminaire Criteo March
Soft Clustering with Projections: PCA, ICA, and Laplacian
 1 Soft Clustering with Projections: PCA, ICA, and Laplacian David Gleich and Leonid Zhukov Abstract In this paper we present a comparison of three projection methods that use the eigenvectors of a matrix
MAVIparticle Modular Algorithms for 3D Particle Characterization
 MAVIparticle Modular Algorithms for 3D Particle Characterization version 1.0 Image Processing Department Fraunhofer ITWM Contents Contents 1 Introduction 2 2 The program 2 2.1 Framework..............................
Waffles: A Machine Learning Toolkit
 Journal of Machine Learning Research 12 (2011) 2383-2387 Submitted 6/10; Revised 3/11; Published 7/11 Waffles: A Machine Learning Toolkit Mike Gashler Department of Computer Science Brigham Young University
Probabilistic Latent Semantic Analysis (plsa)
") Probabilistic Latent Semantic Analysis (plsa) SS 2008 Bayesian Networks Multimedia Computing, Universität Augsburg [email protected] www.multimedia-computing.{de,org} References
Probabilistic Latent Semantic Analysis (plsa) SS 2008 Bayesian Networks Multimedia Computing, Universität Augsburg [email protected] www.multimedia-computing.{de,org} References
Class #6: Non-linear classification. ML4Bio 2012 February 17 th, 2012 Quaid Morris
 Class #6: Non-linear classification ML4Bio 2012 February 17 th, 2012 Quaid Morris 1 Module #: Title of Module 2 Review Overview Linear separability Non-linear classification Linear Support Vector Machines
1051-232 Imaging Systems Laboratory II. Laboratory 4: Basic Lens Design in OSLO April 2 & 4, 2002
 05-232 Imaging Systems Laboratory II Laboratory 4: Basic Lens Design in OSLO April 2 & 4, 2002 Abstract: For designing the optics of an imaging system, one of the main types of tools used today is optical
Going Big in Data Dimensionality:
 LUDWIG- MAXIMILIANS- UNIVERSITY MUNICH DEPARTMENT INSTITUTE FOR INFORMATICS DATABASE Going Big in Data Dimensionality: Challenges and Solutions for Mining High Dimensional Data Peer Kröger Lehrstuhl für
Image Segmentation and Registration
 Image Segmentation and Registration Dr. Christine Tanner ([email protected]) Computer Vision Laboratory, ETH Zürich Dr. Verena Kaynig, Machine Learning Laboratory, ETH Zürich Outline Segmentation
Part-Based Recognition
 Part-Based Recognition Benedict Brown CS597D, Fall 2003 Princeton University CS 597D, Part-Based Recognition p. 1/32 Introduction Many objects are made up of parts It s presumably easier to identify simple
Gaussian Process Latent Variable Models for Visualisation of High Dimensional Data
 Gaussian Process Latent Variable Models for Visualisation of High Dimensional Data Neil D. Lawrence Department of Computer Science, University of Sheffield, Regent Court, 211 Portobello Street, Sheffield,
Essential Mathematics for Computer Graphics fast
 John Vince Essential Mathematics for Computer Graphics fast Springer Contents 1. MATHEMATICS 1 Is mathematics difficult? 3 Who should read this book? 4 Aims and objectives of this book 4 Assumptions made
Taking Inverse Graphics Seriously
 CSC2535: 2013 Advanced Machine Learning Taking Inverse Graphics Seriously Geoffrey Hinton Department of Computer Science University of Toronto The representation used by the neural nets that work best
EECS 556 Image Processing W 09. Interpolation. Interpolation techniques B splines
 EECS 556 Image Processing W 09 Interpolation Interpolation techniques B splines What is image processing? Image processing is the application of 2D signal processing methods to images Image representation
Least-Squares Intersection of Lines
 Least-Squares Intersection of Lines Johannes Traa - UIUC 2013 This write-up derives the least-squares solution for the intersection of lines. In the general case, a set of lines will not intersect at a
Analysis of kiva.com Microlending Service! Hoda Eydgahi Julia Ma Andy Bardagjy December 9, 2010 MAS.622j
 Analysis of kiva.com Microlending Service! Hoda Eydgahi Julia Ma Andy Bardagjy December 9, 2010 MAS.622j What is Kiva? An organization that allows people to lend small amounts of money via the Internet
Super-Resolution Through Neighbor Embedding
 Super-Resolution Through Neighbor Embedding Hong Chang, Dit-Yan Yeung, Yimin Xiong Department of Computer Science Hong Kong University of Science and Technology Clear Water Bay, Kowloon, Hong Kong {hongch,
A Simple Introduction to Support Vector Machines
 A Simple Introduction to Support Vector Machines Martin Law Lecture for CSE 802 Department of Computer Science and Engineering Michigan State University Outline A brief history of SVM Large-margin linear
Wii Remote Calibration Using the Sensor Bar
 Wii Remote Calibration Using the Sensor Bar Alparslan Yildiz Abdullah Akay Yusuf Sinan Akgul GIT Vision Lab - http://vision.gyte.edu.tr Gebze Institute of Technology Kocaeli, Turkey {yildiz, akay, akgul}@bilmuh.gyte.edu.tr
HT2015: SC4 Statistical Data Mining and Machine Learning
 HT2015: SC4 Statistical Data Mining and Machine Learning Dino Sejdinovic Department of Statistics Oxford http://www.stats.ox.ac.uk/~sejdinov/sdmml.html Bayesian Nonparametrics Parametric vs Nonparametric
. Learn the number of classes and the structure of each class using similarity between unlabeled training patterns
 Outline Part 1: of data clustering Non-Supervised Learning and Clustering : Problem formulation cluster analysis : Taxonomies of Clustering Techniques : Data types and Proximity Measures : Difficulties
CLUSTER ANALYSIS FOR SEGMENTATION
 CLUSTER ANALYSIS FOR SEGMENTATION Introduction We all understand that consumers are not all alike. This provides a challenge for the development and marketing of profitable products and services. Not every
A Partially Supervised Metric Multidimensional Scaling Algorithm for Textual Data Visualization
 A Partially Supervised Metric Multidimensional Scaling Algorithm for Textual Data Visualization Ángela Blanco Universidad Pontificia de Salamanca [email protected] Spain Manuel Martín-Merino Universidad
The geometry of the market
 The geometry of the market Contents 1 The Market Geometry Market metric Principal directions Effective dimensions A measure of structure New structure after 1997 2 Market networks Networks in and outside
Computational Geometry. Lecture 1: Introduction and Convex Hulls
 Lecture 1: Introduction and convex hulls 1 Geometry: points, lines,... Plane (two-dimensional), R 2 Space (three-dimensional), R 3 Space (higher-dimensional), R d A point in the plane, 3-dimensional space,
Bending Stress in Beams
 936-73-600 Bending Stress in Beams Derive a relationship for bending stress in a beam: Basic Assumptions:. Deflections are very small with respect to the depth of the beam. Plane sections before bending
Subspace Analysis and Optimization for AAM Based Face Alignment
 Subspace Analysis and Optimization for AAM Based Face Alignment Ming Zhao Chun Chen College of Computer Science Zhejiang University Hangzhou, 310027, P.R.China [email protected] Stan Z. Li Microsoft
Manifold Learning and Representations for Image Analysis and Visualization
 Linköping Studies in Science and Technology Thesis No. 1235 Manifold Learning and Representations for Image Analysis and Visualization Anders Brun LiU-TEK-LIC-2006:16 Department of Biomedical Engineering
TDA and Machine Learning: Better Together
 TDA and Machine Learning: Better Together TDA AND MACHINE LEARNING: BETTER TOGETHER 2 TABLE OF CONTENTS The New Data Analytics Dilemma... 3 Introducing Topology and Topological Data Analysis... 3 The Promise
Anomaly Detection using multidimensional reduction Principal Component Analysis
 IOSR Journal of Computer Engineering (IOSR-JCE) e-issn: 2278-0661, p- ISSN: 2278-8727Volume 16, Issue 1, Ver. II (Jan. 2014), PP 86-90 Anomaly Detection using multidimensional reduction Principal Component
Syllabus for MATH 191 MATH 191 Topics in Data Science: Algorithms and Mathematical Foundations Department of Mathematics, UCLA Fall Quarter 2015
 Syllabus for MATH 191 MATH 191 Topics in Data Science: Algorithms and Mathematical Foundations Department of Mathematics, UCLA Fall Quarter 2015 Lecture: MWF: 1:00-1:50pm, GEOLOGY 4645 Instructor: Mihai
ARTIFICIAL INTELLIGENCE (CSCU9YE) LECTURE 6: MACHINE LEARNING 2: UNSUPERVISED LEARNING (CLUSTERING)
 LECTURE 6: MACHINE LEARNING 2: UNSUPERVISED LEARNING (CLUSTERING)") ARTIFICIAL INTELLIGENCE (CSCU9YE) LECTURE 6: MACHINE LEARNING 2: UNSUPERVISED LEARNING (CLUSTERING) Gabriela Ochoa http://www.cs.stir.ac.uk/~goc/ OUTLINE Preliminaries Classification and Clustering Applications
ARTIFICIAL INTELLIGENCE (CSCU9YE) LECTURE 6: MACHINE LEARNING 2: UNSUPERVISED LEARNING (CLUSTERING) Gabriela Ochoa http://www.cs.stir.ac.uk/~goc/ OUTLINE Preliminaries Classification and Clustering Applications
Statistical Models in Data Mining
 Statistical Models in Data Mining Sargur N. Srihari University at Buffalo The State University of New York Department of Computer Science and Engineering Department of Biostatistics 1 Srihari Flood of
Introduction to k Nearest Neighbour Classification and Condensed Nearest Neighbour Data Reduction
 Introduction to k Nearest Neighbour Classification and Condensed Nearest Neighbour Data Reduction Oliver Sutton February, 2012 Contents 1 Introduction 1 1.1 Example........................................
Introduction to CATIA V5
 Introduction to CATIA V5 Release 16 (A Hands-On Tutorial Approach) Kirstie Plantenberg University of Detroit Mercy SDC PUBLICATIONS Schroff Development Corporation www.schroff.com www.schroff-europe.com
Bildverarbeitung und Mustererkennung Image Processing and Pattern Recognition
 Bildverarbeitung und Mustererkennung Image Processing and Pattern Recognition 1. Image Pre-Processing - Pixel Brightness Transformation - Geometric Transformation - Image Denoising 1 1. Image Pre-Processing
Introduction Epipolar Geometry Calibration Methods Further Readings. Stereo Camera Calibration
 Stereo Camera Calibration Stereo Camera Calibration Stereo Camera Calibration Stereo Camera Calibration 12.10.2004 Overview Introduction Summary / Motivation Depth Perception Ambiguity of Correspondence