2016 IOWA LAND VALUE SURVEY: OVERVIEW
|
|
|
- Wilfred Cameron
- 7 years ago
- Views:
Transcription
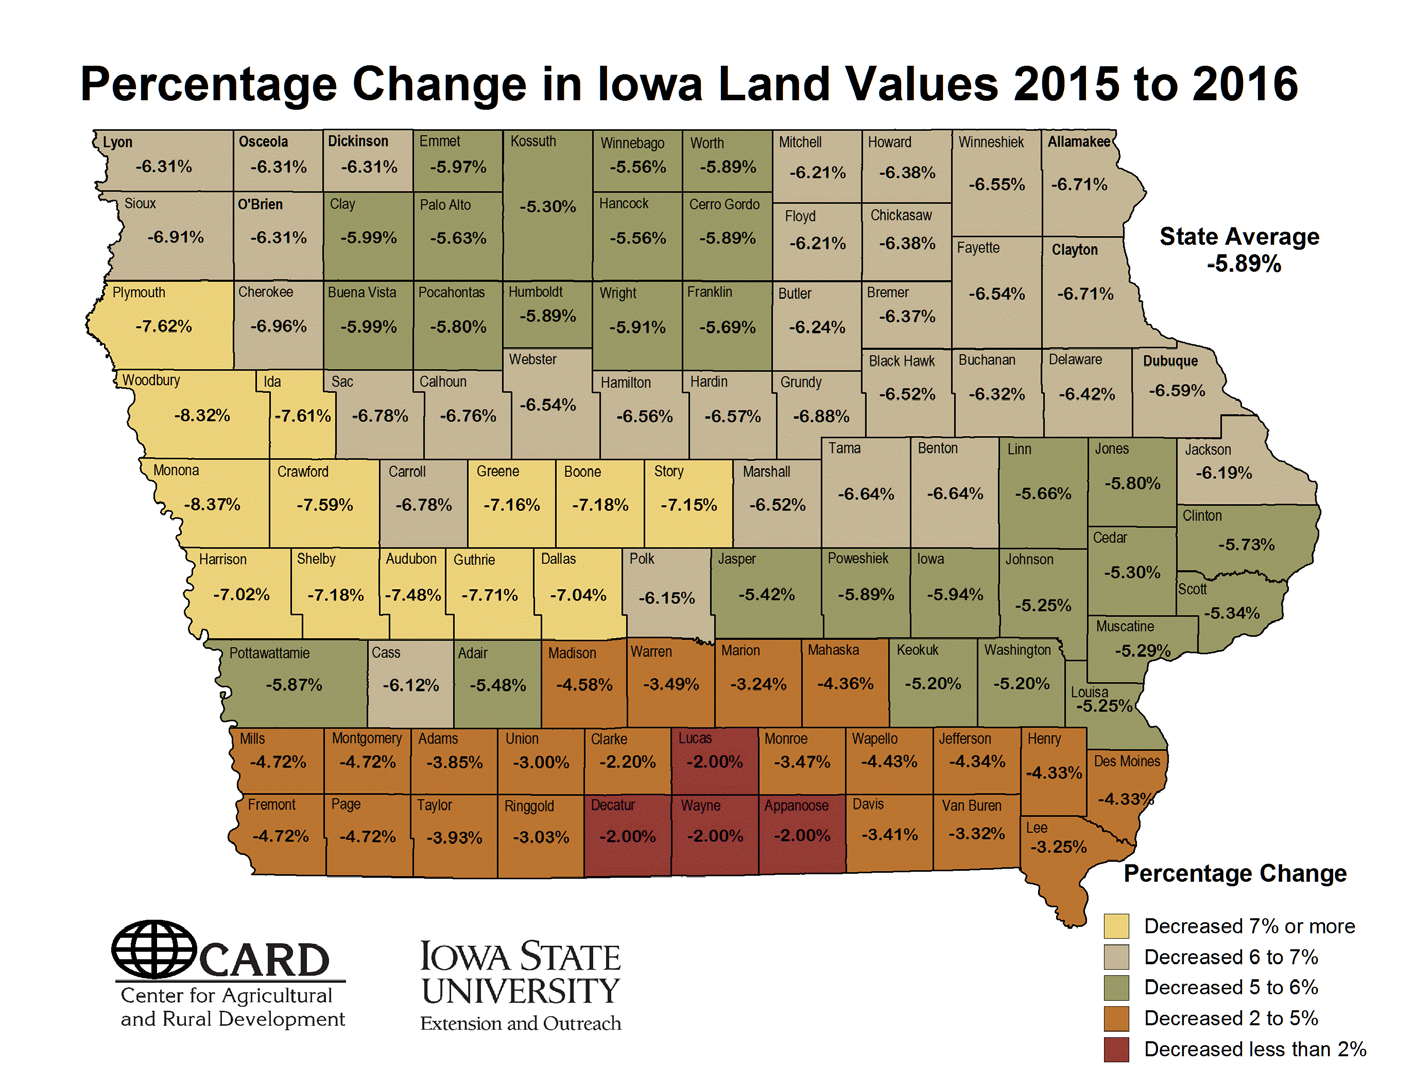
1 2016 IOWA LAND VALUE SURVEY: OVERVIEW 1.0 History and Purpose of the Land Value Survey. 1.1 The survey was initiated in 1941 and is sponsored annually by Iowa State University. Only the state average and the district averages are based directly on ISU survey data. County estimates are derived using a procedure that combines ISU survey results with data from the US Census of Agriculture. Since 2014, the survey has been conducted by the Center for Agricultural and Rural Development in the Department of Economics at Iowa State University and Iowa State University Extension and Outreach. 1.2 The survey is intended to provide information on general land value trends, geographical land price relationships, and factors influencing the Iowa land market. The survey is not intended to provide a direct estimate for any particular piece of property. 1.3 The survey is based on reports by licensed real estate brokers, farm managers, appraisers, agricultural lenders, county assessors, and selected individuals considered to be knowledgeable of land market conditions. Respondents were asked to report for more than one county if they were knowledgeable about the land markets. The 2016 survey is based on 518 usable respondents providing 711 county land values estimates. 1.4 Of the 518 respondents, 252 (49 percent) completed the survey online. Online responses allow participants to provide estimates for up to 15 counties. A new web portal has been developed this year to facilitate the visualization and analysis of Iowa farmland values by pooling data from ISU, USDA, Chicago Fed, and the Realtor Land Institute, as well as by making use of charts over time and interactive county maps. The portal can be accessed at Participants in the survey are asked to estimate the value of high-, medium-, and low- quality land in their county. Comparative sales and other factors are taken into account by the respondents in making these value estimates. This survey is the only data source that provides an annual land value estimate at the county level for each of the 99 counties in Iowa. In addition, this survey provides estimates of high-, medium-, and low-quality land at the crop reporting districts and state level. 2.0 Analysis by State. 2.1 The 2016 state average for all quality of land was estimated to be $7,183 per acre as of November The state value decreased $450 per acre from November The percentage decrease was 5.9 percent from November December 13, 2016 Prepared by Dr. Wendong Zhang ( , wdzhang@iastate.edu), assistant professor of Economics and extension economist, Karen Kovarik, CARD staff, Morgan Ruiz and Philip Sciranko, undergraduate research assistants.
2 3.0 Analysis by Crop Reporting District. 3.1 The highest average land values were reported for Northwest Iowa, $9,243 per acre. 3.2 The lowest average land values were estimated for South Central Iowa, $4,241 per acre. 3.3 All nine crop reporting districts reported losses in land values: the largest percentage decrease was in West Central Iowa, 8.7 percent, while the smallest percentage decrease was in Southeast Iowa, 2.6 percent. 3.4 Only low-quality land in Southwest and South Central Iowa reported increase in value. 4.0 Analysis by Counties. 4.1 The highest value was estimated for Scott County, $10,335 per acre. 4.2 The lowest value was in Decatur County, $3,443 per acre. 4.3 All 99 counties in Iowa reported decrease in land value. 4.4 The largest dollar decrease was in Plymouth and Sioux Counties, $747. The highest percentage decrease was 8.4 percent in Monona County. The smallest dollar decrease was in Decatur County, $70. The lowest percentage decrease was 2.0 percent in Decatur, Appanoose, Wayne and Lucas Counties. 5.0 Analysis by Quality of Land. 5.1 Low-quality land in the state averaged $4,665 per acre and showed a 3.5 percent decrease or $169 per acre. 5.2 Medium-quality land averaged $6,705 per acre and showed a 5.9 percent decrease or $294 per acre. 5.3 High-quality land averaged $8,758 per acre and showed a decrease of 6.5 percent or $606 per acre. 6.0 Major Factors Influencing the Farmland Market. 6.1 Most survey respondents listed positive and/or negative factors influencing the land market. Of these respondents, 90 percent listed at least one positive factor, and 92 percent listed at least one negative factor. In most cases, respondents listed multiple factors. 6.2 There were three positive factors listed by over 10 percent of respondents who provided at least one positive factor. The most frequently mentioned factor was low interest rates, mentioned by 23 percent of the respondents. Strong yields were the second-most frequently mentioned positive factor, mentioned by 17 percent of the respondents. Other frequently mentioned positive factors included limited land supply (17 percent) and strong demand (4 percent). 6.3 There was only one negative factor listed by more than 10 percent of respondents who identified at least one negative factor. The most frequently mentioned negative factor affecting land values was lower commodity prices, mentioned by 40 percent of respondents. High input prices were the second-most frequently mentioned negative factor (8 percent). Livestock losses, weak cash rental rates, and weakening global economy and stock market returns was mentioned by 7, 5, and 4 percent of the respondents, respectively. 2
3 7.0 Number of Sales Compared to Previous Year. 7.1 Over half, (61 percent) of respondents reported lower sales in 2016 relative to On the other end of the spectrum, just 10 percent reported more sales, and 29 percent reported the same level of sales in 2016 relative to East Central Iowa has the highest percentage of respondents who reported lower sales, 73 percent, while the Southeast and Northwest districts have the lowest percentage of respondents who reported lower sales, 48 and 46 percent, respectively. 8.0 Land Sales by Buyer Category. 8.1 The 2016 survey asked respondents what percent of the land was sold to five categories of buyers: existing local farmers, existing relocating farmers, new farmers, investors, or other. 8.2 The majority of farmland sales, 74 percent, were to existing farmers, of which existing local farmers capture 72 percent of land sales and only 2 percent were to existing relocating farmers. Investors represented 22 percent of land sales. New farmers represented 3 percent of sales, and other purchasers were 1 percent of sales. 8.3 Sales to existing local farmers by crop reporting districts ranged from 79 percent in Northwest Iowa to 57 percent in South Central Iowa. 8.4 Sales to investors were highest in South Central Iowa (33 percent). Northeast Iowa reported the lowest investor activity (15 percent). 9.0 Land Sales by Seller Category. 9.1 The 2016 survey asked respondents what percent of land was bought from five categories of sellers: active farmers, retired farmers, estate sales, investors, or other. 9.2 The majority of farmland sales, 53 percent, were from estate sales, followed by retired farmers at 23 percent. Active farmers account for 12 percent of sales, while investors accounted for 9 percent. 9.3 Estate sales by crop reporting districts ranged from 64 percent in Northwest Iowa to 37 percent in South Central Iowa. 9.4 Sales by investors were highest in South Central Iowa (19 percent). Northeast and West Central Iowa reported the lowest investor sale activity (5 percent) Respondents by Occupation and by Mode of Survey 10.1 The 2016 Iowa land value survey asked a new question regarding the main occupation of the respondent: farm managers, appraisers, agricultural lenders, brokers/realtors, government, farmers/landowners, and other. This year s survey also asked about the number of years experience of respondents and number of counties they offer services in. Additionally, the land value survey was available online in addition to using the traditional mail copy In total, 518 agricultural professional completed the survey, providing 711 county land value estimates. Of these 518 respondents, agricultural lenders represented the largest group, accounting for 34 percent of all respondents. Realtors/brokers, farm managers, and appraisers were the other three largest groups exceeding 10 percent of all respondents, representing 19, 15, and 11 percent of respondents, respectively. 3
4 10.3 Of all respondents, the percentage of agricultural lenders ranged from 22 percent in South Central to 48 percent in the Northeast and West Central districts Agricultural professionals on average have over 20 years of experience in their current profession and offer service to an average of 10 counties The survey was completed online by 252 participants 49 percent of the 518 respondents in total. In addition, with the help of the Iowa Chapter of American Society of Farm Managers and Rural Appraisers and Iowa Bankers Association, 174 agricultural professionals participated in the survey Farmland Value and Cash Crop Price Predictions by Respondents 11.1 This year s survey asked respondents to predict land values and cash crop prices in November 2017, 2018, and The majority of respondents expect stabilization of the farmland market in their area over the next year or two, and this is comparable to the average reported value for November 2016 for respondents who provided a land value prediction. Respondents in Central and South Central districts are forecasting an increase in the local land market next year Forty-eight and 19 percent of all respondents who offered a prediction expect a lower land value for November 2018 compared to November 2017, leading to a decline in land value predictions across all nine districts from 2017 to Additionally, over half of respondents are hopeful for the farmland market in the medium run, and expect the land values to bounce back before November Respondents expect a slow but steady improvement in the cash crop markets, both corn and soybean. In particular, the state average cash corn prices for November 2017, 2018, and 2020 are $3.38/bu, $3.60/bu, and $3.94/bu, respectively. The state average soybean price predictions are $9.24/bu, $9.48/bu, and $10.06/bu Land Quality and Corn Suitability Rating 2 and Crop Yields 12.1 To gauge how each respondent defined high-, medium-, and low-quality land for their county, we asked for estimated average CSR2 (Corn Suitability Rating 2) and crop yields for high-, medium-, and low-quality land Results show that agricultural professionals have adapted to CSR2. Approximately 89 percent of participants provided at least one CSR2 estimate for the corresponding land quality classes. The estimated average CSR2 statewide for high-, medium-, and low- quality land is 81, 69, and 55 points respectively, while the statewide average corn yields for these three land quality classes are 208, 182, and 155 bushels per acre, respectively In addition, respondents ranked high-, medium-, and low-quality land based on relative conditions in their region. For example, the average CSR2 for high-quality land in the South Central district is 68, comparable to the CSR2 for low-quality land in Northwest district at 66. Similarly, corn yields for medium-quality land range from above 190 bushels per acre in the East Central and Northwest districts to 154 bushels per acre in the South Central district. Interpretation of the Survey Results. The Iowa State University land value survey reported a 5.9 percent decrease to $7,183 in Iowa farmland values from November 2015 to November This represents a modest decline in Iowa farmland values, and reveals that land values have decreased three years in a row the first time since the 1980s farm crisis. This unprecedented consecutive drop reminds many of the painful farm crisis in the mid-1980s. However, despite continued downward pressures on farm income and farmland prices, current Iowa 4
5 farmland values are still more than double what they were 10 years ago, 64 percent higher than the 2009 values and 7 percent higher than the 2011 values. The 2016 ISU survey shows that all nine crop reporting districts and all 99 counties in Iowa reported a loss in average land values in The largest district-wide decrease in value was in West Central Iowa, which reported a drop of 8.7 percent, bringing farmland values there down to $7,358 per acre. The Northwest district, which reported an increase from November 2014 to 2015, also saw a 4.6% decline this year. This is largely driven by changes in the livestock industry livestock producers braced for a tougher environment over last couple months and hog, livestock, and dairy prices have also dropped by more than 30 percent compared to two years ago. The smallest decrease was reported in the Southeast district, 2.6 percent, bringing values there to $6,716 per acre. Additionally, all 99 counties reported a drop in average land values this year, ranging from 8.4 percent in Monona County to 2.0 percent in Decatur, Appanoose, Wayne, and Lucas Counties. This year s survey also revealed different patterns in land values across different land quality classes: while state-average values for high-quality land decreased 5.9 percent, there was only a 3.5 percent decline for low-quality farmland values. In addition, low-quality land in the Southwest and South Central districts were the only areas to show an increase in average values, reporting gains of 2.9 and 5.2 percent, respectively. This is likely a combined result of strong recreational demand, higher government payments from conservation programs such as the Conserve Reserve Program (CRP), and limited land supply. In general, the results from the 2016 Iowa State University land value survey echo results from other surveys. The Federal Reserve Bank of Chicago reported Iowa land values down 5 percent from October 2015 to October The same survey reported Iowa land values decreased by 1 percent from July to October, 2016, and a 2 percent increase in land values in southern Iowa from July to October 2016, which is consistent with the smaller decline in Southwest and South Central districts revealed by the 2016 ISU survey. The USDA reported Iowa farmland values down by 1.9 percent from June 2016 to June The Realtors Land Institute reported land values down 5.0 percent from September 2015 to March 2016 but only down 3.7 percent from March 2016 to September There were several new features added to this year s survey. A few of the highlights are: In addition to asking respondents about the buyers of farmland purchases, we added questions on who sells land. The majority of farmland sales, 53 percent, were from estate sales, followed by retired farmers at 23 percent. Active farmers account for 12 percent, while investors only sold 9 percent of farmland in Iowa. Additionally, 74 percent of all farmland purchases were to existing farmers, of which existing local farmers and investors and new farmers account for another 22 and 3 percent, respectively. This suggests that Iowa farmland market is featured with local farmers buying local land. Second, respondents were asked to predict how the land values and cash crop prices in their county would change in November 2017, 2018, and In general, respondents are expecting a slight improvement in the cash crop market: the expected cash corn and soybean prices for November 2018 are $3.60/bushel and $9.48/bushel, which is higher than current and expected November 2017 levels. Respondents also expect the land market to stabilize and even slightly increase next year, but the majority also forecasted a decrease from 2017 to Third, this year s survey asked about the number of years experience of respondents and number of counties they offer services in. Results show that agricultural professionals on average have over 20 years of experience in their current profession and offer service to an average of 10 counties. Finally, to gauge how each respondent defined high-, medium-, and low-quality land for their county, we asked for estimated average CSR2 (Corn Suitability Rating) points and corn yields for all land quality classes. Results show respondents were defining high-, medium-, and low-quality based on relative conditions in their region. For example, the average CSR2 and corn yield for high-quality land in South Central was 68 points and 186 bushels/acre, which is lower than the CSR2 for medium-quality land in Northwest Iowa at 79 points and 191 bushels/acre. 5
6 The survey reports on sales in the Iowa farmland market. The percent of respondents who reported fewer sales is the second-highest recorded to date at 61 percent, which is slightly higher than Additionally, the most common positive factors influencing land prices noted by survey respondents were low interest rates, strong crop yields, limited land supply, and strong demand. The most commonly cited negative influences were lower commodity prices, high input prices, livestock losses, weak cash rental rates, and a weakening global economy and stock market returns. The farmland value estimates from the ISU Land Value Survey is average land value estimates for all farmland in the county, which not only includes cropland, but also include pasture, CRP, and timberland. Specifically, we ask the respondents farmland value for average-sized farms in your county as of November 1. It is important to remember that the Iowa State University survey is an opinion survey, as are the surveys conducted by Federal Reserve Bank, USDA, and the Realtor Land Institute. There are four major distinctions between the ISU survey and other surveys of Iowa farmland market conducted by USDA, Federal Reserve, and RLI. First, the respondents are different: the ISU survey relies on farm managers, appraisers, brokers and agricultural lenders. The RLI survey relies mainly on farm managers, appraisers, and brokers. The Federal Reserve survey relies on bank presidents and agricultural lenders. The USDA relies on estimates by individual agricultural producers. Second, the land value definitions are different: for example, USDA asks the farmer to estimate the current market value of the parcel that he or she operates, while the ISU survey asks for the typical farmland value for average-sized farms in a particular county. The RLI breaks down land value by high-, medium-, and low-quality tillable cropland, pasture, and timberland. Third, the spatial coverage of the survey is different: ISU is the only data source that provides an annual land value estimate at the county level, RLI is at the crop reporting district level, and USDA and Federal Reserve are typically at the state level. USDA Census of Agriculture does provide a county-level estimate but that is conducted every five years. Finally, the timing of the survey is different: ISU land value estimates are as of November 1, the USDA survey is released every August for value as of June, RLI estimates are released every March and September, and Federal Reserve estimates are released in January, April, July, and October. An opinion survey is just that. It represents the collective opinion of the survey respondents. Most of the respondents will use actual sales to formulate their opinions but each person can choose to weigh or discount particular sales as they deem necessary. In addition to farmland transactions, opinion-based surveys often provide consistent and complimentary information on farmland market trends at the county, district and state level. A study led by Dr. Mike Duffy comparing the ISU land value survey and actual sales data in Iowa from 2000 to 2011 showed that differences were not statistically significant. Some years the opinion was higher and vice versa. For some counties the differences were greater in one year and less in another. So, even though the opinion survey averaged higher than the sales, the difference was not statistically significant. Land value surveys provide a good indication of the direction of change and level of value, but they are still an opinion survey that represents who is being surveyed. It is important to consider the survey respondents, the questions asked, the time period covered, and other factors relating to a particular survey. The ISU land value survey is intended to provide information on general land value trends and geographical land price relationships and factors influencing the Iowa land market. The survey is not intended to provide a direct estimate for any particular piece of property. We recommend the interested buyer or seller go to county assessor websites (Beacon or Vanguard) or auction results to check out recent sales for comparable parcels in their region. Dr. William Edwards also has two Ag Decision Maker articles that evaluate the economic and financial aspects of a farmland purchase. Outlook for Land Values. The decline revealed by the 2016 ISU land value survey didn t come as a surprise for some in November 2015, over 75 percent of 2015 ISU survey respondents thought land values in their territory would 6
7 continue to decline in The majority predicted the decline would be either less than 5 percent or between 5 and 10 percent, which is consistent with the 5.9 percent decrease reported by the 2016 ISU survey. Although modest, this 5.9 percent decline this year represents a three-year streak that average Iowa farmland values have been shown a decline, which is the first time this has happened since the 1980s farm crisis. For a pessimist, there are plenty of legitimate reasons to worry: first, according to USDA, net farm income dropped another 17.2 percent to $66.9 billion in August 2016, and this represents the lowest since 2009 in both real and nominal terms. Second, financial stress in the agricultural sector shows slow but steady increase, with continued declines in loan repayment rates and uptakes in farm real estate and working capital debt. Third, while corn and soybean prices continue to fall short of production costs, livestock producers faced a tougher environment in 2016 with hog, cattle, and dairy prices all down by at least 30 percent compared to two years ago. However, this decline is not a doomsday scenario. First, the 5.9 percent decline is still modest and actually lower than the rate many expected to see. Average farmland values hit a historic peak of $8,716 per acre in 2013, but declined 8.9 percent in 2014, 3.9 percent in 2015, and have now fallen an additional 5.9 percent. While they have declined three years in a row now, current Iowa farmland values are still more than double what they were 10 years ago, 64 percent higher than the 2009 values and 7 percent higher than the 2011 values. From the landowner s perspective, with land values at the county level dropping 2 to 9 percent across Iowa, landowners could still potentially make money with cash rent payments, which typically account for about 2 to 4 percent of land values. Second, it was widely accepted among farmers and landowners at the start of 2016 that commodity prices, farm income, and profit margin probably wouldn t improve much over the year, and arguably the farmland market has already capitalized these expectations. Therefore, the downward pressures did not cause a panic market reaction. To some extent, this farm downturn, although continuing, is slowing down in its downslide. Over the past few years, the Iowa farmland market first slowed down in the growth rate, from over 20 percent in 2011 and 2012, to merely a 5 percent increase in 2013, and then transitioned to modest losses in 2014 to In addition, the declines over the last three years are all below 10 percent. Third, there are still many positive factors bolstering the farmland market, including favorable interest rates, strong balance sheets, and substantial working capital accumulated from the golden 2000s; and, at least for some producers, rising recreational demand and strong conservation payments from programs like CRP. Put simply, land value is the net present value of all discounted future income flows. With certain assumptions imposed, one could think of land value being net income divided by interest (discount) rate. To understand the changes in land value over time and across space, it is useful to examine how net income and interest rates will change over the next few years. In particular, trends in net income for a particular region will be reflected in the farmland market, which tends to be localized. For example, even for a predominantly agricultural state like Iowa, the primary reason for the drop, or slowdown, in land values is the drop in net farm income, and this is likely to continue. Net farm income has been at record high levels the past few years and interest rates have been at record low levels. This combination produced record high farmland values over the past decade. In August, the USDA forecasted net farm income dropped another 17.2 percent to $66.9 billion in August 2016, which is a direct result of the sharp decline in corn and soybean prices, and this represents the lowest since 2009 in both real and nominal terms. Interest rates are also an important determinant of farmland values. The Federal Reserve Board had long discussed the end of the low-interest era, and likely will finally raise the interest rate in December However, given the uncertainty with the global economy and new presidential administration, the change 7
8 will likely raise the current historically low interest rates to low-yet-favorable levels. Some people feel that interest rates are more important than net income in determining farmland values; putting these arguments aside, the Fed will likely raise interest at a slow rate as opposed to an immediate increase. With the decline in farm income, and a highly probable increase in interest rates, we might see farmland values continue to recede if the forecasts for low commodity prices and the global stock recovery for grains and oilseeds are realized next year and beyond. The Iowa farmland market appears to have peaked for the foreseeable future, and we may expect to see the Iowa farmland market drifting sideways. Commodity prices appear to have moved to a new plateau, and the high-profit-margin era for row crop production has ended. This is a result of over-production on the global scale chasing the phenomenal profits in the late 2000s. It appears prices will stabilize somewhere in the mid- to upper-$3 range for corn and the upper-$8 to lower-$9 range for soybeans. Obviously the prices will move with supply and demand changes; however, based on current futures prices, these appear to be the likely long-term ranges. Unfortunately, current projections show a loss at these prices. Preliminary Iowa State University cost of production estimates for 2017 indicate a 50 cents per bushel loss for corn and possibly break-even for soybean production with average costs and yields. Additionally, the hog, cattle, and dairy producers are embracing low-to-negative margins in the months ahead. A historical analysis of corn and soybean margins seems to suggest that it takes roughly 6 to 8 years to move from the negative-margin eras to positive profits again for the industry. Costs of production, especially rents, have increased considerably over the past several years. Higher commodity prices led to higher incomes, which led to increases in rents. Under low-to-negative profit margins, farmers are trying to lower costs in a variety of ways. Rents will change with income, but they will decline slower as incomes drop. In other words, the rent tends to be sticky when facing downward pressure. How long it will take for rents to adjust to the lower commodity prices remains to be seen. However, until they adjust, profitable production is unlikely and land values will continue to be under downward pressure. Iowa farmers made record income over the past several years, and a major question is what they did with that income. Some farmers appear to have saved it or paid down existing debt, but other farmers appear to have parlayed the income into more debt with additional land, machinery, and buildings, etc. There is a concern for some producers over possible financial difficulties due to continually declining income and accumulation of debt from banks and other sources. It appears most farmers will be able to weather the storm as the market prices find a new equilibrium, but farmers and land owners who bet on the high commodity prices lasting and aggressively expanded or borrowed heavily will face significant problems in the months ahead. Some of the survey respondents reported strong auction sales where existing farmers were aggressively bidding for neighboring properties or some other particularly desirable parcel. These buyers appeared to have the money and to that extent they will provide support for the land market. As the survey indicated, existing farmers still account for the majority of the land purchased in Iowa and they mainly obtained land from estate sales. Farmland sale activities tend to be correlated with changes in land values: with the current farm downturn, landowners tend to continue to hold to land parcels and postpone their land sales, which results in a continuation of less farmland sales. With the continued declined in farm income and profitability, some existing landowners may reconsider retirement and sell their land eventually. However, according to the 2012 Iowa Farmland Ownership and Tenure Survey, half of Iowa s farmland has been held for more than 20 years. As a result, a large influx of farmland supply is not likely, but this potential rise in farmland sale activity and continued decline in farmland values might present opportunities for beginning farmers and ranchers to enter the market. Many people are concerned about a potential farmland bubble burst, or a replay of the 1920s economic depression or even the 1980s farm crisis. There are legitimate reasons to be cautious, especially with the rising uncertainty in agricultural exports and likely rise in interest rates. However, Iowa farmland values 8
9 do not appear to be in a speculative bubble that caused the dramatic declines in the 1980s farmland values or the urban real estate market in the mid-2000s. A comparison between this third golden era and the previous two reveal that farmers accumulated much more income, especially cash, during the most recent decade than what they did in the 1910s and 1970s before the farm crisis: inflation-adjusted net farm income increased by more than 8 percent every year from 2003 to 2013, while the same measure dropped by 3 percent annually due to high inflation. In addition, the agricultural sector was much more leveraged and vulnerable in the 1970 and 1980s compared to nowadays: farmers used to be able to borrow up to 85 percent of inflated, market-based land value in the 1970s, while now they can only get less than half of cash-flow based land values. Finally, the safety net now is much stronger: in the 1980s, the total acres insured in the Federal Crop Insurance program was only 50 million acres for the entire US, and now just corn and soybean acres insured in Iowa almost exceed 25 million acres, representing 93% of all production acres. There wasn t irrational buying and selling in a panic, and the demand for US crop and livestock products is still very strong. The downward pressures on farmland values likely will continue and play out next year and beyond, but it will more than likely be a rational and modest correction as opposed to a sudden change. It is not possible to say where the farmland values will stabilize; however, the odds of commodity prices collapsing, a sudden stoppage of the Chinese economy, interest rates rapidly increasing, and/or land values collapsing are not high. The odds are not zero, but it doesn t appear these events will occur in the foreseeable future. A more likely scenario is that farmland values will return to more normal changes experienced over the past century. Since 1942 nominal and inflation-adjusted Iowa farmland values have averaged a 6.7 percent and 2.7 percent increase per year, respectively. Farmland values have increased 73 percent of the years, decreased 26 percent of the years, and remained unchanged for three years between 1910 and Farmland has historically been a fairly robust investment that generates relatively stable returns, and the Iowa farmland market seems to continue drifting sideways to slightly lower. There are several unique uncertainties worth watching over the next year or two: first, it remains unclear how quickly and by how much the Fed will raise interest rates; second, it is uncertain how the new Secretary of Agriculture and trade agreement renegotiations will affect agricultural exports and farm income; and third, the agricultural sector is closely watching possible policy changes, especially the 2018 Farm Bill discussions, stepped-up basis, and estate tax, as well as conservation. There have been three golden eras for Iowa land values over the past 100 years. The first one ended in a long, drawn-out decline in land values from 1921 to 1933, the second golden era ended with a sudden collapse from 1981 to The third golden era appears to have ended with an orderly adjustment as opposed to a sudden collapse. As opposed to the dramatic collapse of the agricultural sector in the mid- 1980s, we might see this farm downturn resemble the trajectory of the 1920s farm crisis in the sense that there might be a long, drawn-out decline in the farmland market. Iowa State University does not discriminate on the basis of race, color, age, ethnicity, religion, national origin, pregnancy, sexual orientation, gender identity, genetic information, sex, marital status, disability, or status as a U.S. veteran. Inquiries can be directed to the Interim Assistant Director of Equal Opportunity and Compliance, 3280 Beardshear Hall, (515)
10 Table 1. Recent Changes in Iowa Farmland Values Value Dollar Percentage Per Acre Change Change
11 Table 2. Iowa Farmland Values and Percentage Change by District and by Land Quality as of November 2016 Average % High % Medium % Low District Value Change Quality Change Quality Change Quality % Change Northwest $9, % $10, % $8, % $6, % North Central $7, % $8, % $6, % $5, % Northeast $7, % $8, % $6, % $4, % West Central $7, % $8, % $6, % $4, % Central $7, % $9, % $7, % $5, % East Central $7, % $9, % $7, % $5, % Southwest $6, % $7, % $5, % $4, % South Central $4, % $5, % $4, % $2, % Southeast $6, % $9, % $6, % $3, % State Avg. $7, % $8, % $6, % $4, % 11
12 Table 3. Iowa Farmland Values by Crop Reporting Districts and Quality of Land Year State Avg Northwest North Central Northeast West Central All Quality 12 Central East Central Southwest South Central Southeast High Quality Medium Quality Low Quality
13 Table 4. Level of Sales Activity, 2016 More Less Same PERCENT Northwest North Central Northeast West Central Central East Central Southwest South Central Southeast STATE
14 Table 5. Iowa Land Purchases by Buyer Types, 2016 Existing Local Farmers Existing Relocating Farmers New Farmers Investors Other PERCENT Northwest North Central Northeast West Central Central East Central Southwest South Central Southeast STATE Table 6. Iowa Land Purchases by Seller Types, 2016 Active Farmers Retired Farmers Estate Sales Investors Other PERCENT Northwest North Central Northeast West Central Central East Central Southwest South Central Southeast STATE
15 Table 7. Survey Respondents by Mode, 2016 Responses Respondents Paper Online Total Paper Online Total PERCENT Number PERCENT Number Northwest North Central Northeast West Central Central East Central Southwest South Central Southeast STATE Table 8. Survey Respondents by Occupation, 2016 Farm manager Appraiser Ag lender Broker/ Realtor Farmer/ Landowner Government Other PERCENT Northwest North Central Northeast West Central Central East Central Southwest South Central Southeast STATE
16 Table 9. Iowa Farmland Value Predictions for November 2017, 2018, and 2020 Reported Average Land Value Predictions Values as of Nov 2016 Nov 2017 Nov 2018 Nov 2020 Northwest $9,912 $10,085 $9,786 $9,983 North Central $8,089 $7,908 $7,765 $7,966 Northeast $7,582 $7,799 $7,624 $7,704 West Central $7,628 $7,689 $7,501 $8,058 Central $8,156 $8,623 $8,396 $8,593 East Central $7,976 $8,188 $7,943 $8,057 Southwest $6,452 $6,376 $6,189 $6,560 South Central $4,497 $4,958 $4,796 $4,917 Southeast $7,297 $7,470 $7,451 $7,530 STATE $7,700 $7,858 $7,662 $7,877 Table 10. Iowa Cash Crop Price Predictions for November 2017, 2018, and 2020 Cash Corn Prices Cash Soybean Prices Northwest $ 3.34 $ 3.65 $ 3.98 $ 9.25 $ 9.61 $ North Central $ 3.42 $ 3.59 $ 3.93 $ 9.16 $ 9.46 $ Northeast $ 3.41 $ 3.59 $ 3.95 $ 9.19 $ 9.28 $ 9.76 West Central $ 3.34 $ 3.59 $ 4.02 $ 9.12 $ 9.33 $ Central $ 3.36 $ 3.50 $ 3.77 $ 9.17 $ 9.40 $ 9.86 East Central $ 3.42 $ 3.58 $ 3.89 $ 9.26 $ 9.51 $ Southwest $ 3.31 $ 3.56 $ 3.94 $ 9.15 $ 9.42 $ South Central $ 3.36 $ 3.59 $ 3.90 $ 9.51 $ 9.76 $ Southeast $ 3.50 $ 3.83 $ 4.17 $ 9.49 $ 9.59 $ STATE $ 3.38 $ 3.60 $ 3.94 $ 9.24 $ 9.48 $
17 Table 11. Estimated Average CSR2 and Corn Yields by Land Quality, 2016 Reported Average CSR2 High Quality Medium Quality Low Quality Reported Average Corn Yields High Quality Medium Quality Low Quality Northwest North Central Northeast West Central Central East Central Southwest South Central Southeast STATE Table 12. Experience and Service Area by District and Respondent Occupation, 2016 Number of Crop reporting district Years of experience counties served Occupation Years of experience Number of counties served Northwest Farm manager North Central Appraiser Northeast 23 7 Ag lender 24 5 West Central Brokers/Realtor Central Farmer/Landowner 42 2 East Central Government 22 2 Southwest 23 6 Other 32 8 South Central 21 7 Southeast STATE STATE
18 Comparative Iowa Land Values By Crop Reporting District: County Name $/acre $/acre $ change % change District Name $/acre $/acre $ change % change Harrison $ 7,147 $ 7,687 -$ % Northwest $ 9,243 $ 9,685 -$ % Henry $ 6,604 $ 6,903 -$ % North Central $ 7,562 $ 7,962 -$ % Howard $ 6,419 $ 6,857 -$ % Northeast $ 7,313 $ 7,861 -$ % Humboldt $ 8,307 $ 8,827 -$ % West Central $ 7,358 $ 8,061 -$ % Ida $ 8,167 $ 8,840 -$ % Central $ 7,841 $ 8,505 -$ % Iowa $ 7,123 $ 7,572 -$ % East Central $ 7,917 $ 8,506 -$ % Jackson $ 6,624 $ 7,061 -$ % Southwest $ 6,060 $ 6,372 -$ % Jasper $ 7,441 $ 7,867 -$ % South Central $ 4,241 $ 4,397 -$ % Jefferson $ 5,367 $ 5,611 -$ % Southeast $ 6,716 $ 6,892 -$ % Johnson $ 8,636 $ 9,114 -$ % State Average $ 7,183 $ 7,633 -$ % Jones $ 7,296 $ 7,745 -$ % Keokuk $ 6,335 $ 6,682 -$ % By County: Kossuth $ 8,103 $ 8,557 -$ % Lee $ 6,459 $ 6,676 -$ % County Name $/acre $/acre $ change % change Linn $ 8,578 $ 9,093 -$ % Adair $ 5,530 $ 5,851 -$ % Louisa $ 7,393 $ 7,803 -$ % Adams $ 4,758 $ 4,948 -$ % Lucas $ 3,761 $ 3,837 -$ % Allamakee $ 5,211 $ 5,586 -$ % Lyon $ 9,254 $ 9,878 -$ % Appanoose $ 3,609 $ 3,682 -$ % Madison $ 6,050 $ 6,341 -$ % Audubon $ 7,530 $ 8,139 -$ % Mahaska $ 6,610 $ 6,912 -$ % Benton $ 7,922 $ 8,485 -$ % Marion $ 6,490 $ 6,707 -$ % Black Hawk $ 8,599 $ 9,198 -$ % Marshall $ 7,474 $ 7,995 -$ % Boone $ 8,168 $ 8,800 -$ % Mills $ 7,283 $ 7,645 -$ % Bremer $ 8,139 $ 8,692 -$ % Mitchell $ 7,503 $ 7,999 -$ % Buchanan $ 7,913 $ 8,447 -$ % Monona $ 6,463 $ 7,054 -$ % Buena Vista $ 8,996 $ 9,570 -$ % Monroe $ 4,807 $ 4,980 -$ % Butler $ 7,596 $ 8,101 -$ % Montgomery $ 5,937 $ 6,232 -$ % Calhoun $ 8,655 $ 9,282 -$ % Muscatine $ 7,752 $ 8,185 -$ % Carroll $ 8,342 $ 8,949 -$ % O'Brien $ 10,194 $ 10,881 -$ % Cass $ 6,731 $ 7,169 -$ % Osceola $ 8,929 $ 9,531 -$ % Cedar $ 8,278 $ 8,741 -$ % Page $ 5,419 $ 5,688 -$ % Cerro Gordo $ 7,504 $ 7,974 -$ % Palo Alto $ 8,054 $ 8,534 -$ % Cherokee $ 8,577 $ 9,219 -$ % Plymouth $ 9,057 $ 9,804 -$ % Chickasaw $ 7,084 $ 7,567 -$ % Pocahontas $ 8,388 $ 8,905 -$ % Clarke $ 3,991 $ 4,081 -$ % Polk $ 7,520 $ 8,013 -$ % Clay $ 8,482 $ 9,023 -$ % Pottawattamie $ 7,777 $ 8,261 -$ % Clayton $ 6,625 $ 7,102 -$ % Poweshiek $ 7,134 $ 7,581 -$ % Clinton $ 7,225 $ 7,665 -$ % Ringgold $ 4,084 $ 4,211 -$ % Crawford $ 7,784 $ 8,424 -$ % Sac $ 8,858 $ 9,502 -$ % Dallas $ 7,577 $ 8,150 -$ % Scott $ 10,335 $ 10,918 -$ % Davis $ 4,693 $ 4,858 -$ % Shelby $ 7,693 $ 8,288 -$ % Decatur $ 3,443 $ 3,514 -$ % Sioux $ 10,066 $ 10,813 -$ % Delaware $ 8,379 $ 8,954 -$ % Story $ 8,376 $ 9,021 -$ % Des Moines $ 7,145 $ 7,468 -$ % Tama $ 7,455 $ 7,985 -$ % Dickinson $ 8,093 $ 8,638 -$ % Taylor $ 4,315 $ 4,491 -$ % Dubuque $ 7,615 $ 8,152 -$ % Union $ 4,842 $ 4,992 -$ % Emmet $ 8,248 $ 8,772 -$ % Van Buren $ 4,999 $ 5,170 -$ % Fayette $ 7,694 $ 8,233 -$ % Wapello $ 5,384 $ 5,633 -$ % Floyd $ 7,323 $ 7,808 -$ % Warren $ 6,504 $ 6,740 -$ % Franklin $ 7,538 $ 7,993 -$ % Washington $ 8,214 $ 8,664 -$ % Fremont $ 6,422 $ 6,740 -$ % Wayne $ 3,664 $ 3,738 -$ % Greene $ 7,666 $ 8,257 -$ % Webster $ 8,265 $ 8,843 -$ % Grundy $ 8,552 $ 9,183 -$ % Winnebago $ 7,003 $ 7,415 -$ % Guthrie $ 6,773 $ 7,340 -$ % Winneshiek $ 6,592 $ 7,054 -$ % Hamilton $ 8,589 $ 9,193 -$ % Woodbury $ 6,691 $ 7,298 -$ % Hancock $ 7,565 $ 8,011 -$ % Worth $ 6,973 $ 7,409 -$ % Hardin $ 7,883 $ 8,438 -$ % Wright $ 8,395 $ 8,922 -$ % 18
19 19

20 20

21 21
22 22
23 23
24 Iowa Nominal and Inflation-adjusted Farmland Values Land Value ($ per acre) Nominal value Inflation-adjusted value (2015 dollars) Annual Percentage Change in Nominal Iowa Farmland Values % 30.0% Annual Percentage Change (%) 20.0% 10.0% 0.0% -10.0% -20.0% -30.0% -40.0% 24
25 0.7 Iowa Farmland Sale Activity Change More Less Same 0.9 Buyers of Iowa's Farmland Existing Farmers Investors New Farmers Other 25
26 Positive and Negative Factors of Iowa Farmland Market, November 2015 November Positive Factors, 2016 (Percent) Favorable Interest Rates Strong Yields Land Availability (Limited Supply) Strong Demand (Many Buyers) Commodity Prices (Lower) Negative Factors, 2016 (Percent) Input Costs (Higher) Cash Rent Rates (Weak) Livestock Losses Stock Market / Economy/Global 26
Nationally Consistent Data Measures for Cancer Leukemia All Ages
 Nationally Consistent Data Measures for Cancer Leukemia All Ages Leukemia includes a diverse group of cancers that begin in blood cells. Although it is sometimes thought of as a children s disease, leukemia
The cash rental rate information presented in this
 Cash Rental Rates for Iowa Ag Decision Maker 2016 Survey File C2-10 The cash rental rate information presented in this publication is from a survey of farmers, landowners, agricultural lenders, and professional
Medicaid 101 & Iowa Health and Wellness Plan. Lindsay Buechel Communications Manager Bryan Dempsey Provider Services Outreach Supervisor
 Medicaid 101 & Iowa Health and Wellness Plan Lindsay Buechel Communications Manager Bryan Dempsey Provider Services Outreach Supervisor Medicaid Updates 1. New Applications 2. Renewals and Open Enrollment
Region #1 Sexual Abuse Comprehensive Services. Domestic Abuse Comprehensive Services. Shelter-Based Services
 1 2 3 Below are a list of Sexual Abuse Programs that receive funding from the Victim Services Support Program (VSS) through the Iowa Attorney General s Crime Victim Assistance Division (CVAD) for Fiscal
Iowa Health and Wellness Plan. Jennifer Vermeer, Medicaid Director
 Iowa Health and Wellness Plan Jennifer Vermeer, Medicaid Director Background The Iowa Health and Wellness Plan was enacted to provide comprehensive health coverage for low-income adults Began January 1,
Iowa Health and Wellness Plan
 Iowa Health and Wellness Plan Bryan Dempsey Provider Services Outreach Supervisor Iowa Medicaid Enterprise One Plan, Two Options Iowa Wellness Plan For adults age 19-64 Income up to and including 100%
Iowa Health and Wellness Plan National Health Policy Forum March 28, 2014. Michael R. Bousselot, Policy Advisor Office of Gov. Terry Branstad (R-IA)
") Iowa Health and Wellness Plan National Health Policy Forum March 28, 2014 Michael R. Bousselot, Policy Advisor Office of Gov. Terry Branstad (R-IA) Iowa agreement with CMS CMS Approval Approved plan will
Iowa Health and Wellness Plan National Health Policy Forum March 28, 2014 Michael R. Bousselot, Policy Advisor Office of Gov. Terry Branstad (R-IA) Iowa agreement with CMS CMS Approval Approved plan will
Iowa Health and Wellness Plan. Julie Lovelady, Interim Medicaid Director February 3, 2015
 Iowa Health and Wellness Plan Julie Lovelady, Interim Medicaid Director February 3, 2015 One Plan, Two Options Iowa Wellness Plan For adults age 19-64 Income up to and including 100% of the Federal Poverty
CRM for Every Budget
 CRM for Every Budget Cheryl Hodgson University of Iowa Health Care Sara Dykes LionShare The opinions expressed are those of the presenter and do not necessarily state or reflect the views of SHSMD or the
Iowa Legislative Fiscal Bureau. Visitation and Custody Mediation
 Iowa Legislative Fiscal Bureau I S S U E Dennis Prouty State Capitol (515) 281-5279 Des Moines, IA 50319 FAX 281-8451 July 9, 2001 ISSUE Visitation and Custody Mediation This Issue Review will address
Iowa Family Support Credentialed Programs. 1. KIDS program, Emmet County, credentialed May 1, 2009
 Iowa Family Support Credentialed Programs 1. KIDS program, Emmet County, credentialed May 1, 2009 2. Healthy Futures, Story County, credentialed October 19, 2009 3. HOPES-like, Greene County, credentialed
Case Management Program for Frail Elders. Fiscal Year 2008 Activity Report
 Case Management Program for Frail Elders (CMPFE) Fiscal Year 2008 Activity Report Iowa Department of Elder Affairs Jessie Parker Building 510 E. 12 th St. Des Moines, IA 50319 Phone: (515) 725-3333 Fax:
Power of Attorney. Handbook. Iowa Department of Elder Affairs Jessie Parker Building
 Power of Attorney Some information in this booklet is from the Handbook for Older Iowans and the Gift of Peace of Mind Booklets Handbook Iowa Department of Elder Affairs Jessie Parker Building th 510 East
Core Service Domain: Basic Crisis Response
 Iowa s MHDS Regions Mental Health & Disability Services Regional Crisis Services Mental Health Conference October 6, 2015 Julie Jetter, DHS, MHDS Jan Heikes, DHS, MHDS Anne Uetz, Polk County Health Services
Iowa Population Over 100 Years
 Iowa Population Over 100 Years The 2010 Census for Iowa offers a first look at population change over the past decade and century. State and local policy makers can use population trends to better inform
2016 STATE OF SMALL BUSINESS AND ENTREPRENEURSHIP
 2016 STATE OF SMALL BUSINESS AND ENTREPRENEURSHIP About America s SBDC Iowa 13,000 CLIENTS 1,148 BUSINESSES 6,600 JOBS It is a statewide organization that provides no fee, confidential, customized business
Medicare Advantage & Other Health Plans in Iowa 2014
 Medicare Advantage & Other Health Plans in Iowa 2014 SHIIP Iowa Insurance Division Two Ruan Center 601 Locust - 4 th Floor Des Moines, IA 50309-3738 1-800-351-4664 (TTY 1-800-735-2942) www.therightcalliowa.gov
Medicare Advantage & Other Health Plans in Iowa 2016
 Medicare Advantage & Other Health Plans in Iowa 2016 SHIIP Iowa Insurance Division Two Ruan Center 601 Locust - 4 th Floor Des Moines, IA 50309-3738 1-800-351-4664 (TTY 1-800-735-2942) www.therightcalliowa.gov
Medicare Advantage & Other Health Plans in Iowa 2015
 Medicare Advantage & Other Health Plans in Iowa 2015 SHIIP Iowa Insurance Division Two Ruan Center 601 Locust - 4 th Floor Des Moines, IA 50309-3738 1-800-351-4664 (TTY 1-800-735-2942) www.therightcalliowa.gov
THE IMPACT OF BIG-BOX BUILDING MATERIALS STORES ON HOST TOWNS AND SURROUNDING COUNTIES IN A MIDWESTERN STATE
 THE IMPACT OF BIG-BOX BUILDING MATERIALS STORES ON HOST TOWNS AND SURROUNDING COUNTIES IN A MIDWESTERN STATE By Kenneth E. Stone Professor of Economics and Extension Economist And Georgeanne M. Artz Extension
Bankruptcy. Iowa Legal Aid. iowalegalaid.org
 Bankruptcy Iowa Legal Aid iowalegalaid.org IMPORTANT NOTICE: READ THIS INFORMATION BEFORE USING ANY PART OF THIS PUBLICATION This booklet is a general summary of the law. It is not meant to completely
Substance Abuse Problem Gambling Programs Funded by the Iowa Department of Public Health: December, 2015
 The following is a listing of substance abuse problem gambling programs funded by the Iowa Department of Public Health as of, sorted by county and, in the case of multiple offices in the same county, further
ZION Recovery Services 134 S. Court Drive, Greenfield 50849 Call: 641/743-2439
 The following is a listing of substance abuse problem gambling programs funded by the Iowa Department of Public Health as of, sorted by county and, in the case of multiple offices in the same county, further
Rights and Responsibilities
 Rights and Responsibilities of Debtors A Guide to Judgment, Collection and Garnishment Laws in Iowa Iowa Legal Aid iowalegalaid.org IMPORTANT NOTICE: READ THIS INFORMATION BEFORE USING ANY PART OF THIS
Divorce Law in Iowa. and No Lawyer. Iowa Legal Aid. With No Children. iowalegalaid.org. the Court Forms for
 Divorce Law in Iowa With No Children and No Lawyer A Guide to Using the Court Forms for Divorce Without Children Iowa Legal Aid iowalegalaid.org IMPORTANT NOTICE: READ THIS INFORMATION BEFORE USING ANY
Juvenile Court Services Perspective Decategorization (Decat) Projects
 Projects") Juvenile Court Services Perspective Decategorization (Decat) Projects The Decategorization (Decat) Projects began in Iowa in 1987 as a pilot project by the Iowa Legislature in two counties based on the
Juvenile Court Services Perspective Decategorization (Decat) Projects The Decategorization (Decat) Projects began in Iowa in 1987 as a pilot project by the Iowa Legislature in two counties based on the
THE FINANCIAL CRISIS: Is This a REPEAT OF THE 80 S FOR AGRICULTURE? Mike Boehlje and Chris Hurt, Department of Agricultural Economics
 THE FINANCIAL CRISIS: Is This a REPEAT OF THE 80 S FOR AGRICULTURE? Mike Boehlje and Chris Hurt, Department of Agricultural Economics The current financial crisis in the capital markets combined with recession
ADEL, PERRY, WAUKEE AND WEST DES MOINES PAULA NISSEN IOWA WORKFORCE DEVELOPMENT
 ADEL, PERRY, WAUKEE AND WEST DES MOINES PAULA NISSEN IOWA WORKFORCE DEVELOPMENT PURPOSE OF A WORKFORCE ANALYSIS A Workforce analysis is the foundation of any good workforce plan. It involves three distinct
IOWA ADVANCED PRACTICE NURSE TRACKING SYSTEM
 IOWA ADVANCED PRACTICE NURSE TRACKING SYSTEM ADVISORY COMMITTEE MEETING September 0, 0 Iowa Health Professions Tracking Center Office of Statewide Clinical Education Programs Carver College of Medicine
2015 Iowa 4-H Foundation Scholarship Criteria
 Alice Van Wert Murray C. J. Gauger Campbell-Determan Family Career Carol Schneider Colvin Family Den Adel Family Farm s Donald and Ruby Godfrey Family Provided by the endowment established by Alice Van
IOWA ADVANCED PRACTICE NURSE TRACKING SYSTEM
 IOWA ADVANCED PRACTICE NURSE TRACKING SYSTEM ADVISORY COMMITTEE MEETING October, 05 Iowa Health Professions Tracking Center Office of Statewide Clinical Education Programs Carver College of Medicine The
Estimating Cash Rental Rates for Farmland
 Estimating Cash Rental Rates for Farmland Tenant operators farm more than half of the crop land in Iowa. Moreover, nearly 70 percent of the rented crop land is operated under a cash lease. Cash leases
Building Iowa s Child Care Workforce for the 21 st Century
 Building Iowa s Child Care Workforce for the 2 st Century Results of the Center and Family Child Care Provider Wage Study A report prepared for Iowa Workforce Development by Iowa State University Department
How much financing will your farm business
 Twelve Steps to Ag Decision Maker Cash Flow Budgeting File C3-15 How much financing will your farm business require this year? When will money be needed and from where will it come? A little advance planning
Audience Response Cards 2/13/2013. Operating with Today s Land Values. Outline for today: Know how. Know now. Know how. Know now. Know how. Know now.
 Operating with Today s Land Values Prepared by: T. Lemmons & A. Vyhnalek Adapted from: B. Johnson. (2012). Nebraska Farm Real Estate Market Report. UNL Extension Presented by: Allan Vyhnalek 402 563 4901
Higher Education in Iowa
 The Condition of Higher Education in Ensuring College is Accessible, Attainable and Affordable 214 Report prepared by:. 3 EXECUTIVE SUMMARY Ensuring college is accessible,attainable and affordable The
Would you like to know more about the
 Your Net Worth Ag Decision Maker Statement File C3-20 Would you like to know more about the current financial situation of your farming operation? A simple listing of the property you own and the debts
Analysis of Proposed Tax Levies for Library Purposes
 Analysis of Proposed Tax Levies for Library Purposes March 2013 Prepared for the Ohio Library Council by Howard Fleeter & Associates 60 East Broad Street, Suite 350 Columbus, Ohio 43215 I. Overview This
SOURCES AND USES OF FUNDS ON KFMA FARMS
 KANSAS FARM MANAGEMENT ASSOCIATION Your Farm - Your Information - Your Decision N E W S L E T T E R Volume 6, Issue 3 March 2012 SOURCES AND USES OF FUNDS ON KFMA FARMS A flow of funds report, often referred
Iowa County Coordinators List
 Page 1 1 Adair Robert Kempf, Coordinator Adair Co Emerg Mgmt Agcy 200 N 5th Street #10 Business: (641) 332-3030 Fax: (641) 747-3346 Guthrie Center IA 50115- E-Mail Address: agcema@guthriecounty.us 2 Adams
3.3 Real Returns Above Variable Costs
 3.3 Real Returns Above Variable Costs Several factors can impact the returns above variable costs for crop producers. Over a long period of time, sustained increases in the growth rate for purchased inputs
Instructions for Form 8863 Education Credits (American Opportunity, Hope, and Lifetime Learning Credits)
") 2009 Instructions for Form 8863 Education Credits (American Opportunity, Hope, and Lifetime Learning Credits) Department of the Treasury Internal Revenue Service Section references are to the Internal
2009 Instructions for Form 8863 Education Credits (American Opportunity, Hope, and Lifetime Learning Credits) Department of the Treasury Internal Revenue Service Section references are to the Internal
Kentucky ANR Agent Land Value and Cash Rent Survey AEC 2013-16 Greg Halich and Karen Pulliam
 Kentucky ANR Agent Land Value and Cash Rent Survey AEC 2013-16 Greg Halich and Karen Pulliam In the first half of 2013, Agriculture and Natural Resource (ANR) agents were surveyed to estimate land values
Multiple Peril Crop Insurance
 Multiple Peril Crop Insurance Multiple Peril Crop Insurance (MPCI) is a broadbased crop insurance program regulated by the U.S. Department of Agriculture and subsidized by the Federal Crop Insurance Corporation
CHILD CARE CENTERS AND PRESCHOOLS LICENSING STANDARDS AND PROCEDURES
 IOWA DEPARTMENT OF HUMAN SERVICES CHILD CARE CENTERS AND PRESCHOOLS LICENSING STANDARDS AND PROCEDURES DHS: Iowans Working Together Doing What Works Comm. 204 August 2008 WELCOME TO CHILD CARE PROVIDERS
2015 Farm Bank Performance Report Key Findings
 2015 Farm Bank Performance Report Key Findings The banking industry is the nation s most important supplier of credit to agriculture providing nearly 50 percent of all farm loans in the U.S. $170 billion
Vacant Jobs - How Many People Are Currently Vacated?
 WORKFORCE NEEDS ASSESSMENT STATEWIDE Released May 2012 The Iowa Needs Assessment Survey was made possible by funding from the Iowa Legislature. Statewide Table of Contents Pg. Figure 1 Survey Respondents
1. Drivers and their families - planning for change 2. Public transit remaining mobile
 Driving Retirement Planning and making it work If you don t drive, you re in good company. Many people stop driving because of the hassle and expense of auto insurance, vehicle maintenance and gasoline.
Financing Capital Requirements
 Of the independent growers, a typical one produces about four batches of I o thousand birds a year. His capital assets are about as follows: Land, buildings, and equipment, 30 thousand dollars; feed, 4,500
Effectiveness of Increasing Liquidity as a Response to Increased Repayment Risk: A Case Study
 Effectiveness of Increasing Liquidity as a Response to Increased Repayment Risk: A Case Study ABSTRACT Volatile net farm incomes and potential for higher interest rates has strengthened the importance
The Farmland Asset Class
 The Farmland Asset Class December 2010 Jeffrey A. Conrad, CFA President, Hancock Agricultural Investment Group jconrad@hnrg.com (617) 747-1601 Presentation Overview I. Introduction to the Hancock Agricultural
Ethanol Usage Projections & Corn Balance Sheet (mil. bu.)
") Ethanol Usage Projections & Corn Balance Sheet (mil. bu.) Updated 12/21/215 Historic Est. Prelim. Proj. 216-17 Year: (production/marketing) 1/ 211-12 212-13 213-14 214-15 215-16 Low Med. 4 High Yield (bu.
Ethanol Usage Projections & Corn Balance Sheet (mil. bu.) Updated 12/21/215 Historic Est. Prelim. Proj. 216-17 Year: (production/marketing) 1/ 211-12 212-13 213-14 214-15 215-16 Low Med. 4 High Yield (bu.
A Business Newsletter for Agriculture. Vol. 12, No. 1 www.extension.iastate.edu/agdm. Energy agriculture - where s the nitrogen?
 A Business Newsletter for Agriculture Vol. 12, No. 1 www.extension.iastate.edu/agdm November 2007 Energy agriculture - where s the nitrogen? by Don Hofstrand, value-added agriculture specialist, co-director
St. Louis Post- Dispatch
 A Division of Bankrate, Inc. Reach 1,000,000+ Missouri Readers St. Louis Post- Dispatch CD & Deposit Guide CD & Deposit Guide About Bankrate Print Offers flexibility to market your financial products on
Iowa NCRC State Testing Sites
 Iowa NCRC State Testing Sites County Benton Blackhawk Carroll Location Benton County Center 111 W 3rd Street Vinton, IA 52349 Cedar Valley 3420 University Avenue Waterloo, IA 50701 Susie Schlette 319-235-2123
How much did your farm business earn last year?
 Your Farm Ag Decision Maker Income Statement File C3-25 How much did your farm business earn last year? Was it profitabile? There are many ways to answer these questions. A farm income statement (sometimes
Basis The Cash Futures Relationship
 Agricultural Commodity Marketing: Futures, Options, Insurance Basis The Cash Futures Relationship By: Dillon M. Feuz Utah State University Funding and Support Provided by: Fact Sheets Knowing and Managing
To review credit conditions in rural America
 Statement for the Record By the Independent Community Bankers of America Before the House Committee on Agriculture Subcommittee on Operations, Oversight, and Credit Hearing To review credit conditions
Main Street ECONOMIST: ECONOMIST THE THE. Economic information. Financing Young and Beginning Farmers. By Nathan Kauffman, Economist
 THE Main Street ECONOMIST: ECONOMIST Economic information Agricultural for the and Cornhusker Rural Analysis State September 201 0 Federal Reserve Bank of of Kansas City Financing Young and Beginning Farmers
Iowa Driver s License Renewal
 Our goal is to provide the kind of service that encourages drivers to let us help them make safe driving decisions. We don t want people to be afraid when they come into our driver s license stations.
Adecade into the 21st century, Michigan s longbruised
 Michigan League FOR Human Services December 2010 Michigan's Economy Continues to Cause Pain: Communities of Color Take a Harder Hit Adecade into the 21st century, Michigan s longbruised economy continues
I. Business Transfer Strategies
 In many two-generation farming arrangements, the younger party begins by working for a fixed wage. Eventually, however, he or she will want to become an owner/operator not just an employee. Achieving this
Iowa Department of Human Services Offices
 Iowa Department of Human Services Offices Adair County Office Mailing Address 400 Public Square, Greenfield Union County DHS 300 N Pine, Ste. 9 Creston, IA 50801 By appointment only on Tuesdays and Thursdays
Outlook for the 2013 U.S. Farm Economy
 Outlook for the 213 U.S. Farm Economy Kevin Patrick Farm and Rural Business Branch Resource and Rural Economics Division Highlights Net farm income in 213 forecast: $128.2 billion Net cash income in 213
Governor issues proclamations of disaster emergency for June flooding and storms
 Iowa Homeland Security & Emergency Management Volume 10, Issue 6 June 2014 Governor issues proclamations of disaster emergency for June flooding and storms June flooding and severe storms have prompted
Local Option Income Taxes. Indiana s
 On Local Government Local Option Income Taxes and the Property Tax Caps Larry DeBoer Purdue University October 2013 Indiana s Local Option Income Taxes CAGIT: County Adjusted Gross Income Tax (1973) COIT:
U.S. crop program fiscal costs: Revised estimates with updated participation information
 U.S. crop program fiscal costs: Revised estimates with updated participation information June 2015 FAPRI MU Report #02 15 Providing objective analysis for 30 years www.fapri.missouri.edu Published by the
Iowa NCRC State Testing Sites. Benton County Center 111 W 3rd Street Vinton, IA 52349 319-398-7194
 Iowa NCRC State Testing Sites County Benton Blackhawk Carroll Location Kirkwood Community College Benton County Center 111 W 3rd Street Vinton, IA 52349 Cedar Valley IowaWORKS 3420 University Avenue Waterloo,
2013 World Grain Outlook
 2013 World Grain Outlook Presented by: John Roach February 18, 2013 Disclaimer: Futures/options trading involves substantial risk of loss and trading may not be suitable for all investors. You should fully
2015 Risk and Profit Conference Breakout Session Presenters. 12. Managing Risk in Today s Environment
 2015 Risk and Profit Conference Breakout Session Presenters Elizabeth Yeager 12. Managing Risk in Today s Environment Elizabeth Yeager joined the Dept. of Agricultural Economics at Kansas
Research verification coordinators collaborate with Arkansas Division of Agriculture crop specialists to determine a typical production method for
 1 2 3 Research verification coordinators collaborate with Arkansas Division of Agriculture crop specialists to determine a typical production method for application in the crop enterprise budgets. 4 Whole
We have seen in the How
 : Examples Using Hedging, Forward Contracting, Crop Insurance, and Revenue Insurance To what extent can hedging, forward contracting, and crop and revenue insurance reduce uncertainty within the year (intrayear)
FSA can guarantee OLs or FO loans up to $1,392,000 (amount adjusted annually based on inflation).
.") Guaranteed Loan Program Loan Purposes Guaranteed Ownership Loans Guaranteed Farm Ownership (FO) Loans may be made to purchase farmland, construct or repair buildings and other fixtures, develop farmland
Guaranteed Loan Program Loan Purposes Guaranteed Ownership Loans Guaranteed Farm Ownership (FO) Loans may be made to purchase farmland, construct or repair buildings and other fixtures, develop farmland
The financial position and performance of a farm
 Farm Financial Ag Decision Maker Statements File C3-56 The financial position and performance of a farm business can be summarized by four important financial statements. The relationship of these statements
Contents. Acknowledgements... iv. Source of Data...v
 Kentucky Farm Business Management Program Annual Summary Data: Kentucky Grain Farms - 2011 Agricultural Economics Extension No. 2012-17 June 2012 By: Amanda R. Jenkins Michael C. Forsythe University of
but that was then. Today, those in agriculture may find themselves competing against lower-risk businesses for the services of a lender.
 There was a time when lenders knew the financial pressures and capitalization needs of those involved in agriculture. They knew just about every member of the agricultural community by name and probably
PROPERTY TAX REDUCTION DOESN T SAVE FARMLAND AND IS LITTLE HELP TO FARMERS
 Henry George School Research Note #2 November, 1998 PROPERTY TAX REDUCTION DOESN T SAVE FARMLAND AND IS LITTLE HELP TO S Special property tax reductions have been established in apparent hope of making
Impact of Crop Insurance and Indemnity Payments on Cash Rent and Land Values. Michael Langemeier Center for Commercial Agriculture Purdue University
 Impact of Crop Insurance and Indemnity Payments on Cash Rent and Land Values Michael Langemeier Center for Commercial Agriculture Purdue University Background The magnitude of the impact of crop insurance
Farm Financial Management
 Farm Financial Management Your Farm Income Statement How much did your farm business earn last year? There are many ways to answer this question. A farm income statement (sometimes called a profit and
Missouri Soybean Economic Impact Report
 Missouri Soybean Economic Report State Analysis March 2014 The following soybean economic impact values were estimated by Value Ag, LLC, as part of a Missouri Soybean Merchandising Council funded project.
U.S. Fixed Income: Potential Interest Rate Shock Scenario
 U.S. Fixed Income: Potential Interest Rate Shock Scenario Executive Summary Income-oriented investors have become accustomed to an environment of consistently low interest rates. Yields on the benchmark
Average Illinois 2nd Lowest Cost Silver Plans Cost Less Than Projected $312. Chicago Peoria ASPE-Derived Estimates from CBO
 Rate Levels Rates for benchmark plans are more than 25 percent below U.S. Health and Human Services (HHS) estimates based on Congressional Budget Office (CBO) projections $450 $400 $350 Average Illinois
Composition of Farm Household Income and Wealth
 Composition of Farm Household Income and Wealth Today it is rare for any household to receive all of its from a single source. Even when only one household member is employed, it is possible to earn from
2010 Risk and Profit Conference Breakout Session Presenters. 9. Marketing Grain Using a Storage Hedge
 Orlen Grunewald 2010 Risk and Profit Conference Breakout Session Presenters 9. Marketing Grain Using a Storage Hedge Orlen Grunewald is a professor in the Department of Agricultural
Quick Cash Flow Projections
 Quick Cash Flow Projections The Quick Cash Flow Projections tool assists farm operators in projecting cash needs, farm profitability, and debt servicing capabilities. The program also aids users in performing
Iowa Broadband Providers By County June 26, 2015
 COUNTY PROVIDER PROVIDER DOING- BUSINESS-AS NAME TECHNOLOGY WEBSITE MAXIMUM ADVERTISED DOWNLOAD SPEED (Mbps) MAXIMUM ADVERTISED UPLOAD SPEED (Mbps) Adair AT&T Mobility LLC AT&T Mobility LLC Mobile Wireless
AGRICULTURE CREDIT CORPORATION CASH WHEN YOU NEED IT MOST
 AGRICULTURE CREDIT CORPORATION CASH WHEN YOU NEED IT MOST OVERVIEW 1) Observations on Farm Debt in Canada 2) Overview of the APP and Changes 3) Overview of the Commodity Loan Program (CLP) 90000000 Total
MANAGING IN TOUGHER TIMES. Michael Boehlje Center for Food and Agricultural Business Purdue University
 MANAGING IN TOUGHER TIMES Michael Boehlje Center for Food and Agricultural Business Purdue University Vulnerabilities to Continued Prosperity Increased supplies from productivity and acreage increases
Understanding and Using Basis - Grains
 Understanding and Using Basis - Grains By: E. Dean Baldwin Reviewers: John Ferris and David Holder Edited by Duane Griffith and Stephen Koontz 1 Basis is defined as the amount in cents per bushel a specified
CORN IS GROWN ON MORE ACRES OF IOWA LAND THAN ANY OTHER CROP.
 CORN IS GROWN ON MORE ACRES OF IOWA LAND THAN ANY OTHER CROP. Planted acreage reached a high in 1981 with 14.4 million acres planted for all purposes and has hovered near 12.5 million acres since the early
Low Income Weatherization
 September 2013 CUBFacts Low Income Weatherization LOW INCOME WEATHERIZATION PROGRAMS Illinois Home Weatherization Assistance Program (IHWAP) If you meet certain low-income requirements, you may be eligible
Iowa s Beginning Farmer Loan and Tax Credit Programs. Iowa Agricultural Development Division
 Iowa s Beginning Farmer Loan and Tax Credit Programs Iowa Agricultural Development Division 1 IADD Programs Beginning Farmer Loan Program (BFLP) Loan Participation Program (LPP) Beginning Farmer Tax Credit
MARKETING AND POLICY BRIEFING PAPER
 MARKETING AND POLICY BRIEFING PAPER Department of Agricultural and Applied Economics, College of Agricultural and Life Sciences, University of Wisconsin-Madison Cooperative Extension, University of Wisconsin-Extension
Working Capital: The Key in Volatile Times By Dr. David M. Kohl
 Working Capital: The Key in Volatile Times By Dr. David M. Kohl 02/28/13 My memories take me back to Super Bowl Sunday in 1989 in St. Louis next to the old Busch Stadium for the first meeting of the Farm
Agricultural Commodity Marketing: Futures, Options, Insurance
 Agricultural Commodity Marketing: Futures, Options, Insurance By: Dillon M. Feuz Utah State University Funding and Support Provided by: On-Line Workshop Outline A series of 12 lectures with slides Accompanying
Your Community. Your Credit Union.
 Your Community. Your Credit Union. Membership Winner Corridor Business Journal Best Credit Union Winner Des Moines Register Top Workplace Winner Callahan & Associates #1 Nationally for Total Return to
Project LINK Meeting New York, 20-22 October 2010. Country Report: Australia
 Project LINK Meeting New York, - October 1 Country Report: Australia Prepared by Peter Brain: National Institute of Economic and Industry Research, and Duncan Ironmonger: Department of Economics, University
MANAGING YOUR FARM S FINANCIAL RISK
 chapter seven MANAGING YOUR FARM S FINANCIAL RISK Gayle Willett 2 3 4 4 10 11 13 15 18 20 21 Table of Contents Instructor Guidelines Introduction Financial Risk: Definition and Sources Managing Financial
Same Day Registration in Iowa and North Carolina
 Dēmos.org Small Investments, High Yields: A Cost Study of Same Day Registration in Iowa and North Carolina Laura Rokoff, Emma Stokking February 2012 Same Day Registration Nine states (Idaho, Iowa, Maine,
Managing Feed and Milk Price Risk: Futures Markets and Insurance Alternatives
 Managing Feed and Milk Price Risk: Futures Markets and Insurance Alternatives Dillon M. Feuz Department of Applied Economics Utah State University 3530 Old Main Hill Logan, UT 84322-3530 435-797-2296 dillon.feuz@usu.edu