Should the voting age be lowered to 16? Example using the Citizenship Survey,
|
|
|
- Abigail Kelley
- 7 years ago
- Views:
Transcription

1 Should the voting age be lowered to 16? Example using the Citizenship Survey, Open IBM SPSS 20 and open the data file. Do this by going to: File> Open > Data from SPSS once it is open and selecting the correct dataset. The data is called q2eda.sav. It is a cut-down version of the full Citizenship Survey and contains the following variables. They can be viewed in more detail by clicking on the Variable View window at the bottom left of the SPSS screen. 1
 PAffLoc Can you influence decisions affecting local area 4) PInfl How important is it for you personally to feel that you can influence decisions in your local area?")
2 Frequency Tables Our four main outcome variables of interest for this task are: 1) EResp07 Responsibilities of everyone in the UK - To vote 2) EShoul04 Rights you SHOULD have - To have free elections 3) PAffLoc Can you influence decisions affecting local area 4) PInfl How important is it for you personally to feel that you can influence decisions in your local area? And our main exploratory variable of interest is of course age. These are all questions about Civic Engagement and are relevant to our research question to assess whether 16 and 17 year olds have different views to 18 and 19 year olds who do have a right to vote. To assess these variables overall, firstly frequency tables should be run on them. This can be done by clicking Analyse > hovering over Descriptive Statistics and then clicking Frequencies 2

3 Once you have clicked Frequencies this box will appear:- Select the variable you wish to run a frequency table on and click the arrow in the middle of the box to push it across into the box on the right. Click OK. 3
4 The frequency table will appear in the Output window as follows. Continue for each of the four outcome variables of interest. Look at the tables in the output window once they have been run and look at the overall patterns for each variable. Perhaps write a couple of sentences interpreting each frequency table. 4
 but before you click OK, click on the Charts button, select Histogram of the")
 and then Continue. Then click OK.")
5 Graphs To produce a histogram or bar chart for a single variable in SPSS just follow the same process as for a frequency table (above) but before you click OK, click on the Charts button, select Histogram of the variable is continuous (such as Age) or Bar Chart if the data is categorical (such as our outcome variables of interest) and then Continue. Then click OK. To begin with run a histogram on the xrage (age) variable. 5
6 In the output window you will get a frequency table (which will be very long for the continuous Age variable!) and also a histogram: It can be seen from the histogram that the age variable here is reasonably normally distributed and there are no problems with missing data. Now do bar charts of all of the outcome variables of interest to assess visually how they are distributed. Remember: Analyse>Descriptive Statistics>Frequencies>Charts>Bar Chart 6

7 Weights Data producers calculate weights to make the data better represent the population it is designed to represent. A weighting variable assigns a value to each case in the dataset to indicate how much they should be represented in the analysis. To add weights click on the little scales icon at the top of the screen:- When the Weight Cases box appears, click on Weight cases by and then select the Weighting variable, here called WtFInds. Click OK. You will be able to tell easily if the weights are on as it should now say Weights On at the bottom right of the SPSS screen. 7

8 Now, re-run all the frequency tables for our four outcome variables of interest. How have the weights affected the results in the tables? This is a good way of demonstrating the importance of weighting the data. Recoding To assess whether under 18 s should be given the right to vote, firstly we need to separate the data for under 18 s. This can then be compared to the data for 18 and 19 year olds to see if there is a difference in the Civic Engagement variables between the two age groups. You can recode data (that is, create new categories from an existing variable and save it as a new variable with the new, more workable or relevant categories) by clicking on Transform and then Recode into Different Variables :- 8

9 A Recode into Different Variables box will appear:- Find the xrage variable from the list of variables and click on the arrow in the middle of the box so that it appears in the big white box in the middle. Where it says Output Variable on the left, type in what you want the new age variable to be called. Choose something such as AgeRecode so it will be obvious what the new variable is. Type it into both the Name and the Label box (with no spaces in the Name box) then press Change. Then press the Old and New Values box. 9
10 A Recode into Different Variables: Old and New Values box will appear: As we wish to compare 16 and 16 year olds to 18 and 19 year olds, we need a category which is just 16 and 17 year olds, just 18 and 19 year olds and then everyone else. This can be done by clicking on Range on the left hand side of the Recode box and then adding 16 through 17 (see above in the screen cap). On the New Value right hand side of the screen where it says Value type a 1 into the box, then click Add. This will create a new category (category 1 until re-labelled) just for 16 and 17 year olds. Repeat this but put 18 through 19 into the Range on the left hand side and a 2 into the Value box on the right and then click Add again. Finally to put everyone else into a separate category click in the Range, value through HIGHEST (see arrow, above) button and put 20 into that box and then on the right hand side under New Value put a 3 and then click Add. This creates a new category (Category 3 ) or everyone above 20. I.e. everyone from 20 to the HIGHEST age in the dataset. 10

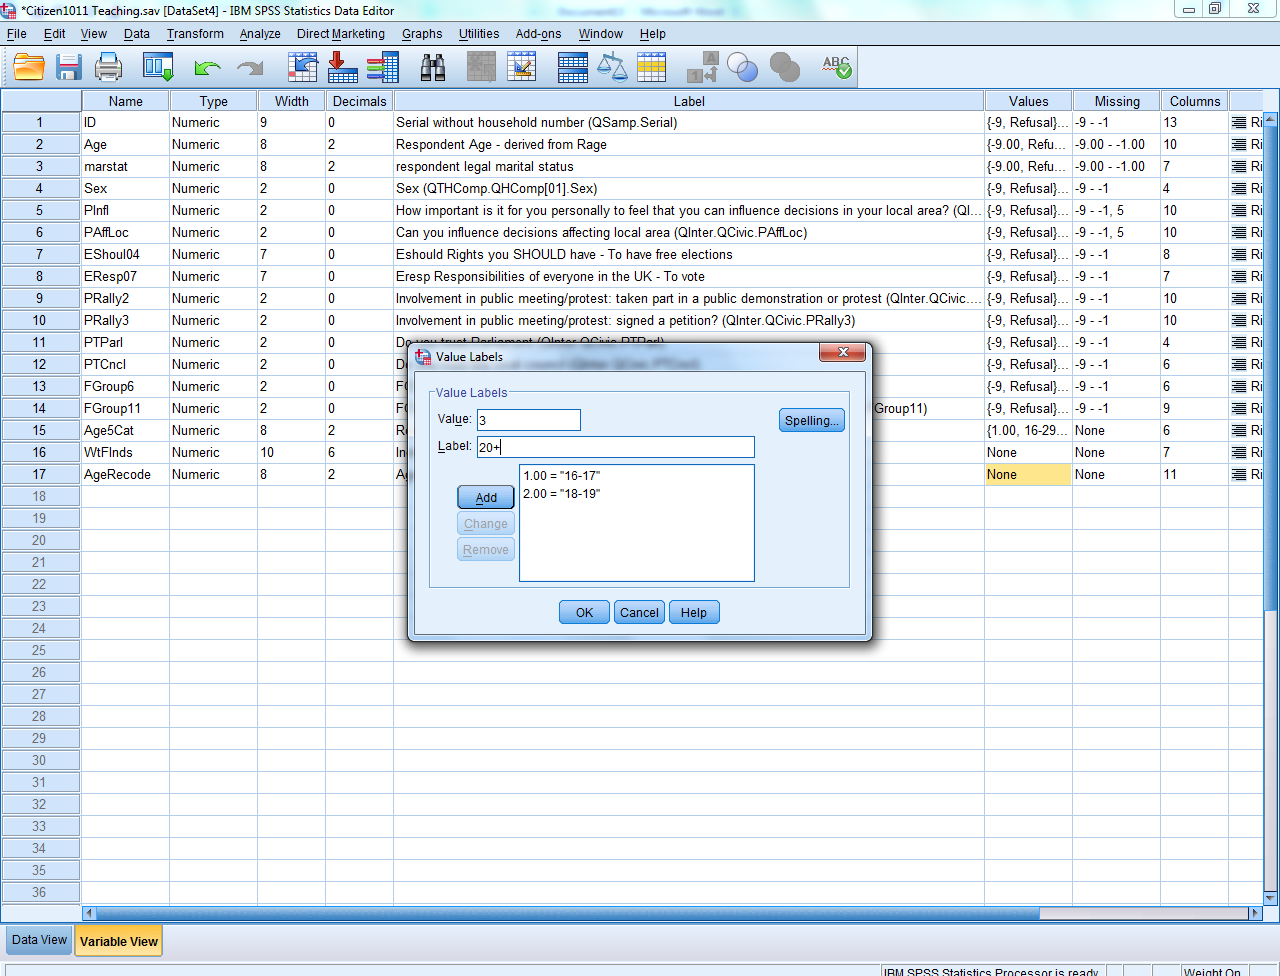
11 When you have done this the Old>New box should have the following in it:- Click Continue. Then go into the variable view of SPSS and you will see the new variable at the bottom. When you have checked it is there, click in the little blue box in the values column for the new variable:- 11
12 When you click on the little blue box a Value Labels box will appear. Add in the labels from the re-code. There were 1= 16-17, 2= and 3= 20+. Add the 1 into the value box and the label (16-17 etc.) into label box and click add, until all the labels are added. Then click OK. 12
13 13

14 Once this new variable has been created we can run a frequency on it to check the recode worked:- We can see that there are no missing values and the categories are what we would expect, so the re-code was successful. 14

15 Cross-tabulations Now we have our new Age variable, we can run cross-tabulations on our four outcome variables of interest by the new Age variable to see whether there is any difference in views towards Civic Engagement between 16 and 17 year olds and 18 and 19 year olds. This can be done by again clicking on Analyse > Descriptive Statistics > and the clicking Cross-tabulations. This box will appear:- Select one of our four outcome variables of interest from the box on the left and click the top arrow to push it across into the Row(s) box. Then select our recoded age variable and push it across into the Column(s) box. Before you click OK, however, click on the button on the right-hand side of the box. 15

16 Where it says Percentages click the little box next to Column. Then click Continue and then OK. 16

17 The output from your Crosstab analysis will be in your Output screen. What are does the crosstab analysis tell us? How would we interpret this? Now run cross-tabulations for each of the other outcome variables of interest by our recoded Age variable. Are there large differences in attitudes to Civic Engagement between years olds and year olds? Are there differences for some forms of Civic Engagement and not others? What are the arguments for and against lowering the voting age based on the evidence here? If you have time, you can produce other analyses using the other variables in the dataset. Perhaps you would like to look at political engagement by gender? Or look at how many people trust Parliament? Produce some bar charts and tables. 17
Directions for Frequency Tables, Histograms, and Frequency Bar Charts
 Directions for Frequency Tables, Histograms, and Frequency Bar Charts Frequency Distribution Quantitative Ungrouped Data Dataset: Frequency_Distributions_Graphs-Quantitative.sav 1. Open the dataset containing
Q1. Where else, other than your home, do you use the internet? (Check all that apply). Library School Workplace Internet on a cell phone Other
. Library School Workplace Internet on a cell phone Other") Exploring Check-All Questions: Frequencies, Multiple Response, and Aggregation Target Software & Version: SPSS v19 Last Updated on May 4, 2012 Created by Laura Atkins Sometimes several responses or measurements
Exploring Check-All Questions: Frequencies, Multiple Response, and Aggregation Target Software & Version: SPSS v19 Last Updated on May 4, 2012 Created by Laura Atkins Sometimes several responses or measurements
How to Use a Data Spreadsheet: Excel
 How to Use a Data Spreadsheet: Excel One does not necessarily have special statistical software to perform statistical analyses. Microsoft Office Excel can be used to run statistical procedures. Although
PURPOSE OF GRAPHS YOU ARE ABOUT TO BUILD. To explore for a relationship between the categories of two discrete variables
 3 Stacked Bar Graph PURPOSE OF GRAPHS YOU ARE ABOUT TO BUILD To explore for a relationship between the categories of two discrete variables 3.1 Introduction to the Stacked Bar Graph «As with the simple
Excel Charts & Graphs
 MAX 201 Spring 2008 Assignment #6: Charts & Graphs; Modifying Data Due at the beginning of class on March 18 th Introduction This assignment introduces the charting and graphing capabilities of SPSS and
RIFIS Ad Hoc Reports
 RIFIS Ad Hoc Reports To retrieve the entire list of all Ad Hoc Reports, including the Base reports and any additional reports published to your Role, select Ad Hoc for the Type under Filter Report By and
SPSS (Statistical Package for the Social Sciences)
") SPSS (Statistical Package for the Social Sciences) What is SPSS? SPSS stands for Statistical Package for the Social Sciences The SPSS home-page is: www.spss.com 2 What can you do with SPSS? Run Frequencies
SPSS (Statistical Package for the Social Sciences) What is SPSS? SPSS stands for Statistical Package for the Social Sciences The SPSS home-page is: www.spss.com 2 What can you do with SPSS? Run Frequencies
SPSS The Basics. Jennifer Thach RHS Assessment Office March 3 rd, 2014
 SPSS The Basics Jennifer Thach RHS Assessment Office March 3 rd, 2014 Why use SPSS? - Used heavily in the Social Science & Business world - Ability to perform basic to high-level statistical analysis (i.e.
4. Are you satisfied with the outcome? Why or why not? Offer a solution and make a new graph (Figure 2).
.") Assignment 1 Introduction to Excel and SPSS Graphing and Data Manipulation Part 1 Graphing (worksheet 1) 1. Download the BHM excel data file from the course website. 2. Save it to the desktop as an excel
Assignment 1 Introduction to Excel and SPSS Graphing and Data Manipulation Part 1 Graphing (worksheet 1) 1. Download the BHM excel data file from the course website. 2. Save it to the desktop as an excel
IBM SPSS Statistics 20 Part 1: Descriptive Statistics
 CALIFORNIA STATE UNIVERSITY, LOS ANGELES INFORMATION TECHNOLOGY SERVICES IBM SPSS Statistics 20 Part 1: Descriptive Statistics Summer 2013, Version 2.0 Table of Contents Introduction...2 Downloading the
SPSS: Getting Started. For Windows
 For Windows Updated: August 2012 Table of Contents Section 1: Overview... 3 1.1 Introduction to SPSS Tutorials... 3 1.2 Introduction to SPSS... 3 1.3 Overview of SPSS for Windows... 3 Section 2: Entering
IBM SPSS Statistics for Beginners for Windows
 ISS, NEWCASTLE UNIVERSITY IBM SPSS Statistics for Beginners for Windows A Training Manual for Beginners Dr. S. T. Kometa A Training Manual for Beginners Contents 1 Aims and Objectives... 3 1.1 Learning
How To Use Spss
 1: Introduction to SPSS Objectives Learn about SPSS Open SPSS Review the layout of SPSS Become familiar with Menus and Icons Exit SPSS What is SPSS? SPSS is a Windows based program that can be used to
Chapter 2: Descriptive Statistics
 Chapter 2: Descriptive Statistics **This chapter corresponds to chapters 2 ( Means to an End ) and 3 ( Vive la Difference ) of your book. What it is: Descriptive statistics are values that describe the
SPSS Basic Skills Test
 SPSS Basic Skills Test (This document is available at http://www.psy.mq.edu.au/psystat/skillstest ) The following is a test of your ability to carry out a few basic procedures in SPSS. Everything that
SPSS for Simple Analysis
 STC: SPSS for Simple Analysis1 SPSS for Simple Analysis STC: SPSS for Simple Analysis2 Background Information IBM SPSS Statistics is a software package used for statistical analysis, data management, and
Computer Skills Microsoft Excel Creating Pie & Column Charts
 Computer Skills Microsoft Excel Creating Pie & Column Charts In this exercise, we will learn how to display data using a pie chart and a column chart, color-code the charts, and label the charts. Part
Statistical Analysis Using SPSS for Windows Getting Started (Ver. 2014/11/6) The numbers of figures in the SPSS_screenshot.pptx are shown in red.
 The numbers of figures in the SPSS_screenshot.pptx are shown in red.") Statistical Analysis Using SPSS for Windows Getting Started (Ver. 2014/11/6) The numbers of figures in the SPSS_screenshot.pptx are shown in red. 1. How to display English messages from IBM SPSS Statistics
Statistical Analysis Using SPSS for Windows Getting Started (Ver. 2014/11/6) The numbers of figures in the SPSS_screenshot.pptx are shown in red. 1. How to display English messages from IBM SPSS Statistics
4. Descriptive Statistics: Measures of Variability and Central Tendency
 4. Descriptive Statistics: Measures of Variability and Central Tendency Objectives Calculate descriptive for continuous and categorical data Edit output tables Although measures of central tendency and
An introduction to IBM SPSS Statistics
 An introduction to IBM SPSS Statistics Contents 1 Introduction... 1 2 Entering your data... 2 3 Preparing your data for analysis... 10 4 Exploring your data: univariate analysis... 14 5 Generating descriptive
The Chi-Square Test. STAT E-50 Introduction to Statistics
 STAT -50 Introduction to Statistics The Chi-Square Test The Chi-square test is a nonparametric test that is used to compare experimental results with theoretical models. That is, we will be comparing observed
Using SPSS, Chapter 2: Descriptive Statistics
 1 Using SPSS, Chapter 2: Descriptive Statistics Chapters 2.1 & 2.2 Descriptive Statistics 2 Mean, Standard Deviation, Variance, Range, Minimum, Maximum 2 Mean, Median, Mode, Standard Deviation, Variance,
Getting Started With SPSS
 Getting Started With SPSS To investigate the research questions posed in each section of this site, we ll be using SPSS, an IBM computer software package specifically designed for use in the social sciences.
In This Issue: Excel Sorting with Text and Numbers
 In This Issue: Sorting with Text and Numbers Microsoft allows you to manipulate the data you have in your spreadsheet by using the sort and filter feature. Sorting is performed on a list that contains
Gestation Period as a function of Lifespan
 This document will show a number of tricks that can be done in Minitab to make attractive graphs. We work first with the file X:\SOR\24\M\ANIMALS.MTP. This first picture was obtained through Graph Plot.
Analysis of categorical data: Course quiz instructions for SPSS
 Analysis of categorical data: Course quiz instructions for SPSS The dataset Please download the Online sales dataset from the Download pod in the Course quiz resources screen. The filename is smr_bus_acd_clo_quiz_online_250.xls.
Chapter 1 Introduction
 Chapter 1 Introduction I. Introduction to the UTC Psychology Department Computer Lab A. Computers The Psychology Department Computer Lab holds 24 computers. Most of the computers, along with other equipment
SPSS Tutorial, Feb. 7, 2003 Prof. Scott Allard
 p. 1 SPSS Tutorial, Feb. 7, 2003 Prof. Scott Allard The following tutorial is a guide to some basic procedures in SPSS that will be useful as you complete your data assignments for PPA 722. The purpose
SPSS and AM statistical software example.
 A detailed example of statistical analysis using the NELS:88 data file and ECB, to perform a longitudinal analysis of 1988 8 th graders in the year 2000: SPSS and AM statistical software example. Overall
Projects Involving Statistics (& SPSS)
") Projects Involving Statistics (& SPSS) Academic Skills Advice Starting a project which involves using statistics can feel confusing as there seems to be many different things you can do (charts, graphs,
Projects Involving Statistics (& SPSS) Academic Skills Advice Starting a project which involves using statistics can feel confusing as there seems to be many different things you can do (charts, graphs,
S P S S Statistical Package for the Social Sciences
 S P S S Statistical Package for the Social Sciences Data Entry Data Management Basic Descriptive Statistics Jamie Lynn Marincic Leanne Hicks Survey, Statistics, and Psychometrics Core Facility (SSP) July
Instructions for applying data validation(s) to data fields in Microsoft Excel
 to data fields in Microsoft Excel") 1 of 10 Instructions for applying data validation(s) to data fields in Microsoft Excel According to Microsoft Excel, a data validation is used to control the type of data or the values that users enter
1 of 10 Instructions for applying data validation(s) to data fields in Microsoft Excel According to Microsoft Excel, a data validation is used to control the type of data or the values that users enter
SPSS Workbook 1 Data Entry : Questionnaire Data
 TEESSIDE UNIVERSITY SCHOOL OF HEALTH & SOCIAL CARE SPSS Workbook 1 Data Entry : Questionnaire Data Prepared by: Sylvia Storey s.storey@tees.ac.uk SPSS data entry 1 This workbook is designed to introduce
Psychology 2040 Laboratory 1 Introduction
 Psychology 2040 Laboratory 1 Introduction I. Introduction to the Psychology Department Computer Lab A. Computers The Psychology Department Computer Lab holds 24 computers. Most of the computers, along
Instructions for creating a data entry form in Microsoft Excel
 1 of 5 You have several options when you want to enter data manually in Excel. You can enter data in one cell, in several cells at the same time, or on more than one worksheet (worksheet/spreadsheet: The
Data exploration with Microsoft Excel: analysing more than one variable
 Data exploration with Microsoft Excel: analysing more than one variable Contents 1 Introduction... 1 2 Comparing different groups or different variables... 2 3 Exploring the association between categorical
[COGNOS DATA TRAINING FAQS] This is a list of frequently asked questions for a Cognos user
![[COGNOS DATA TRAINING FAQS] This is a list of frequently asked questions for a Cognos user](/thumbs/26/7479572.jpg "[COGNOS DATA TRAINING FAQS] This is a list of frequently asked questions for a Cognos user") 2010 [COGNOS DATA TRAINING FAQS] This is a list of frequently asked questions for a Cognos user Table of Contents 1. How do I run my report in a different format?... 1 2. How do I copy a report to My Folder?...
2010 [COGNOS DATA TRAINING FAQS] This is a list of frequently asked questions for a Cognos user Table of Contents 1. How do I run my report in a different format?... 1 2. How do I copy a report to My Folder?...
Chapter 4 Displaying and Describing Categorical Data
 Chapter 4 Displaying and Describing Categorical Data Chapter Goals Learning Objectives This chapter presents three basic techniques for summarizing categorical data. After completing this chapter you should
SPSS Manual for Introductory Applied Statistics: A Variable Approach
 SPSS Manual for Introductory Applied Statistics: A Variable Approach John Gabrosek Department of Statistics Grand Valley State University Allendale, MI USA August 2013 2 Copyright 2013 John Gabrosek. All
An Introduction to SPSS. Workshop Session conducted by: Dr. Cyndi Garvan Grace-Anne Jackman
 An Introduction to SPSS Workshop Session conducted by: Dr. Cyndi Garvan Grace-Anne Jackman Topics to be Covered Starting and Entering SPSS Main Features of SPSS Entering and Saving Data in SPSS Importing
Mixed 2 x 3 ANOVA. Notes
 Mixed 2 x 3 ANOVA This section explains how to perform an ANOVA when one of the variables takes the form of repeated measures and the other variable is between-subjects that is, independent groups of participants
1. Go to your programs menu and click on Microsoft Excel.
 Elementary Statistics Computer Assignment 1 Using Microsoft EXCEL 2003, follow the steps below. For Microsoft EXCEL 2007 instructions, go to the next page. For Microsoft 2010 and 2007 instructions with
Drawing a histogram using Excel
 Drawing a histogram using Excel STEP 1: Examine the data to decide how many class intervals you need and what the class boundaries should be. (In an assignment you may be told what class boundaries to
The Big Picture. Describing Data: Categorical and Quantitative Variables Population. Descriptive Statistics. Community Coalitions (n = 175)
") Describing Data: Categorical and Quantitative Variables Population The Big Picture Sampling Statistical Inference Sample Exploratory Data Analysis Descriptive Statistics In order to make sense of data,
Describing Data: Categorical and Quantitative Variables Population The Big Picture Sampling Statistical Inference Sample Exploratory Data Analysis Descriptive Statistics In order to make sense of data,
Word 2010: Mail Merge to Email with Attachments
 Word 2010: Mail Merge to Email with Attachments Table of Contents TO SEE THE SECTION FOR MACROS, YOU MUST TURN ON THE DEVELOPER TAB:... 2 SET REFERENCE IN VISUAL BASIC:... 2 CREATE THE MACRO TO USE WITHIN
STC: Descriptive Statistics in Excel 2013. Running Descriptive and Correlational Analysis in Excel 2013
 Running Descriptive and Correlational Analysis in Excel 2013 Tips for coding a survey Use short phrases for your data table headers to keep your worksheet neat, you can always edit the labels in tables
Introduction to PASW Statistics 34152-001
 Introduction to PASW Statistics 34152-001 V18 02/2010 nm/jdr/mr For more information about SPSS Inc., an IBM Company software products, please visit our Web site at http://www.spss.com or contact: SPSS
Doing Multiple Regression with SPSS. In this case, we are interested in the Analyze options so we choose that menu. If gives us a number of choices:
 Doing Multiple Regression with SPSS Multiple Regression for Data Already in Data Editor Next we want to specify a multiple regression analysis for these data. The menu bar for SPSS offers several options:
WHO STEPS Surveillance Support Materials. STEPS Epi Info Training Guide
 STEPS Epi Info Training Guide Department of Chronic Diseases and Health Promotion World Health Organization 20 Avenue Appia, 1211 Geneva 27, Switzerland For further information: www.who.int/chp/steps WHO
This activity will show you how to draw graphs of algebraic functions in Excel.
 This activity will show you how to draw graphs of algebraic functions in Excel. Open a new Excel workbook. This is Excel in Office 2007. You may not have used this version before but it is very much the
If there is not a Data Analysis option under the DATA menu, you will need to install the Data Analysis ToolPak as an add-in for Microsoft Excel.
 If there is not a Data Analysis option under the DATA menu, you will need to install the Data Analysis ToolPak as an add-in for Microsoft Excel. 1. Click on the FILE tab and then select Options from the
Working With Direct Deposit Accounts and Your Payment Elections
 Working With Direct Deposit Accounts and This document contains instructions in the following areas for working with your direct deposit accounts and payment elections: Overview Working with Your Direct
Business Analytics Enhancements June 2013
 Business Analytics Enhancements June 03 Enhancement Summary June 03 Item # Site Location Enhancement Welcome Page New style - Fonts and colors have changed as a result of the enhanced reporting engine
Scatter Plots with Error Bars
 Chapter 165 Scatter Plots with Error Bars Introduction The procedure extends the capability of the basic scatter plot by allowing you to plot the variability in Y and X corresponding to each point. Each
Chapter 13. Chi-Square. Crosstabs and Nonparametric Tests. Specifically, we demonstrate procedures for running two separate
 1 Chapter 13 Chi-Square This section covers the steps for running and interpreting chi-square analyses using the SPSS Crosstabs and Nonparametric Tests. Specifically, we demonstrate procedures for running
Selecting a Sub-set of Cases in SPSS: The Select Cases Command
 Selecting a Sub-set of Cases in SPSS: The Select Cases Command When analyzing a data file in SPSS, all cases with valid values for the relevant variable(s) are used. If I opened the 1991 U.S. General Social
Can SAS Enterprise Guide do all of that, with no programming required? Yes, it can.
 SAS Enterprise Guide for Educational Researchers: Data Import to Publication without Programming AnnMaria De Mars, University of Southern California, Los Angeles, CA ABSTRACT In this workshop, participants
January 26, 2009 The Faculty Center for Teaching and Learning
 THE BASICS OF DATA MANAGEMENT AND ANALYSIS A USER GUIDE January 26, 2009 The Faculty Center for Teaching and Learning THE BASICS OF DATA MANAGEMENT AND ANALYSIS Table of Contents Table of Contents... i
An introduction to using Microsoft Excel for quantitative data analysis
 Contents An introduction to using Microsoft Excel for quantitative data analysis 1 Introduction... 1 2 Why use Excel?... 2 3 Quantitative data analysis tools in Excel... 3 4 Entering your data... 6 5 Preparing
SPSS Explore procedure
 SPSS Explore procedure One useful function in SPSS is the Explore procedure, which will produce histograms, boxplots, stem-and-leaf plots and extensive descriptive statistics. To run the Explore procedure,
SPSS Introduction. Yi Li
 SPSS Introduction Yi Li Note: The report is based on the websites below http://glimo.vub.ac.be/downloads/eng_spss_basic.pdf http://academic.udayton.edu/gregelvers/psy216/spss http://www.nursing.ucdenver.edu/pdf/factoranalysishowto.pdf
R and Rcmdr : Basic Functions for Managing Data
 Jaila Page 1 R and Rcmdr : Basic Functions for Managing Data Key issues in using R for a data analysis: Difference between numeric variables and factors in R/Rcmdr Load data either by entering manually,
Budgeting in QuickBooks
 Budgeting in QuickBooks Using a budget to plan the expenditure of wing funds helps the wing identify needs along with the ability to analyze the resources necessary to meet those needs. As with any plan,
Directions for using SPSS
 Directions for using SPSS Table of Contents Connecting and Working with Files 1. Accessing SPSS... 2 2. Transferring Files to N:\drive or your computer... 3 3. Importing Data from Another File Format...
Briefing document: How to create a Gantt chart using a spreadsheet
 Briefing document: How to create a Gantt chart using a spreadsheet A Gantt chart is a popular way of using a bar-type chart to show the schedule for a project. It is named after Henry Gantt who created
MicroStrategy Desktop
 MicroStrategy Desktop Quick Start Guide MicroStrategy Desktop is designed to enable business professionals like you to explore data, simply and without needing direct support from IT. 1 Import data from
Describing, Exploring, and Comparing Data
 24 Chapter 2. Describing, Exploring, and Comparing Data Chapter 2. Describing, Exploring, and Comparing Data There are many tools used in Statistics to visualize, summarize, and describe data. This chapter
To create a histogram, you must organize the data in two columns on the worksheet. These columns must contain the following data:
 You can analyze your data and display it in a histogram (a column chart that displays frequency data) by using the Histogram tool of the Analysis ToolPak. This data analysis add-in is available when you
How to Login Username Password:
 How to Login After navigating to the SelecTrucks ATTS Call Tracking & Support Site: www.selectrucksatts.com Select Corporate Link to login for Corporate owned Centers/Locations. Username: Your Email Address
"Excel with Excel 2013: Pivoting with Pivot Tables" by Venu Gopalakrishna Remani. October 28, 2014
 Teaching Excellence and Innovation 1 Pivot table Pivot table does calculations with criteria Data should be arranged as : Field names in the first rows, records in rows No blank rows or blank columns should
WHAT S NEW IN MS EXCEL 2013
 Contents Excel... 1 Filling empty cells using Flash Fill... 1 Filtering records using a Timeline... 2 Previewing with Quick Analysis... 4 Using Chart Advisor recommendations... 5 Finding errors and issues
1.5 MONITOR FOR FMS 6 USER GUIDE
 1.5 MONITOR FOR FMS 6 USER GUIDE 38 Introduction Monitor for FMS6 V1.2 is an upgrade to the previous version of Monitor. The new software is written for 32-bit operating systems only and can therefore
Excel Tutorial. Bio 150B Excel Tutorial 1
 Bio 15B Excel Tutorial 1 Excel Tutorial As part of your laboratory write-ups and reports during this semester you will be required to collect and present data in an appropriate format. To organize and
How to Make the Most of Excel Spreadsheets
 How to Make the Most of Excel Spreadsheets Analyzing data is often easier when it s in an Excel spreadsheet rather than a PDF for example, you can filter to view just a particular grade, sort to view which
Converting Data from An Excel File into SPSS
 OpenStax-CNX module: m40709 1 Converting Data from An Excel File into SPSS John R. Slate Ana Rojas-LeBouef This work is produced by OpenStax-CNX and licensed under the Creative Commons Attribution License
SPSS for Windows Version 16.0: A Basic Tutorial
 SPSS for Windows Version 16.0: A Basic Tutorial Linda Fiddler, California State University, Bakersfield Laura Hecht, California State University, Bakersfield Edward E. Nelson, California State University,
MANAGER SELF SERVICE USER GUIDE
 MANAGER SELF SERVICE USER GUIDE FEBRUARY 2016 Contents Note: If using this guide electronically the contents are hyperlinked to each section. Introduction... 2 Using This Manual... 2 Signing in to Workday...
Introduction to SPSS 16.0
 Introduction to SPSS 16.0 Edited by Emily Blumenthal Center for Social Science Computation and Research 110 Savery Hall University of Washington Seattle, WA 98195 USA (206) 543-8110 November 2010 http://julius.csscr.washington.edu/pdf/spss.pdf
Instructions for Formatting APA Style Papers in Microsoft Word 2010
 Instructions for Formatting APA Style Papers in Microsoft Word 2010 To begin a Microsoft Word 2010 project, click on the Start bar in the lower left corner of the screen. Select All Programs and then find
IBM SPSS Statistics Basics
 October, 2011 IBM SPSS Statistics Basics I. Availability... 2 II. SPSS Statistics Versions... 2 III. Documentation... 2 IV. Creating SPSS Statistics data files... 3 Using the SPSS Statistics Data Editor...
Licensed to: CengageBrain User
 This is an electronic version of the print textbook. Due to electronic rights restrictions, some third party content may be suppressed. Editorial review has deemed that any suppressed content does not
SAS Analyst for Windows Tutorial
 Updated: August 2012 Table of Contents Section 1: Introduction... 3 1.1 About this Document... 3 1.2 Introduction to Version 8 of SAS... 3 Section 2: An Overview of SAS V.8 for Windows... 3 2.1 Navigating
MetroBoston DataCommon Training
 MetroBoston DataCommon Training Whether you are a data novice or an expert researcher, the MetroBoston DataCommon can help you get the information you need to learn more about your community, understand
How to Excel with CUFS Part 2 Excel 2010
 How to Excel with CUFS Part 2 Excel 2010 Course Manual Finance Training Contents 1. Working with multiple worksheets 1.1 Inserting new worksheets 3 1.2 Deleting sheets 3 1.3 Moving and copying Excel worksheets
How to Make APA Format Tables Using Microsoft Word
 How to Make APA Format Tables Using Microsoft Word 1 I. Tables vs. Figures - See APA Publication Manual p. 147-175 for additional details - Tables consist of words and numbers where spatial relationships
Data exploration with Microsoft Excel: univariate analysis
 Data exploration with Microsoft Excel: univariate analysis Contents 1 Introduction... 1 2 Exploring a variable s frequency distribution... 2 3 Calculating measures of central tendency... 16 4 Calculating
Control K Shortcut This shortcut will assist with easily adding someone to the To field without using the Address Book.
 Outline Control K Shortcut... 1... 2 Finding employees in the address book... 2 Autocomplete Feature... 3 Deleting someone in the autocomplete history... 3 Department listings in... 4 Narrow your search
MicroStrategy Tips and Tricks
 MicroStrategy Tips and Tricks 1. If a prompt is required, it will have a red (Required) note. 2. If a prompt has been answered, it will have a green flag on the left-hand side of the screen. 3. You can
SHORT COURSE ON Stata SESSION ONE Getting Your Feet Wet with Stata
 SHORT COURSE ON Stata SESSION ONE Getting Your Feet Wet with Stata Instructor: Cathy Zimmer 962-0516, cathy_zimmer@unc.edu 1) INTRODUCTION a) Who am I? Who are you? b) Overview of Course i) Working with
Data analysis process
 Data analysis process Data collection and preparation Collect data Prepare codebook Set up structure of data Enter data Screen data for errors Exploration of data Descriptive Statistics Graphs Analysis
Virtual Heart User Manual Username Password
 Virtual Heart User Manual Username Password These instructions are meant to help you use the Virtual Heart website. Please write down your username and password and store them in a safe place in case you
Step Sheet: Creating a Data Table and Charts
 Step Sheet: Creating a Data Table and Charts Using Microsoft Excel Spreadsheets with Data This step sheet will help you build a data table and convert the data into histograms and circle graphs for your
APPLYING BENFORD'S LAW This PDF contains step-by-step instructions on how to apply Benford's law using Microsoft Excel, which is commonly used by
 APPLYING BENFORD'S LAW This PDF contains step-by-step instructions on how to apply Benford's law using Microsoft Excel, which is commonly used by internal auditors around the world in their day-to-day
a. First Drag Position from Measures to Dimensions b. Drag Position into Rows c. Drag Candidate into Columns
 Text Analytics using Tableau The following tutorial will show you how to perform text analysis in Tableau 8.2. To get started, you will need the following: Tableau version 8.2 Data: Political Speeches.xlsx
2: Entering Data. Open SPSS and follow along as your read this description.
 2: Entering Data Objectives Understand the logic of data files Create data files and enter data Insert cases and variables Merge data files Read data into SPSS from other sources The Logic of Data Files
IBM SPSS Direct Marketing 23
 IBM SPSS Direct Marketing 23 Note Before using this information and the product it supports, read the information in Notices on page 25. Product Information This edition applies to version 23, release
Using Microsoft Excel to Manage and Analyze Data: Some Tips
 Using Microsoft Excel to Manage and Analyze Data: Some Tips Larger, complex data management may require specialized and/or customized database software, and larger or more complex analyses may require
Petrel TIPS&TRICKS from SCM
 Petrel TIPS&TRICKS from SCM Knowledge Worth Sharing Pie Charts or Bubble Maps This TIPS&TRICKS is intended to aid a person working in Petrel who needs to make a display showing the relative proportion
Your Name: Section: 36-201 INTRODUCTION TO STATISTICAL REASONING Computer Lab Exercise #5 Analysis of Time of Death Data for Soldiers in Vietnam
 Your Name: Section: 36-201 INTRODUCTION TO STATISTICAL REASONING Computer Lab Exercise #5 Analysis of Time of Death Data for Soldiers in Vietnam Objectives: 1. To use exploratory data analysis to investigate