Q1. Where else, other than your home, do you use the internet? (Check all that apply). Library School Workplace Internet on a cell phone Other
|
|
|
- Arline Smith
- 8 years ago
- Views:
Transcription

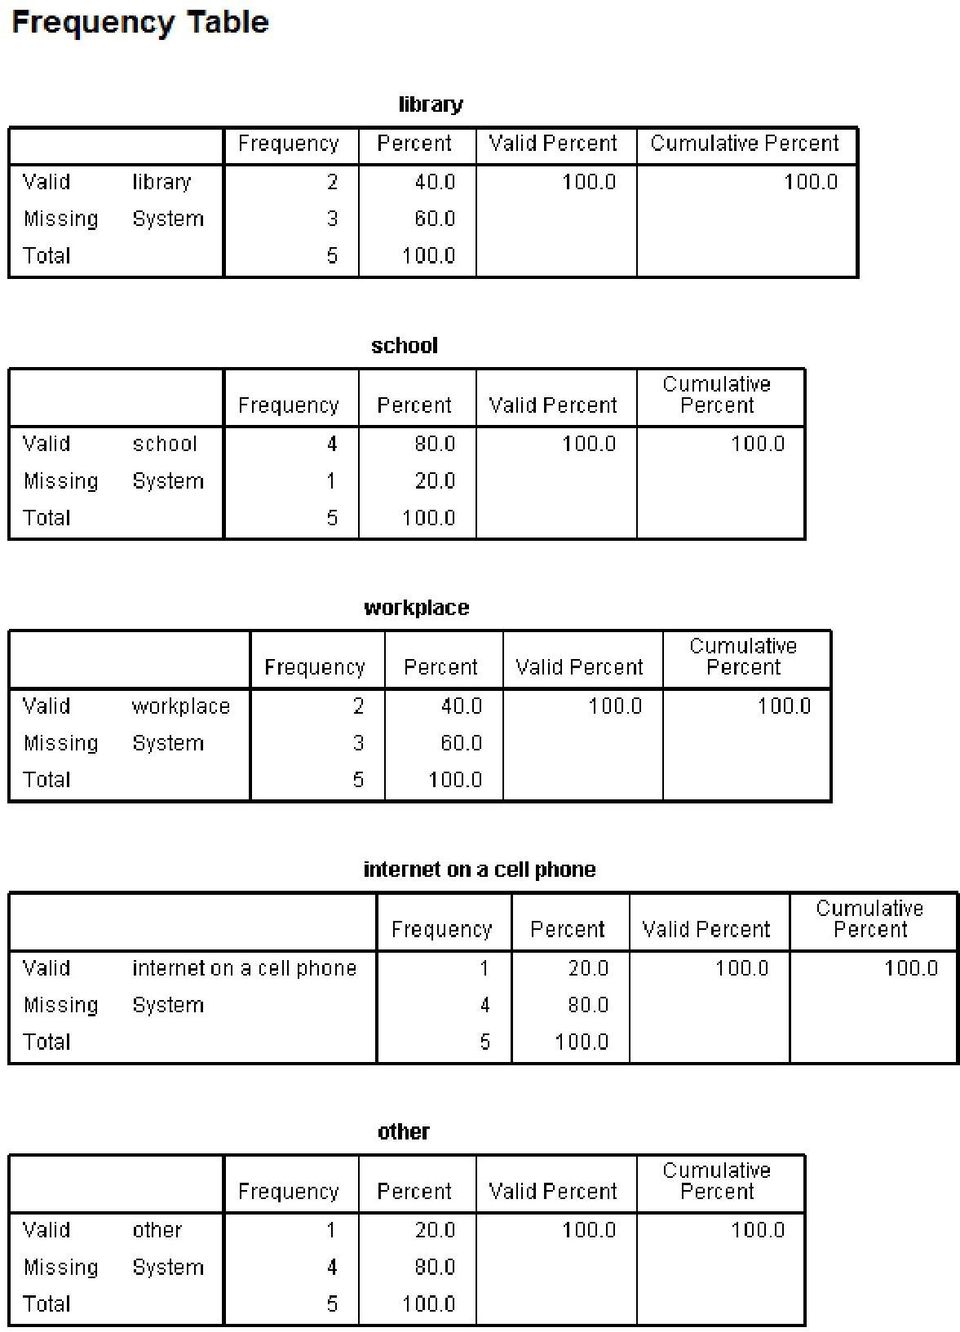
1 Exploring Check-All Questions: Frequencies, Multiple Response, and Aggregation Target Software & Version: SPSS v19 Last Updated on May 4, 2012 Created by Laura Atkins Sometimes several responses or measurements are recorded for a single question. For example, there may be questions in a questionnaire that will allow a respondent to select each of the responses as an answer, as in the example below: Q1. Where else, other than your home, do you use the internet? (Check all that apply). Library School Workplace Internet on a cell phone Other Many people commonly refer to these as Check all that Apply or Checklist questions. These questions are often used when it is important to the researcher that the respondents consider each of the possibilities. The respondent could use the internet at all of these places, none of them, or any combination of these locations. Because all of these combinations are possible, it s necessary to make sure that the data is written in such a way that each category is written out as a separate variable in the dataset -- Essentially as a yes/no answer. If five people were asked this question, the data would look something like this: ID Q1_1 (library) Q1_2 (school) Q1_3 (workplace) Q1_4 (internet on a cell phone) Q1_5 (other) Once the data is recorded properly there are three ways to explore this variable in SPSS: running basic Frequencies, using the Multiple Response command, or using the Aggregate command. I. Frequencies The frequencies procedure generates a frequency table illustrating how cases are distributed across the values of a variable. 1. In the menu bar select: Analyze> Descriptive Statistics>Frequencies 2. Place each variable (Q1_1 to Q1_5) into the Variables box. This would treat each variable as a separate entity and would yield five separate summary tables:
.")
2
3 II. Multiple Response A simple, but limited and temporary approach is to use the Multiple Response option. This procedure creates a single summary table of counts and percents based on several variables that contain responses to one question. This would create one table that combines all five variables, rather than five separate tables. 1. First, make note of how the variables of interest are coded. For this example there are five categories (1-5). 2. Next, instruct SPSS that a set of variables represents responses to a single question of interest. In the menu bar, go to Analyze>Multiple Response>Define Variable Sets. To define a multiple response set in SPSS we must specify the list of variables that make up the set, the type of coding used, and a name. 3. Using the arrow button, place variables Q1_1 through Q1_5 in the Variables in Set box. 4. Click Categories and add 1-5 for the range. 5. Give the new collapsed variable a name (ex. Where_Internet). Next, give the variable a label and click Add. Notice that the set name now appears in the Multiple Response Sets list box. The $ prefix distinguishes the set name from an ordinary SPSS variable name. 6. Click Close. 7. Return to Analyze>Multiple Response. You will now see that two options have been activated: Frequencies and Crosstabs. Below is an example of frequency output for the Where_Internet variable: $Where_Internet Frequencies Responses N Percent Percent of Cases a Where else do you use the internet? library % 40.0% school % 80.0% workplace % 40.0% internet on a cell phone % 20.0% other % 20.0% Total % 200.0% a. Group A single table was created based on responses to the five variables (Q1_1 to Q1_5). The N column indicates how many respondents mentioned each location. School is the most commonly mentioned location. The Percent of Responses column indicates what percentage of the total number of locations mentioned is contained in each category. The Percent of Cases indicates what percentage of respondents used locations of each given type. The column for interpretation is Percent of Cases. The reason that it is possible to have over 100% is because each respondent can select more than one category. Theoretically, if everyone selected all categories this percentage would be equal to 500%. Note that the multiple response set that was created will remain active until a different data file is opened or you exit SPSS. One limitation of with this method of exploring these variables is that the chi-square test of statistical significance as well as graphs cannot be obtained using Multiple Response.
. 2. Next, instruct SPSS that a set of variables represents responses to a single question of interest.")

4 III. Aggregate A third option for exploring this data is to create a combination variable which would give all of the unique combinations listed in the dataset. The Aggregate Data command aggregates groups of cases in the active dataset into single cases and creates a new, aggregated file or creates new variables in the active dataset that contain aggregated data. Cases are aggregated based on the value of one or more break (grouping) variables. To do this will take some effort and requires more advanced skills. However, if you feel that you will be using this variable for statistical tests or beyond a single time period, this could be the right decision. This option will allow you to save your work and use the variable for later analysis. The steps are outlined below: 1. Data>Aggregate. Place Q1_1 to Q1_5 in the Break Variables box to find unique combinations. Break Variable(s) are cases which are grouped together based on the values of the break variables. Each unique combination of break variable values defines a group. When creating a new, aggregated data file, all break variables are saved in the new file with their existing names and information. 2. Check the Number of cases box. This will activate the N_Break command. The N_Break command tells SPSS by which variable to collapse the data. 3. Check the Create a new dataset button and give the new dataset a name. This will specify a new file into which the aggregated data will be placed. When finished, click OK.


5 4. In Data View of the new dataset, each row represents a unique response. The cases are represented as N_Break. Sorting N_break in descending order would show where the most common responses fall. Additionally, if there were rows with all missing values, these could be deleted because they do not need to be assigned a unique identifier, which is the next step. 5. To assign a unique identifier to each row, go to: Transform>Compute Variable Assign a name to the Target Variable (ex. Values ). In the Function Group box, select All and place $CASENUM into the Numeric Expression box by double-clicking it or using the arrow button. $Casenum assigns a unique identifier to each row/unique combination of responses.
.")

6 In Data View, you will now see a new column of unique values for each row/unique combination of responses: Note that when sorting N_break in descending order, the unique identifier would be structured such that the most common response =1, the second most common response =2, etc. 6. The next step is to merge the aggregated data file into the original file. It is always necessary to sort cases in both files before merging. In both files, go to: Data>Sort Cases> Sort by: Q1_1 through Q1_5 7. In the original dataset, go to Data>Merge Files> Add Variables. Highlight the open dataset you wish to merge and click Continue. 8. In the Add Variables dialog box, Select Match cases on key variables in sorted files and select Non-active dataset is keyed table. Add Q1_1 through Q1_5 to Key Variables box. Add N-Break to Excluded Variable box. Click OK. You will get a warning that the merge will not work if the cases were not sorted first. Click OK.


7 9. The new variable Values can now be seen in Variable View of the original dataset. Change the decimals to 0, and add the missing values. 10. The final step is to add values and labels accordingly, by referencing the other data file that shows unique responses. Again, the Aggregate command is a useful option if you feel that you will be using the variable for statistical tests or beyond a single time period. Just save the changes made to your original dataset, and the new variable will be saved in your dataset.

HOW TO CREATE AND MERGE DATASETS IN SPSS
 HOW TO CREATE AND MERGE DATASETS IN SPSS If the original datasets to be merged are large, the process may be slow and unwieldy. Therefore the preferred method for working on multiple sweeps of data is
Microsoft Excel 2013: Using a Data Entry Form
 Microsoft Excel 2013: Using a Data Entry Form Using Excel's built in data entry form is a quick and easy way to enter data into an Excel database. Using the form allows you to: start a new database table
SPSS (Statistical Package for the Social Sciences)
") SPSS (Statistical Package for the Social Sciences) What is SPSS? SPSS stands for Statistical Package for the Social Sciences The SPSS home-page is: www.spss.com 2 What can you do with SPSS? Run Frequencies
SPSS (Statistical Package for the Social Sciences) What is SPSS? SPSS stands for Statistical Package for the Social Sciences The SPSS home-page is: www.spss.com 2 What can you do with SPSS? Run Frequencies
Introduction Course in SPSS - Evening 1
 ETH Zürich Seminar für Statistik Introduction Course in SPSS - Evening 1 Seminar für Statistik, ETH Zürich All data used during the course can be downloaded from the following ftp server: ftp://stat.ethz.ch/u/sfs/spsskurs/
Selecting a Sub-set of Cases in SPSS: The Select Cases Command
 Selecting a Sub-set of Cases in SPSS: The Select Cases Command When analyzing a data file in SPSS, all cases with valid values for the relevant variable(s) are used. If I opened the 1991 U.S. General Social
Managing Contacts in Outlook
 Managing Contacts in Outlook This document provides instructions for creating contacts and distribution lists in Microsoft Outlook 2007. In addition, instructions for using contacts in a Microsoft Word
Word 2010: Mail Merge to Email with Attachments
 Word 2010: Mail Merge to Email with Attachments Table of Contents TO SEE THE SECTION FOR MACROS, YOU MUST TURN ON THE DEVELOPER TAB:... 2 SET REFERENCE IN VISUAL BASIC:... 2 CREATE THE MACRO TO USE WITHIN
Using SPSS, Chapter 2: Descriptive Statistics
 1 Using SPSS, Chapter 2: Descriptive Statistics Chapters 2.1 & 2.2 Descriptive Statistics 2 Mean, Standard Deviation, Variance, Range, Minimum, Maximum 2 Mean, Median, Mode, Standard Deviation, Variance,
Directions for Frequency Tables, Histograms, and Frequency Bar Charts
 Directions for Frequency Tables, Histograms, and Frequency Bar Charts Frequency Distribution Quantitative Ungrouped Data Dataset: Frequency_Distributions_Graphs-Quantitative.sav 1. Open the dataset containing
SPSS: Getting Started. For Windows
 For Windows Updated: August 2012 Table of Contents Section 1: Overview... 3 1.1 Introduction to SPSS Tutorials... 3 1.2 Introduction to SPSS... 3 1.3 Overview of SPSS for Windows... 3 Section 2: Entering
Access Tutorial 3 Maintaining and Querying a Database. Microsoft Office 2013 Enhanced
 Access Tutorial 3 Maintaining and Querying a Database Microsoft Office 2013 Enhanced Objectives Session 3.1 Find, modify, and delete records in a table Hide and unhide fields in a datasheet Work in the
Tutorial 3 Maintaining and Querying a Database
 Tutorial 3 Maintaining and Querying a Database Microsoft Access 2013 Objectives Session 3.1 Find, modify, and delete records in a table Hide and unhide fields in a datasheet Work in the Query window in
Tutorial 3. Maintaining and Querying a Database
 Tutorial 3 Maintaining and Querying a Database Microsoft Access 2010 Objectives Find, modify, and delete records in a table Learn how to use the Query window in Design view Create, run, and save queries
Microsoft Office 2010
 Access Tutorial 3 Maintaining and Querying a Database Microsoft Office 2010 Objectives Find, modify, and delete records in a table Learn how to use the Query window in Design view Create, run, and save
What is a Mail Merge?
 NDUS Training and Documentation What is a Mail Merge? A mail merge is generally used to personalize form letters, to produce mailing labels and for mass mailings. A mail merge can be very helpful if you
Query 4. Lesson Objectives 4. Review 5. Smart Query 5. Create a Smart Query 6. Create a Smart Query Definition from an Ad-hoc Query 9
 TABLE OF CONTENTS Query 4 Lesson Objectives 4 Review 5 Smart Query 5 Create a Smart Query 6 Create a Smart Query Definition from an Ad-hoc Query 9 Query Functions and Features 13 Summarize Output Fields
Merging Labels, Letters, and Envelopes Word 2013
 Merging Labels, Letters, and Envelopes Word 2013 Merging... 1 Types of Merges... 1 The Merging Process... 2 Labels - A Page of the Same... 2 Labels - A Blank Page... 3 Creating Custom Labels... 3 Merged
Microsoft Access 2007 Introduction
 Microsoft Access 2007 Introduction Access is the database management system in Microsoft Office. A database is an organized collection of facts about a particular subject. Examples of databases are an
Instructions for applying data validation(s) to data fields in Microsoft Excel
 to data fields in Microsoft Excel") 1 of 10 Instructions for applying data validation(s) to data fields in Microsoft Excel According to Microsoft Excel, a data validation is used to control the type of data or the values that users enter
1 of 10 Instructions for applying data validation(s) to data fields in Microsoft Excel According to Microsoft Excel, a data validation is used to control the type of data or the values that users enter
4. Descriptive Statistics: Measures of Variability and Central Tendency
 4. Descriptive Statistics: Measures of Variability and Central Tendency Objectives Calculate descriptive for continuous and categorical data Edit output tables Although measures of central tendency and
In This Issue: Excel Sorting with Text and Numbers
 In This Issue: Sorting with Text and Numbers Microsoft allows you to manipulate the data you have in your spreadsheet by using the sort and filter feature. Sorting is performed on a list that contains
Instructions for creating a data entry form in Microsoft Excel
 1 of 5 You have several options when you want to enter data manually in Excel. You can enter data in one cell, in several cells at the same time, or on more than one worksheet (worksheet/spreadsheet: The
Excel Reports and Macros
 Excel Reports and Macros Within Microsoft Excel it is possible to create a macro. This is a set of commands that Excel follows to automatically make certain changes to data in a spreadsheet. By adding
Creating a Participants Mailing and/or Contact List:
 Creating a Participants Mailing and/or Contact List: The Limited Query function allows a staff member to retrieve (query) certain information from the Mediated Services system. This information is from
Microsoft Excel v5.0 Database Functions
 Microsoft Excel v5.0 Database Functions Student Guide Simon Dupernex Aston Business School Version 1.0 1 Preface This document is an introduction to the database functions contained within the spreadsheet
Creating a Distribution List from an Excel Spreadsheet
 Creating a Distribution List from an Excel Spreadsheet Create the list of information in Excel Create an excel spreadsheet. The following sample file has the person s first name, last name and email address
IBM SPSS Statistics 20 Part 1: Descriptive Statistics
 CALIFORNIA STATE UNIVERSITY, LOS ANGELES INFORMATION TECHNOLOGY SERVICES IBM SPSS Statistics 20 Part 1: Descriptive Statistics Summer 2013, Version 2.0 Table of Contents Introduction...2 Downloading the
MS Project Tutorial for Senior Design Using Microsoft Project to manage projects
 MS Project Tutorial for Senior Design Using Microsoft Project to manage projects Overview: Project management is an important part of the senior design process. For the most part, teams manage projects
Unified Reporting Tool: Troubleshooting Guide
 Unified Reporting Tool: Troubleshooting Guide This appendix identifies procedures and best practices for the most frequently-encountered challenges and questions regarding the 2015 Unified THIRA/SPR Reporting
Advanced Excel 10/20/2011 1
 Advanced Excel Data Validation Excel has a feature called Data Validation, which will allow you to control what kind of information is typed into cells. 1. Select the cell(s) you wish to control. 2. Click
COURSE DESCRIPTION. Queries in Microsoft Access. This course is designed for users with a to create queries in Microsoft Access.
 COURSE DESCRIPTION Course Name Queries in Microsoft Access Audience need This course is designed for users with a to create queries in Microsoft Access. Prerequisites * Keyboard and mouse skills * An understanding
Analysis of categorical data: Course quiz instructions for SPSS
 Analysis of categorical data: Course quiz instructions for SPSS The dataset Please download the Online sales dataset from the Download pod in the Course quiz resources screen. The filename is smr_bus_acd_clo_quiz_online_250.xls.
Basic Pivot Tables. To begin your pivot table, choose Data, Pivot Table and Pivot Chart Report. 1 of 18
 Basic Pivot Tables Pivot tables summarize data in a quick and easy way. In your job, you could use pivot tables to summarize actual expenses by fund type by object or total amounts. Make sure you do not
APPLYING BENFORD'S LAW This PDF contains step-by-step instructions on how to apply Benford's law using Microsoft Excel, which is commonly used by
 APPLYING BENFORD'S LAW This PDF contains step-by-step instructions on how to apply Benford's law using Microsoft Excel, which is commonly used by internal auditors around the world in their day-to-day
Lesson 07: MS ACCESS - Handout. Introduction to database (30 mins)
") Lesson 07: MS ACCESS - Handout Handout Introduction to database (30 mins) Microsoft Access is a database application. A database is a collection of related information put together in database objects.
Lesson 07: MS ACCESS - Handout Handout Introduction to database (30 mins) Microsoft Access is a database application. A database is a collection of related information put together in database objects.
How To Use Spss
 1: Introduction to SPSS Objectives Learn about SPSS Open SPSS Review the layout of SPSS Become familiar with Menus and Icons Exit SPSS What is SPSS? SPSS is a Windows based program that can be used to
Context-sensitive Help Guide
 MadCap Software Context-sensitive Help Guide Flare 11 Copyright 2015 MadCap Software. All rights reserved. Information in this document is subject to change without notice. The software described in this
Microsoft Access 2010- Introduction
 Microsoft Access 2010- Introduction Access is the database management system in Microsoft Office. A database is an organized collection of facts about a particular subject. Examples of databases are an
MICROSOFT ACCESS 2003 TUTORIAL
 MICROSOFT ACCESS 2003 TUTORIAL M I C R O S O F T A C C E S S 2 0 0 3 Microsoft Access is powerful software designed for PC. It allows you to create and manage databases. A database is an organized body
Introduction to SPSS 16.0
 Introduction to SPSS 16.0 Edited by Emily Blumenthal Center for Social Science Computation and Research 110 Savery Hall University of Washington Seattle, WA 98195 USA (206) 543-8110 November 2010 http://julius.csscr.washington.edu/pdf/spss.pdf
EXCEL PIVOT TABLE David Geffen School of Medicine, UCLA Dean s Office Oct 2002
 EXCEL PIVOT TABLE David Geffen School of Medicine, UCLA Dean s Office Oct 2002 Table of Contents Part I Creating a Pivot Table Excel Database......3 What is a Pivot Table...... 3 Creating Pivot Tables
MS Access. Microsoft Access is a relational database management system for windows. Using this package, following tasks can be performed.
 MS Access Microsoft Access is a relational database management system for windows. Using this package, following tasks can be performed. Organize data into manageable related units Enter, modify and locate
TheEducationEdge. Export Guide
 TheEducationEdge Export Guide 102111 2011 Blackbaud, Inc. This publication, or any part thereof, may not be reproduced or transmitted in any form or by any means, electronic, or mechanical, including photocopying,
Appendix III: SPSS Preliminary
 Appendix III: SPSS Preliminary SPSS is a statistical software package that provides a number of tools needed for the analytical process planning, data collection, data access and management, analysis,
Excel for Data Cleaning and Management
 Excel for Data Cleaning and Management Background Information This workshop is designed to teach skills in Excel that will help you manage data from large imports and save them for further use in SPSS
Appendix A How to create a data-sharing lab
 Appendix A How to create a data-sharing lab Creating a lab involves completing five major steps: creating lists, then graphs, then the page for lab instructions, then adding forms to the lab instructions,
Computer Science 125. Microsoft Access Project
 Computer Science 125 Microsoft Access Project Due Date : Tuesday, March 4th, 11:59 PM 50 points In this project, you will use Microsoft Access to create two databases : a student database and a coffee
Create a new investment form and publish it to a SharePoint 2013 forms library
 Create a new investment form and publish it to a SharePoint 2013 forms library Step 1, create two new document libraries in the root site of your a collection 1) Open SharePoint Designer 2013 2) Create
Mac Outlook Calendar/Scheduler and Tasks
 Introduction Schedule an event and/or meeting. Schedule all-day and recurring events. Assign tasks to another user and use special shortcut keys. Contents Introduction Contents Calendar View Edit an appointment
CHAPTER 6: SEARCHING AN ONLINE DATABASE
 CHAPTER 6: SEARCHING AN ONLINE DATABASE WHAT S INSIDE Searching an Online Database... 6-1 Selecting a Display Mode... 6-1 Searching a Database... 6-1 Reviewing References... 6-2 Finding Full Text for a
Microsoft Office Access 2007 Basics
 Access(ing) A Database Project PRESENTED BY THE TECHNOLOGY TRAINERS OF THE MONROE COUNTY LIBRARY SYSTEM EMAIL: TRAININGLAB@MONROE.LIB.MI.US MONROE COUNTY LIBRARY SYSTEM 734-241-5770 1 840 SOUTH ROESSLER
Microsoft Excel 2007 Consolidate Data & Analyze with Pivot Table Windows XP
 Microsoft Excel 2007 Consolidate Data & Analyze with Pivot Table Windows XP Consolidate Data in Multiple Worksheets Example data is saved under Consolidation.xlsx workbook under ProductA through ProductD
To create a histogram, you must organize the data in two columns on the worksheet. These columns must contain the following data:
 You can analyze your data and display it in a histogram (a column chart that displays frequency data) by using the Histogram tool of the Analysis ToolPak. This data analysis add-in is available when you
New Orleans 2007 Workshop Tips For Using Microsoft Excel to Analyze EMSC Data and Generate Reports Pivot Tables and Other Goodies
 1 of 17 New Orleans 2007 Workshop Tips For Using Microsoft Excel to Analyze EMSC Data and Generate Reports Pivot Tables and Other Goodies Introduction In this document, we will describe several more advanced
Learn how to create web enabled (browser) forms in InfoPath 2013 and publish them in SharePoint 2013. InfoPath 2013 Web Enabled (Browser) forms
 forms in InfoPath 2013 and publish them in SharePoint 2013. InfoPath 2013 Web Enabled (Browser) forms") Learn how to create web enabled (browser) forms in InfoPath 2013 and publish them in SharePoint 2013. InfoPath 2013 Web Enabled (Browser) forms InfoPath 2013 Web Enabled (Browser) forms Creating Web Enabled
Learn how to create web enabled (browser) forms in InfoPath 2013 and publish them in SharePoint 2013. InfoPath 2013 Web Enabled (Browser) forms InfoPath 2013 Web Enabled (Browser) forms Creating Web Enabled
Microsoft Access 2010 Part 1: Introduction to Access
 CALIFORNIA STATE UNIVERSITY, LOS ANGELES INFORMATION TECHNOLOGY SERVICES Microsoft Access 2010 Part 1: Introduction to Access Fall 2014, Version 1.2 Table of Contents Introduction...3 Starting Access...3
Mail Merge: Create Mailing Labels Using Excel Data and Filtering the Contents in the Data
 Mail Merge: Create Mailing Labels Using Excel Data and Filtering the Contents in the Data Prior to starting this, please save the.csv file that you exported as an excel file (example: xxxx.csv will now
Analyzing Excel Data Using Pivot Tables
 NDUS Training and Documentation Analyzing Excel Data Using Pivot Tables Pivot Tables are interactive worksheet tables you can use to quickly and easily summarize, organize, analyze, and compare large amounts
I. Create the base view with the data you want to measure
 Developing Key Performance Indicators (KPIs) in Tableau The following tutorial will show you how to create KPIs in Tableau 9. To get started, you will need the following: Tableau version 9 Data: Sample
NAIP Consortium Strengthening Statistical Computing for NARS www.iasri.res.in/sscnars SAS Enterprise Business Intelligence
 NAIP Consortium Strengthening Statistical Computing for NARS www.iasri.res.in/sscnars SAS Enterprise Business Intelligence BY Rajender Parsad, Neeraj Monga, Satyajit Dwivedi, RS Tomar, RK Saini Contents
Getting Started with Access 2007
 Getting Started with Access 2007 1 A database is an organized collection of information about a subject. Examples of databases include an address book, the telephone book, or a filing cabinet full of documents
Using Excel for Analyzing Survey Questionnaires Jennifer Leahy
 University of Wisconsin-Extension Cooperative Extension Madison, Wisconsin PD &E Program Development & Evaluation Using Excel for Analyzing Survey Questionnaires Jennifer Leahy G3658-14 Introduction You
Colorado Medical Assistance Program Web Portal Dental Claims User Guide
 Colorado Medical Assistance Program Web Portal Dental Claims User Guide The Dental Claim Lookup screen (Figure 1) is the main screen from which to manage Dental claims. It consists of different sections
How to Concatenate Cells in Microsoft Access
 How to Concatenate Cells in Microsoft Access This tutorial demonstrates how to concatenate cells in Microsoft Access. Sometimes data distributed over multiple columns is more efficient to use when combined
Chapter 5. Microsoft Access
 Chapter 5 Microsoft Access Topic Introduction to DBMS Microsoft Access Getting Started Creating Database File Database Window Table Queries Form Report Introduction A set of programs designed to organize,
An Introduction to SPSS. Workshop Session conducted by: Dr. Cyndi Garvan Grace-Anne Jackman
 An Introduction to SPSS Workshop Session conducted by: Dr. Cyndi Garvan Grace-Anne Jackman Topics to be Covered Starting and Entering SPSS Main Features of SPSS Entering and Saving Data in SPSS Importing
Creating Reports with Smart View s Ad Hoc Analysis
 with Smart View s Ad Hoc Analysis Dartmouth College February 10, 2009 Table of Contents Overview... 3 Connecting to the Reporting Cube... 3 Setting Ad Hoc Options... 3 The Ad Hoc Grid... 4 Selecting Members
Excel Companion. (Profit Embedded PHD) User's Guide
 User's Guide") Excel Companion (Profit Embedded PHD) User's Guide Excel Companion (Profit Embedded PHD) User's Guide Copyright, Notices, and Trademarks Copyright, Notices, and Trademarks Honeywell Inc. 1998 2001. All
Excel Companion (Profit Embedded PHD) User's Guide Excel Companion (Profit Embedded PHD) User's Guide Copyright, Notices, and Trademarks Copyright, Notices, and Trademarks Honeywell Inc. 1998 2001. All
The Chi-Square Test. STAT E-50 Introduction to Statistics
 STAT -50 Introduction to Statistics The Chi-Square Test The Chi-square test is a nonparametric test that is used to compare experimental results with theoretical models. That is, we will be comparing observed
IBM SPSS Statistics for Beginners for Windows
 ISS, NEWCASTLE UNIVERSITY IBM SPSS Statistics for Beginners for Windows A Training Manual for Beginners Dr. S. T. Kometa A Training Manual for Beginners Contents 1 Aims and Objectives... 3 1.1 Learning
for Sage 100 ERP Business Insights Overview Document
 for Sage 100 ERP Business Insights Document 2012 Sage Software, Inc. All rights reserved. Sage Software, Sage Software logos, and the Sage Software product and service names mentioned herein are registered
How to Use a Data Spreadsheet: Excel
 How to Use a Data Spreadsheet: Excel One does not necessarily have special statistical software to perform statistical analyses. Microsoft Office Excel can be used to run statistical procedures. Although
How to Download Census Data from American Factfinder and Display it in ArcMap
 How to Download Census Data from American Factfinder and Display it in ArcMap Factfinder provides census and ACS (American Community Survey) data that can be downloaded in a tabular format and joined with
CREATING EXCEL PIVOT TABLES AND PIVOT CHARTS FOR LIBRARY QUESTIONNAIRE RESULTS
 CREATING EXCEL PIVOT TABLES AND PIVOT CHARTS FOR LIBRARY QUESTIONNAIRE RESULTS An Excel Pivot Table is an interactive table that summarizes large amounts of data. It allows the user to view and manipulate
Microsoft Access 2010 handout
 Microsoft Access 2010 handout Access 2010 is a relational database program you can use to create and manage large quantities of data. You can use Access to manage anything from a home inventory to a giant
Drawing a histogram using Excel
 Drawing a histogram using Excel STEP 1: Examine the data to decide how many class intervals you need and what the class boundaries should be. (In an assignment you may be told what class boundaries to
SPSS Workbook 1 Data Entry : Questionnaire Data
 TEESSIDE UNIVERSITY SCHOOL OF HEALTH & SOCIAL CARE SPSS Workbook 1 Data Entry : Questionnaire Data Prepared by: Sylvia Storey s.storey@tees.ac.uk SPSS data entry 1 This workbook is designed to introduce
BUSINESS DATA ANALYSIS WITH PIVOTTABLES
 BUSINESS DATA ANALYSIS WITH PIVOTTABLES Jim Chen, Ph.D. Professor Norfolk State University 700 Park Avenue Norfolk, VA 23504 (757) 823-2564 jchen@nsu.edu BUSINESS DATA ANALYSIS WITH PIVOTTABLES INTRODUCTION
How Do I Upload Multiple Trucks?
 How Do I Upload Multiple Trucks? 1. Log into account. Please see the How Do I Log into My Account? document (DOC-0125) for additional assistance with logging into PrePass.com. 2. On the Admin Home tab,
Introduction to Microsoft Access 2010
 Introduction to Microsoft Access 2010 A database is a collection of information that is related. Access allows you to manage your information in one database file. Within Access there are four major objects:
MicroStrategy Desktop
 MicroStrategy Desktop Quick Start Guide MicroStrategy Desktop is designed to enable business professionals like you to explore data, simply and without needing direct support from IT. 1 Import data from
Microsoft SharePoint 2010 End User Quick Reference Card
 Microsoft SharePoint 2010 End User Quick Reference Card Microsoft SharePoint 2010 brings together the people, documents, information, and ideas of the University into a customizable workspace where everyone
Sample Table. Columns. Column 1 Column 2 Column 3 Row 1 Cell 1 Cell 2 Cell 3 Row 2 Cell 4 Cell 5 Cell 6 Row 3 Cell 7 Cell 8 Cell 9.
 Working with Tables in Microsoft Word The purpose of this document is to lead you through the steps of creating, editing and deleting tables and parts of tables. This document follows a tutorial format
OUTLOOK 2013 - GETTING STARTED
 OUTLOOK 2013 - GETTING STARTED Information Technology September 1, 2014 1 GETTING STARTED IN OUTLOOK 2013 Backstage View Ribbon Navigation Pane View Pane Navigation Bar Reading Pane 2 Backstage View contains
Instructions for Creating an Outlook E-mail Distribution List from an Excel File
 Instructions for Creating an Outlook E-mail Distribution List from an Excel File 1.0 Importing Excel Data to an Outlook Distribution List 1.1 Create an Outlook Personal Folders File (.pst) Notes: 1) If
RIFIS Ad Hoc Reports
 RIFIS Ad Hoc Reports To retrieve the entire list of all Ad Hoc Reports, including the Base reports and any additional reports published to your Role, select Ad Hoc for the Type under Filter Report By and
Creating a Gradebook in Excel
 Creating a Spreadsheet Gradebook 1 Creating a Gradebook in Excel Spreadsheets are a great tool for creating gradebooks. With a little bit of work, you can create a customized gradebook that will provide
Introduction to Microsoft Access 2003
 Introduction to Microsoft Access 2003 Zhi Liu School of Information Fall/2006 Introduction and Objectives Microsoft Access 2003 is a powerful, yet easy to learn, relational database application for Microsoft
SPSS The Basics. Jennifer Thach RHS Assessment Office March 3 rd, 2014
 SPSS The Basics Jennifer Thach RHS Assessment Office March 3 rd, 2014 Why use SPSS? - Used heavily in the Social Science & Business world - Ability to perform basic to high-level statistical analysis (i.e.
DEPLOYING A VISUAL BASIC.NET APPLICATION
 C6109_AppendixD_CTP.qxd 18/7/06 02:34 PM Page 1 A P P E N D I X D D DEPLOYING A VISUAL BASIC.NET APPLICATION After completing this appendix, you will be able to: Understand how Visual Studio performs deployment
SPSS INSTRUCTION CHAPTER 1
 SPSS INSTRUCTION CHAPTER 1 Performing the data manipulations described in Section 1.4 of the chapter require minimal computations, easily handled with a pencil, sheet of paper, and a calculator. However,
Southern Mailing List User Guide
 How do I login to the system! The url for the system is srdc.msstate.edu/mailinglist.htm.! Once you have accessed the site, type in your user id and pin number. (To obtain a user id and pin number please
Importing and Exporting With SPSS for Windows 17 TUT 117
 Information Systems Services Importing and Exporting With TUT 117 Version 2.0 (Nov 2009) Contents 1. Introduction... 3 1.1 Aim of this Document... 3 2. Importing Data from Other Sources... 3 2.1 Reading
LS-DYNA Material Table. HyperMesh 7.0
 LS-DYNA Material Table HyperMesh 7.0 Table of Contents Using the LS-DYNA Material Table... 5 About the LS-DYNA Material Table... 5 Customizing Views of the Material Table... 6 Creating, Editing, and Loading
Create Charts and Graphs with Excel By Lorrie Jackson
 Create Charts and Graphs with Excel By Lorrie Jackson WHY A TECHTORIAL? What will I learn today? You will learn how to teach students in grades 3-12 to use Excel to create charts and graphs. What hardware
Introduction to Microsoft Access 2013
 Introduction to Microsoft Access 2013 A database is a collection of information that is related. Access allows you to manage your information in one database file. Within Access there are four major objects:
This exhibit describes how to upload project information from Estimator (PC) to Trns.port PES (server). Figure 1 summarizes this process.
 to Trns.port PES (server). Figure 1 summarizes this process.") Facilities Development Manual Chapter 19 Plans, Specifications and Estimates Section 5 Estimates Wisconsin Department of Transportation Exhibit 10.5 Uploading project from Estimator to Trns port PES September
Facilities Development Manual Chapter 19 Plans, Specifications and Estimates Section 5 Estimates Wisconsin Department of Transportation Exhibit 10.5 Uploading project from Estimator to Trns port PES September
Creating and Using Forms in SharePoint
 Creating and Using Forms in SharePoint Getting started with custom lists... 1 Creating a custom list... 1 Creating a user-friendly list name... 1 Other options for creating custom lists... 2 Building a
Access Queries (Office 2003)
") Access Queries (Office 2003) Technical Support Services Office of Information Technology, West Virginia University OIT Help Desk 293-4444 x 1 oit.wvu.edu/support/training/classmat/db/ Instructor: Kathy
Access Queries (Office 2003) Technical Support Services Office of Information Technology, West Virginia University OIT Help Desk 293-4444 x 1 oit.wvu.edu/support/training/classmat/db/ Instructor: Kathy