The Experiment on the Effectiveness of ALICE Online-Offline Process Monitoring
|
|
|
- Amie Walker
- 7 years ago
- Views:
Transcription
1 The Experiment on the Effectiveness of ALICE Online-Offline Process Monitoring Advisor: Dr. Phond Punchongharn Vasco Chibante Barroso Khanasin Yamnual King Mongkut s University of Technology Thonburi Faculty of Engineering Department of Computer Engineering Bangkok, Thailand

2 Outline Introduction Background and Literature Review Proposed work Evaluation Conclusion

3 Introduction CERN - European Organization for Nuclear Research, is one of the world's largest and most respected centres for scientific research. ALICE - A Large Ion Collider Experiment - The major mission is to study the physics of strongly interacting matter, and in particular the properties of Quark-Gluon Plasma (QGP), using proton-proton, nucleus-nucleus and proton-nucleus collisions at high energies. ALICE O 2 Computing - The resulting data throughput from the detector has been estimated to be greater than 1TB/s for Pb Pb events, roughly two orders of magnitude more than in Run 1. - The computing system has to be upgraded. - In the design, the data volume reduction will be achieved by reconstructing the data in several steps synchronously with data taking.

4 Introduction (cont.) Control Configuration and Monitoring (CCM) - act as a tightly-coupled entity with the role of supporting users and automatizing day-to-day operations. In this research, we will focus on the Monitoring system.

5 Motivation To acquire such an effective monitoring system, it must be able to collect the system status information from the O 2 system and archive the monitoring data into the persistent storage for historical record access. - Examples of monitoring data are CPU load average and process memory usage. The Monitoring system should be able to trigger action automatically or by human when the condition meets. - An example of alarms and action triggering, when the CPU has high temperature, the Monitoring system shutdown machine on very high CPU temperature. For the time being, in the O 2 system, - the estimated number of nodes are 1,623 nodes - the number of processes is estimated to be between 7 K and 70 K. The monitoring system should be able to collect, transport and eventually store high frequency monitoring data up to 544KHz.

6 Research Problem Using ELK stack to achieve a uniform and user friendly monitoring interface as a single entry point to the O 2 monitoring data. Also to acquire the module of identifying unusual events in purpose of triggering actions.

7 Scope of Work Our monitoring agent implementation integrating with ELK stack. A practical module of action triggering.

8 Background and Literature Review The upgrade of the ALICE Online-Offline Control Configuration and Monitoring CCM Zabbix MonALISA Nagios LEMON ELK stack

9 The upgrade of the ALICE Online-Offline It will become a new common system called O2. It will restart collecting experimental data for the next run (Run3) in The estimated data throughput is expected to be greater than 1 TB/s for Pb-Pb events, which is approximately two orders of magnitude more than in the first run. The O2 system has been designed to support both online synchronous data reduction and asynchronous and iterative data processing.

10 The upgrade of the ALICE Online-Offline 2 main computing clusters - First Level Processors (FLPs) - Event Processing Nodes (EPNs), and other necessary dedicated nodes. To achieve the goal of the online data processing along with data taking, the O2 system will require components to control the grid facility. ALICE computing-working group has introduced the system, namely Control, Configuration and Monitoring (CCM) components

11 CCM The Control, Configuration and Monitoring (CCM) components of the ALICE O2 system will act as a tightly-coupled entity with the role of supporting users and automatizing day-to-day operations. The Control system is responsible for coordinating all the O2 processes according to system status and monitoring data. The Configuration system ensures that both the application and environment parameters are properly set. Finally, the Monitoring system gathers information from the O2 system with the aim of identifying unusual patterns and raising alarms.

12 CCM The CCM systems will also need to interface with other ALICE subsystems such as the ALICE Trigger system, Detector Control System (DCS) and Storage systems in order to send commands, transmit configuration parameters, submit jobs, and receive status and monitoring data. In this research, we will mainly focus on one of the CCM components, which is Monitoring component.

13 The Monitoring system The Monitoring system has a role of gathering information from the O2 components and processes to be able to assess the status and health of the entities in quasi real time. It will raise the alarm when it founds the unusual patterns. It should also be able to aggregate monitoring data to provide high-level views of the entire system and archive relevant metrics for long-term analysis and forensic investigation as well as reduce the volume of data received continuously by the subscribers. The Monitoring system provides an application programming interface (API) allowing any software component to publish heartbeat and explicit monitoring data to a common data store. The same data store also provides periodic reporting of operating system views of the main processes and other critical services and monitoring data collected from the infrastructure, such as server health and utilization monitoring and fabric monitoring data. The API also allows query on current monitoring values or the historical data. Specifically, this will be used by the Control system to assess the health of the system in general and trigger actions accordingly.

14 Existing Monitoring tools ZABBIX - It is used for system performance monitoring of the ALICE Data Acquisition (DAQ) system. MonALISA - It provides grid-level monitoring of the ALICE grid environment. - It is used to collect monitoring information of jobs (CPU resources), storage servers (disk, tape), data transfers (network), network fabric, and management software (infrastructure).
, storage servers (disk,")
15 Existing Monitoring tools NAGIOS - It is used for grid infrastructure monitoring system - It cannot scale on thousands of hosts and tens of thousands services. LEMON - It is used at CERN is LHC Era Monitoring (LEMON) system. - It collects information of monitor servers, network equipment, associated software, additional environment and facilities data for CERN computer centre.

16 ELK stack The ELK stack comprises of Elasticsearch (ES), Logstash, and Kibana and it is generally referred to as the Elasticsearch ecosystem.

17 ELK stack - Elasticsearch
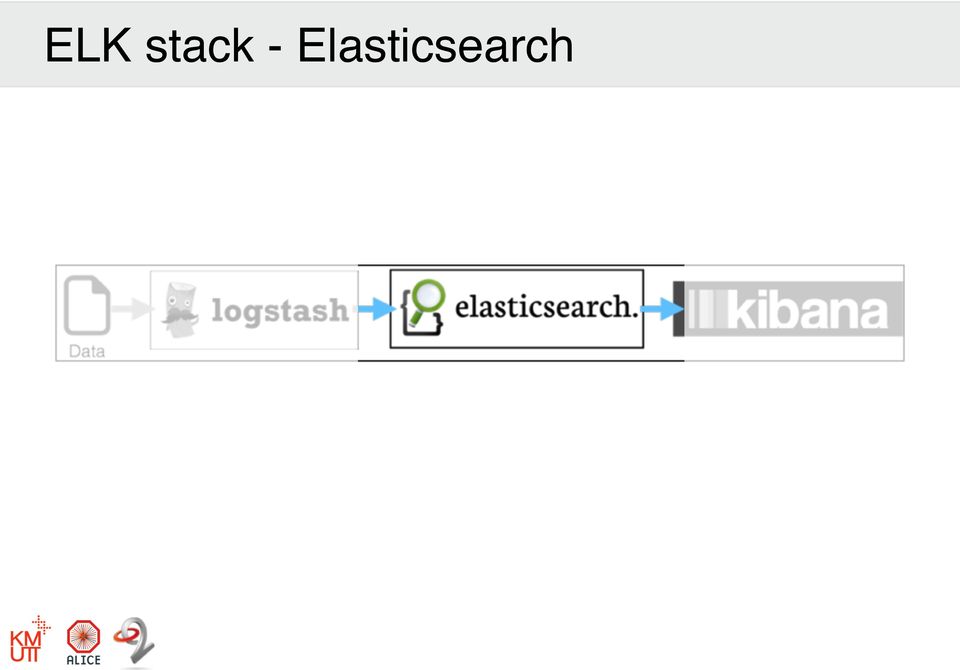
18 Elasticsearch (ES) Open source search and analytics engine built on top of the Apache Lucene information retrieval library. It is a NoSQL database and be able to be scalable and distributed. (Shards and Replicas) Every entry is stored as schema-free JSON documents and all fields can be indexed and used in a single query. It allows full-text search on unstructured data through a RESTful API using JSON over http.

19 ELK stack - Logstash
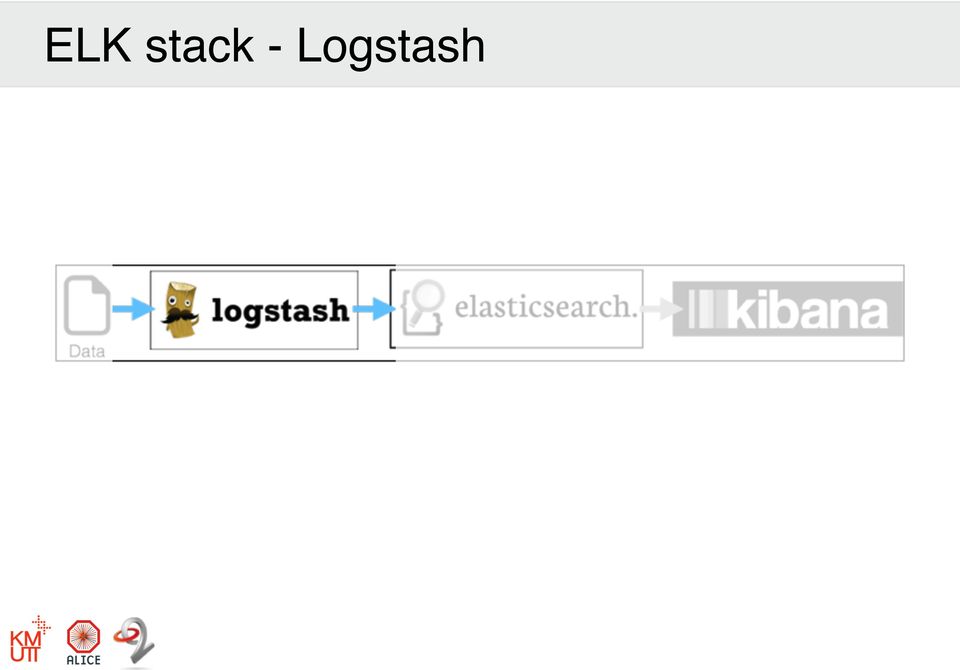
20 Logstash an open source tool used to receive, process, and output any logs. It can be easily configured via plugins for input, output and data-filters and provides a powerful pipeline for storing, querying, and analyzing logs. As ES acts as a backend data store and Kibana acts as a front-end web app, Logstash become a workhorse sending data to the ES.

21 ELK stack - Kibana
22 Kibana An open source analytics and visualization platform to work with ES. It can be used to search, view, and interact with the ES data. In addition, it provides an advanced data analysis and visualize data in a variety of charts, tables, and maps. This software can be hosted on any web server. Additional implementation for the software is allowed in order to acquire specific needs. By clicking in few mouse clicks, we can create custom interactive dashboards without any prior GUI programming knowledge. Kibana provides a set of useful pre-defined plot types like pies, histograms or trends.
23 Proposed Work Function # of nodes FLPs 250 EPNs 1250 DB servers 5 Control servers 6 Configuration servers 6 Monitoring servers 6 QA/DQM servers 30 Calibration servers 30 Storage servers 10 Network servers 5 Operator terminals 25 Total 1623 Overall System Design Estimated number of nodes
24 Monitoring System Multiple Elasticsearch master and data nodes A single visualization server A Logstash instance on the EPNs and other desired nodes This focuses on the infrastructure, hosts and processes while allowing explicit application parameters to be sent from any entity in the system. Monitoring System Design
25 Elasticsearch server As Elasticsearch acts as a no SQL data store and can be distributed and scalable, the number of nodes has not been decided yet. However, it is definitely more than a single node. The Elasticsearch servers should handle the monitoring frequencies between 60 KHz to 544 KHz according to the estimated number of processes and number of hosts. All the data in Elasticsearch can be transferred to the persistent storage for archival and further analysis.
26 Visualization Server In order to visualize such a big data and be able to retrieve value from Elasticsearch servers, we need a robust webbased graphical user interface (GUI). Fortunately, in the stack, there is a web app that architected to work with Elasticsearch called Kibana. A little and easy configuration as it just defines a source IP address or hostname can provide visualization of monitoring data both in text and graphs. Kibana can provide some levels of aggregation on monitoring data depends on what the administrators interests.
27 Logstash Instances on Clients With Logstash, clients can transport their own useful monitoring data to the Elasticsearch server. The configuration is needed once after the installation. The output of Logstash will be pointed to one of Elasticsearch servers.
28 Monitoring Agent The agent will be implemented in C++ code. On every monitored node, a monitoring agent is launched and retrieved monitoring values. Afterwards, it stores values into log files. Logstash instance reads out from those log files as it is configured. Here is a list of metrics expected; Host monitoring: CPU (10 metrics), Networking (4 metrics / interface), Memory (10 metrics), Processes status (5 metrics), Sockets status (10 metrics), Disk status (10 metrics / device), Process monitoring (from the system point of view: CPU, memory profile, handles): 10 metrics / process
29 Action triggering Due to some events might be critical for data taking, an action triggering module should be able to deliver the specific alarm to the required users. It can distribute the alarms via GUI or and should inform other subsystems about the events related to them.
30 Evaluation Data collection and archival Action triggering The Monitoring system should be able to handle between ~ 60kHz to ~544kHz. Both raw and aggregated monitoring data should be able to be visualized and noticed by anyone who are interested in, especially the administrators
31 Conclusion Our Monitoring system for ALICE O2 computing system is designed based on server-agent concept. By adopting ELK stack - Logstash instance on each individual node will read the monitoring data from files and transport those data to the Elasticsearch servers. - Kibana will provide a simple interface to visualize the measurements on both current and historical records. Finally, the action triggering module is able to raise the alarm to the administrators or shifter when it detects an unusual pattern in O2 system.
32 Thank you
33 Q&A
34 References [1] Aamodt, K. et al., The ALICE experiment at the CERN LHC, JINST 3 (2008) S Available: [2] Suaide, A. Alarcon Do Passo, et al., O2: A novel combined online and offline computing system for the ALICE Experiment after 2018., Journal of Physics: Conference Series. Vol No. 1. IOP Publishing, Available: [3] L. Betev, T. Breitner, S. Chapeland, A. Gheata, B. v. Haller, M. Richter, ALICE Computing software framework for LS2 Upgrade. Available: [4] ALICE Collaboration. Technical Design Report for the Upgrade of the Online-Offline Computing System, ALICE-TDR-019, Apr Available: [5] Telesca, Adriana, et al., System performance monitoring of the ALICE Data Acquisition System with Zabbix., Journal of Physics: Conference Series. Vol No. 6. IOP Publishing, [6] C. Grigoras, R. Voicu, N. Tapus, I. Legrand, F. Carminati and L. Betev, MonALISA-based Grid monitoring and control, The European Physical Journal Plus, vol. 126, no. 1, [7] Imamagic, Emir, and Dobrisa Dobrenic. Grid infrastructure monitoring system based on nagios., Proceedings of the 2007 workshop on Grid monitoring. ACM, [8] Marian, Babik, et al., LEMON-LHC Era Monitoring for Large-Scale Infrastructures., Journal of Physics: Conference Series. Vol No. 5. IOP Publishing, [9] K. Fatemaa, V. C. Emeakarohaa, P. D. Healya, J. P. Morrisona, T. Lynn, A Survey of Cloud Monitoring Tools: Taxonomy, Capabilities and Objectives, Journal of Parallel and Distributed Computing, [10] I.C. Legrand et al. MonALISA: An Agent Based, Dynamic Service System to Monitor, Control and Optimize Grid Based Applications, CHEP04, Switzerland, [11] Catalin C. Cirstoiu, Costin C. Grigoras, Latchezar L. Betev, Alexandru A. Costan, Iosif Charles Legrand, Monitoring, accounting and automated decision support for the ALICE experiment based on the MonALISA framework, Proceedings of the 2007 workshop on Grid monitoring, 2007 [12] S. Bagnasco, D. Berzano, A. Guarise, S. Lusso, M. Masera, and S. Vallero, Monitoring of iaas and scientific applications on the cloud using the elasticsearch ecosystem, Journal of Physics: Conference Series, Vol. 608 (IOP Publishing, 2015) pp , Available: [13] CERN; [14] Zabbix; [15] MonALISA; [16] Nagios; [17] LEMON; [18] Elasticsearch; [19] Logstash; [20] Kibana; [21] K. Vandikas, V. Tsiatsis, Performance evaluation of an IoT Platform, Eighth International Conference on Next Generation Mobile Apps, Services and Technologies, NGMAST 2014, IEEE 2014 [22] Bai, Jun. Feasibility analysis of big log data real time search based on Hbase and ElasticSearch. Natural Computation (ICNC), 2013 Ninth International Conference on. IEEE, [23] Lahmadi, Abdelkader, et al. A platform for the analysis and visualization of network flow data of android environments., Integrated Network Management (IM), 2015 IFIP/IEEE International Symposium on. IEEE, 2015.
First-year experience with the ATLAS online monitoring framework
 First-year experience with the ATLAS online monitoring framework A Corso-Radu 1 for the ATLAS TDAQ Collaboration 2 University of California, Department of Physics and Astronomy, 4129 Frederick Reines Hall,
ATLAS job monitoring in the Dashboard Framework
 ATLAS job monitoring in the Dashboard Framework J Andreeva 1, S Campana 1, E Karavakis 1, L Kokoszkiewicz 1, P Saiz 1, L Sargsyan 2, J Schovancova 3, D Tuckett 1 on behalf of the ATLAS Collaboration 1
Real-time Data Analytics mit Elasticsearch. Bernhard Pflugfelder inovex GmbH
 Real-time Data Analytics mit Elasticsearch Bernhard Pflugfelder inovex GmbH Bernhard Pflugfelder Big Data Engineer @ inovex Fields of interest: search analytics big data bi Working with: Lucene Solr Elasticsearch
Elasticsearch on Cisco Unified Computing System: Optimizing your UCS infrastructure for Elasticsearch s analytics software stack
 Elasticsearch on Cisco Unified Computing System: Optimizing your UCS infrastructure for Elasticsearch s analytics software stack HIGHLIGHTS Real-Time Results Elasticsearch on Cisco UCS enables a deeper
Interoperating Cloud-based Virtual Farms
 Stefano Bagnasco, Domenico Elia, Grazia Luparello, Stefano Piano, Sara Vallero, Massimo Venaruzzo For the STOA-LHC Project Interoperating Cloud-based Virtual Farms The STOA-LHC project 1 Improve the robustness
Log management with Logstash and Elasticsearch. Matteo Dessalvi
 Log management with Logstash and Elasticsearch Matteo Dessalvi HEPiX 2013 Outline Centralized logging. Logstash: what you can do with it. Logstash + Redis + Elasticsearch. Grok filtering. Elasticsearch
Analyzing large flow data sets using. visualization tools. modern open-source data search and. FloCon 2014. Max Putas
 Analyzing large flow data sets using modern open-source data search and visualization tools FloCon 2014 Max Putas About me Operations Engineer - DevOps BS, MS, and CAS in Telecommunications Work/research
Processing millions of logs with Logstash
 and integrating with Elasticsearch, Hadoop and Cassandra November 21, 2014 About me My name is Valentin Fischer-Mitoiu and I work for the University of Vienna. More specificaly in a group called Domainis
Tools and strategies to monitor the ATLAS online computing farm
 1 2 3 4 5 6 7 8 9 10 11 12 13 14 15 Tools and strategies to monitor the ATLAS online computing farm S. Ballestrero 1,2, F. Brasolin 3, G. L. Dârlea 1,4, I. Dumitru 4, D. A. Scannicchio 5, M. S. Twomey
Information Retrieval Elasticsearch
 Information Retrieval Elasticsearch IR Information retrieval (IR) is the activity of obtaining information resources relevant to an information need from a collection of information resources. Searches
Log Analysis with the ELK Stack (Elasticsearch, Logstash and Kibana) Gary Smith, Pacific Northwest National Laboratory
 Gary Smith, Pacific Northwest National Laboratory") Log Analysis with the ELK Stack (Elasticsearch, Logstash and Kibana) Gary Smith, Pacific Northwest National Laboratory A Little Context! The Five Golden Principles of Security! Know your system! Principle
Log Analysis with the ELK Stack (Elasticsearch, Logstash and Kibana) Gary Smith, Pacific Northwest National Laboratory A Little Context! The Five Golden Principles of Security! Know your system! Principle
FUJITSU Software ServerView Cloud Monitoring Manager V1 Introduction
 FUJITSU Software ServerView Cloud Monitoring Manager V1 Introduction November 2015 Fujitsu Limited Product Overview 1 Why a Monitoring & Logging OpenStack Service? OpenStack systems are large, complex
Powering Monitoring Analytics with ELK stack
 Powering Monitoring Analytics with ELK stack Abdelkader Lahmadi, Frédéric Beck INRIA Nancy Grand Est, University of Lorraine, France 2015 (compiled on: June 23, 2015) References online Tutorials Elasticsearch
Mobile Analytics. mit Elasticsearch und Kibana. Dominik Helleberg
 Mobile Analytics mit Elasticsearch und Kibana Dominik Helleberg Speaker Dominik Helleberg Mobile Development Android / Embedded Tools http://dominik-helleberg.de/+ Mobile Analytics Warum? Server Software
Computing at the HL-LHC
 Computing at the HL-LHC Predrag Buncic on behalf of the Trigger/DAQ/Offline/Computing Preparatory Group ALICE: Pierre Vande Vyvre, Thorsten Kollegger, Predrag Buncic; ATLAS: David Rousseau, Benedetto Gorini,
World-wide online monitoring interface of the ATLAS experiment
 World-wide online monitoring interface of the ATLAS experiment S. Kolos, E. Alexandrov, R. Hauser, M. Mineev and A. Salnikov Abstract The ATLAS[1] collaboration accounts for more than 3000 members located
BENCHMARKING CLOUD DATABASES CASE STUDY on HBASE, HADOOP and CASSANDRA USING YCSB
 BENCHMARKING CLOUD DATABASES CASE STUDY on HBASE, HADOOP and CASSANDRA USING YCSB Planet Size Data!? Gartner s 10 key IT trends for 2012 unstructured data will grow some 80% over the course of the next
XpoLog Center Suite Log Management & Analysis platform
 XpoLog Center Suite Log Management & Analysis platform Summary: 1. End to End data management collects and indexes data in any format from any machine / device in the environment. 2. Logs Monitoring -
Andrew Moore Amsterdam 2015
 Andrew Moore Amsterdam 2015 Agenda Why log How to log Audit plugins Log analysis Demos Logs [timestamp]: [some useful data] Why log? Error Log Binary Log Slow Log General Log Why log? Why log? Why log?
Using Logstash and Elasticsearch analytics capabilities as a BI tool
 Using Logstash and Elasticsearch analytics capabilities as a BI tool Pashalis Korosoglou, Pavlos Daoglou, Stefanos Laskaridis, Dimitris Daskopoulos Aristotle University of Thessaloniki, IT Center Outline
Efficient Management of System Logs using a Cloud Radoslav Bodó, Daniel Kouřil CESNET. ISGC 2013, March 2013
 Efficient Management of System Logs using a Cloud Radoslav Bodó, Daniel Kouřil CESNET ISGC 2013, March 2013 Agenda Introduction Collecting logs Log Processing Advanced analysis Resume Introduction Status
Database Monitoring Requirements. Salvatore Di Guida (CERN) On behalf of the CMS DB group
 On behalf of the CMS DB group") Database Monitoring Requirements Salvatore Di Guida (CERN) On behalf of the CMS DB group Outline CMS Database infrastructure and data flow. Data access patterns. Requirements coming from the hardware and
Database Monitoring Requirements Salvatore Di Guida (CERN) On behalf of the CMS DB group Outline CMS Database infrastructure and data flow. Data access patterns. Requirements coming from the hardware and
On- Prem MongoDB- as- a- Service Powered by the CumuLogic DBaaS Platform
 On- Prem MongoDB- as- a- Service Powered by the CumuLogic DBaaS Platform Page 1 of 16 Table of Contents Table of Contents... 2 Introduction... 3 NoSQL Databases... 3 CumuLogic NoSQL Database Service...
WHITE PAPER Redefining Monitoring for Today s Modern IT Infrastructures
 WHITE PAPER Redefining Monitoring for Today s Modern IT Infrastructures Modern technologies in Zenoss Service Dynamics v5 enable IT organizations to scale out monitoring and scale back costs, avoid service
Improve performance and availability of Banking Portal with HADOOP
 Improve performance and availability of Banking Portal with HADOOP Our client is a leading U.S. company providing information management services in Finance Investment, and Banking. This company has a
DELL s Oracle Database Advisor
 DELL s Oracle Database Advisor Underlying Methodology A Dell Technical White Paper Database Solutions Engineering By Roger Lopez Phani MV Dell Product Group January 2010 THIS WHITE PAPER IS FOR INFORMATIONAL
Big Data on AWS. Services Overview. Bernie Nallamotu Principle Solutions Architect
 on AWS Services Overview Bernie Nallamotu Principle Solutions Architect \ So what is it? When your data sets become so large that you have to start innovating around how to collect, store, organize, analyze
Integration of IT-DB Monitoring tools into IT General Notification Infrastructure
 Integration of IT-DB Monitoring tools into IT General Notification Infrastructure August 2014 Author: Binathi Bingi Supervisor: David Collados Polidura CERN openlab Summer Student Report 2014 1 Project
Amazon EC2 Product Details Page 1 of 5
 Amazon EC2 Product Details Page 1 of 5 Amazon EC2 Functionality Amazon EC2 presents a true virtual computing environment, allowing you to use web service interfaces to launch instances with a variety of
HTCondor at the RAL Tier-1
 HTCondor at the RAL Tier-1 Andrew Lahiff, Alastair Dewhurst, John Kelly, Ian Collier, James Adams STFC Rutherford Appleton Laboratory HTCondor Week 2014 Outline Overview of HTCondor at RAL Monitoring Multi-core
Development of Monitoring and Analysis Tools for the Huawei Cloud Storage
 Development of Monitoring and Analysis Tools for the Huawei Cloud Storage September 2014 Author: Veronia Bahaa Supervisors: Maria Arsuaga-Rios Seppo S. Heikkila CERN openlab Summer Student Report 2014
How To Use Elasticsearch
 Elasticsearch, Logstash, and Kibana (ELK) Dwight Beaver dsbeaver@cert.org Sean Hutchison shutchison@cert.org January 2015 2014 Carnegie Mellon University This material is based upon work funded and supported
Cloud Computing for Control Systems CERN Openlab Summer Student Program 9/9/2011 ARSALAAN AHMED SHAIKH
 Cloud Computing for Control Systems CERN Openlab Summer Student Program 9/9/2011 ARSALAAN AHMED SHAIKH CONTENTS Introduction... 4 System Components... 4 OpenNebula Cloud Management Toolkit... 4 VMware
Assignment # 1 (Cloud Computing Security)
") Assignment # 1 (Cloud Computing Security) Group Members: Abdullah Abid Zeeshan Qaiser M. Umar Hayat Table of Contents Windows Azure Introduction... 4 Windows Azure Services... 4 1. Compute... 4 a) Virtual
Assignment # 1 (Cloud Computing Security) Group Members: Abdullah Abid Zeeshan Qaiser M. Umar Hayat Table of Contents Windows Azure Introduction... 4 Windows Azure Services... 4 1. Compute... 4 a) Virtual
E-mail: guido.negri@cern.ch, shank@bu.edu, dario.barberis@cern.ch, kors.bos@cern.ch, alexei.klimentov@cern.ch, massimo.lamanna@cern.
 *a, J. Shank b, D. Barberis c, K. Bos d, A. Klimentov e and M. Lamanna a a CERN Switzerland b Boston University c Università & INFN Genova d NIKHEF Amsterdam e BNL Brookhaven National Laboratories E-mail:
April 8th - 10th, 2014 LUG14 LUG14. Lustre Log Analyzer. Kalpak Shah. DataDirect Networks. ddn.com. 2014 DataDirect Networks. All Rights Reserved.
 April 8th - 10th, 2014 LUG14 LUG14 Lustre Log Analyzer Kalpak Shah DataDirect Networks Lustre Log Analysis Requirements Need scripts to parse Lustre debug logs Only way to effectively use the logs for
Deploying Hadoop with Manager
 Deploying Hadoop with Manager SUSE Big Data Made Easier Peter Linnell / Sales Engineer plinnell@suse.com Alejandro Bonilla / Sales Engineer abonilla@suse.com 2 Hadoop Core Components 3 Typical Hadoop Distribution
Big Data for Satellite Business Intelligence
 Big Data for Satellite Business Intelligence GSAW 2015 Loic COULET, Kratos ISE 2015 by Kratos ISE. Published by The Aerospace Corporation with permission. Who s talking? Computer Science Passionate Kratos
Dashboard applications to monitor experiment activities at sites
 Home Search Collections Journals About Contact us My IOPscience Dashboard applications to monitor experiment activities at sites This content has been downloaded from IOPscience. Please scroll down to
Blackboard Open Source Monitoring
 Blackboard Open Source Monitoring By Greg Lloyd Submitted to the Faculty of the School of Information Technology in Partial Fulfillment of the Requirements for the Degree of Bachelor of Science in Information
Comparative Analysis of Open-Source Log Management Solutions for Security Monitoring and Network Forensics
 Comparative Analysis of Open-Source Log Management Solutions for Security Monitoring and Network Forensics Risto Vaarandi, Paweł Niziski NATO Cooperative Cyber Defence Centre of Excellence, Tallinn, Estonia
Datasheet FUJITSU Software ServerView Cloud Monitoring Manager V1.0
 Datasheet FUJITSU Software ServerView Cloud Monitoring Manager V1.0 Datasheet FUJITSU Software ServerView Cloud Monitoring Manager V1.0 A Monitoring Cloud Service for Enterprise OpenStack Systems Cloud
Evaluation and implementation of CEP mechanisms to act upon infrastructure metrics monitored by Ganglia
 Project report CERN Summer Student Programme Evaluation and implementation of CEP mechanisms to act upon infrastructure metrics monitored by Ganglia Author: Martin Adam Supervisors: Cristovao Cordeiro,
TECHNOLOGY WHITE PAPER Jun 2012
 TECHNOLOGY WHITE PAPER Jun 2012 Technology Stack C# Windows Server 2008 PHP Amazon Web Services (AWS) Route 53 Elastic Load Balancing (ELB) Elastic Compute Cloud (EC2) Amazon RDS Amazon S3 Elasticache
Full-text Search in Intermediate Data Storage of FCART
 Full-text Search in Intermediate Data Storage of FCART Alexey Neznanov, Andrey Parinov National Research University Higher School of Economics, 20 Myasnitskaya Ulitsa, Moscow, 101000, Russia ANeznanov@hse.ru,
Maintaining Non-Stop Services with Multi Layer Monitoring
 Maintaining Non-Stop Services with Multi Layer Monitoring Lahav Savir System Architect and CEO of Emind Systems lahavs@emindsys.com www.emindsys.com The approach Non-stop applications can t leave on their
The Data Quality Monitoring Software for the CMS experiment at the LHC
 The Data Quality Monitoring Software for the CMS experiment at the LHC On behalf of the CMS Collaboration Marco Rovere, CERN CHEP 2015 Evolution of Software and Computing for Experiments Okinawa, Japan,
Building a logging pipeline with Open Source tools. Iñigo Ortiz de Urbina Cazenave
 Building a logging pipeline with Open Source tools Iñigo Ortiz de Urbina Cazenave NLUUG Utrecht - Netherlands 28 May 2015 whoami; 2 Iñigo Ortiz de Urbina Cazenave Systems Engineer whoami; groups; 3 Iñigo
Developing Scalable Smart Grid Infrastructure to Enable Secure Transmission System Control
 Developing Scalable Smart Grid Infrastructure to Enable Secure Transmission System Control EP/K006487/1 UK PI: Prof Gareth Taylor (BU) China PI: Prof Yong-Hua Song (THU) Consortium UK Members: Brunel University
A REVIEW PAPER ON THE HADOOP DISTRIBUTED FILE SYSTEM
 A REVIEW PAPER ON THE HADOOP DISTRIBUTED FILE SYSTEM Sneha D.Borkar 1, Prof.Chaitali S.Surtakar 2 Student of B.E., Information Technology, J.D.I.E.T, sborkar95@gmail.com Assistant Professor, Information
FREE AND OPEN SOURCE SOFTWARE FOR CLOUD COMPUTING SERENA SPINOSO (serena.spinoso@polito.it) FULVIO VALENZA (fulvio.valenza@polito.
 FULVIO VALENZA (fulvio.valenza@polito.") + FREE AND OPEN SOURCE SOFTWARE FOR CLOUD COMPUTING SERENA SPINOSO (serena.spinoso@polito.it) FULVIO VALENZA (fulvio.valenza@polito.it) + OUTLINE INTRODUCTION OF CLOUD DEFINITION OF CLOUD BASIC CLOUD COMPONENTS
+ FREE AND OPEN SOURCE SOFTWARE FOR CLOUD COMPUTING SERENA SPINOSO (serena.spinoso@polito.it) FULVIO VALENZA (fulvio.valenza@polito.it) + OUTLINE INTRODUCTION OF CLOUD DEFINITION OF CLOUD BASIC CLOUD COMPONENTS
Web based monitoring in the CMS experiment at CERN
 FERMILAB-CONF-11-765-CMS-PPD International Conference on Computing in High Energy and Nuclear Physics (CHEP 2010) IOP Publishing Web based monitoring in the CMS experiment at CERN William Badgett 1, Irakli
THE ATLAS DISTRIBUTED DATA MANAGEMENT SYSTEM & DATABASES
 THE ATLAS DISTRIBUTED DATA MANAGEMENT SYSTEM & DATABASES Vincent Garonne, Mario Lassnig, Martin Barisits, Thomas Beermann, Ralph Vigne, Cedric Serfon Vincent.Garonne@cern.ch ph-adp-ddm-lab@cern.ch XLDB
Managing a Tier-2 Computer Centre with a Private Cloud Infrastructure
 Managing a Tier-2 Computer Centre with a Private Cloud Infrastructure Stefano Bagnasco, Riccardo Brunetti, Stefano Lusso (INFN-Torino), Dario Berzano (CERN) ACAT2013 Beijing, May 16-21, 2013 motivation
Hadoop & Spark Using Amazon EMR
 Hadoop & Spark Using Amazon EMR Michael Hanisch, AWS Solutions Architecture 2015, Amazon Web Services, Inc. or its Affiliates. All rights reserved. Agenda Why did we build Amazon EMR? What is Amazon EMR?
SCF/FEF Evaluation of Nagios and Zabbix Monitoring Systems. Ed Simmonds and Jason Harrington 7/20/2009
 SCF/FEF Evaluation of Nagios and Zabbix Monitoring Systems Ed Simmonds and Jason Harrington 7/20/2009 Introduction For FEF, a monitoring system must be capable of monitoring thousands of servers and tens
Efficient Management of System Logs using a Cloud
 , CESNET z.s.p.o.,zikova 4, 160 00 Praha 6, Czech Republic and University of West Bohemia,Univerzitní 8, 306 14 Pilsen, Czech Republic E-mail: bodik@civ.zcu.cz Daniel Kouřil, CESNET z.s.p.o.,zikova 4,
MADOCA II Data Logging System Using NoSQL Database for SPring-8
 MADOCA II Data Logging System Using NoSQL Database for SPring-8 A.Yamashita and M.Kago SPring-8/JASRI, Japan NoSQL WED3O03 OR: How I Learned to Stop Worrying and Love Cassandra Outline SPring-8 logging
Large scale processing using Hadoop. Ján Vaňo
 Large scale processing using Hadoop Ján Vaňo What is Hadoop? Software platform that lets one easily write and run applications that process vast amounts of data Includes: MapReduce offline computing engine
OpenAdmin Tool for Informix (OAT) October 2012
 October 2012") OpenAdmin Tool for Informix (OAT) October 2012 What is OpenAdmin Tool for Informix? OAT is a web-based administration tool for the IBM Informix database server A single OAT installation can administer
OpenAdmin Tool for Informix (OAT) October 2012 What is OpenAdmin Tool for Informix? OAT is a web-based administration tool for the IBM Informix database server A single OAT installation can administer
Data Quality Monitoring. DAQ@LHC workshop
 Data Quality Monitoring DAQ@LHC workshop Introduction What this presentation is not What it is and how it is organized Definition of DQM Overview of systems and frameworks Specific chosen aspects o Data
CRITEO INTERNSHIP PROGRAM 2015/2016
 CRITEO INTERNSHIP PROGRAM 2015/2016 A. List of topics PLATFORM Topic 1: Build an API and a web interface on top of it to manage the back-end of our third party demand component. Challenge(s): Working with
Shoal: IaaS Cloud Cache Publisher
 University of Victoria Faculty of Engineering Winter 2013 Work Term Report Shoal: IaaS Cloud Cache Publisher Department of Physics University of Victoria Victoria, BC Mike Chester V00711672 Work Term 3
WEBAPP PATTERN FOR APACHE TOMCAT - USER GUIDE
 WEBAPP PATTERN FOR APACHE TOMCAT - USER GUIDE Contents 1. Pattern Overview... 3 Features 3 Getting started with the Web Application Pattern... 3 Accepting the Web Application Pattern license agreement...
GigaSpaces Real-Time Analytics for Big Data
 GigaSpaces Real-Time Analytics for Big Data GigaSpaces makes it easy to build and deploy large-scale real-time analytics systems Rapidly increasing use of large-scale and location-aware social media and
AGENDA: INTRODUCTION: 1. How is our cloud monitoring setup? 2. Which are the tools used? 3. How do we access monitoring dashboard?
 Nagios Introduction AGENDA: INTRODUCTION: 1. How is our cloud monitoring setup? 2. Which are the tools used? 3. How do we access monitoring dashboard? 4. What are the user id / password? 5. How to check
Bernd Ahlers Michael Friedrich. Log Monitoring Simplified Get the best out of Graylog2 & Icinga 2
 Bernd Ahlers Michael Friedrich Log Monitoring Simplified Get the best out of Graylog2 & Icinga 2 BEFORE WE START Agenda AGENDA Introduction Tools Log History Logs & Monitoring Demo The Future Resources
Zynga Analytics Leveraging Big Data to Make Games More Fun and Social
 Connecting the World Through Games Zynga Analytics Leveraging Big Data to Make Games More Fun and Social Daniel McCaffrey General Manager, Platform and Analytics Engineering World s leading social game
Lustre Monitoring with OpenTSDB
 Lustre Monitoring with OpenTSDB 2015/9/22 DataDirect Networks Japan, Inc. Shuichi Ihara 2 Lustre Monitoring Background Lustre is a black box Users and Administrators want to know what s going on? Find
A Survey Study on Monitoring Service for Grid
 A Survey Study on Monitoring Service for Grid Erkang You erkyou@indiana.edu ABSTRACT Grid is a distributed system that integrates heterogeneous systems into a single transparent computer, aiming to provide
Real Time Big Data Processing
 Real Time Big Data Processing Cloud Expo 2014 Ian Meyers Amazon Web Services Global Infrastructure Deployment & Administration App Services Analytics Compute Storage Database Networking AWS Global Infrastructure
Client Overview. Engagement Situation. Key Requirements
 Client Overview Our client is one of the leading providers of business intelligence systems for customers especially in BFSI space that needs intensive data analysis of huge amounts of data for their decision
NetEye Release Notes 2015 - Version 3.5
 NetEye Release Notes 2015 - Version 3.5 This document provides an overview of the new features and enhancements released on the WÜRTHPHOENIX NetEye version 3.5. Higher Performance, Better Reliability and
A New Approach to Network Visibility at UBC. Presented by the Network Management Centre and Wireless Infrastructure Teams
 A New Approach to Network Visibility at UBC Presented by the Network Management Centre and Wireless Infrastructure Teams Agenda Business Drivers Technical Overview Network Packet Broker Tool Network Monitoring
The next generation of ATLAS PanDA Monitoring
 The next generation of ATLAS PanDA Monitoring Jaroslava Schovancová E-mail: jschovan@bnl.gov Kaushik De University of Texas in Arlington, Department of Physics, Arlington TX, United States of America Alexei
Hadoop implementation of MapReduce computational model. Ján Vaňo
 Hadoop implementation of MapReduce computational model Ján Vaňo What is MapReduce? A computational model published in a paper by Google in 2004 Based on distributed computation Complements Google s distributed
Online Performance Monitoring of the Third ALICE Data Challenge (ADC III)
") EUROPEAN ORGANIZATION FOR NUCLEAR RESEARCH European Laboratory for Particle Physics Publication ALICE reference number ALICE-PUB-1- version 1. Institute reference number Date of last change 1-1-17 Online
EUROPEAN ORGANIZATION FOR NUCLEAR RESEARCH European Laboratory for Particle Physics Publication ALICE reference number ALICE-PUB-1- version 1. Institute reference number Date of last change 1-1-17 Online
Apache Hadoop. Alexandru Costan
 1 Apache Hadoop Alexandru Costan Big Data Landscape No one-size-fits-all solution: SQL, NoSQL, MapReduce, No standard, except Hadoop 2 Outline What is Hadoop? Who uses it? Architecture HDFS MapReduce Open
The Cloud to the rescue!
 The Cloud to the rescue! What the Google Cloud Platform can make for you Aja Hammerly, Developer Advocate twitter.com/thagomizer_rb So what is the cloud? The Google Cloud Platform The Google Cloud Platform
How To Monitor Your Computer With Nagiostee.Org (Nagios)
") Host and Service Monitoring at SLAC Alf Wachsmann Stanford Linear Accelerator Center alfw@slac.stanford.edu DESY Zeuthen, May 17, 2005 Monitoring at SLAC Alf Wachsmann 1 Monitoring at SLAC: Does not really
Host and Service Monitoring at SLAC Alf Wachsmann Stanford Linear Accelerator Center alfw@slac.stanford.edu DESY Zeuthen, May 17, 2005 Monitoring at SLAC Alf Wachsmann 1 Monitoring at SLAC: Does not really
Databricks. A Primer
 Databricks A Primer Who is Databricks? Databricks vision is to empower anyone to easily build and deploy advanced analytics solutions. The company was founded by the team who created Apache Spark, a powerful
TDAQ Analytics Dashboard
 14 October 2010 ATL-DAQ-SLIDE-2010-397 TDAQ Analytics Dashboard A real time analytics web application Outline Messages in the ATLAS TDAQ infrastructure Importance of analysis A dashboard approach Architecture
Database Services for Physics @ CERN
 Database Services for Physics @ CERN Deployment and Monitoring Radovan Chytracek CERN IT Department Outline Database services for physics Status today How we do the services tomorrow? Performance tuning
Scaling Graphite Installations
 Scaling Graphite Installations Graphite basics Graphite is a web based Graphing program for time series data series plots. Written in Python Consists of multiple separate daemons Has it's own storage backend
Reference Architecture, Requirements, Gaps, Roles
 Reference Architecture, Requirements, Gaps, Roles The contents of this document are an excerpt from the brainstorming document M0014. The purpose is to show how a detailed Big Data Reference Architecture
FOXBORO. I/A Series SOFTWARE Product Specifications. I/A Series Intelligent SCADA SCADA Platform PSS 21S-2M1 B3 OVERVIEW
 I/A Series SOFTWARE Product Specifications Logo I/A Series Intelligent SCADA SCADA Platform PSS 21S-2M1 B3 The I/A Series Intelligent SCADA Platform takes the traditional SCADA Master Station to a new
BIG DATA IN THE CLOUD : CHALLENGES AND OPPORTUNITIES MARY- JANE SULE & PROF. MAOZHEN LI BRUNEL UNIVERSITY, LONDON
 BIG DATA IN THE CLOUD : CHALLENGES AND OPPORTUNITIES MARY- JANE SULE & PROF. MAOZHEN LI BRUNEL UNIVERSITY, LONDON Overview * Introduction * Multiple faces of Big Data * Challenges of Big Data * Cloud Computing
No file left behind - monitoring transfer latencies in PhEDEx
 FERMILAB-CONF-12-825-CD International Conference on Computing in High Energy and Nuclear Physics 2012 (CHEP2012) IOP Publishing No file left behind - monitoring transfer latencies in PhEDEx T Chwalek a,
Next Generation Operating Systems
 Next Generation Operating Systems Zeljko Susnjar, Cisco CTG June 2015 The end of CPU scaling Future computing challenges Power efficiency Performance == parallelism Cisco Confidential 2 Paradox of the
A multi-dimensional view on information retrieval of CMS data
 A multi-dimensional view on information retrieval of CMS data A. Dolgert, L. Gibbons, V. Kuznetsov, C. D. Jones, D. Riley Cornell University, Ithaca, NY 14853, USA E-mail: vkuznet@gmail.com Abstract. The
Modern Web development and operations practices. Grig Gheorghiu VP Tech Operations Nasty Gal Inc. @griggheo
 Modern Web development and operations practices Grig Gheorghiu VP Tech Operations Nasty Gal Inc. @griggheo Modern Web stack Aim for horizontal scalability! Ruby/Python front-end servers (Sinatra/Padrino,
Architectural patterns for building real time applications with Apache HBase. Andrew Purtell Committer and PMC, Apache HBase
 Architectural patterns for building real time applications with Apache HBase Andrew Purtell Committer and PMC, Apache HBase Who am I? Distributed systems engineer Principal Architect in the Big Data Platform
Monitoring Large Scale Network Topologies
 Monitoring Large Scale Network Topologies Ciprian Dobre 1, Ramiro Voicu 2, Iosif Legrand 3 1 University POLITEHNICA of Bucharest, Spl. Independentei 313, Romania, ciprian.dobre@cs.pub.ro 2 California Institute
BASHO DATA PLATFORM SIMPLIFIES BIG DATA, IOT, AND HYBRID CLOUD APPS
 WHITEPAPER BASHO DATA PLATFORM BASHO DATA PLATFORM SIMPLIFIES BIG DATA, IOT, AND HYBRID CLOUD APPS INTRODUCTION Big Data applications and the Internet of Things (IoT) are changing and often improving our
Hadoop. http://hadoop.apache.org/ Sunday, November 25, 12
 Hadoop http://hadoop.apache.org/ What Is Apache Hadoop? The Apache Hadoop software library is a framework that allows for the distributed processing of large data sets across clusters of computers using
MONITORING RED HAT GLUSTER SERVER DEPLOYMENTS With the Nagios IT infrastructure monitoring tool
 TECHNOLOGY DETAIL MONITORING RED HAT GLUSTER SERVER DEPLOYMENTS With the Nagios IT infrastructure monitoring tool INTRODUCTION Storage system monitoring is a fundamental task for a storage administrator.
Hadoop IST 734 SS CHUNG
 Hadoop IST 734 SS CHUNG Introduction What is Big Data?? Bulk Amount Unstructured Lots of Applications which need to handle huge amount of data (in terms of 500+ TB per day) If a regular machine need to
Google Cloud Platform The basics
 Google Cloud Platform The basics Who I am Alfredo Morresi ROLE Developer Relations Program Manager COUNTRY Italy PASSIONS Community, Development, Snowboarding, Tiramisu' Reach me alfredomorresi@google.com
InfiniteGraph: The Distributed Graph Database
 A Performance and Distributed Performance Benchmark of InfiniteGraph and a Leading Open Source Graph Database Using Synthetic Data Objectivity, Inc. 640 West California Ave. Suite 240 Sunnyvale, CA 94086