A New Approach to Network Visibility at UBC. Presented by the Network Management Centre and Wireless Infrastructure Teams
|
|
|
- Beatrix Black
- 8 years ago
- Views:
Transcription
1 A New Approach to Network Visibility at UBC Presented by the Network Management Centre and Wireless Infrastructure Teams

2 Agenda Business Drivers Technical Overview Network Packet Broker Tool Network Monitoring Tool Data Analytics and Visualization Tool Q&A 2

3 Agenda Business Drivers Technical Overview Network Packet Broker Tool Network Monitoring Tool Data Analytics and Visualization Tool Q&A 3

4 University Services 4

5 Business Requirements High availability High performance Virtualized Secure 5

6 Why is Visibility Needed? Client Experience Application Performance NEED VISIBILITY Data Centre Security 6

7 Challenges Life cycling needed Complex network with multiple paths Highly virtualized infrastructure Budget $$$$ 7

8 Agenda Business Drivers Technical Overview Network Packet Broker Tool Network Monitoring Tool Data Analytics and Visualization Tool Q&A 8

9 Overview of UBCNet 9

10 Visibility of Physical and Virtual Networks A virtual network spans multiple network devices Collect network information from multiple sources 10

11 Multiple Sources of Network Information Netflow Many devices Collector (Netflow Analyzer, StealthWatch) SNMP Many devices Tool (Statseeker, Intermapper) Logs Many devices Tool (Kibana-Elasticsearch) Real network traffic One or many Tool (WireShark, Cisco NAM, WildPacket, IDS/IPS) 11

12 Traditional Approach Manage large number of tools and span sessions Separated tools and information make analysis difficult 12

13 Need a New Approach Manage much less number of tools and span sessions Single tool and information make analysis much easier 13

14 Why Network Packet Brokers? Many-to-many port mapping for real-time adjustments of packet flow. Filtering of packet data based on the characteristics found in the packet headers. Packet slicing and de-duplication that allows a subset of the full packet data to be passed to the monitoring device. Aggregating multiple packet stream inputs into one larger stream, or balancing one large stream into several smaller streams. Insertion of hardware-based time stamps that monitoring tools can use to take more accurate measurements. (Gartner Analyst Jonah Kowall, April 2012) 14

15 Agenda Business Drivers Technical Overview Network Packet Broker Tool Network Monitoring Tool Data Analytics and Visualization Tool Q&A 15

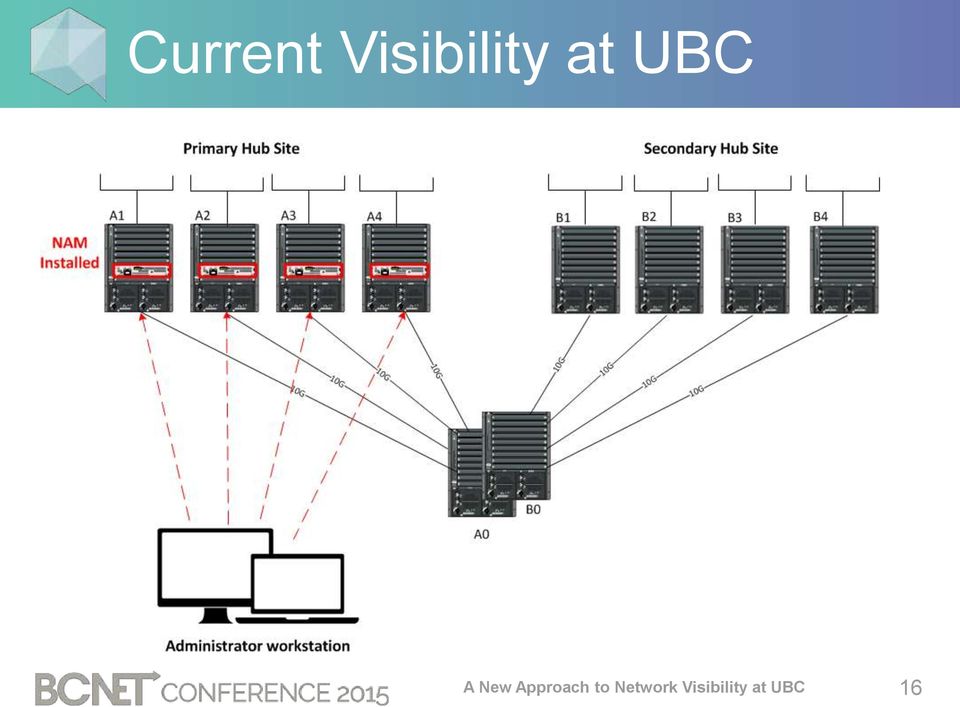
16 Current Visibility at UBC 16
17 Future Visibility at UBC 17

18 APCON: Main Panel Network ports (Ingress) Tool ports (Egress) 18


19 APCON: Port Mapping 19


20 APCON: Traffic Filtering 20


21 APCON: Advanced Features 21


22 APCON: Protocol Stripping 22
23 APCON: Blade/Port Status 23
24 Agenda Business Drivers Technical Overview Network Packet Broker Tool Network Monitoring Tool Data Analytics and Visualization Tool Q&A 24
25 Network Monitoring Tool: Agenda Challenges What is Statseeker? Advantages Use Cases Troubleshooting Proactive Alerting Baseline Traffic Aggregation 25
26 Challenges Limited visibility What s happening on this part of the network? Troubleshooting Is it a network issue? No baseline What is normal? 26
27 What is Statseeker? Statseeker - Commercial product - Charts network statistics including bandwidth, latency, utilization, errors, discards, CPU, memory and temperature. - Threshold and alerting - Syslog 27
28 Statseeker: Advantages Fast! Small footprint 1 VM monitoring over 1000 switch stacks, and 100,000 ports Polls every 60 seconds Keeps data indefinitely with original granularity 28
29 Use Cases Troubleshooting Proactive alerting Baseline 29
30 Troubleshooting Troubleshooting with Network Statistics Does the time of the issue correlate with traffic dips / spikes? Are other ports experiencing the same issue? How about other switches? Track down source of traffic dip / spike Any errors or discards on the ports? 30
31 Example 1 Unicast Storm 31
32 Example 2 High Utilization 32
33 Example 3 Compromised Server 33
34 Example 4 DOS Attack 34
35 Example 5 High Errors 35
36 Proactive Alerting High CPU, interface down, syslog matches 36
37 Baseline Do we need to increase bandwidth on any interfaces? Someone wants to upgrade their uplink from 1 Gbps to 10 Gbps. Do the traffic patterns justify the upgrade? Able to see historical trends, and anticipate growth requirements 37
38 Example: Traffic Utilization Traffic Utilization over 30 days 38

39 Traffic Aggregation Total traffic of multiple interfaces 39
40 Traffic Aggregation 40
41 Agenda Business Drivers Technical Overview Network Packet Broker Tool Network Monitoring Tool Data Analytics and Visualization Tool Q&A 41
42 Data Analytics with ELK = 42
43 ELK: How? By using free and open source software Elasticsearch database optimized for search Logstash Parse any data Kibana HTML visualization frontend All components are horizontally scalable Current deployment has about 20 Virtual Machines 5 VM s for central syslog, 2 REDIS queues, 2 logstash parsers, and 11 Elasticsearch database servers These VM s handle 100 million log events daily, about 100 gig per day on disk 43
44 ELK: Architecture Logstash Forwarder (LSF) is a lightweight daemon that forwards logs from your application/server to Logstash Logstash gets the log from LSF, or acts as a Central Syslog receiver (udp/514) from other network devices (switches, servers, etc). It sends those logs into a REDIS queue for processing Logstash Parser pulls the logs from REDIS and parses/converts them into a format that can easily be searched by Elasticsearch The Elasticsearch cluster contains dedicated master nodes (esm1-3), client load balancer (esc1-2) and data nodes (es1-6). Each data node has 32GB Ram and 2TB disk. The Kibana3 GUI and Kibana4 beta provide user access to the log data 44
45 ELK: Logstash Input: File, syslog, udp (netflow) Filters: grok, mutate, GeoIP, replace, split, clone Output: Elasticsearch, REDIS, file Many, many Common timestamp format Easy to convert timestamps from various applications, devices, and servers into one standard format Data manipulation All MAC Addresses have the same format. Any MAC s that come in as aabb.ccdd.eeff or aa:bb:cc:dd:ee:ff are converted to aa-bbcc-dd-ee-ff to make searching the different datasets easier 45
46 ELK Dashboard: Wireless user
47 ELK Dashboard: Wireless Overview
48 ELK Dashboard: TACACS
49 Agenda Business Drivers Technical Overview Network Packet Broker Tool Network Monitoring Tool Data Analytics and Visualization Tool Q&A 49
50 Q&A Any questions? 50
51 Contacts Amy Osman Network Analyst, Network Management Centre Solomon Huang Network Analyst, Network Management Centre Jeremy Cohoe Network Analyst, Wireless Infrastructure Sean Wang Network Architect, Network Management Centre Miranda Chiu Manager, Network Management Centre 51
52 Photo Credits Slide 4: University Services 1. Erhardt, Don, The multi-purpose Franklin Lew Forum at Allard Hall., 2. Baer, Rhoda, Researcher Looking Through Microscope, g/product_data_sheet0900aecd802ff012.html Grigoryan, Arthur, Videoconference classroom, TedxVancouver c/o Maurice Li, TEDxVancouver 2011, UBC Chan Centre, 9. Sistoiv, POS device (Italy), Slide 5: Business Requirements 1. Zammit, Jared, Blue fibre, 2. Samollov, Yuri, System Lock, 52
53 The End Thank you for your interest! 53
How To Set Up Foglight Nms For A Proof Of Concept
 Page 1 of 5 Foglight NMS Overview Foglight Network Management System (NMS) is a robust and complete network monitoring solution that allows you to thoroughly and efficiently manage your network. It is
Network Monitoring Comparison
 Network Monitoring Comparison vs Network Monitoring is essential for every network administrator. It determines how effective your IT team is at solving problems or even completely eliminating them. Even
Log Management with Open-Source Tools. Risto Vaarandi SEB Estonia
 Log Management with Open-Source Tools Risto Vaarandi SEB Estonia Outline Why use open source tools for log management? Widely used logging protocols and recently introduced new standards Open-source syslog
Logging on a Shoestring Budget
 UNIVERSITY OF NEBRASKA AT OMAHA Logging on a Shoestring Budget James Harr jharr@unomaha.edu Agenda The Tools ElasticSearch Logstash Kibana redis Composing a Log System Q&A, Conclusions, Lessons Learned
Real-time Data Analytics mit Elasticsearch. Bernhard Pflugfelder inovex GmbH
 Real-time Data Analytics mit Elasticsearch Bernhard Pflugfelder inovex GmbH Bernhard Pflugfelder Big Data Engineer @ inovex Fields of interest: search analytics big data bi Working with: Lucene Solr Elasticsearch
Analyzing large flow data sets using. visualization tools. modern open-source data search and. FloCon 2014. Max Putas
 Analyzing large flow data sets using modern open-source data search and visualization tools FloCon 2014 Max Putas About me Operations Engineer - DevOps BS, MS, and CAS in Telecommunications Work/research
Elasticsearch on Cisco Unified Computing System: Optimizing your UCS infrastructure for Elasticsearch s analytics software stack
 Elasticsearch on Cisco Unified Computing System: Optimizing your UCS infrastructure for Elasticsearch s analytics software stack HIGHLIGHTS Real-Time Results Elasticsearch on Cisco UCS enables a deeper
Towards Smart and Intelligent SDN Controller
 Towards Smart and Intelligent SDN Controller - Through the Generic, Extensible, and Elastic Time Series Data Repository (TSDR) YuLing Chen, Dell Inc. Rajesh Narayanan, Dell Inc. Sharon Aicler, Cisco Systems
Best Practices for Network Monitoring How a Network Monitoring Switch Helps IT Teams Stay Proactive
 White Paper Best Practices for Network Monitoring How a Network Monitoring Switch Helps IT Teams Stay Proactive 26601 Agoura Road, Calabasas, CA 91302 Tel: 818.871.1800 Fax: 818.871.1805 www.ixiacom.com
Cisco IOS Flexible NetFlow Technology
 Cisco IOS Flexible NetFlow Technology Last Updated: December 2008 The Challenge: The ability to characterize IP traffic and understand the origin, the traffic destination, the time of day, the application
Tool Optimization. Benefits. Introduction. Technical Brief. Extend the usage life of tools and avoid costly upgrades
 Tool Optimization Technical Brief Benefits Extend the usage life of tools and avoid costly upgrades Increase the accuracy and results of data analysis Extend capacity of storage media by optimizing data
Solving Monitoring Challenges in the Data Center
 Solving Monitoring Challenges in the Data Center How a network monitoring switch helps IT teams stay proactive White Paper IT teams are under big pressure to improve the performance and security of corporate
Multi Stage Filtering
 Multi Stage Filtering Technical Brief With the increasing traffic volume in modern data centers, largely driven by e-business and mobile devices, network and application performance monitoring has become
Log Management with Open-Source Tools. Risto Vaarandi rvaarandi 4T Y4H00 D0T C0M
 Log Management with Open-Source Tools Risto Vaarandi rvaarandi 4T Y4H00 D0T C0M Outline Why do we need log collection and management? Why use open source tools? Widely used logging protocols and recently
Enabling Visibility for Wireshark across Physical, Virtual and SDN. Patrick Leong, CTO Gigamon
 Enabling Visibility for Wireshark across Physical, Virtual and SDN Patrick Leong, CTO Gigamon 1 Agenda A review of the network then and now Challenges in network monitoring and security Introduction to
SOLARWINDS NETWORK PERFORMANCE MONITOR
 DATASHEET SOLARWINDS NETWORK PERFORMANCE MONITOR Fault, Availability, Performance, and Deep Packet Inspection SolarWinds Network Performance Monitor (NPM) is powerful and affordable network monitoring
Using Logstash and Elasticsearch analytics capabilities as a BI tool
 Using Logstash and Elasticsearch analytics capabilities as a BI tool Pashalis Korosoglou, Pavlos Daoglou, Stefanos Laskaridis, Dimitris Daskopoulos Aristotle University of Thessaloniki, IT Center Outline
VCS Monitoring and Troubleshooting Using Brocade Network Advisor
 VCS Monitoring and Troubleshooting Using Brocade Network Advisor Brocade Network Advisor is a unified network management platform to manage the entire Brocade network, including both SAN and IP products.
Innovative, High-Density, Massively Scalable Packet Capture and Cyber Analytics Cluster for Enterprise Customers
 Innovative, High-Density, Massively Scalable Packet Capture and Cyber Analytics Cluster for Enterprise Customers The Enterprise Packet Capture Cluster Platform is a complete solution based on a unique
How To Use Elasticsearch
 Elasticsearch, Logstash, and Kibana (ELK) Dwight Beaver dsbeaver@cert.org Sean Hutchison shutchison@cert.org January 2015 2014 Carnegie Mellon University This material is based upon work funded and supported
Flow Analysis Versus Packet Analysis. What Should You Choose?
 Flow Analysis Versus Packet Analysis. What Should You Choose? www.netfort.com Flow analysis can help to determine traffic statistics overall, but it falls short when you need to analyse a specific conversation
SolarWinds Network Performance Monitor
 SolarWinds Network Performance Monitor powerful network fault & availabilty management Fully Functional for 30 Days SolarWinds Network Performance Monitor (NPM) makes it easy to quickly detect, diagnose,
Enhancing Cisco Networks with Gigamon // White Paper
 Across the globe, many companies choose a Cisco switching architecture to service their physical and virtual networks for enterprise and data center operations. When implementing a large-scale Cisco network,
SolarWinds Network Performance Monitor powerful network fault & availabilty management
 SolarWinds Network Performance Monitor powerful network fault & availabilty management Fully Functional for 30 Days SolarWinds Network Performance Monitor (NPM) is powerful and affordable network monitoring
Efficient Management of System Logs using a Cloud Radoslav Bodó, Daniel Kouřil CESNET. ISGC 2013, March 2013
 Efficient Management of System Logs using a Cloud Radoslav Bodó, Daniel Kouřil CESNET ISGC 2013, March 2013 Agenda Introduction Collecting logs Log Processing Advanced analysis Resume Introduction Status
Elevating Data Center Performance Management
 Elevating Data Center Performance Management Data Center innovation reduces operating expense, maximizes employee productivity, and generates new sources of revenue. However, many I&O teams lack proper
Log managing at PIC. A. Bruno Rodríguez Rodríguez. Port d informació científica Campus UAB, Bellaterra Barcelona. December 3, 2013
 Log managing at PIC A. Bruno Rodríguez Rodríguez Port d informació científica Campus UAB, Bellaterra Barcelona December 3, 2013 Bruno Rodríguez (PIC) Log managing at PIC December 3, 2013 1 / 21 What will
Wireshark Developer and User Conference
 Wireshark Developer and User Conference Using NetFlow to Analyze Your Network June 15 th, 2011 Christopher J. White Manager Applica6ons and Analy6cs, Cascade Riverbed Technology cwhite@riverbed.com SHARKFEST
Log management with Logstash and Elasticsearch. Matteo Dessalvi
 Log management with Logstash and Elasticsearch Matteo Dessalvi HEPiX 2013 Outline Centralized logging. Logstash: what you can do with it. Logstash + Redis + Elasticsearch. Grok filtering. Elasticsearch
Network Metrics Content Pack for VMware vrealize Log Insight
 Network Metrics Content Pack for VMware vrealize Log Insight User Manual Version 2.1 June, 2015 Copyright 2012-2015 NetFlow Logic Corporation. All rights reserved. Patents Pending. Contents Introduction...
Maintaining Non-Stop Services with Multi Layer Monitoring
 Maintaining Non-Stop Services with Multi Layer Monitoring Lahav Savir System Architect and CEO of Emind Systems lahavs@emindsys.com www.emindsys.com The approach Non-stop applications can t leave on their
TORNADO Solution for Telecom Vertical
 BIG DATA ANALYTICS & REPORTING TORNADO Solution for Telecom Vertical Overview Last decade has see a rapid growth in wireless and mobile devices such as smart- phones, tablets and netbook is becoming very
Minder. simplifying IT. All-in-one solution to monitor Network, Server, Application & Log Data
 Minder simplifying IT All-in-one solution to monitor Network, Server, Application & Log Data Simplify the Complexity of Managing Your IT Environment... To help you ensure the availability and performance
Beyond Monitoring Root-Cause Analysis
 WHITE PAPER With the introduction of NetFlow and similar flow-based technologies, solutions based on flow-based data have become the most popular methods of network monitoring. While effective, flow-based
SolarWinds Network Performance Monitor
 SolarWinds Network Performance Monitor powerful network fault & availabilty management Fully Functional for 30 Days SolarWinds Network Performance Monitor (NPM) makes it easy to quickly detect, diagnose,
Using The Paessler PRTG Traffic Grapher In a Cisco Wide Area Application Services Proof of Concept
 Using The Paessler PRTG Traffic Grapher In a Cisco Wide Area Application Services Proof of Concept What You Will Learn Understanding bandwidth traffic and resource consumption is vital to enhanced and
Log infrastructure & Zabbix. logging tools integration
 Log infrastructure & Zabbix logging tools integration About me Me Linux System Architect @ ICTRA from Belgium (...) IT : Linux & SysAdmin work, Security, ICTRA ICT for Rail for Transport Mobility Security
Network Security Platform 7.5
 M series Release Notes Network Security Platform 7.5 Revision B Contents About this document New features Resolved issues Known issues Installation instructions Product documentation About this document
Observer Probe Family
 Observer Probe Family Distributed analysis for local and remote networks Monitor and troubleshoot vital network links in real time from any location Network Instruments offers a complete line of software
Running custom scripts which allow you to remotely and securely run a script you wrote on Windows, Mac, Linux, and Unix devices.
 About Foglight NMS Foglight NMS is a comprehensive device, application, and traffic monitoring and troubleshooting solution. It is capable of securely monitoring single and multi-site networks of all sizes,
PANDORA FMS NETWORK DEVICE MONITORING
 NETWORK DEVICE MONITORING pag. 2 INTRODUCTION This document aims to explain how Pandora FMS is able to monitor all network devices available on the marke such as Routers, Switches, Modems, Access points,
Log Analysis with the ELK Stack (Elasticsearch, Logstash and Kibana) Gary Smith, Pacific Northwest National Laboratory
 Gary Smith, Pacific Northwest National Laboratory") Log Analysis with the ELK Stack (Elasticsearch, Logstash and Kibana) Gary Smith, Pacific Northwest National Laboratory A Little Context! The Five Golden Principles of Security! Know your system! Principle
Log Analysis with the ELK Stack (Elasticsearch, Logstash and Kibana) Gary Smith, Pacific Northwest National Laboratory A Little Context! The Five Golden Principles of Security! Know your system! Principle
UCS Network Utilization Monitoring: Configuration and Best Practice
 UCS Network Utilization Monitoring: Configuration and Best Practice Steve McQuerry Technical Marketing Engineer Unified Computing Systems Cisco Systems, Inc. Document Version 1.0 1 Copyright 2013 Cisco
INFRASTRUCTURE MONITORING:
 Speed at Scale Infrastructure Monitoring [ DataSheet ] INFRASTRUCTURE MONITORING: INTEGRATED METRICS, FLOWS AND LOGS. More and more of today s service delivery environments are moving to hyperscale-based
PANDORA FMS NETWORK DEVICES MONITORING
 NETWORK DEVICES MONITORING pag. 2 INTRODUCTION This document aims to explain how Pandora FMS can monitor all the network devices available in the market, like Routers, Switches, Modems, Access points,
Scalable Extraction, Aggregation, and Response to Network Intelligence
 Scalable Extraction, Aggregation, and Response to Network Intelligence Agenda Explain the two major limitations of using Netflow for Network Monitoring Scalability and Visibility How to resolve these issues
Observer Analysis Advantages
 In-Depth Analysis for Gigabit and 10 Gb Networks For enterprise management, gigabit and 10 Gb Ethernet networks mean high-speed communication, on-demand systems, and improved business functions. For enterprise
Open SDN for Network Visibility
 SOLUTION GUIDE Open SDN for Network Visibility Simplifying large scale network monitoring systems with Big Tap 1 This solution guide describes how Big Tap, a network monitoring application from Big Switch
April 8th - 10th, 2014 LUG14 LUG14. Lustre Log Analyzer. Kalpak Shah. DataDirect Networks. ddn.com. 2014 DataDirect Networks. All Rights Reserved.
 April 8th - 10th, 2014 LUG14 LUG14 Lustre Log Analyzer Kalpak Shah DataDirect Networks Lustre Log Analysis Requirements Need scripts to parse Lustre debug logs Only way to effectively use the logs for
Developing an Application Tracing Utility for Mule ESB Application on EL (Elastic Search, Log stash) Stack Using AOP
 Stack Using AOP") Developing an Application Tracing Utility for Mule ESB Application on EL (Elastic Search, Log stash) Stack Using AOP Mohan Bandaru, Amarendra Kothalanka, Vikram Uppala Student, Department of Computer Science
Developing an Application Tracing Utility for Mule ESB Application on EL (Elastic Search, Log stash) Stack Using AOP Mohan Bandaru, Amarendra Kothalanka, Vikram Uppala Student, Department of Computer Science
PacketTrap One Resource for Managed Services
 Remote Monitoring Software for Managed Services Providers PacketTrap RMM provides a cost-effective way for you to offer enterprise-class server, application, and network management to your customers. It
Proactive Network Performance Monitoring
 Proactive Network Performance Monitoring No other tool is as flexible and robust as Goliath Performance Monitor We have been using Goliath Performance Monitor for many years. We have looked at other tools
End-to-End Network Centric Performance Management
 End-to-End Network Centric Performance Management Gordon Bolt gbolt@opnet.com Application Performance Networks exist to support applications and services Application or End-User Experience is what matters
I1: Best Practices for Packet Collection, Aggregation & Distribution in the Enterprise
 I1: Best Practices for Packet Collection, Aggregation & Distribution in the Enterprise J. Scott Haugdahl Architect, Blue Cross Blue Shield MN; scott_haugdahl@bluecrossmn.com Formerly Asst. VP, Architect,
Distributed Monitoring Pervasive Visibility & Monitoring, Selective Drill-Down
 Distributed Monitoring Pervasive Visibility & Monitoring, Selective Drill-Down Rony Kay www.cpacket.com, 2012 Pervasive Visibility, Monitoring, and Drill Down cpacket delivers solutions for intelligent
50. DFN Betriebstagung
 50. DFN Betriebstagung IPS Serial Clustering in 10GbE Environment Tuukka Helander, Stonesoft Germany GmbH Frank Brüggemann, RWTH Aachen Slide 1 Agenda Introduction Stonesoft clustering Firewall parallel
WHITE PAPER Redefining Monitoring for Today s Modern IT Infrastructures
 WHITE PAPER Redefining Monitoring for Today s Modern IT Infrastructures Modern technologies in Zenoss Service Dynamics v5 enable IT organizations to scale out monitoring and scale back costs, avoid service
ICND2 NetFlow. Question 1. What are the benefit of using Netflow? (Choose three) A. Network, Application & User Monitoring. B.
 A. Network, Application & User Monitoring. B.") ICND2 NetFlow Question 1 What are the benefit of using Netflow? (Choose three) A. Network, Application & User Monitoring B. Network Planning C. Security Analysis D. Accounting/Billing Answer: A C D NetFlow
ICND2 NetFlow Question 1 What are the benefit of using Netflow? (Choose three) A. Network, Application & User Monitoring B. Network Planning C. Security Analysis D. Accounting/Billing Answer: A C D NetFlow
What s New in Security Analytics 10.4. Be the Hunter.. Not the Hunted
 What s New in Security Analytics 10.4 Be the Hunter.. Not the Hunted Attackers Are Outpacing Detection Attacker Capabilities Time To Discovery Source: VERIZON 2014 DATA BREACH INVESTIGATIONS REPORT 2 TRANSFORM
TITANXR Multi-Switch Management Software
 TITANXR Multi-Switch Management Software Centralized management of APCON network monitoring switches Features Centralized APCON system management View status and alerts Configurable Dashboards Monitor
Network Security Demonstration - Snort based IDS Integration -
 Network Security Demonstration - Snort based IDS Integration - Hyuk Lim (hlim@gist.ac.kr) with TJ Ha, CW Jeong, J Narantuya, JW Kim Wireless Communications and Networking Lab School of Information and
pt360 FREE Tool Suite Networks are complicated. Network management doesn t have to be.
 pt360 FREE Tool Suite Networks are complicated. Network management doesn t have to be. pt360 FREE Tool Suite - At a Glance PacketTrap Networks November, 2009 PacketTrap's pt360 FREE Tool Suite consolidates
Cisco NetFlow TM Briefing Paper. Release 2.2 Monday, 02 August 2004
 Cisco NetFlow TM Briefing Paper Release 2.2 Monday, 02 August 2004 Contents EXECUTIVE SUMMARY...3 THE PROBLEM...3 THE TRADITIONAL SOLUTIONS...4 COMPARISON WITH OTHER TECHNIQUES...6 CISCO NETFLOW OVERVIEW...7
4 Steps to Surviving Big Data
 4 Steps to Surviving Big Data As big data projects slam network performance, network managers must be ready for the challenges they bring. There s No Doubt that Big Data is a Big Deal to Companies Today
MySQL Enterprise Monitor
 MySQL Enterprise Monitor Lynn Ferrante Principal Sales Consultant 1 Program Agenda MySQL Enterprise Monitor Overview Architecture Roles Demo 2 Overview 3 MySQL Enterprise Edition Highest Levels of Security,
Why should you look at your logs? Why ELK (Elasticsearch, Logstash, and Kibana)?
?") Authors Introduction This guide is designed to help developers, DevOps engineers, and operations teams that run and manage applications on top of AWS to effectively analyze their log data to get visibility
Authors Introduction This guide is designed to help developers, DevOps engineers, and operations teams that run and manage applications on top of AWS to effectively analyze their log data to get visibility
11.1. Performance Monitoring
 11.1. Performance Monitoring Windows Reliability and Performance Monitor combines the functionality of the following tools that were previously only available as stand alone: Performance Logs and Alerts
WhatsUp Gold vs. Orion
 Gold vs. Building the network management solution that will work for you is very easy with the Gold family just mix-and-match the Gold plug-ins that you need (WhatsVirtual, WhatsConnected, Flow Monitor,
Processing millions of logs with Logstash
 and integrating with Elasticsearch, Hadoop and Cassandra November 21, 2014 About me My name is Valentin Fischer-Mitoiu and I work for the University of Vienna. More specificaly in a group called Domainis
Monitoring and analyzing audio, video, and multimedia traffic on the network
 Monitoring and analyzing audio, video, and multimedia traffic on the network Slavko Gajin slavko.gajin@rcub.bg.ac.rs AMRES Academic Network of Serbia AMRES Academic Network of Serbia RCUB - Belgrade University
SIEM Optimization 101. ReliaQuest E-Book Fully Integrated and Optimized IT Security
 SIEM Optimization 101 ReliaQuest E-Book Fully Integrated and Optimized IT Security Introduction SIEM solutions are effective security measures that mitigate security breaches and increase the awareness
1 Data Center Infrastructure Remote Monitoring
 Page 1 of 7 Service Description: Cisco Managed Services for Data Center Infrastructure Technology Addendum to Cisco Managed Services for Enterprise Common Service Description This document referred to
The Purview Solution Integration With Splunk
 The Purview Solution Integration With Splunk Integrating Application Management and Business Analytics With Other IT Management Systems A SOLUTION WHITE PAPER WHITE PAPER Introduction Purview Integration
A Year of HTCondor Monitoring. Lincoln Bryant Suchandra Thapa
 A Year of HTCondor Monitoring Lincoln Bryant Suchandra Thapa HTCondor Week 2015 May 21, 2015 Analytics vs. Operations Two parallel tracks in mind: o Operations o Analytics Operations needs to: o Observe
SolarWinds Certified Professional. Exam Preparation Guide
 SolarWinds Certified Professional Exam Preparation Guide Introduction The SolarWinds Certified Professional (SCP) exam is designed to test your knowledge of general networking management topics and how
Blackboard Open Source Monitoring
 Blackboard Open Source Monitoring By Greg Lloyd Submitted to the Faculty of the School of Information Technology in Partial Fulfillment of the Requirements for the Degree of Bachelor of Science in Information
Monitor all of your critical infrastructure from a single, integrated system.
 Monitor all of your critical infrastructure from a single, integrated system. Do you know what s happening on your network right now? Take control of your network with real-time insight! When you know
Network Visibility Guide
 Network Visibility Guide Even Superman could only see through walls, not networks! We understand your lack of Network visibility. So we give you ManageEngine NetFlow Analyzer! Network visibility is the
OBSERVEIT DEPLOYMENT SIZING GUIDE
 OBSERVEIT DEPLOYMENT SIZING GUIDE The most important number that drives the sizing of an ObserveIT deployment is the number of Concurrent Connected Users (CCUs) you plan to monitor. This document provides
Monitoring Best Practices for
 Monitoring Best Practices for OVERVIEW Providing the right level and depth of monitoring is key to ensuring the effective operation of IT systems. This is especially true for ecommerce systems like Magento,
Latency Analyzer (LANZ)
") Latency Analyzer (LANZ) Technical Bulletin LANZ - A New Dimension in Network Visibility Arista Networks Latency Analyzer (LANZ) represents a revolution in integrated network performance monitoring. For
Latency Analyzer (LANZ) Technical Bulletin LANZ - A New Dimension in Network Visibility Arista Networks Latency Analyzer (LANZ) represents a revolution in integrated network performance monitoring. For
mbits Network Operations Centrec
 mbits Network Operations Centrec The mbits Network Operations Centre (NOC) is co-located and fully operationally integrated with the mbits Service Desk. The NOC is staffed by fulltime mbits employees,
Case Study: Instrumenting a Network for NetFlow Security Visualization Tools
 Case Study: Instrumenting a Network for NetFlow Security Visualization Tools William Yurcik* Yifan Li SIFT Research Group National Center for Supercomputing Applications (NCSA) University of Illinois at
Beyond Monitoring Root-Cause Analysis
 WHITE PAPER With the introduction of NetFlow and similar flow-based technologies, solutions based on flow-based data have become the most popular methods of network monitoring. While effective, flow-based
Best Practices for 10G and 40G Network Forensics
 TM Best Practices for 10G and 40G WHITE PAPER On highly utilized 10G and 40G networks, capturing network traffic from individual SPAN ports on switches and routers typically results in spotty visibility,
NetQoS Delivers Distributed Network
 Behind the Scenes with MySQL NetQoS Delivers Distributed Network Management Solution with Embedded MySQL NetQoS delivers products and services that enable some of the world s most demanding enterprises
Analyze hop-by-hop path, devices, interfaces, and queues Locate and troubleshoot problems
 Visualization, Management, and Control for Cisco IWAN Data sheet Overview Intelligent WAN is a Cisco solution that enables enterprises to realize significant cost savings by moving to less expensive transport
Secure Networks for Process Control
 Secure Networks for Process Control Leveraging a Simple Yet Effective Policy Framework to Secure the Modern Process Control Network An Enterasys Networks White Paper There is nothing more important than
Plugging Network Security Holes using NetFlow. Loopholes in todays network security solutions and how NetFlow can help
 Plugging Network Security Holes using NetFlow Loopholes in todays network security solutions and how NetFlow can help About ManageEngine Network Servers & Applications Desktop ServiceDesk Windows Infrastructure
Network Performance Management Solutions Architecture
 Network Performance Management Solutions Architecture agility made possible Network Performance Management solutions from CA Technologies compliment your services to deliver easily implemented and maintained
RSA Security Analytics Security Analytics System Overview
 RSA Security Analytics Security Analytics System Overview Copyright 2010-2015 RSA, the Security Division of EMC. All rights reserved. Trademarks RSA, the RSA Logo and EMC are either registered trademarks
NetFlow use cases. ICmyNet / NetVizura. Miloš Zeković, milos.zekovic@soneco.rs. ICmyNet Chief Customer Officer Soneco d.o.o.
 NetFlow use cases ICmyNet / NetVizura, milos.zekovic@soneco.rs Soneco d.o.o. Serbia Agenda ICmyNet / NetVizura overview Use cases / case studies Statistics per exporter/interfaces Traffic Patterns NREN
Cisco Performance Visibility Manager 1.0.1
 Cisco Performance Visibility Manager 1.0.1 Cisco Performance Visibility Manager (PVM) is a proactive network- and applicationperformance monitoring, reporting, and troubleshooting system for maximizing
Cisco Bandwidth Quality Manager 3.1
 Cisco Bandwidth Quality Manager 3.1 Product Overview Providing the required quality of service (QoS) to applications on a wide-area access network consistently and reliably is increasingly becoming a challenge.
Monitoring Best Practices for COMMERCE
 Monitoring Best Practices for COMMERCE OVERVIEW Providing the right level and depth of monitoring is key to ensuring the effective operation of IT systems. This is especially true for ecommerce systems
ZEN LOAD BALANCER EE v3.04 DATASHEET The Load Balancing made easy
 ZEN LOAD BALANCER EE v3.04 DATASHEET The Load Balancing made easy OVERVIEW The global communication and the continuous growth of services provided through the Internet or local infrastructure require to
VMware vcenter Log Insight User's Guide
 VMware vcenter Log Insight User's Guide vcenter Log Insight 1.0 This document supports the version of each product listed and supports all subsequent versions until the document is replaced by a new edition.
Best Practices for Network Monitoring
 Enabling a Converged World Best Practices for Network Monitoring How a Network Monitoring Switch Helps IT Teams Stay Proactive 915-6509-01 Rev A February 2012 Contents Monitoring Challenges in Today s