Lluis Belanche + Alfredo Vellido. Intelligent Data Analysis and Data Mining
|
|
|
- Wendy McLaughlin
- 8 years ago
- Views:
Transcription
1 Lluis Belanche + Alfredo Vellido Intelligent Data Analysis and Data Mining a.k.a. Data Mining II

2 IDA DM 2012/2013. Alfredo Vellido Visual Data Mining (3)

3 visual DM RECAP: visualization in data exploration Data exploration is one of the basic building blocks, or constituting stages, of most knowledge discovery methodologies, and the task of data visualization is central to data exploration. Artificial pattern recognition (APR): Through the definition of visualization oriented techniques. Natural pattern recognition (NPR): Through the understanding of visualization as the cognitive processing of visual stimuli conducted by the human brain. Out of a deductive model of research (general proposi ons examples) to reap the benefits of a more inductive one (examples general propositions).
: Through the understanding of visualization as the cognitive processing of visual stimuli conducted by the human brain.")
4 RECAP: Visual revolution William Playfair These days, visualization typically employs computers to process the information and computer screens. Standardized computer based information visualization has been around for barely a couple of decades.

5 RECAP: PRINCIPLES: the data mining visual cycle, or Visual Exploratory Data Mining Data gathering Data manipulation Hipothesis of reality DATA MODEL Pre-processing & transformation Graphic engine Data Exploration Control & navegation Visual-Spatial model Cognitive-Logic Model Model manipulation

6 Contents (for parts 1 & 2) A brief introduction to info visualization Visualization & history Perception: seeing with the brain Visual exploratory DM The good, the bad & the ugly

7 What type of visualization are we looking for? Descriptive? explicit Exploratory? implicit

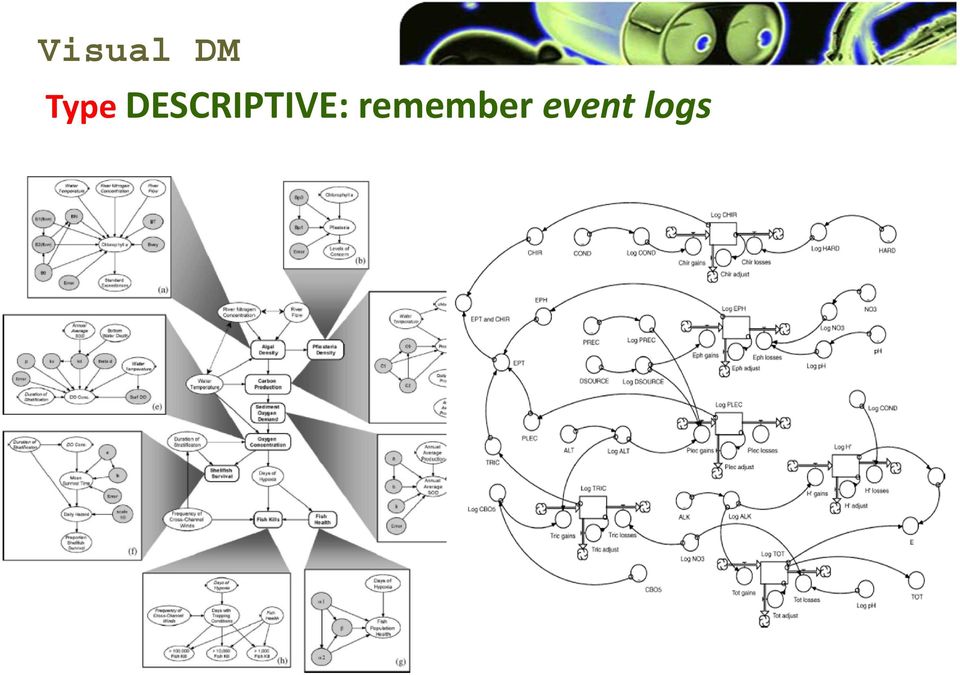
8 Type DESCRIPTIVE: remember event logs
9 PRINCIPLES: A good exploratory visualization should......show data and/or results......at different levels of detail, from the overall landscape to the fine detail.... in a coherent manner, even if we are dealing with large collections.... avoiding, as much as possible, distortion in their representation...focus attention in the most relevantes features......minimizing the impact of uninformative and misleading data...integrating statistical results and linguistic descriptions (if possible and relevant: multimodality).

10 DATA EXPLORATION: Some dimensions
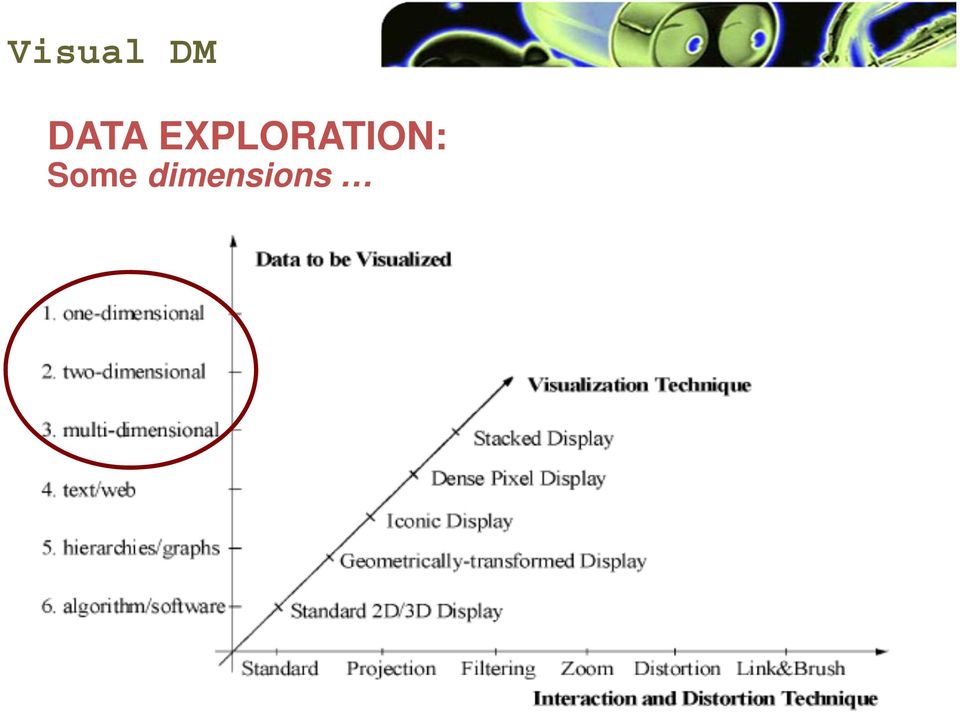
11 DATA EXPLORATION: The CURSE of dimensionality Most data available to us are stored in different kinds of databases and in numeric format, mostly organized in table structures (remember survey!) An extension of these are the data cubes generated by OLAP processes. How to display multiple dimensions in a visually intuitive manner? A simplified taxonomy of cases: Low dimensionality (1 3D) Moderate dimensionality (4 10D) High dimensionality (>10D)

12 DATA EXPLORATION: low-moderate dim < 10D Spatial coordinates 3D requires interactivity Further pre cognitive visual elements allow us to add extra dimensions: color, movement, shape, Exotic solutions Glyph*: Chernoff faces, stickfigures, whiskers... * A glyph is a graphical representation of one or more characters, or of part of a character. A character is a textual entity whereas a glypg is a graphical entity. ideogram, pictogram

13 some of those alternatives Chernoff faces Herman Chernoff (1973). "Using faces to represent points in k dimensional space graphically". Journal of the American Statistical Association 68 (342):

14 some of those alternatives

15 DATA EXPLORATION: high dimensionality data How do we visualize data of high (or even very high) dimensionality? Some of the alternatives are rather straightforward some others are not Eliminate dimensions (data variables): those which are redundant and / or uninformative (at least you manage to alleviate part of the problem ) Feature selection Divide & conquer: a classic: create multiple visualizations of low dimensionality. Latent and projection models

16 DATA EXPLORATION: The Grand Tour: multiple visualization of Iris data

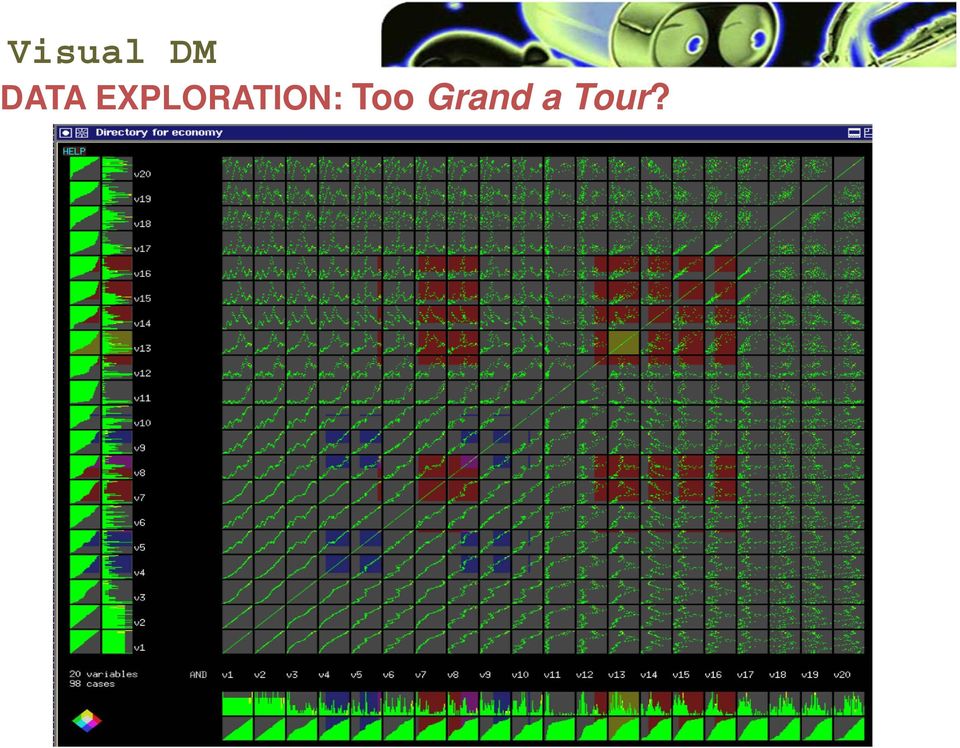
17 DATA EXPLORATION: Too Grand a Tour?
18 TECHNIQUES: Latency and projection Projection Dimensionality compression Similitude information coding Grouping / Clustering Finding grouping structure in data Similitude information coding Self Organizing Maps (SOM) & their variants: manifold learning Examples of combined latent representation and clustering

19 TECHNIQUES: projection Representation in <4 D, so that the distance neighborhood relations between multi dimensional points are faithfully preserved It is impossible to preserve information integrally Some scale normalization is required Linear vs. non linear projections

20 TECHNIQUES: projection: methods Methods based oninter point distances, where: dx = distance in the original space dy = distance in the projection space h = neighborhood function E = (dx dy) 2 E = (dx dy) 2 / dx E = (dx dy) 2 e dy E = dx 2 h(dy) MDS, PCA Sammon s projection CCA SOM... and in which we aim to minimize an inherent projection distorsion (E)

21 TECHNIQUES: projection: methods in a nutshell MDS: technique used in data visualization for exploring similarities or dissimilarities in data. An MDS algorithm starts with a matrix of item item similarities, then assigns a location of each item in a low dimensional space, suitable for visualisation. Taxonomy: Metric multidimensional scaling assumes the input matrix is just an item item distance matrix. Analogous to PCA, an eigenvector problem is solved to find the locations that minimize distortions to the distance matrix. Its goal is to find a Euclidean distance approximating a given distance. Generalized multidimensional scaling (GMDS) A superset of metric MDS that allows for the target distances to be non Euclidean. Non metric multidimensional scaling It finds a non parametric monotonic relationship between the dissimilarities in the item item matrix and the Euclidean distance between items, and the location of each item in the low dimensional space Biblio: Abdi, H. (2007). Metric multidimensional scaling. In N.J. Salkind (Ed.): Encyclopedia of Measurement and Statistics. Thousand Oaks (CA): Sage. Kruskal, J. B., and Wish, M. (1978), Multidimensional Scaling, Sage University Paper series on Quantitative Application in the Social Sciences, Beverly Hills and London: Sage Publications.
22 TECHNIQUES: projection: methods in a nutshell PCA: It is a linear transformation that represents the data in a new coordinate system such that the greatest variance explained by the data lies on the first coordinate (called the first principal component), the second greatest variance on the second coordinate, and so on. PCA can be used for dimensionality reduction in a dataset by retaining only those characteristics of the dataset that contribute most to its variance. Taxonomy: Kernel PCA PPCA, CCA (when unfolding a nonlinear structure, Sammon's mapping cannot reproduce all distances. One way to face this problem consists in favouring local topology: CCA tries to reproduce short distances first, while long distances remain secondary. Some source code: Dimensionality Reduction Toolbox: Some papers: PPCA: M.E. Tipping, C.M. Bishop, Probabilistic Principal Component Analysis, 1999, J. of the Royal Statistical Society: Series B, 61(3): KPCA: B. Schölkopf, A. Smola and K.R. Müller, Kernel Principal Component Analysis, 1997, Lecture Notes in Computer Science, Vol. 1327,
23 TECHNIQUES: projection: example PCA Sammon s projection CCA
24 TECHNIQUES: projection: discussion, pros & cons Projection techniques code proximity / similarity information in spacial coordinates (sometimes, with extra precognitive elements such as colour...) They allow But... Finding natural data groupings (clusters) on the basis of some sort of similarity Finding the shapes of these groupings Projection is always limited by error and information loss. New projection coordinates are not always readily interpretable (latency by definition) The original relations between data dimensions are lost. Quite often, the computacional effort is to be taken into account, as most of these methods are based on distances between multivariate points.
25 TECHNIQUES: multiple visualizations How to get some of the info conveyed by observable variables back into the projections? One possibility: Using multiple visualizations. Parallel coordinates and pre cognitive stimuli (colour, position...)
26 TECHNIQUES: SOM & GTM Self Organizing Feature Map (or Kohonen Maps) k means is an special case of SOM Discretization (in the form of network grids) and projection are simultaneously performed Set of prototypes» model Cooperative learning (through neighbourhood function) Competitive learning (winner takes most if not all ) GTM is a probabilistic alternative to SOM (i.e., a form of statistical machine learning) GTM is a generative model and, therefore, aims to reproduce data density distributions It defines a proper error function It is a non linear latent model that can be interpreted as a mixture model, as well. All the learning parameters can be adaptively optimized.
27 TECHNIQUES: SOM & GTM: training / fitting The learning process for both models can be illustrated by the fisherman network simile.
28 TECHNIQUES: SOM & GTM: clustering The SOM and GTM units can be interpreted as microclusters U matrix (distance in local neighbourhood) or Magnification Factor (distorsion levels) Discrete or fuzzy clusters, from local density or probability maxima Hierarchical clustering and dendrograms
29 TECHNIQUES: SOM & GTM: multiple visualization
30 TECHNIQUES: SOM & GTM: Visualization of class membership
31 Visualization: text, hierarchies, graphs and other exotisms
32 hierarchies: Conic trees
33 ThemeRivers
34 Mapscapes
35 Visualization: software
36 Visualizing data: Simple but useful: Panopticon: Heatmaps
37 Complex and off the shelf: ( TheBrain Elevator pitch Simply type in your ideas. Drag and drop files and web pages. Any idea can be linked to anything else. Using your digital Brain is like cruising through a Web of your thinking. See new relationships. Discover connections. Go from the big picture of everything to a specific detail in seconds
38 Woven and off the shelf: Ixacta s Ixsite Web Analyzer Neighborhood sitemap diagram: Ixsite creates this diagram to help you visualize the relationship between the files on your site.
39 Woven and free:
40 SOM off the selve: Visumap ( Ellipse esom (
41 SOM fishing: REEFSOM Applied Neuroinformatics Group, Bielefeld University, Germany
42 Visualization: in summary
43 In summary... Which are the features of a good, successful visualization? Show the data (exploratory element) Focus the attention ( in the most relevant aspects) Never forget the human factor in visual perception The science of vision is the necessary framework for the visualization techniques You have to be careful with pre cognitive elements (position, movement, colour, shape) in visual coding of dimensions. How to use visualization in exploratory data mining? Visualization allows especulation and model validation. Visualization of high dimensional data sets can be accomplished through: projections and clustering methods multiple simultaneous visualizations.
44 Plan A brief introduction to data visualization Visualization & history Perception Visual exploratory DM The good, the bad & the ugly
45 The good... According to Michael Friendly s Gallery of Data Visualization (Psych./York Univ.) NY weather in NYT, Jan.1981: 2200 data pieces!!!
46 The good... According to Michael Friendly s Gallery of Data Visualization (Psych./York Univ.) Gapminder Trendalyzer Google Mo on Chart & Data Explorer
47 ... And the bad and ugly According to Michael Friendly s Gallery of Data Visualization (Psych./York Univ.)
48 Resources
49 InfoVis Wiki
50 Visualising data
The Value of Visualization 2
 The Value of Visualization 2 G Janacek -0.69 1.11-3.1 4.0 GJJ () Visualization 1 / 21 Parallel coordinates Parallel coordinates is a common way of visualising high-dimensional geometry and analysing multivariate
Unsupervised Data Mining (Clustering)
") Unsupervised Data Mining (Clustering) Javier Béjar KEMLG December 01 Javier Béjar (KEMLG) Unsupervised Data Mining (Clustering) December 01 1 / 51 Introduction Clustering in KDD One of the main tasks in
Unsupervised Data Mining (Clustering) Javier Béjar KEMLG December 01 Javier Béjar (KEMLG) Unsupervised Data Mining (Clustering) December 01 1 / 51 Introduction Clustering in KDD One of the main tasks in
Exploratory Data Analysis with MATLAB
 Computer Science and Data Analysis Series Exploratory Data Analysis with MATLAB Second Edition Wendy L Martinez Angel R. Martinez Jeffrey L. Solka ( r ec) CRC Press VV J Taylor & Francis Group Boca Raton
Machine Learning and Data Analysis overview. Department of Cybernetics, Czech Technical University in Prague. http://ida.felk.cvut.
 Machine Learning and Data Analysis overview Jiří Kléma Department of Cybernetics, Czech Technical University in Prague http://ida.felk.cvut.cz psyllabus Lecture Lecturer Content 1. J. Kléma Introduction,
USING SELF-ORGANIZING MAPS FOR INFORMATION VISUALIZATION AND KNOWLEDGE DISCOVERY IN COMPLEX GEOSPATIAL DATASETS
 USING SELF-ORGANIZING MAPS FOR INFORMATION VISUALIZATION AND KNOWLEDGE DISCOVERY IN COMPLEX GEOSPATIAL DATASETS Koua, E.L. International Institute for Geo-Information Science and Earth Observation (ITC).
INTERACTIVE DATA EXPLORATION USING MDS MAPPING
 INTERACTIVE DATA EXPLORATION USING MDS MAPPING Antoine Naud and Włodzisław Duch 1 Department of Computer Methods Nicolaus Copernicus University ul. Grudziadzka 5, 87-100 Toruń, Poland Abstract: Interactive
Topic Maps Visualization
 Topic Maps Visualization Bénédicte Le Grand, Laboratoire d'informatique de Paris 6 Introduction Topic maps provide a bridge between the domains of knowledge representation and information management. Topics
Data Exploration Data Visualization
 Data Exploration Data Visualization What is data exploration? A preliminary exploration of the data to better understand its characteristics. Key motivations of data exploration include Helping to select
A Partially Supervised Metric Multidimensional Scaling Algorithm for Textual Data Visualization
 A Partially Supervised Metric Multidimensional Scaling Algorithm for Textual Data Visualization Ángela Blanco Universidad Pontificia de Salamanca ablancogo@upsa.es Spain Manuel Martín-Merino Universidad
Data Mining: Exploring Data. Lecture Notes for Chapter 3. Introduction to Data Mining
 Data Mining: Exploring Data Lecture Notes for Chapter 3 Introduction to Data Mining by Tan, Steinbach, Kumar Tan,Steinbach, Kumar Introduction to Data Mining 8/05/2005 1 What is data exploration? A preliminary
Lluis Belanche + Alfredo Vellido. Intelligent Data Analysis and Data Mining
 Lluis Belanche + Alfredo Vellido Intelligent Data Analysis and Data Mining a.k.a. Data Mining II Office 319, Omega, BCN EET, office 107, TR 2, Terrassa avellido@lsi.upc.edu skype, gtalk: avellido Tels.:
What is Visualization? Information Visualization An Overview. Information Visualization. Definitions
 What is Visualization? Information Visualization An Overview Jonathan I. Maletic, Ph.D. Computer Science Kent State University Visualize/Visualization: To form a mental image or vision of [some
Visualization of large data sets using MDS combined with LVQ.
 Visualization of large data sets using MDS combined with LVQ. Antoine Naud and Włodzisław Duch Department of Informatics, Nicholas Copernicus University, Grudziądzka 5, 87-100 Toruń, Poland. www.phys.uni.torun.pl/kmk
Customer Data Mining and Visualization by Generative Topographic Mapping Methods
 Customer Data Mining and Visualization by Generative Topographic Mapping Methods Jinsan Yang and Byoung-Tak Zhang Artificial Intelligence Lab (SCAI) School of Computer Science and Engineering Seoul National
Cartogram representation of the batch-som magnification factor
 ESANN 2012 proceedings, European Symposium on Artificial Neural Networs, Computational Intelligence Cartogram representation of the batch-som magnification factor Alessandra Tosi 1 and Alfredo Vellido
Interactive Data Mining and Visualization
 Interactive Data Mining and Visualization Zhitao Qiu Abstract: Interactive analysis introduces dynamic changes in Visualization. On another hand, advanced visualization can provide different perspectives
Data Mining: Exploring Data. Lecture Notes for Chapter 3. Introduction to Data Mining
 Data Mining: Exploring Data Lecture Notes for Chapter 3 Introduction to Data Mining by Tan, Steinbach, Kumar What is data exploration? A preliminary exploration of the data to better understand its characteristics.
ViSOM A Novel Method for Multivariate Data Projection and Structure Visualization
 IEEE TRANSACTIONS ON NEURAL NETWORKS, VOL. 13, NO. 1, JANUARY 2002 237 ViSOM A Novel Method for Multivariate Data Projection and Structure Visualization Hujun Yin Abstract When used for visualization of
Data, Measurements, Features
 Data, Measurements, Features Middle East Technical University Dep. of Computer Engineering 2009 compiled by V. Atalay What do you think of when someone says Data? We might abstract the idea that data are
Machine Learning for Data Science (CS4786) Lecture 1
 Lecture 1") Machine Learning for Data Science (CS4786) Lecture 1 Tu-Th 10:10 to 11:25 AM Hollister B14 Instructors : Lillian Lee and Karthik Sridharan ROUGH DETAILS ABOUT THE COURSE Diagnostic assignment 0 is out:
Machine Learning for Data Science (CS4786) Lecture 1 Tu-Th 10:10 to 11:25 AM Hollister B14 Instructors : Lillian Lee and Karthik Sridharan ROUGH DETAILS ABOUT THE COURSE Diagnostic assignment 0 is out:
Self-Organizing g Maps (SOM) COMP61021 Modelling and Visualization of High Dimensional Data
 COMP61021 Modelling and Visualization of High Dimensional Data") Self-Organizing g Maps (SOM) Ke Chen Outline Introduction ti Biological Motivation Kohonen SOM Learning Algorithm Visualization Method Examples Relevant Issues Conclusions 2 Introduction Self-organizing
Self-Organizing g Maps (SOM) Ke Chen Outline Introduction ti Biological Motivation Kohonen SOM Learning Algorithm Visualization Method Examples Relevant Issues Conclusions 2 Introduction Self-organizing
CITY UNIVERSITY OF HONG KONG 香 港 城 市 大 學. Self-Organizing Map: Visualization and Data Handling 自 組 織 神 經 網 絡 : 可 視 化 和 數 據 處 理
 CITY UNIVERSITY OF HONG KONG 香 港 城 市 大 學 Self-Organizing Map: Visualization and Data Handling 自 組 織 神 經 網 絡 : 可 視 化 和 數 據 處 理 Submitted to Department of Electronic Engineering 電 子 工 程 學 系 in Partial Fulfillment
Methodology for Emulating Self Organizing Maps for Visualization of Large Datasets
 Methodology for Emulating Self Organizing Maps for Visualization of Large Datasets Macario O. Cordel II and Arnulfo P. Azcarraga College of Computer Studies *Corresponding Author: macario.cordel@dlsu.edu.ph
Data Mining and Neural Networks in Stata
 Data Mining and Neural Networks in Stata 2 nd Italian Stata Users Group Meeting Milano, 10 October 2005 Mario Lucchini e Maurizo Pisati Università di Milano-Bicocca mario.lucchini@unimib.it maurizio.pisati@unimib.it
EM Clustering Approach for Multi-Dimensional Analysis of Big Data Set
 EM Clustering Approach for Multi-Dimensional Analysis of Big Data Set Amhmed A. Bhih School of Electrical and Electronic Engineering Princy Johnson School of Electrical and Electronic Engineering Martin
Visualization methods for patent data
 Visualization methods for patent data Treparel 2013 Dr. Anton Heijs (CTO & Founder) Delft, The Netherlands Introduction Treparel can provide advanced visualizations for patent data. This document describes
Statistics for BIG data
 Statistics for BIG data Statistics for Big Data: Are Statisticians Ready? Dennis Lin Department of Statistics The Pennsylvania State University John Jordan and Dennis K.J. Lin (ICSA-Bulletine 2014) Before
Visualization of Breast Cancer Data by SOM Component Planes
 International Journal of Science and Technology Volume 3 No. 2, February, 2014 Visualization of Breast Cancer Data by SOM Component Planes P.Venkatesan. 1, M.Mullai 2 1 Department of Statistics,NIRT(Indian
Project Participants
 Annual Report for Period:10/2006-09/2007 Submitted on: 08/15/2007 Principal Investigator: Yang, Li. Award ID: 0414857 Organization: Western Michigan Univ Title: Projection and Interactive Exploration of
Using Data Mining for Mobile Communication Clustering and Characterization
 Using Data Mining for Mobile Communication Clustering and Characterization A. Bascacov *, C. Cernazanu ** and M. Marcu ** * Lasting Software, Timisoara, Romania ** Politehnica University of Timisoara/Computer
Principles of Data Mining by Hand&Mannila&Smyth
 Principles of Data Mining by Hand&Mannila&Smyth Slides for Textbook Ari Visa,, Institute of Signal Processing Tampere University of Technology October 4, 2010 Data Mining: Concepts and Techniques 1 Differences
Models of Cortical Maps II
 CN510: Principles and Methods of Cognitive and Neural Modeling Models of Cortical Maps II Lecture 19 Instructor: Anatoli Gorchetchnikov dy dt The Network of Grossberg (1976) Ay B y f (
Data Mining: Exploring Data. Lecture Notes for Chapter 3. Slides by Tan, Steinbach, Kumar adapted by Michael Hahsler
 Data Mining: Exploring Data Lecture Notes for Chapter 3 Slides by Tan, Steinbach, Kumar adapted by Michael Hahsler Topics Exploratory Data Analysis Summary Statistics Visualization What is data exploration?
An Overview of Knowledge Discovery Database and Data mining Techniques
 An Overview of Knowledge Discovery Database and Data mining Techniques Priyadharsini.C 1, Dr. Antony Selvadoss Thanamani 2 M.Phil, Department of Computer Science, NGM College, Pollachi, Coimbatore, Tamilnadu,
Business Intelligence and Process Modelling
 Business Intelligence and Process Modelling F.W. Takes Universiteit Leiden Lecture 2: Business Intelligence & Visual Analytics BIPM Lecture 2: Business Intelligence & Visual Analytics 1 / 72 Business Intelligence
. Learn the number of classes and the structure of each class using similarity between unlabeled training patterns
 Outline Part 1: of data clustering Non-Supervised Learning and Clustering : Problem formulation cluster analysis : Taxonomies of Clustering Techniques : Data types and Proximity Measures : Difficulties
Visual Data Mining : the case of VITAMIN System and other software
 Visual Data Mining : the case of VITAMIN System and other software Alain MORINEAU a.morineau@noos.fr Data mining is an extension of Exploratory Data Analysis in the sense that both approaches have the
COM CO P 5318 Da t Da a t Explora Explor t a ion and Analysis y Chapte Chapt r e 3
 COMP 5318 Data Exploration and Analysis Chapter 3 What is data exploration? A preliminary exploration of the data to better understand its characteristics. Key motivations of data exploration include Helping
Lluis Belanche + Alfredo Vellido. Intelligent Data Analysis and Data Mining. Data Analysis and Knowledge Discovery
 Lluis Belanche + Alfredo Vellido Intelligent Data Analysis and Data Mining or Data Analysis and Knowledge Discovery a.k.a. Data Mining II Office 319, Omega, BCN EET, office 107, TR 2, Terrassa avellido@lsi.upc.edu
Principles of Data Visualization for Exploratory Data Analysis. Renee M. P. Teate. SYS 6023 Cognitive Systems Engineering April 28, 2015
 Principles of Data Visualization for Exploratory Data Analysis Renee M. P. Teate SYS 6023 Cognitive Systems Engineering April 28, 2015 Introduction Exploratory Data Analysis (EDA) is the phase of analysis
Information Visualization Multivariate Data Visualization Krešimir Matković
 Information Visualization Multivariate Data Visualization Krešimir Matković Vienna University of Technology, VRVis Research Center, Vienna Multivariable >3D Data Tables have so many variables that orthogonal
Self Organizing Maps: Fundamentals
 Self Organizing Maps: Fundamentals Introduction to Neural Networks : Lecture 16 John A. Bullinaria, 2004 1. What is a Self Organizing Map? 2. Topographic Maps 3. Setting up a Self Organizing Map 4. Kohonen
An Introduction to Data Mining. Big Data World. Related Fields and Disciplines. What is Data Mining? 2/12/2015
 An Introduction to Data Mining for Wind Power Management Spring 2015 Big Data World Every minute: Google receives over 4 million search queries Facebook users share almost 2.5 million pieces of content
Data Visualization. or Graphical Data Presentation. Jerzy Stefanowski Instytut Informatyki
 Data Visualization or Graphical Data Presentation Jerzy Stefanowski Instytut Informatyki Data mining for SE -- 2013 Ack. Inspirations are coming from: G.Piatetsky Schapiro lectures on KDD J.Han on Data
Self Organizing Maps for Visualization of Categories
 Self Organizing Maps for Visualization of Categories Julian Szymański 1 and Włodzisław Duch 2,3 1 Department of Computer Systems Architecture, Gdańsk University of Technology, Poland, julian.szymanski@eti.pg.gda.pl
Visibility optimization for data visualization: A Survey of Issues and Techniques
 Visibility optimization for data visualization: A Survey of Issues and Techniques Ch Harika, Dr.Supreethi K.P Student, M.Tech, Assistant Professor College of Engineering, Jawaharlal Nehru Technological
Data Exploration and Preprocessing. Data Mining and Text Mining (UIC 583 @ Politecnico di Milano)
") Data Exploration and Preprocessing Data Mining and Text Mining (UIC 583 @ Politecnico di Milano) References Jiawei Han and Micheline Kamber, "Data Mining: Concepts and Techniques", The Morgan Kaufmann
Data Exploration and Preprocessing Data Mining and Text Mining (UIC 583 @ Politecnico di Milano) References Jiawei Han and Micheline Kamber, "Data Mining: Concepts and Techniques", The Morgan Kaufmann
Cover Page. "Assessing the Agreement of Cognitive Space with Information Space" A Research Seed Grant Proposal to the UNC-CH Cognitive Science Program
 Cover Page "Assessing the Agreement of Cognitive Space with Information Space" A Research Seed Grant Proposal to the UNC-CH Cognitive Science Program Submitted by: Dr. Gregory B. Newby Assistant Professor
MS1b Statistical Data Mining
 MS1b Statistical Data Mining Yee Whye Teh Department of Statistics Oxford http://www.stats.ox.ac.uk/~teh/datamining.html Outline Administrivia and Introduction Course Structure Syllabus Introduction to
Visualization Techniques in Data Mining
 Tecniche di Apprendimento Automatico per Applicazioni di Data Mining Visualization Techniques in Data Mining Prof. Pier Luca Lanzi Laurea in Ingegneria Informatica Politecnico di Milano Polo di Milano
A Survey on Pre-processing and Post-processing Techniques in Data Mining
 , pp. 99-128 http://dx.doi.org/10.14257/ijdta.2014.7.4.09 A Survey on Pre-processing and Post-processing Techniques in Data Mining Divya Tomar and Sonali Agarwal Indian Institute of Information Technology,
Using Smoothed Data Histograms for Cluster Visualization in Self-Organizing Maps
 Technical Report OeFAI-TR-2002-29, extended version published in Proceedings of the International Conference on Artificial Neural Networks, Springer Lecture Notes in Computer Science, Madrid, Spain, 2002.
Manifold Learning Examples PCA, LLE and ISOMAP
 Manifold Learning Examples PCA, LLE and ISOMAP Dan Ventura October 14, 28 Abstract We try to give a helpful concrete example that demonstrates how to use PCA, LLE and Isomap, attempts to provide some intuition
Fuzzy Spatial Data Warehouse: A Multidimensional Model
 4 Fuzzy Spatial Data Warehouse: A Multidimensional Model Pérez David, Somodevilla María J. and Pineda Ivo H. Facultad de Ciencias de la Computación, BUAP, Mexico 1. Introduction A data warehouse is defined
Reconstructing Self Organizing Maps as Spider Graphs for better visual interpretation of large unstructured datasets
 Reconstructing Self Organizing Maps as Spider Graphs for better visual interpretation of large unstructured datasets Aaditya Prakash, Infosys Limited aaadityaprakash@gmail.com Abstract--Self-Organizing
They can be obtained in HQJHQH format directly from the home page at: http://www.engene.cnb.uam.es/downloads/kobayashi.dat
 HQJHQH70 *XLGHG7RXU This document contains a Guided Tour through the HQJHQH platform and it was created for training purposes with respect to the system options and analysis possibilities. It is not intended
Data mining and official statistics
 Quinta Conferenza Nazionale di Statistica Data mining and official statistics Gilbert Saporta président de la Société française de statistique 5@ S Roma 15, 16, 17 novembre 2000 Palazzo dei Congressi Piazzale
Topological Tree Clustering of Social Network Search Results
 Topological Tree Clustering of Social Network Search Results Richard T. Freeman Capgemini, FS Business Information Management No. 1 Forge End, Woking, Surrey, GU21 6DB United Kingdom richard.freeman@capgemini.com
Cluster Analysis: Advanced Concepts
 Cluster Analysis: Advanced Concepts and dalgorithms Dr. Hui Xiong Rutgers University Introduction to Data Mining 08/06/2006 1 Introduction to Data Mining 08/06/2006 1 Outline Prototype-based Fuzzy c-means
Data Mining. Cluster Analysis: Advanced Concepts and Algorithms
 Data Mining Cluster Analysis: Advanced Concepts and Algorithms Tan,Steinbach, Kumar Introduction to Data Mining 4/18/2004 1 More Clustering Methods Prototype-based clustering Density-based clustering Graph-based
Statistical Models in Data Mining
 Statistical Models in Data Mining Sargur N. Srihari University at Buffalo The State University of New York Department of Computer Science and Engineering Department of Biostatistics 1 Srihari Flood of
Multivariate Data Visualization
 Multivariate Data Visualization VOTech/Universities of Leeds & Edinburgh Richard Holbrey Outline Focus on data exploration Joined VOTech in June, so...... informal introduction Examine some definitions
Hierarchical Data Visualization
 Hierarchical Data Visualization 1 Hierarchical Data Hierarchical data emphasize the subordinate or membership relations between data items. Organizational Chart Classifications / Taxonomies (Species and
Clustering & Visualization
 Chapter 5 Clustering & Visualization Clustering in high-dimensional databases is an important problem and there are a number of different clustering paradigms which are applicable to high-dimensional data.
Comparison of Non-linear Dimensionality Reduction Techniques for Classification with Gene Expression Microarray Data
 CMPE 59H Comparison of Non-linear Dimensionality Reduction Techniques for Classification with Gene Expression Microarray Data Term Project Report Fatma Güney, Kübra Kalkan 1/15/2013 Keywords: Non-linear
CHAPTER 1 INTRODUCTION
 1 CHAPTER 1 INTRODUCTION Exploration is a process of discovery. In the database exploration process, an analyst executes a sequence of transformations over a collection of data structures to discover useful
Machine Learning and Data Mining. Fundamentals, robotics, recognition
 Machine Learning and Data Mining Fundamentals, robotics, recognition Machine Learning, Data Mining, Knowledge Discovery in Data Bases Their mutual relations Data Mining, Knowledge Discovery in Databases,
Knowledge Discovery in Stock Market Data
 Knowledge Discovery in Stock Market Data Alfred Ultsch and Hermann Locarek-Junge Abstract This work presents the results of a Data Mining and Knowledge Discovery approach on data from the stock markets
An Introduction to Data Mining
 An Introduction to Intel Beijing wei.heng@intel.com January 17, 2014 Outline 1 DW Overview What is Notable Application of Conference, Software and Applications Major Process in 2 Major Tasks in Detail
What is Artificial Intelligence?
 CSE 3401: Intro to Artificial Intelligence & Logic Programming Introduction Required Readings: Russell & Norvig Chapters 1 & 2. Lecture slides adapted from those of Fahiem Bacchus. 1 What is AI? What is
Data Mining on Sequences with recursive Self-Organizing Maps
 Data Mining on Sequences with recursive Self-Organizing Maps Sebastian Blohm Universität Osnabrück sebastian@blomega.de Bachelor's Thesis International Bachelor Program in Cognitive Science, Universität
Employee Survey Analysis
 Employee Survey Analysis Josh Froelich, Megaputer Intelligence Sergei Ananyan, Megaputer Intelligence www.megaputer.com Megaputer Intelligence, Inc. 120 West Seventh Street, Suite 310 Bloomington, IN 47404
High-dimensional labeled data analysis with Gabriel graphs
 High-dimensional labeled data analysis with Gabriel graphs Michaël Aupetit CEA - DAM Département Analyse Surveillance Environnement BP 12-91680 - Bruyères-Le-Châtel, France Abstract. We propose the use
Knowledge Discovery and Data Mining. Structured vs. Non-Structured Data
 Knowledge Discovery and Data Mining Unit # 2 1 Structured vs. Non-Structured Data Most business databases contain structured data consisting of well-defined fields with numeric or alphanumeric values.
How To Cluster
 Data Clustering Dec 2nd, 2013 Kyrylo Bessonov Talk outline Introduction to clustering Types of clustering Supervised Unsupervised Similarity measures Main clustering algorithms k-means Hierarchical Main
Database Marketing, Business Intelligence and Knowledge Discovery
 Database Marketing, Business Intelligence and Knowledge Discovery Note: Using material from Tan / Steinbach / Kumar (2005) Introduction to Data Mining,, Addison Wesley; and Cios / Pedrycz / Swiniarski
Iris Sample Data Set. Basic Visualization Techniques: Charts, Graphs and Maps. Summary Statistics. Frequency and Mode
 Iris Sample Data Set Basic Visualization Techniques: Charts, Graphs and Maps CS598 Information Visualization Spring 2010 Many of the exploratory data techniques are illustrated with the Iris Plant data
CSC384 Intro to Artificial Intelligence
 CSC384 Intro to Artificial Intelligence What is Artificial Intelligence? What is Intelligence? Are these Intelligent? CSC384, University of Toronto 3 What is Intelligence? Webster says: The capacity to
Tutorial on Exploratory Data Analysis
 Tutorial on Exploratory Data Analysis Julie Josse, François Husson, Sébastien Lê julie.josse at agrocampus-ouest.fr francois.husson at agrocampus-ouest.fr Applied Mathematics Department, Agrocampus Ouest
Time series clustering and the analysis of film style
 Time series clustering and the analysis of film style Nick Redfern Introduction Time series clustering provides a simple solution to the problem of searching a database containing time series data such
A STUDY ON DATA MINING INVESTIGATING ITS METHODS, APPROACHES AND APPLICATIONS
 A STUDY ON DATA MINING INVESTIGATING ITS METHODS, APPROACHES AND APPLICATIONS Mrs. Jyoti Nawade 1, Dr. Balaji D 2, Mr. Pravin Nawade 3 1 Lecturer, JSPM S Bhivrabai Sawant Polytechnic, Pune (India) 2 Assistant
Advanced Web Usage Mining Algorithm using Neural Network and Principal Component Analysis
 Advanced Web Usage Mining Algorithm using Neural Network and Principal Component Analysis Arumugam, P. and Christy, V Department of Statistics, Manonmaniam Sundaranar University, Tirunelveli, Tamilnadu,
Gaussian Process Latent Variable Models for Visualisation of High Dimensional Data
 Gaussian Process Latent Variable Models for Visualisation of High Dimensional Data Neil D. Lawrence Department of Computer Science, University of Sheffield, Regent Court, 211 Portobello Street, Sheffield,
Data Mining Cluster Analysis: Basic Concepts and Algorithms. Lecture Notes for Chapter 8. Introduction to Data Mining
 Data Mining Cluster Analysis: Basic Concepts and Algorithms Lecture Notes for Chapter 8 by Tan, Steinbach, Kumar 1 What is Cluster Analysis? Finding groups of objects such that the objects in a group will
CS171 Visualization. The Visualization Alphabet: Marks and Channels. Alexander Lex alex@seas.harvard.edu. [xkcd]
![CS171 Visualization. The Visualization Alphabet: Marks and Channels. Alexander Lex alex@seas.harvard.edu. [xkcd]](/thumbs/39/19465011.jpg "CS171 Visualization. The Visualization Alphabet: Marks and Channels. Alexander Lex alex@seas.harvard.edu. [xkcd]") CS171 Visualization Alexander Lex alex@seas.harvard.edu The Visualization Alphabet: Marks and Channels [xkcd] This Week Thursday: Task Abstraction, Validation Homework 1 due on Friday! Any more problems
CS171 Visualization Alexander Lex alex@seas.harvard.edu The Visualization Alphabet: Marks and Channels [xkcd] This Week Thursday: Task Abstraction, Validation Homework 1 due on Friday! Any more problems
Big Data: Rethinking Text Visualization
 Big Data: Rethinking Text Visualization Dr. Anton Heijs anton.heijs@treparel.com Treparel April 8, 2013 Abstract In this white paper we discuss text visualization approaches and how these are important
Comparing large datasets structures through unsupervised learning
 Comparing large datasets structures through unsupervised learning Guénaël Cabanes and Younès Bennani LIPN-CNRS, UMR 7030, Université de Paris 13 99, Avenue J-B. Clément, 93430 Villetaneuse, France cabanes@lipn.univ-paris13.fr
DATA MINING TECHNOLOGY. Keywords: data mining, data warehouse, knowledge discovery, OLAP, OLAM.
 DATA MINING TECHNOLOGY Georgiana Marin 1 Abstract In terms of data processing, classical statistical models are restrictive; it requires hypotheses, the knowledge and experience of specialists, equations,
CS 591.03 Introduction to Data Mining Instructor: Abdullah Mueen
 CS 591.03 Introduction to Data Mining Instructor: Abdullah Mueen LECTURE 3: DATA TRANSFORMATION AND DIMENSIONALITY REDUCTION Chapter 3: Data Preprocessing Data Preprocessing: An Overview Data Quality Major
Data Harvesting, Visualisation and Analytical Tools. John Southall, Data Librarian, LSE Library
 Data Harvesting, Visualisation and Analytical Tools. John Southall, Data Librarian, LSE Library Aims Will not talk about doing any of these in detail Will not demonstrate the tools BUT it will Raise some
Data Mining: Concepts and Techniques. Jiawei Han. Micheline Kamber. Simon Fräser University К MORGAN KAUFMANN PUBLISHERS. AN IMPRINT OF Elsevier
 Data Mining: Concepts and Techniques Jiawei Han Micheline Kamber Simon Fräser University К MORGAN KAUFMANN PUBLISHERS AN IMPRINT OF Elsevier Contents Foreword Preface xix vii Chapter I Introduction I I.
Chapter ML:XI. XI. Cluster Analysis
 Chapter ML:XI XI. Cluster Analysis Data Mining Overview Cluster Analysis Basics Hierarchical Cluster Analysis Iterative Cluster Analysis Density-Based Cluster Analysis Cluster Evaluation Constrained Cluster
an introduction to VISUALIZING DATA by joel laumans
 an introduction to VISUALIZING DATA by joel laumans an introduction to VISUALIZING DATA iii AN INTRODUCTION TO VISUALIZING DATA by Joel Laumans Table of Contents 1 Introduction 1 Definition Purpose 2 Data
TIETS34 Seminar: Data Mining on Biometric identification
 TIETS34 Seminar: Data Mining on Biometric identification Youming Zhang Computer Science, School of Information Sciences, 33014 University of Tampere, Finland Youming.Zhang@uta.fi Course Description Content
A Study of Web Log Analysis Using Clustering Techniques
 A Study of Web Log Analysis Using Clustering Techniques Hemanshu Rana 1, Mayank Patel 2 Assistant Professor, Dept of CSE, M.G Institute of Technical Education, Gujarat India 1 Assistant Professor, Dept
A Computational Framework for Exploratory Data Analysis
 A Computational Framework for Exploratory Data Analysis Axel Wismüller Depts. of Radiology and Biomedical Engineering, University of Rochester, New York 601 Elmwood Avenue, Rochester, NY 14642-8648, U.S.A.
The course: An Introduction to Information Visualization Techniques for Exploring Large Database
 The course: An Introduction to Information Visualization Techniques for Exploring Large Database Jing Yang Fall 2006 www.cs.uncc.edu/~jyang13 1 Multi-dimensional Data Visualization 2 1 Parallel Coordinates
Customer Analytics. Turn Big Data into Big Value
 Turn Big Data into Big Value All Your Data Integrated in Just One Place BIRT Analytics lets you capture the value of Big Data that speeds right by most enterprises. It analyzes massive volumes of data
Supervised and unsupervised learning - 1
 Chapter 3 Supervised and unsupervised learning - 1 3.1 Introduction The science of learning plays a key role in the field of statistics, data mining, artificial intelligence, intersecting with areas in
Big Data Visualisations. Professor Ian Nabney i.t.nabney@aston.ac.uk NCRG
 Big Data Visualisations Professor Ian Nabney i.t.nabney@aston.ac.uk NCRG Overview Why visualise data? How we can visualise data Big Data Institute What is Visualisation? Goal of visualisation is to present