iou Fails, Sp 57_198 - '
|
|
|
- Melina Norris
- 8 years ago
- Views:
Transcription
1 UNSUPERVSED CLASSFCATON AND AREAL MEASUREMENT OF LAND AND WATER COASTAL FEATURES ON THE TEXAS COAST L. M. Flores, C. A. Reeves, S. B. Hixon and J. F. Paris, LockheedElectronics Company, lnc., Houston Aerospace Systems Division ABSTRACT ERTS-1 multispectral scanner (MSS) digital data was used to delineate coastal land, vegetative, and water features in two portions of the Texas Coastal Zone. ERTS-1 MSS data (Scene D'S and ) acquired on August 29, 1972, were analyzed on NASA Johnson Space Center systems through the use of two clustering algorithms. Seventeen to 30 spectrally homogeneous classes were so defined. Many classes were identified as being pure features such as water masses, salt marsh, beaches, pine, hardwoods, and exposed soil or construction materials. Most classes were identified to be mixtures of the pure class types. Using an objective technique for measuring the percentage of wetland along salt marsh boundaries, an analysis was made o f the accuracy o f areal measurement of salt marshes. Accuracies ranged from 89 to 99 percent.,nasa aircraft photography was used as the basis for determining the true areal size of salt marshes in the study sites. 1. NTRODUCTON The purpose of this paper is to report on the application of two classification algorithms to ERTS-1 multispectral scanner (MSS) system corrected data acquired over the Galveston Bay (Texas) area on August 29, 1972 (Scene D'S and ). Specifically, two algorithms (SOCLS and NSCLAS) available at the NASA Johnson Space Center (JSC) were used to produce classification symbol maps of portions of the Texas coastal zone. The resulting classes then were related to an information hierarchy selected for the MSC ERTS-1 coastal estuarine investigation. Level 1 Water HERARCHY OF COASTAL FEATURES Level 2 Water Mass Features Bottom Features Level 3 Turbid water Productive water. Nonproductive water Vegetated Nonvegetated Sand (beaches, spoil) Nonwater Wetland Vegetated Open water Nonvegetated Other Photography obtained by the NASA WE-57 aircraft on August 30, 1972, was used to aid in the identification of the classes defined by the algorithms and to provide a basis for the measurement of the true area of selected features such as water bodies and marsh Original photography may be Burchased EROS Data Center loth and Dakota Avenue \ iou Fails, Sp 57_198 - '

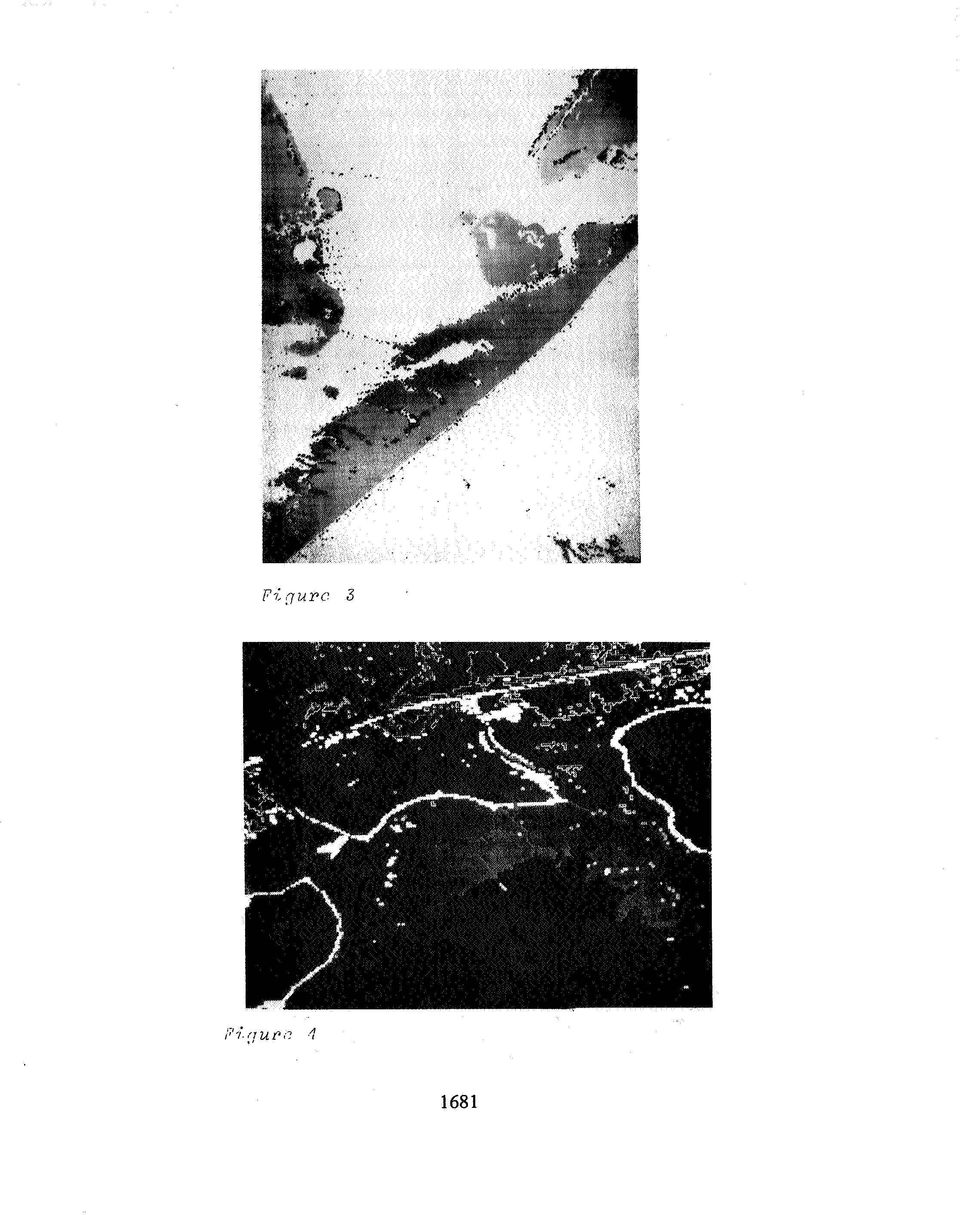
2 2. METHOD OF ANALYSS Two study sites were edited from ERTS-1 MSS system corrected data contained in frames and These sites covered (1) Trinity River Delta area including salt, brackish, and fresh water marshes, and (2) Galveston sland, West Bay, Pelican sland, and offshore Gulf waters. One computer compatible tape (CCT) containing the Galveston data was sent to Purdue University. This data set could then be analyzed through the use of the remote terminal at JSC. Both sets could be analyzed by JSC systems. Since the two study sites exhibited natural features of complex configuration and unknown spatial extent, it was decided to use classification algorithms to produce classification symbol maps of the sites. Each of the two algorithms (SOCLS and NSCLAS) attempts to partition the data into spectrally homogeneous groups. They then generate classification maps to display the geographical regions in which these homogeneous groups of aata occur. A detailed description of SOCLS can be found in references 1 through 5. A description of NSCLAS is given in reference 6. Photography (film 2443, color R) of the study sites was obtained by the NASA WB-57 aircraft from 60,000 feet (MSL) on August 30, 1972, one day after the subject ERTS-1 data. The photography was rectified and enlarged to a scale of 1:41,200. Then, wetland areas were delineated by coastal analysis team members. The area of each delineation was determined through the use of a photographic data quantizer (planimeter). Field trips into the sites were made to aid in the identification of classes defined by SOCLS in that si te. Photo interpreters identified classes in both sites through the use of the aircraft photography. n the case of the areal measurement of the wetland areas in the Galveston site, an objective techniquk described in reference 7 in this symposium was used to count picture elements and partial picture elements on the boundary of the marsh. 3. RESULTS Space does not permit the inclusion of all of the color coded classification maps produced during the present analysis effort. Examples of level two maps in each site are shown in figures 1 and 2 (originals are in color). n figure 2, four classes are shown: water, forested areas, vegetation including marsh, and bare soil/beach/asphalt/concrete. n figure 3, three classes are shown: water, wetland (marsh), and other. 4. WETLAND ANALYSS Using the objective technique described in reference 7 (this symposium), the areas of three wetlands were determined. The results are given in table. TABLE.- RESULTS OF DETERMNNG AREA OF WETLANDS FROM ERTS-1 DATA THROUGH AN OBJECTVE TECHNQUE ESTMATED AREA PERCENT ACCURACY WETLAND (ACRES) TRUE AREA NUMBER SOCLS NSCLAS (ACRES) SOCLS NSCLAS * The accuracies in wetland (marsh) area measurement are quite high. Both algorithms accurately define wetland features and boundary classes. t is not possible at this time to determine the more superior algorithm; however, SOCLS on the UNVAC 1108 was able to handle a larger number of data points than NSCLAS on the BM 360/67 at Purdue University. 5. MXTURE PROBLEM A graph depicting the position of cluster means in the first and fourth channels of the ERTS-1 MSS is shown for the Trinity site in figure 4 for a 1676

3 30-cluster case, which will be the subject for the remainder of this discussion. This figure is a good representation of the data and of the results of the cluster analysis. With few exceptions the second and third channels of the MSS add little new information. The clusters obtained here are, for the most part, mixtures of some of the major classes that exist on the surface. The remaining clusters can be uniquely related to these major classes. The following table shows those clusters that can be so related: Cluster dentification B,R,D,N,S C Class Vegetation eeiizing trees Pine Trees Hardwoods Beach/asphalt/concrete Bare soil Water The clusters have been identified by assigning to them consecutive arbitrary. Up to five clusters can be identified as belonging to water bodies. No quantitative relationship can be assigned to these clusters at this time because there was no concurrent water survey on the date of the ERTS pass, The following is a general description of the type of water clusters and where they occur: symbols 1, 2?..., 9, A, B,... Cluster dentification 1 G H L S Class or Description Bay -tly turbid) Turbid (fresh or saline) water Highly turbid water, very shallow water, or underwater spoil banks Fresh water that occurs in lakes Turbid fresh water or turbid water with a small amount of vegetation (less than 10 percent). The clustering analysis differentiates forested areas from other types of vegetation. Within the forested areas, pine trees and hardwoods can also be differentiated and assigned to separate clusters. Vegetation types other than trees cannot be separated. Specifically, the same combination of clusters occur over vegetated areas which are known to contain different classes such as Phra mites communes, S artina s artinae, and pasture land. On: conspicuous f a c h i : investigation has brought forth is that a good part of the data can be related to a mixture of two or more classes found on the surface. n the case of wetlands area, the proportion of classes contributing to a particular mixture varies in a continuous fashion over the possible range. Under these circumstances there are no natural groupings of the data; so the clustering program tends to partition the data at arbitrary places. t may be noted that data assigned to clusters which represent a mixture of classes, can be obtained by linearly combining data assigned to clusters identified with one of the major classes. This fact may be easily seen by inspecting figure 4 where, for example, data points in cluster 8 can be obtained by linearly combining data points in clusters 5 and 6. n this manner, a range of ratios of a particular mixture can be extracted from the data. The following table represents this range for the water/vegetation mixture. These numbers represent an estimate only and are not the result of a statistical study. 1677

4 Cluster dentification Ratio of Water E l-* N R Other mixtures could consist of almost any possible combination of the major classes that have been identified. The following table presents a list of possible rnixutres that have been verified: Cluster dentification 4 C 0 8 Mixture Hardwoods; pines and vegetation (excl. trees) Pines; hardwoods and water Dense pines; trees and water Pines and vegetation (excl. trees); hardwoods vegetation (excl. water) and water Marsh; vegetation and water Water and bare soil/beach/asphalt in increasing proportion of bare soil/beach/ asphal t Vegetation and bare soil/beach/asphalt/concrete in increasing proportion of bare soil/beach/asphalt/concrete Vegetation, water, and bare soil/beach/asphalt/concrete in increasing proportion of bare soil/beach/asphalt/concrete 6. CONCLUSON Two clustering algorithms were used to produce classification maps of the Trinity River delta area (Scene D ) and the Galveston area (scene D ) from data obtained on August 29, Seventeen to thirty classes were defined. Most of these classes represented mixtures of land, water, and vegetation including forest. Through the use of a cluster diagram, ranges of percent of water and wetland were assigned to some classes. mprovements would result if a statistical approach were used for the mixture problem. 7. RECOMMENDATONS Further analysis is needed to determine whether the position of cluster centers in the cluster diagram can be used to identify the cluster as representing a certain class of coastal features
 Pines; hardwoods and water Dense pines; trees and water Pines and vegetation (excl. trees); hardwoods vegetation (excl.")
5 REFERENCES 1. Ball, G. H., and Hall, D. J.: A Clustering Technique for Summarizing Multivariate Data, Behavioral Science, Volume 12, Ball, G. H., and Hall, D. J.: SODATA. A Novel Technique for Data Analysis and Pattern Classification. TeJ Standard Research nstitute, May Kan, E. P. F.: "The Latest Version of SODATA(A)/SOCLS", Lockheed Electronics Company, nc., HASD, Houston, Texas, Technical Memorandum TM , September Kan, E. P. F.; and Holley, W. A. : "More on Clustering With Final Recommendations on SODATA," Lockheed Electronics Company, nc., Houston, Texas, Technical Rep. 640-TR-112, May Minter, R. T.: "SOCLS, terative Self-organizing Glustering Program", Lockheed Electronics Company, nc., HASD, Houston, Texas, Computer Program Documentation CPD202, October Swain, Pitt.: "Pattern Recognition: A Basis for Remote Sensing Data Analysis", LARS nformation Note 11572, West Lafayette, Purdue University. 7. Cousin, S. B., Anderson, A. C., Paris, J. F., Potter, J. F.: "Significant Techniques in the Processing and nterpretation of ERTS-1 Data", Lockheed Electronics Company, nc., HASD, Houston, Texas. 1679

6 Figure U 5 O S 20 2s 1 cuss cmm a ms-1 Figure 2 LOCatlO" d Cl., cmtl, 167 Trlnlcy m1u. 1680

7 1681
Comparison of Satellite Imagery and Conventional Aerial Photography in Evaluating a Large Forest Fire
 Purdue University Purdue e-pubs LARS Symposia Laboratory for Applications of Remote Sensing --98 Comparison of Satellite Imagery and Conventional Aerial Photography in Evaluating a Large Forest Fire G.
Image Analysis CHAPTER 16 16.1 ANALYSIS PROCEDURES
 CHAPTER 16 Image Analysis 16.1 ANALYSIS PROCEDURES Studies for various disciplines require different technical approaches, but there is a generalized pattern for geology, soils, range, wetlands, archeology,
WATER BODY EXTRACTION FROM MULTI SPECTRAL IMAGE BY SPECTRAL PATTERN ANALYSIS
 WATER BODY EXTRACTION FROM MULTI SPECTRAL IMAGE BY SPECTRAL PATTERN ANALYSIS Nguyen Dinh Duong Department of Environmental Information Study and Analysis, Institute of Geography, 18 Hoang Quoc Viet Rd.,
Environmental Remote Sensing GEOG 2021
 Environmental Remote Sensing GEOG 2021 Lecture 4 Image classification 2 Purpose categorising data data abstraction / simplification data interpretation mapping for land cover mapping use land cover class
USE OF REMOTE SENSING FOR MONITORING WETLAND PARAMETERS RELEVANT TO BIRD CONSERVATION
 USE OF REMOTE SENSING FOR MONITORING WETLAND PARAMETERS RELEVANT TO BIRD CONSERVATION AURELIE DAVRANCHE TOUR DU VALAT ONCFS UNIVERSITY OF PROVENCE AIX-MARSEILLE 1 UFR «Sciences géographiques et de l aménagement»
RESULTS. that remain following use of the 3x3 and 5x5 homogeneity filters is also reported.
 RESULTS Land Cover and Accuracy for Each Landsat Scene All 14 scenes were successfully classified. The following section displays the results of the land cover classification, the homogenous filtering,
MAPPING MINNEAPOLIS URBAN TREE CANOPY. Why is Tree Canopy Important? Project Background. Mapping Minneapolis Urban Tree Canopy.
 MAPPING MINNEAPOLIS URBAN TREE CANOPY Why is Tree Canopy Important? Trees are an important component of urban environments. In addition to their aesthetic value, trees have significant economic and environmental
Texas Prairie Wetlands Project (TPWP) Performance Monitoring
 Performance Monitoring") Texas Prairie Wetlands Project (TPWP) Performance Monitoring Relationship to Gulf Coast Joint Venture (GCJV) Habitat Conservation: Priority Species: Wintering waterfowl species in the Texas portion of
Texas Prairie Wetlands Project (TPWP) Performance Monitoring Relationship to Gulf Coast Joint Venture (GCJV) Habitat Conservation: Priority Species: Wintering waterfowl species in the Texas portion of
MOVING FORWARD WITH LIDAR REMOTE SENSING: AIRBORNE ASSESSMENT OF FOREST CANOPY PARAMETERS
 MOVING FORWARD WITH LIDAR REMOTE SENSING: AIRBORNE ASSESSMENT OF FOREST CANOPY PARAMETERS Alicia M. Rutledge Sorin C. Popescu Spatial Sciences Laboratory Department of Forest Science Texas A&M University
Briefing Paper on Lower Galveston Bay and Bayou Watersheds Lower Bay I: Armand Bayou to Moses Lake and Adjacent Bay Waters
 Briefing Paper on Lower Galveston Bay and Bayou Watersheds Lower Bay I: Armand Bayou to Moses Lake and Adjacent Bay Waters Jim Lester, PhD. and Lisa Gonzalez Houston Advanced Research Center Galveston
JACIE Science Applications of High Resolution Imagery at the USGS EROS Data Center
 JACIE Science Applications of High Resolution Imagery at the USGS EROS Data Center November 8-10, 2004 U.S. Department of the Interior U.S. Geological Survey Michael Coan, SAIC USGS EROS Data Center coan@usgs.gov
AERIAL PHOTOGRAPHS. For a map of this information, in paper or digital format, contact the Tompkins County Planning Department.
 AERIAL PHOTOGRAPHS What are Aerial Photographs? Aerial photographs are images of the land taken from an airplane and printed on 9 x9 photographic paper. Why are Aerial Photographs Important? Aerial photographs
APPLICATION OF MULTITEMPORAL LANDSAT DATA TO MAP AND MONITOR LAND COVER AND LAND USE CHANGE IN THE CHESAPEAKE BAY WATERSHED
 APPLICATION OF MULTITEMPORAL LANDSAT DATA TO MAP AND MONITOR LAND COVER AND LAND USE CHANGE IN THE CHESAPEAKE BAY WATERSHED S. J. GOETZ Woods Hole Research Center Woods Hole, Massachusetts 054-096 USA
2002 URBAN FOREST CANOPY & LAND USE IN PORTLAND S HOLLYWOOD DISTRICT. Final Report. Michael Lackner, B.A. Geography, 2003
 2002 URBAN FOREST CANOPY & LAND USE IN PORTLAND S HOLLYWOOD DISTRICT Final Report by Michael Lackner, B.A. Geography, 2003 February 2004 - page 1 of 17 - TABLE OF CONTENTS Abstract 3 Introduction 4 Study
Remote Sensing and Land Use Classification: Supervised vs. Unsupervised Classification Glen Busch
 Remote Sensing and Land Use Classification: Supervised vs. Unsupervised Classification Glen Busch Introduction In this time of large-scale planning and land management on public lands, managers are increasingly
Existing Land Use Map
 ilsonmiller, nc. does not warrant data provided by other sources for accuracy or property appraisal, survey, or for zoning verification. ilsonmiller, nc. has not verified this data for accuracy nor has
2011 Operations, Maintenance, Monitoring and Rehabilitation Plan
 State of Louisiana Coastal Protection and Restoration Authority of Louisiana 2011 Operations, Maintenance, Monitoring and Rehabilitation Plan for East Marsh Island Marsh Creation State Project Number TV-21
Digital Remote Sensing Data Processing Digital Remote Sensing Data Processing and Analysis: An Introduction and Analysis: An Introduction
 Digital Remote Sensing Data Processing Digital Remote Sensing Data Processing and Analysis: An Introduction and Analysis: An Introduction Content Remote sensing data Spatial, spectral, radiometric and
How To Update A Vegetation And Land Cover Map For Florida
 Florida Vegetation and Land Cover Data Derived from 2003 Landsat ETM+ Imagery Beth Stys, Randy Kautz, David Reed, Melodie Kertis, Robert Kawula, Cherie Keller, and Anastasia Davis Florida Fish and Wildlife
Objectives. Raster Data Discrete Classes. Spatial Information in Natural Resources FANR 3800. Review the raster data model
 Spatial Information in Natural Resources FANR 3800 Raster Analysis Objectives Review the raster data model Understand how raster analysis fundamentally differs from vector analysis Become familiar with
Understanding Raster Data
 Introduction The following document is intended to provide a basic understanding of raster data. Raster data layers (commonly referred to as grids) are the essential data layers used in all tools developed
RESOLUTION MERGE OF 1:35.000 SCALE AERIAL PHOTOGRAPHS WITH LANDSAT 7 ETM IMAGERY
 RESOLUTION MERGE OF 1:35.000 SCALE AERIAL PHOTOGRAPHS WITH LANDSAT 7 ETM IMAGERY M. Erdogan, H.H. Maras, A. Yilmaz, Ö.T. Özerbil General Command of Mapping 06100 Dikimevi, Ankara, TURKEY - (mustafa.erdogan;
Coastal Engineering Indices to Inform Regional Management
 Coastal Engineering Indices to Inform Regional Management Lauren Dunkin FSBPA 14 February 2013 Outline Program overview Standard products Coastal Engineering Index Conclusion and future work US Army Corps
Visualization of large data sets using MDS combined with LVQ.
 Visualization of large data sets using MDS combined with LVQ. Antoine Naud and Włodzisław Duch Department of Informatics, Nicholas Copernicus University, Grudziądzka 5, 87-100 Toruń, Poland. www.phys.uni.torun.pl/kmk
Assessing Hurricane Katrina Damage to the Mississippi Gulf Coast Using IKONOS Imagery
 Assessing Hurricane Katrina Damage to the Mississippi Gulf Coast Using IKONOS Imagery Joseph P. Spruce Science Systems and Applications, Inc. John C., MS 39529 Rodney McKellip NASA Project Integration
U.S. Geological Survey Earth Resources Operation Systems (EROS) Data Center
 Data Center") U.S. Geological Survey Earth Resources Operation Systems (EROS) Data Center World Data Center for Remotely Sensed Land Data USGS EROS DATA CENTER Land Remote Sensing from Space: Acquisition to Applications
U.S. Geological Survey Earth Resources Operation Systems (EROS) Data Center World Data Center for Remotely Sensed Land Data USGS EROS DATA CENTER Land Remote Sensing from Space: Acquisition to Applications
Water Monitoring System Website User Guide www.fldep-stevens.com
 Florida Department of Environmental Protection Division of State Lands Bureau of Survey and Mapping Water Monitoring System Website User Guide www.fldep-stevens.com Provided by Stevens Water Monitoring
Remote Sensing and GIS Application In Change Detection Study In Urban Zone Using Multi Temporal Satellite
 Remote Sensing and GIS Application In Change Detection Study In Urban Zone Using Multi Temporal Satellite R.Manonmani, G.Mary Divya Suganya Institute of Remote Sensing, Anna University, Chennai 600 025
Coastline change detection using remote sensing
 Int. J. Environ. Sci. Tech., 4 (1): 61-66, 2007 ISSN: 1735-1472 Winter 2007, IRSEN, CEERS, IAU A. A. Alesheikh, et al. Coastline change detection using remote sensing 1 A. A. Alesheikh, 2 A. Ghorbanali,
APPLICATION OF TERRA/ASTER DATA ON AGRICULTURE LAND MAPPING. Genya SAITO*, Naoki ISHITSUKA*, Yoneharu MATANO**, and Masatane KATO***
 APPLICATION OF TERRA/ASTER DATA ON AGRICULTURE LAND MAPPING Genya SAITO*, Naoki ISHITSUKA*, Yoneharu MATANO**, and Masatane KATO*** *National Institute for Agro-Environmental Sciences 3-1-3 Kannondai Tsukuba
Land Disturbance, Erosion Control and Stormwater Management Checklist. Walworth County Land Conservation Department
 Land Disturbance, Erosion Control and Stormwater Management Checklist Walworth County Land Conservation Department The following checklist is designed to assist the applicant in complying with the Walworth
SESSION 8: GEOGRAPHIC INFORMATION SYSTEMS AND MAP PROJECTIONS
 SESSION 8: GEOGRAPHIC INFORMATION SYSTEMS AND MAP PROJECTIONS KEY CONCEPTS: In this session we will look at: Geographic information systems and Map projections. Content that needs to be covered for examination
Applying High-resolution Satellite Imagery and Remotely Sensed Data to Local Government Applications
 Applying High-resolution Satellite Imagery and Remotely Sensed Data to Local Government Applications Sioux Falls, South Dakota Presentation Prepared by Steven J. Van Aartsen City of Sioux Falls GIS November
Monitoring Riparian Areas With a Camera
 Monitoring Riparian Areas With a Camera By Michael DeLasaux 1, Holly George 2, and Philip Mainwaring 3 Riparian areas are next to streams, springs, rivers, ponds and lakes. Physical characteristics that
THE DETAILS OF REAL-TIME REPORT CARDING THROUGH LOUISIANA S COASTWIDE REFERENCE MONITORING SYSTEM
 THE DETAILS OF REAL-TIME REPORT CARDING THROUGH LOUISIANA S COASTWIDE REFERENCE MONITORING SYSTEM Sarai Piazza, Marc Comeaux, Craig Conzelmann, & Dona Weifenbach CEER July 30, 2014 CRMS - Coastal Wetlands
ANALYSIS OF FOREST CHANGE IN FIRE DAMAGE AREA USING SATELLITE IMAGES
 ANALYSIS OF FOREST CHANGE IN FIRE DAMAGE AREA USING SATELLITE IMAGES Joon Mook Kang, Professor Joon Kyu Park, Ph.D Min Gyu Kim, Ph.D._Candidate Dept of Civil Engineering, Chungnam National University 220
Remote Sensing in Natural Resources Mapping
 Remote Sensing in Natural Resources Mapping NRS 516, Spring 2016 Overview of Remote Sensing in Natural Resources Mapping What is remote sensing? Why remote sensing? Examples of remote sensing in natural
REGIONAL SEDIMENT MANAGEMENT: A GIS APPROACH TO SPATIAL DATA ANALYSIS. Lynn Copeland Hardegree, Jennifer M. Wozencraft 1, Rose Dopsovic 2 INTRODUCTION
 REGIONAL SEDIMENT MANAGEMENT: A GIS APPROACH TO SPATIAL DATA ANALYSIS Lynn Copeland Hardegree, Jennifer M. Wozencraft 1, Rose Dopsovic 2 ABSTRACT: Regional sediment management (RSM) requires the capability
WONDERFUL, WATERFUL WETLANDS
 WONDERFUL, WATERFUL WETLANDS OBJECTIVES The student will do the following: 1. List characteristics of wetlands. SUBJECTS: Science, Language Arts TIME: 60 minutes 2. Describe the functions of a wetland.
RESTORATION AND ENHANCEMENT OF SOUTHERN CALIFORNIA LAGOONS
 RESTORATION AND ENHANCEMENT OF SOUTHERN CALIFORNIA LAGOONS by Hany Elwany, Ph.D. Scripps Institution of Oceanography Headwaters to Oceans Conference 25 October 2003 CE Ref #03-22 San Diego County Lagoons
Government 98dn Mapping Social and Environmental Space
 Government 98dn Mapping Social and Environmental Space LAB EXERCISE 5: The Analysis of Fields Objectives of this lab: Visualizing raster data Using Spatial Analyst functions to create new data Analysis
Most informed people realize that cumulative impacts have had
 Welcome to the First Issue of Rivers & Coast! The goal of the new Rivers & Coast newsletter is to keep readers well informed of current scientific understanding behind key environmental issues related
Remote sensing for the MTS
 Remote sensing for the MTS Jennifer M. Wozencraft Director, Program Manager, USACE National Coastal Mapping Program 24 June 2014, Innovative Technologies for a Resilient MTS Outline Background JALBTCX
Comprehensive Recommendations Supporting the Use of the Multiple Lines of Defense Strategy to Sustain Coastal Louisiana 2008 Report (Version I)
") Comprehensive Recommendations Supporting the Use of the Multiple Lines of Defense Strategy to Sustain Coastal Louisiana 2008 Report (Version I) This report recommends integrated coastal projects and levee
Comprehensive Recommendations Supporting the Use of the Multiple Lines of Defense Strategy to Sustain Coastal Louisiana 2008 Report (Version I) This report recommends integrated coastal projects and levee
Remaining Wetland Acreage 1,500,000 915,960 584,040-39%
 NEW JERSEY Original Wetland Acreage Remaining Wetland Acreage Acreage Lost % Lost 1,500,000 915,960 584,040-39% New Jersey Wetlands: Nearly 99 percent of New Jersey s wetlands are palustrine or estuarine.
Selecting the appropriate band combination for an RGB image using Landsat imagery
 Selecting the appropriate band combination for an RGB image using Landsat imagery Ned Horning Version: 1.0 Creation Date: 2004-01-01 Revision Date: 2004-01-01 License: This document is licensed under a
Using Aerial Photography to Measure Habitat Changes. Method
 Then and Now Using Aerial Photography to Measure Habitat Changes Method Subject Areas: environmental education, science, social studies Conceptual Framework Topic References: HIIIB, HIIIB1, HIIIB2, HIIIB3,
A HIERARCHICAL APPROACH TO LAND USE AND LAND COVER MAPPING USING MULTIPLE IMAGE TYPES ABSTRACT INTRODUCTION
 A HIERARCHICAL APPROACH TO LAND USE AND LAND COVER MAPPING USING MULTIPLE IMAGE TYPES Daniel L. Civco 1, Associate Professor James D. Hurd 2, Research Assistant III Laboratory for Earth Resources Information
Risk Analysis, GIS and Arc Schematics: California Delta Levees
 Page 1 of 7 Author: David T. Hansen Risk Analysis, GIS and Arc Schematics: California Delta Levees Presented by David T. Hansen at the ESRI User Conference, 2008, San Diego California, August 6, 2008 Abstract
Field Techniques Manual: GIS, GPS and Remote Sensing
 Field Techniques Manual: GIS, GPS and Remote Sensing Section A: Introduction Chapter 1: GIS, GPS, Remote Sensing and Fieldwork 1 GIS, GPS, Remote Sensing and Fieldwork The widespread use of computers
Partitioning the Conterminous United States into Mapping Zones for Landsat TM Land Cover Mapping
 Partitioning the Conterminous United States into Mapping Zones for Landsat TM Land Cover Mapping Collin Homer Raytheon, EROS Data Center, Sioux Falls, South Dakota 605-594-2714 homer@usgs.gov Alisa Gallant
Operational snow mapping by satellites
 Hydrological Aspects of Alpine and High Mountain Areas (Proceedings of the Exeter Symposium, Juiy 1982). IAHS Publ. no. 138. Operational snow mapping by satellites INTRODUCTION TOM ANDERSEN Norwegian Water
Harris - Galveston Subsidence District
 Harris - Galveston Subsidence District History of Subsidence, Regulation, and Water Management in the Houston Region Michael J. Turco - General Manager ASSOCIATION OF WATER BOARD DIRECTORS GUEST LECTURE
Vegetation Resources Inventory
 Vegetation Resources Inventory Guidelines for Preparing a Project Implementation Plan for Photo Interpretation Prepared by Ministry of Sustainable Resource Management Terrestrial Information Branch for
Weed Survey and Mapping
 Weed Survey and Mapping The primary objective of weed surveying and mapping is to accurately identify and delineate land with populations of invasive plants or noxious weeds. These surveys allow land managers
Coastwide Reference Monitoring System Wetlands (CRMS-Wetlands) Project Update
 Project Update") Coastwide Reference Monitoring System Wetlands (CRMS-Wetlands) Project Update Louisiana Department of Natural Resources Coastal Restoration Division U.S. Geological Survey National Wetlands Research Center
Coastwide Reference Monitoring System Wetlands (CRMS-Wetlands) Project Update Louisiana Department of Natural Resources Coastal Restoration Division U.S. Geological Survey National Wetlands Research Center
CRMS Website Training
 CRMS Website Training March 2013 http://www.lacoast.gov/crms Coastwide Reference Monitoring System - Wetlands CWPPRA Restoration Projects Congressionally funded in 1990 Multiple restoration techniques
Using Remote Sensing Imagery to Evaluate Post-Wildfire Damage in Southern California
 Graham Emde GEOG 3230 Advanced Remote Sensing February 22, 2013 Lab #1 Using Remote Sensing Imagery to Evaluate Post-Wildfire Damage in Southern California Introduction Wildfires are a common disturbance
Digital image processing
 746A27 Remote Sensing and GIS Lecture 4 Digital image processing Chandan Roy Guest Lecturer Department of Computer and Information Science Linköping University Digital Image Processing Most of the common
Mapping coastal landscapes in Sri Lanka - Report -
 Mapping coastal landscapes in Sri Lanka - Report - contact : Jil Bournazel jil.bournazel@gmail.com November 2013 (reviewed April 2014) Table of Content List of Figures...ii List of Tables...ii Acronyms...ii
Application of airborne remote sensing for forest data collection
 Application of airborne remote sensing for forest data collection Gatis Erins, Foran Baltic The Foran SingleTree method based on a laser system developed by the Swedish Defense Research Agency is the first
Texas A&M University at Galveston Jack K. Williams Library
 Jack K. Williams Library Dr. Thomas L. Linton Research Files: Inventory Creator: Linton, Thomas L. Title: Research Files Date: 1981-1988. Abstract: Retired faculty from the Department of Wildlife and Fisheries
Research On The Classification Of High Resolution Image Based On Object-oriented And Class Rule
 Research On The Classification Of High Resolution Image Based On Object-oriented And Class Rule Li Chaokui a,b, Fang Wen a,b, Dong Xiaojiao a,b a National-Local Joint Engineering Laboratory of Geo-Spatial
The National Park Service Inventory & Monitoring Program Student Opportunities
 NPS Inventory and Monitoring Program The National Park Service Inventory & Monitoring Program Student Opportunities Sara Stevens Program Manager NPS Inventory and Monitoring Program NPS Programs at URI
TAMARISK MAPPING & MONITORING USING HIGH RESOLUTION SATELLITE IMAGERY. Jason W. San Souci 1. John T. Doyle 2
 TAMARISK MAPPING & MONITORING USING HIGH RESOLUTION SATELLITE IMAGERY Jason W. San Souci 1 John T. Doyle 2 ABSTRACT QuickBird high resolution multispectral satellite imagery (60 cm GSD, 4 spectral bands)
ABSTRACT INTRODUCTION PURPOSE
 EVALUATION OF TSUNAMI DISASTER BY THE 2011 OFF THE PACIFIC COAST OF TOHOKU EARTHQUAKE IN JAPAN BY USING TIME SERIES SATELLITE IMAGES WITH MULTI RESOLUTION Hideki Hashiba Associate Professor Department
Imagery. 1:50,000 Basemap Generation From Satellite. 1 Introduction. 2 Input Data
 1:50,000 Basemap Generation From Satellite Imagery Lisbeth Heuse, Product Engineer, Image Applications Dave Hawkins, Product Manager, Image Applications MacDonald Dettwiler, 3751 Shell Road, Richmond B.C.
COMPARISON OF OBJECT BASED AND PIXEL BASED CLASSIFICATION OF HIGH RESOLUTION SATELLITE IMAGES USING ARTIFICIAL NEURAL NETWORKS
 COMPARISON OF OBJECT BASED AND PIXEL BASED CLASSIFICATION OF HIGH RESOLUTION SATELLITE IMAGES USING ARTIFICIAL NEURAL NETWORKS B.K. Mohan and S. N. Ladha Centre for Studies in Resources Engineering IIT
Intro to GIS Winter 2011. Data Visualization Part I
 Intro to GIS Winter 2011 Data Visualization Part I Cartographer Code of Ethics Always have a straightforward agenda and have a defining purpose or goal for each map Always strive to know your audience
Present Status of Coastal Environmental Monitoring in Korean Waters. Using Remote Sensing Data
 Present Status of Coastal Environmental Monitoring in Korean Waters Using Remote Sensing Data Sang-Woo Kim, Young-Sang Suh National Fisheries Research & Development Institute #408-1, Shirang-ri, Gijang-up,
Land Use/Land Cover Map of the Central Facility of ARM in the Southern Great Plains Site Using DOE s Multi-Spectral Thermal Imager Satellite Images
 Land Use/Land Cover Map of the Central Facility of ARM in the Southern Great Plains Site Using DOE s Multi-Spectral Thermal Imager Satellite Images S. E. Báez Cazull Pre-Service Teacher Program University
LAND USE INFORMATION SYSTEM: ADAPTATION OF THE USGS SYSTEM FOR REGIONAL PLANNING
 Jim Meldrum Programmer Analyst Connie Blackmon Director of Data Services Atlanta Regional Commission 100 Edgewood Avenue NE, Suite 1801 Atlanta, Georgia 30335 LAND USE INFORMATION SYSTEM: ADAPTATION OF
Calculation of Minimum Distances. Minimum Distance to Means. Σi i = 1
 Minimum Distance to Means Similar to Parallelepiped classifier, but instead of bounding areas, the user supplies spectral class means in n-dimensional space and the algorithm calculates the distance between
What is the Ecological Role of an Estuary?
 Estuary Values and Changes Activity 1 of Two To most people, an estuary (es-chew-airy) is a place where fresh water meets the sea. In its broader meaning, an estuary is that part of the mouth of a stream
Landsat Monitoring our Earth s Condition for over 40 years
 Landsat Monitoring our Earth s Condition for over 40 years Thomas Cecere Land Remote Sensing Program USGS ISPRS:Earth Observing Data and Tools for Health Studies Arlington, VA August 28, 2013 U.S. Department
ForeCAST : Use of VHR satellite data for forest cartography
 ForeCAST : Use of VHR satellite data for forest cartography I-MAGE CONSULT UCL- Dpt Sciences du Milieu et de l Aménagement du Territoire Description of the partnership I-MAGE Consult Private partner Team
MULTIPURPOSE USE OF ORTHOPHOTO MAPS FORMING BASIS TO DIGITAL CADASTRE DATA AND THE VISION OF THE GENERAL DIRECTORATE OF LAND REGISTRY AND CADASTRE
 MULTIPURPOSE USE OF ORTHOPHOTO MAPS FORMING BASIS TO DIGITAL CADASTRE DATA AND THE VISION OF THE GENERAL DIRECTORATE OF LAND REGISTRY AND CADASTRE E.ÖZER, H.TUNA, F.Ç.ACAR, B.ERKEK, S.BAKICI General Directorate
Digital Cadastral Maps in Land Information Systems
 LIBER QUARTERLY, ISSN 1435-5205 LIBER 1999. All rights reserved K.G. Saur, Munich. Printed in Germany Digital Cadastral Maps in Land Information Systems by PIOTR CICHOCINSKI ABSTRACT This paper presents
Inlets Online: A Tutorial for Evaluating Inlet/Beach Processes Using Aerial Photography
 Inlets Online: A Tutorial for Evaluating Inlet/Beach Processes Using Aerial Photography by Mark R. Byrnes, Feng Li, and Julie D. Rosati PURPOSE: This Coastal and Hydraulics Engineering Technical Note (CHETN)
Communities, Biomes, and Ecosystems
 Communities, Biomes, and Ecosystems Before You Read Before you read the chapter, respond to these statements. 1. Write an A if you agree with the statement. 2. Write a D if you disagree with the statement.
Hurricanes and Storm Surge www.hcfcd.org/tropicalweather
 Hurricanes and Storm Surge www.hcfcd.org High-level winds fl ow outward Strong surface winds spiral inward EYE Calm, sometimes cloudfree, sinking air Air sinks in calm area at the storm s eye THUNDERSTORMS
DRAFT. Shoreline adaptation alternatives development to determine flood reduction potential and project costs
 Scope of Services Phase 1A: Flood Damage Assessment Economic Analysis of the Delaware Bay Shoreline Adaptation Alternatives Task Order No. 1A Structures/Affected Property Inventory January 13, 2011 Johnson,
An Assessment of the Effectiveness of Segmentation Methods on Classification Performance
 An Assessment of the Effectiveness of Segmentation Methods on Classification Performance Merve Yildiz 1, Taskin Kavzoglu 2, Ismail Colkesen 3, Emrehan K. Sahin Gebze Institute of Technology, Department
Urban Ecosystem Analysis For the Houston Gulf Coast Region Calculating the Value of Nature
 December 2000 Urban Ecosystem Analysis For the Houston Gulf Coast Region Calculating the Value of Nature Report Contents 2-3 Project Overview and Major Findings 4 Regional Level Analysis 5-7 Local Level
2011 Annual Inspection Report
 State of Louisiana Office of Coastal Protection and Restoration 2011 Annual Inspection Report for TERREBONNE BAY SHORE PROTECTION DEMONSTRATION State Project Number TE45 Priority Project List 10 February
CONTINUING EROSION IN SOUTHEASTERN COASTAL MISSISSIPPI - POINT AUX CHENES BAY, WEST GRAND BAY, MIDDLE BAY, GRANDE BATTURE ISLANDS: 1995-1997
 Summary of a Poster Presented at the: Sixty-Second Annual Meeting of the Mississippi Academy of Sciences in Biloxi, Mississippi February 26-27, 1998 ===============================================================
Massachusetts Department of Environmental Protection Bureau of Resource Protection - Wetlands Program Checklist for Stormwater Report
 Important: When filling out forms on the computer, use only the tab key to move your cursor - do not use the return key. A. Introduction A Stormwater Report must be submitted with the Notice of Intent
3D Model of the City Using LiDAR and Visualization of Flood in Three-Dimension
 3D Model of the City Using LiDAR and Visualization of Flood in Three-Dimension R.Queen Suraajini, Department of Civil Engineering, College of Engineering Guindy, Anna University, India, suraa12@gmail.com
Supervised Classification workflow in ENVI 4.8 using WorldView-2 imagery
 Supervised Classification workflow in ENVI 4.8 using WorldView-2 imagery WorldView-2 is the first commercial high-resolution satellite to provide eight spectral sensors in the visible to near-infrared
How Dense is SALT WATER? Focus Question What is the relationship between density and salinity?
 Focus Question What is the relationship between density and salinity? Activity Overview Fresh water from the Mississippi River pours into the salty ocean water in the Gulf of Mexico. More than 152,400
Resolutions of Remote Sensing
 Resolutions of Remote Sensing 1. Spatial (what area and how detailed) 2. Spectral (what colors bands) 3. Temporal (time of day/season/year) 4. Radiometric (color depth) Spatial Resolution describes how
Outline - needs of land cover - global land cover projects - GLI land cover product. legend. Cooperation with Global Mapping project
 Land Cover Mapping by GLI data Ryutaro Tateishi Center for Environmental Remote Sensing (CEReS) Chiba University E-mail: tateishi@ceres.cr.chiba-u.ac.jp Outline - needs of land cover - global land cover
LIDAR and Digital Elevation Data
 LIDAR and Digital Elevation Data Light Detection and Ranging (LIDAR) is being used by the North Carolina Floodplain Mapping Program to generate digital elevation data. These highly accurate topographic
III THE CLASSIFICATION OF URBAN LAND COVER USING REMOTE SENSING
 The Dynamics of Global Urban Expansion 31 III THE CLASSIFICATION OF URBAN LAND COVER USING REMOTE SENSING 1. Overview and Rationale The systematic study of global urban expansion requires good data that
Multiscale Object-Based Classification of Satellite Images Merging Multispectral Information with Panchromatic Textural Features
 Remote Sensing and Geoinformation Lena Halounová, Editor not only for Scientific Cooperation EARSeL, 2011 Multiscale Object-Based Classification of Satellite Images Merging Multispectral Information with
Multispectral Data Analysis: A Signal Theory Perspective
 Multispectral Data Analysis: A Signal Theory Perspective by David Landgrebe School of Electrical Engineering Purdue University West Lafayette IN 47907-1285 landgreb@ecn.purdue.edu Preface This document
GULF COASTAL URBAN FOREST HAZARD ASSESSMENT AND REMOTE SENSING EFFORTS AFTER HURRICANES KATRINA AND RITA 1
 GULF COASTAL URBAN FOREST HAZARD ASSESSMENT AND REMOTE SENSING EFFORTS AFTER HURRICANES KATRINA AND RITA 1 Kamran K. Abdollahi, Zhu Hua Ning, Daniel Collins, Fulbert Namwamba and Asebe Negatu SU Agricultural
Topic Maps Visualization
 Topic Maps Visualization Bénédicte Le Grand, Laboratoire d'informatique de Paris 6 Introduction Topic maps provide a bridge between the domains of knowledge representation and information management. Topics
VCS REDD Methodology Module. Methods for monitoring forest cover changes in REDD project activities
 1 VCS REDD Methodology Module Methods for monitoring forest cover changes in REDD project activities Version 1.0 May 2009 I. SCOPE, APPLICABILITY, DATA REQUIREMENT AND OUTPUT PARAMETERS Scope This module
Cost Considerations of Using LiDAR for Timber Inventory 1
 Cost Considerations of Using LiDAR for Timber Inventory 1 Bart K. Tilley, Ian A. Munn 3, David L. Evans 4, Robert C. Parker 5, and Scott D. Roberts 6 Acknowledgements: Mississippi State University College