CONTINUING EROSION IN SOUTHEASTERN COASTAL MISSISSIPPI - POINT AUX CHENES BAY, WEST GRAND BAY, MIDDLE BAY, GRANDE BATTURE ISLANDS:
|
|
|
- Melvin Blair
- 8 years ago
- Views:
Transcription
1 Summary of a Poster Presented at the: Sixty-Second Annual Meeting of the Mississippi Academy of Sciences in Biloxi, Mississippi February 26-27, 1998 =============================================================== CONTINUING EROSION IN SOUTHEASTERN COASTAL MISSISSIPPI - POINT AUX CHENES BAY, WEST GRAND BAY, MIDDLE BAY, GRANDE BATTURE ISLANDS: Warren T. O Sullivan G. Alan Criss Cooperative Intern Program between the Mississippi Gulf Coast Community College- Jackson County Campus Honors Biology Students and the USM Institute of Marine Sciences-Gulf Coast Research Laboratory INTRODUCTION This study was conducted to determine rates of erosion in the Point aux Chenes Bay area, located in the extreme southeastern coastal portion of the state of Mississippi and bordering Alabama (Figure 1). The study area contains one of the few remaining extensive stands of coastal marshgrass environments in the state. The Thematic Mapper Simulator (TMS) image in Figure 2 shows the coverage of this marshgrass environment in the study area. Figure 2 is a digital image which was taken on November 21, 1988 from a high-altitude aircraft using an instrument which simulates the spatial and spectral resolution of the Thematic Mapper on the Landsat-5 satellite (pixel resolution 30 m). The near-infrared band ( m) was processed to produce this pseudocolor image in which the locations of Spartina and Juncus marshgrasses are correlated with red shades. Green shades indicate flooded marshgrass locations. The vertical stripe near the center of the image is a few lines of bad digital data, not a physical feature. Since this study began most of the study area has been purchased and designated as part of Grand Bay National Wildlife Refuge (Figure 3). Previous studies have documented the progressive nature of erosion in the study area. The shoreline silhouettes in Figures 4a and 4b were produced in a previous study 1

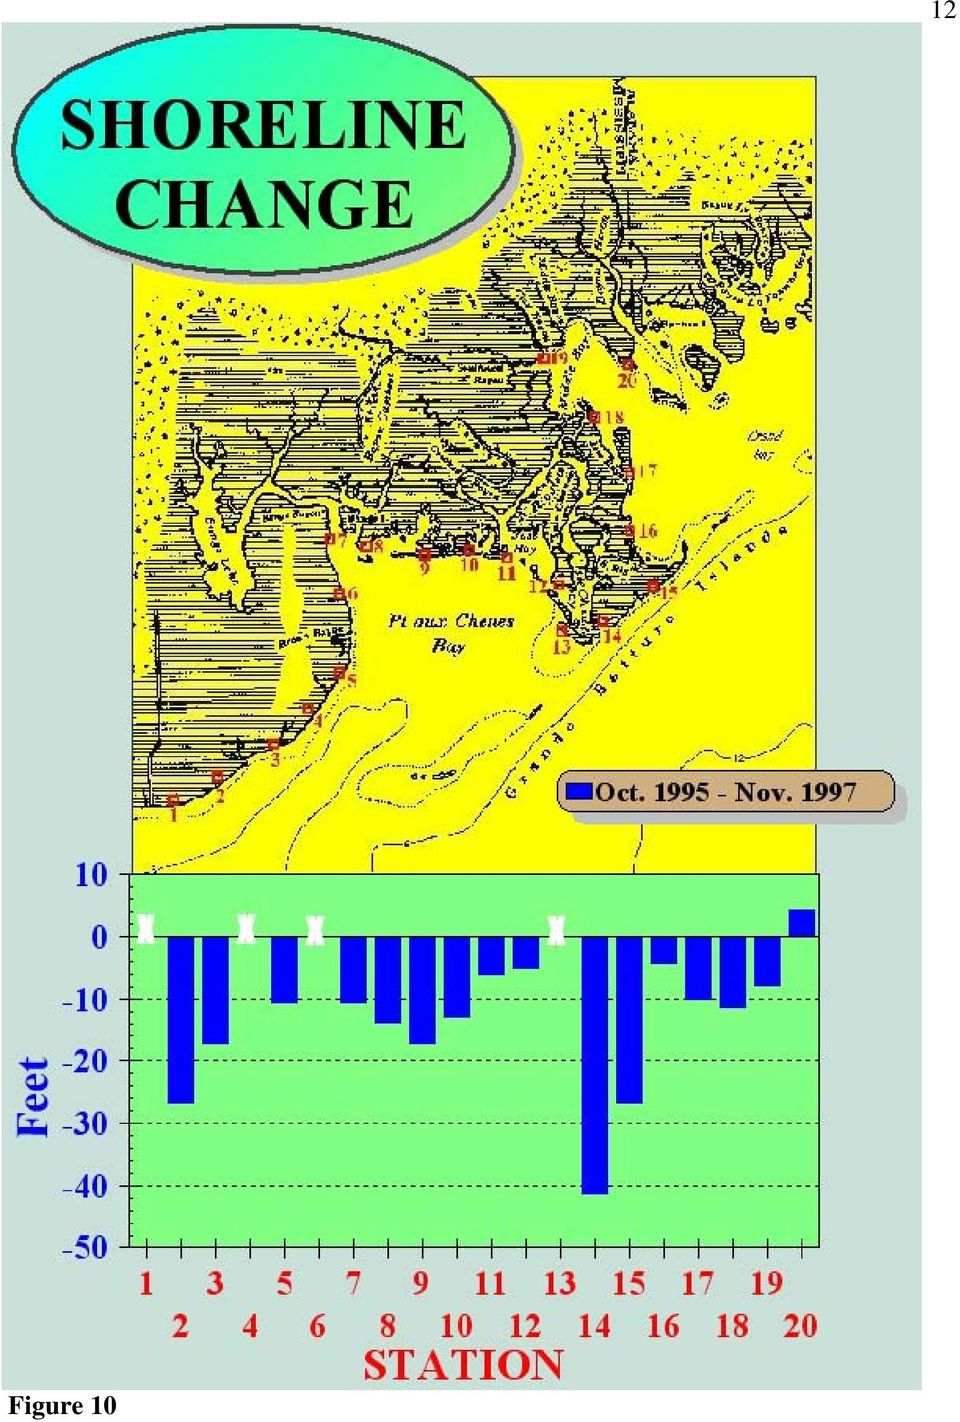
2 (Eleuterius and Criss, 1991) using historical charts, aircraft photos, and satellite images to document the historically dramatic erosion in the study area. Otvos (1990) concluded that a hurricane during the period of bisected a long offshore barrier island into present day Dauphin and Petit Bois Islands. This allowed uninterrupted waves from the Gulf of Mexico to impact the area around Point aux Chenes Bay with the accompanying erosion. Note especially the destruction of the Grande Batture Islands. METHODS After noting the historical erosion in the study area, a series of studies was undertaken to determine the linear loss of shoreline. In July 1992 reference markers were placed at 20 station locations (Figure 5) along the shoreline perimeter of Point aux Chenes Bay, the remnants of the Grande Batture Islands, west Grand Bay, and Middle Bay. White PVC plastic pipes three inches in diameter were placed at the shoreline drop-off at each station location. Another marker was placed 20 feet inland approximately perpendicular to the immediate shoreline trend. Loran-C latitude-longitude were recorded for each marker to facilitate relocation. (Additionally, reference markers had been installed earlier in February 1990 at the position of station number 8.) The stations were revisited in October 1995 to measure the change of the distance of the reference markers from the shoreline location of that date. These measurements indicated the linear erosion over a period of three years and three months. This data was reported by Wacker and Criss (1996). New reference markers were installed a distance inland of markers remaining onshore at each station location. In the present component of this series of studies reported here, the stations were again revisited in November 1997 to measure the change of the distance of the reference markers from the shoreline location of that date (Figure 6: Note the original shoreline marker in the water). These measurements indicated the linear erosion over a period of two years and one month. New reference markers were installed at the shoreline and a distance inland if no markers were found still on-shore. The distance each new reference marker was located inland was based on the linear loss of shore at each station. The distance from shore data was recorded along with the GPS latitude-longitude of each reference marker. 2 DISCUSSION Two scenarios seem to be basically responsible for the processes of erosion in the coastal area. At low water levels in relation to the beach scarp, the breaking or surging of waves against the marsh substrate for a sustained period of time results in undermining of the marsh substrate.

3 3 When the concavity is sufficiently deep, the weight of the unsupported marsh and substrate above falls away in large clumps (Figure 7) which are rapidly broken down by wave action. When the water elevation is high relative to the beach, the breaking waves plunge on top of the marsh substrate. This impact can break away large clumps undermined by the previous scenario. Another important aspect of this scenario is that the sediment laden waters directed inland after impacting the marsh substrate may literally cut away the marsh vegetation leaving only stubble for feet inland (Figure 8), beyond which a fan of sediment is laid down (Figure 9). In some instances the first few inches of the marsh substrate may be removed (Figure 8). Narrow channels maybe cut well inland into the marsh by the attack of waves following this scenario (Figure 8). RESULTS The results of the linear shoreline change measurements at each station during the period October November 1997 are presented in Table 1(see also Figure 10). A question mark indicated that no markers could be found at that station. The minimum linear shoreline loss of 4' 4" occurred at station 16. The maximum linear shoreline loss of 41' 5" occurred at station 14. The only station to gain shoreline was station 20 (4' 2"). The total linear shoreline loss at station 8, which was first measured in February 1990, was 44' 5" between 2/90-11/97 (7 years and 9 months).
, beyond which a fan of sediment is laid down (Figure 9). In some instances the first few inches of the marsh substrate may be removed (Figure 8).")
4 TABLE 1: RESULTS Station Shoreline Change 10 / / ? 2-26' 8" 3-17' 3" 4? 5-10' 7" 6? 7-10' 7" 8-13' 11" (44'5" since 2/90) 9-17' 2" 10-12' 10" 11-6' 1" 12-5' 0" 13? 14-41' 5" 15-26' 9" 16-4' 4" 17-10' 2" 18-11' 4" 19-7' 11" ' 2" Minimum loss = 4' 4" (station 16) Maximum loss = 41' 5" (station 14) Gain = 4' 2" (station 20) 4

5 Figure 1. Study Area 5

6 Figure 2. Thematic Mapper Simulator (TMS) pseudocolor image of the study area 6

7 Figure 3. Proposed acquisition boundary of Grand Bay National Wildlife Refuge 7

8

9

10 Figure 5. Station Locations 10

11 Figure 6 Figure 7 Figure 8 Figure 9 11

12 Figure 10 12
13 13 References Criss, G. A Evaluation of Airborne Thematic Mapper Simulator (TMS) Digital Data and High Altitude Aircraft Infrared Photographs for Assessment of Conditions in the Vicinity of Pt. aux Chenes Bay, Mississippi. Journal of the Mississippi Academy of Sciences 35(Supplement): Eleuterius, C. K Hydrology of Mississippi Sound North of Petit Bois Pass. Mississippi Marine Resources Council. 57 pages. Eleuterius, C. K. and G. A. Criss Point aux Chenes: Past, Present, and Future Perspective of Erosion. Final Report, December Mississippi Department of Wildlife, Fisheries, and Parks, Coastal Division / Bureau of Marine Resources. 45 pages. Eleuterius, C. K. and G. A. Criss Coastal Erosion: Point aux Chenes, Mississippi. Proceedings: America's Sea - Keep It Shining! The Gulf of Mexico Symposium. Innisbrook, Tarpon Springs, Florida, December Environmental Protection Agency's Gulf of Mexico Program. Technical Poster Session. p Eleuterius, C. K. and G. A. Criss Grande Batture Island / Point aux Chenes: A Coastal Erosion Scenario. Journal of the Mississippi Academy of Sciences 37(1): 50. Meyer-Arendt, K. J. and K. A. Kramer Deterioration and Restoration of the Grand Batture Islands, Mississippi. Mississippi Geology 11(4). Otvos, Ervin G Barrier Island Evolution and History of Migration, North-Central Gulf Coast. In: Stephen Leatherman (editor). Barrier Islands. Academic Press. Otvos, Ervin G Barrier Island Formation. Marine Geology 43: Wacker, K. P. and G. A. Criss Erosional Rates in the Point aux Chenes Bay Area, Mississippi: Journal of the Mississippi Academy of Sciences 41(1):67. Reference this poster presentation as: O'Sullivan, W. T. and G. A. Criss Continuing Erosion in Southeastern Coastal Mississippi - Point aux Chenes Bay, West Grand Bay, Middle Bay, Grande Batture Islands: Journal of the Mississippi Academy of Sciences 43(1): 58.

14 APPENDIX I Station locations plotted on aerial imagery mosaic (Positive Systems, 4m resolution, acquired 1998, processed as false color infrared) A-1
