Inform s new World Index
|
|
|
- Osborne McLaughlin
- 9 years ago
- Views:
Transcription
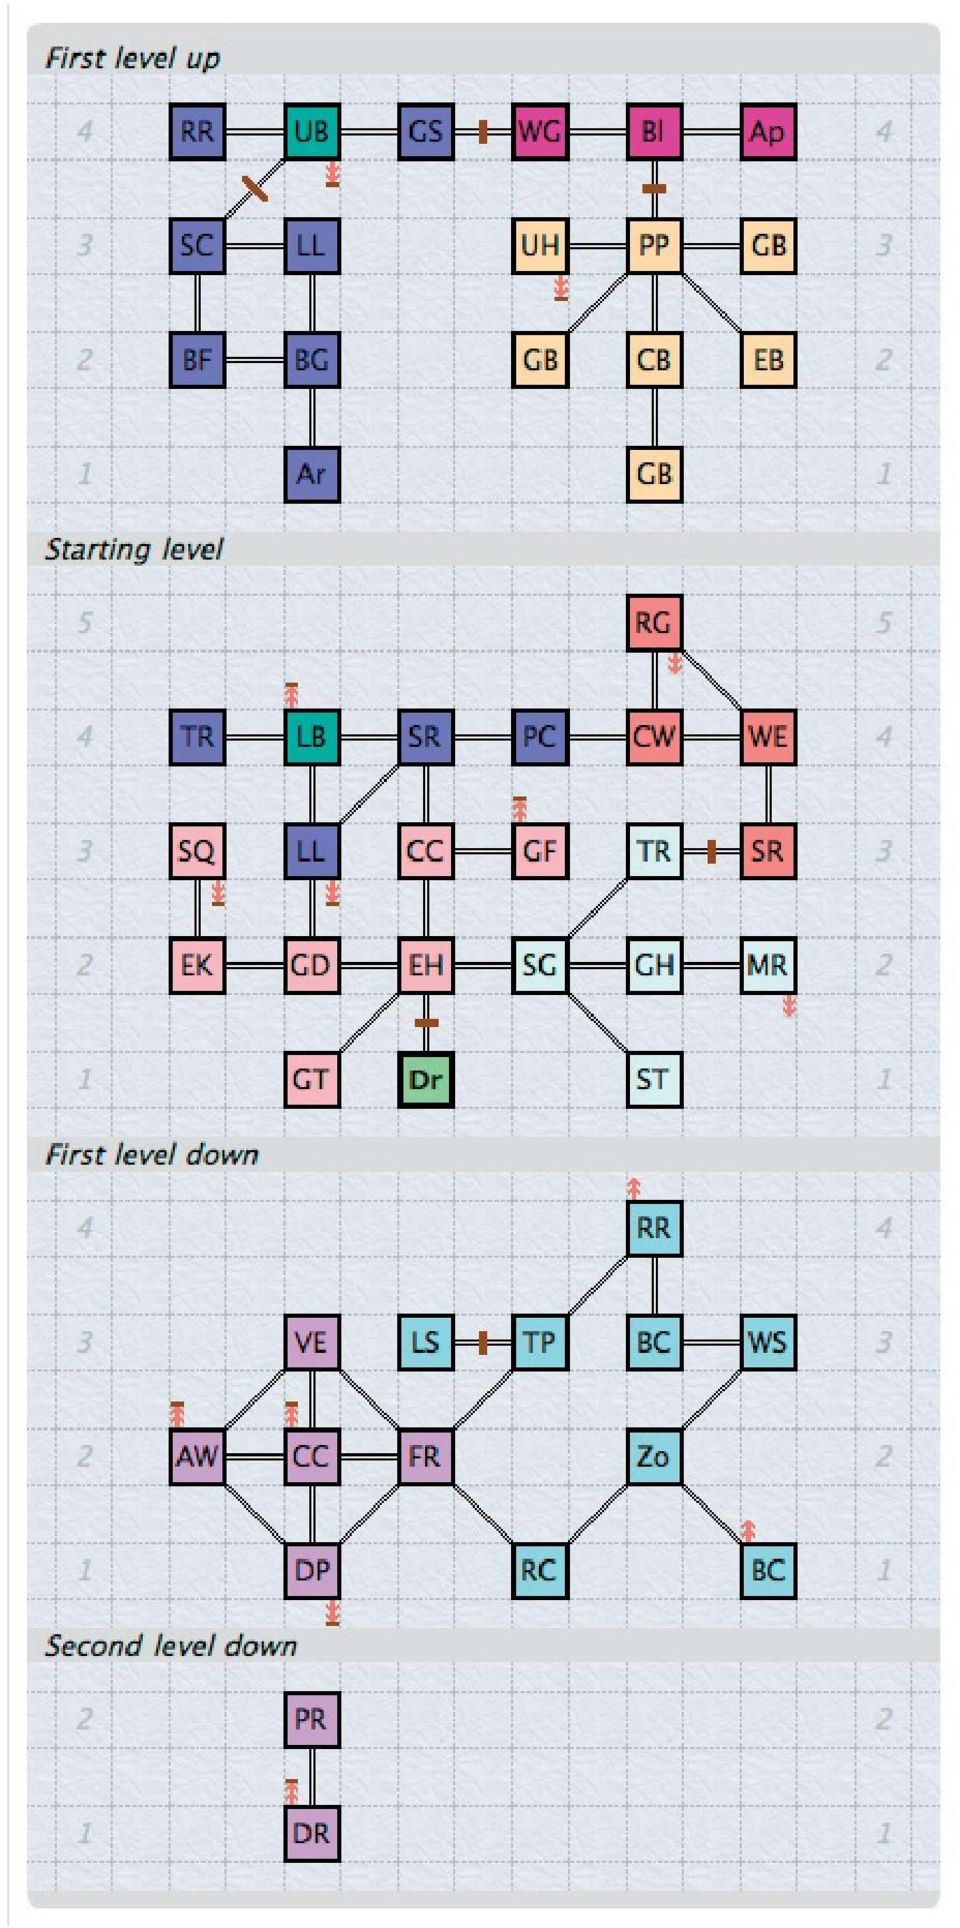
1 Inform s new World Index The December 2010 build of Inform makes the first substantial change to the World Index panel in four years. Some of the changes jump out at you, but others are subtler, and we thought regular users might appreciate a few notes on what s different. We ve noticed that some people use the World Index all the time (and use the keyboard shortcut, -9, to jump to it), but that others hardly ever go there well, perhaps this relaunch will make it worth a second look. 1. How the map is displayed (a) The map has always been rendered on a cubical grid, like a series of floor plans for a building, starting with the top floor and working down to the basement. In past builds the grid itself was invisible, and rooms plotted against high white, but with large maps this made it hard to align distant rooms by eye. So the grid is now visible as dotted lines, and a faint blue-white paper texture underlies even that, making it clearer where the map s boundaries lie. (b) It s also important to be able to align, by eye, an upper with a lower level in particular, to be able to see which room is exactly above which other. The problem isn t the easting, the coordinate along the east-west axis, because upper and lower maps are positioned so that they have the same axis. It s the northing. In this build, faint italic numbers on the graph paper background mark off the north-south axes on each level map, making it much easier to match them up. (c) It often happens that upper levels in very large maps contain just a few rooms turrets or spires poking up from a mostly lower landscape. This can result in wasted vertical screen space, with the uppermost level map consisting of large strips of blankness. Blank rows are now omitted from these maps; the graph paper grid-lines are marked as being broken when this happens, using the same convention statisticians use when they draw broken axes on graphs which have a false origin.

2 2 the new world index (d) The origin room (in which play begins) is emphasised with a bold border as well as a boldface abbreviation. (e) These abbreviations are better chosen. Inform used to do this by taking a room s name and reducing it to one or two capital letters from its initials. Thus Fontana Dam would be FD, North of Rockfish Gap would be NO, Shelter would be S and Monson would be M. The new method skips common connective words like of, and uses consonants inside one-word names to add a lower-case letter to otherwise single-letter abbreviations. Thus we now have FD, NR, Sh and Mn. (Inform falls back on using vowels if no consonants are available; thus Zoo is abbreviated Zo.) This makes it much easier to follow large maps, where the tendency to repeat abbreviations is much reduced. For example, Zone 1 of the London Underground includes stations called Bank, Bayswater, Brixton and Barbican : rather than labelling these B, B, B and B, Inform now labels them Bn, By, Br and Br. (f) For better visual clarity, the I am a hyperlink underlining on these abbrevations has been removed, but they remain links to the details of the rooms in question. Rooms and connections continue to have tool tips appearing if the mouse hovers long enough over them. (g) The display is now better able to show crossovers of awkward long connections, where they occur. For example: Alpha is west of Beta. Gamma is south of Alpha. Delta is north of Beta. Gamma is southwest of Delta. can only be plotted if the E-W and SW-NE connections are about twice the length of the two N-S connections, and they cross over at a 45-degree angle. In previous builds Inform would have had trouble drawing this. (h) If Inform is absolutely forced to place rooms next to each other, even though the map connections they have don t match up, it now draws these with a break in them to indicate this. For example: Alpha is west of Beta. Gamma is south of Alpha. Delta is north of Beta. Gamma is west of Delta. Index map with Alpha mapped west of Delta. (The last line is needed to prevent Inform finding a better layout.) This comes out as a quadrangle of rooms, but in fact those connections are mysteriously making a sort of figure-eight, and the breaks drawn at least draw attention to the mystery. (i) When non-standard directions have been mapped as standard ones, a key at the bottom of the map is now displayed: for example, Mapping starboard as east; port as west; fore as north; aft as south

3 the new world index 3 (j) The inside and outside directions are curiosities. Often they really denote a telescoping of the scale of the geometry: for instance, an IF author might write Inside from the Grassy Meadow is the Ruined Sheepfold. Here the Meadow is imagined as a large area and the Sheepfold a small one, though both are rooms. In mapping terms, if the Sheepfold is a single room (or has perhaps a couple of connecting rooms otherwise cut off from the rest of the map) then Inform used to draw the Sheepfold as a separate map to the side of the main one. It now insets this map, where possible, to keep it close to the Grassy Meadow. (For preference, an inside connection is offset right and down; an outside connection, left and up. This corresponds with the convention used by the zigzag arrows.) (k) When there are independent blocks of map, not connecting at all, these are now mapped in size order from left to right. The most common case where there are a large number of these blocks is when a pool of, say, 20 rooms exists for dynamic placement into a changing map at run-time; when Inform sees a large number of such singleton rooms, it tries to group them by region, placing rooms near to each other if they are created near to each other in the source text, and then (if it can t do any better) arranges them in a nearly-square rectangle, for the sake of tidiness. Here s a really extreme case: (l) A slightly easier-on-the-eye set of colours has been chosen for the region colouring, but with the aim of keeping as much contrast as possible when there are only three or four different regions (as quite often happens). (m) The World Index map now respects the colours indicated by index mapping hints like this one: Index map with room-colour of Zoo set to Navy and room-name-colour of Zoo set to White. (The only settings recognised by the World Index map are room-colour and roomname-colour, and only for named individual rooms and for regions.) (n) Size limits on the EPS map (30 levels, 100 rubrics) have been lifted.
 then Inform used to draw the Sheepfold as a separate map")
4 4 the new world index 2. How the map is calculated In calculating the map, Inform has to solve an unusual computing problem: it takes a set of rough compass bearings between nearby landmarks, but without knowing distances ( Alpha is west of Beta ), and tries to establish positions for them in space. In many cases no exact solution exists. Some IF works use a single room to represent a wide expanse of space, not a single point, making its location fuzzily defined. (An extreme case would be a single room called Forest, representing the entire surroundings of the map.) Other works of IF simply aren t simulating space at all, though in practice little portions of them usually still are. It s hard to itemise changes in this algorithm, but: (a) As before, Inform assesses possible map layouts using a numerical measure of geometric distortion called heat. The number of possible solutions is so huge that the problem (very likely NP-complete) cannot be solved in any acceptable period of time by systematically searching for the lowest-heat layout. Instead Inform exploits the fact that heat is mainly tied to local problems, not global ones. As a result, we can disconnect the map into pieces, work on those independently, and then reconcile the results (though that can make for awkward stitching at the boundaries). The key advantage of this is that heuristic tricks which would be far too slow applied to a map of, say, 1000 rooms may be around a million times faster on a submap of only 20. Where Inform previously only had one good technique for reducing heat, a heuristic called cooling, it now adds four more, quenching, diffusion, radiation and explosion. These are all variations on sliding clumps of rooms around, driving them apart, pulling them together, and so on. (b) Large maps with many awkward areas are now much better rendered. Our stress test in this process has been mechanically generated from the London Underground, assigning IF-style map connections between adjacent stations based on their actual

5 the new world index 5 spatial positions in and around London. (Not Harry Beck s simplified layout as shown on Tube maps: the actual positions.) What makes this stressful is not the size (about 300 rooms, i.e., stations) but that the real-life geometry is very knotty, with the density of stations very variable (the area around Bank being especially tight) and almost every track bending, sometimes right around, in the course of a single connection. The old Inform couldn t even find a way to plot the stations at distinct positions, and had to give up and plot several on top of each other. (Actually, this nearly happens in real life, too.) The new Inform manages to get something which looks just a little like London, and where the Circle Line can just about be seen. (c) But the improvement can even be seen in quite small maps. Here s one: Pi is east of Kappa. Omicron is northeast of Kappa. Upsilon is northwest of Pi. Theta is north of Kappa. Phi is north of Pi. This doesn t look hard, but it involves making one map connection three times longer than the others, and all to avoid collisions between rooms maximally distant from each other by movement. Inform used to have great trouble with configurations like this. (d) Some Inform authors like the World Index to look good so much that they rearrange rooms in the source text to see if that makes things better, and they make heavy use of clues like: Index map with Vosges mapped north of Geneva. The new method is much less sensitive to creation order of rooms, and indeed rearrangements are unlikely to make the map significantly different. Clues still work, but should be avoided whenever possible. (The map-maker has much more freedom if not tied down.) Authors of existing projects are urged to comment out all of their map clues and see what they get without them; testers have found that they can often all be removed. (e) Various tricks have sped things up sufficiently to allow us to use a more sophisticated measure of heat. Layouts in which a map connection passes through an unconnected room in order to get somewhere are now just a shade hotter than those where this doesn t happen. For example: Alpha is west of Beta. Gamma is south of Alpha. Delta is east of Gamma. Beta is north of Delta. Epsilon is northwest of Delta. How should Inform draw this? Clearly it s a quadrangle and would be easy without Epsilon. Previous builds would just have made a mess of this, plotting Epsilon on top of Alpha, or shoving Alpha out of the quadrangle to make room for it. Inform now draws it as a big quadrangle, with Epsilon occupying the space in the middle. But it only does this because we penalise connections through other rooms otherwise the best solution draws Epsilon northwest of Alpha.

6 6 the new world index (f) Similarly, it now generates heat if map connections would need to be drawn as broken (see 1(h) above), so this occurs rather less often at least in cases where it can be avoided, of course. (g) Directions in IF are often given doubly: Carfax is north of Folly Bridge. Carfax is above Folly Bridge. The writer s idea here is that there s a single route but that it runs on an upward slope north from the bridge. We have to indicate both on the map, of course, but we also have to make a choice: will C and FB go on the same level map, or on different level maps? This is not easy to solve when there are many such double connections close together, but Inform now tries to keep to a single level where possible. More maps will now be presented as single levels than before. (h) Bent connections like so are also problematic: Blockhouse A is east of Blockhouse B. Blockhouse B is south of Blockhouse A. Here the writer has in mind a path which bends around; perhaps A and B stand on opposite corners of a parade ground. When there appears no danger in doing so, Inform now averages out such pairs of routes for calculational purposes, so that the spatial relationship here is SW-to-NE (though it continues to draw the actual connections as given in the source text). Here are four such pairs of rooms: 3. Details of rooms and objects In the catalogue below the map, every room and thing now has a + icon indicating that a box of details can be revealed. If we open the details for the hole, by clicking the lowest of these icons, we reveal: (a) The heading line for the box gives the kinds involved. The hole is a door, but it s also a thing (since a door is itself a kind of thing). Notice the orange source link, which

7 the new world index 7 jumps to the line in the source text which specifies that the hole is a door. (Although most things have their kinds described in the same sentences which create them, that s not necessarily so.) (b) Next the either/or and value properties are listed, along with source links to where these are set. (c) In the case of rooms, we next have a list of the map connections to other rooms (marking those which are through doors, or blocked by doors, or one-way), and with source links once again. Paste icons are provided to speed up the typing of new map connections: for instance, clicking the northeast paste button in the example above pastes in the text Northeast from Gallery of Still Life is. so that you need only type the destination. (d) Again for rooms only: if the room belongs to a region, this is shown (colour-coded following the conventions used in the map) and there s a source link to where this is decided. (e) Finally, a concise row of source links marks all of the rules in the source text which explicitly mention this room or thing. There will be plenty of other rules capable of affecting it which don t mention it explicitly for example, plenty of things are potentially affected by the can t exceed carrying capacity rule, but it s just a general rule of play. What we have here are simply convenient links to where the source defines any special behaviour of that particular room or thing The new World Index certainly isn t perfect, and no map-making algorithm can ever get everything right, but we hope that people will find the new look an improvement. 30 November 2010
 In the case of rooms, we next have a list of the map connections to other rooms (marking those which are through doors, or blocked by doors, or one-way), and with source links once again.")
8
If you know exactly how you want your business forms to look and don t mind detail
 Advanced Form Customization APPENDIX E If you know exactly how you want your business forms to look and don t mind detail work, you can customize QuickBooks forms however you want. With QuickBooks Layout
Excel Unit 4. Data files needed to complete these exercises will be found on the S: drive>410>student>computer Technology>Excel>Unit 4
 Excel Unit 4 Data files needed to complete these exercises will be found on the S: drive>410>student>computer Technology>Excel>Unit 4 Step by Step 4.1 Creating and Positioning Charts GET READY. Before
Excel 2003 Tutorial I
 This tutorial was adapted from a tutorial by see its complete version at http://www.fgcu.edu/support/office2000/excel/index.html Excel 2003 Tutorial I Spreadsheet Basics Screen Layout Title bar Menu bar
If you know exactly how you want your business forms to look and don t mind
 appendix e Advanced Form Customization If you know exactly how you want your business forms to look and don t mind detail work, you can configure QuickBooks forms however you want. With QuickBooks Layout
Intro to Excel spreadsheets
 Intro to Excel spreadsheets What are the objectives of this document? The objectives of document are: 1. Familiarize you with what a spreadsheet is, how it works, and what its capabilities are; 2. Using
Blender Notes. Introduction to Digital Modelling and Animation in Design Blender Tutorial - week 9 The Game Engine
 Blender Notes Introduction to Digital Modelling and Animation in Design Blender Tutorial - week 9 The Game Engine The Blender Game Engine This week we will have an introduction to the Game Engine build
Guide To Creating Academic Posters Using Microsoft PowerPoint 2010
 Guide To Creating Academic Posters Using Microsoft PowerPoint 2010 INFORMATION SERVICES Version 3.0 July 2011 Table of Contents Section 1 - Introduction... 1 Section 2 - Initial Preparation... 2 2.1 Overall
House Design Tutorial
 Chapter 2: House Design Tutorial This House Design Tutorial shows you how to get started on a design project. The tutorials that follow continue with the same plan. When we are finished, we will have created
How To Create A View Frame In 3D
 12/4/2008-10:00 am - 11:30 am Room:Palazzo O-P (5th) The Secrets of Cutting Plan and Profile Sheets in AutoCAD Civil 3D Michelle Rasmussen - Application Engineer, IMAGINiT Technologies CV304-1P In this
Briefing document: How to create a Gantt chart using a spreadsheet
 Briefing document: How to create a Gantt chart using a spreadsheet A Gantt chart is a popular way of using a bar-type chart to show the schedule for a project. It is named after Henry Gantt who created
GUIDELINES FOR PREPARING POSTERS USING POWERPOINT PRESENTATION SOFTWARE
 Society for the Teaching of Psychology (APA Division 2) OFFICE OF TEACHING RESOURCES IN PSYCHOLOGY (OTRP) Department of Psychology, Georgia Southern University, P. O. Box 8041, Statesboro, GA 30460-8041
PE Content and Methods Create a Website Portfolio using MS Word
 PE Content and Methods Create a Website Portfolio using MS Word Contents Here s what you will be creating:... 2 Before you start, do this first:... 2 Creating a Home Page... 3 Adding a Background Color
Create a Poster Using Publisher
 Contents 1. Introduction 1. Starting Publisher 2. Create a Poster Template 5. Aligning your images and text 7. Apply a background 12. Add text to your poster 14. Add pictures to your poster 17. Add graphs
Understand the Sketcher workbench of CATIA V5.
 Chapter 1 Drawing Sketches in Learning Objectives the Sketcher Workbench-I After completing this chapter you will be able to: Understand the Sketcher workbench of CATIA V5. Start a new file in the Part
INA-W910R Owner s Manual
 INA-W910R Owner s Manual Navigation Software for INA-W910R UK English February 2011, Version 1.0 Thank you for choosing the Alpine INA-W910R as your navigator. Start using your device right away. This
Excel Intermediate Session 2: Charts and Tables
 Excel Intermediate Session 2: Charts and Tables Agenda 1. Introduction (10 minutes) 2. Tables and Ranges (5 minutes) 3. The Report Part 1: Creating and Manipulating Tables (45 min) 4. Charts and other
Autodesk Fusion 360: Assemblies. Overview
 Overview In this module you will learn how different components can be put together to create an assembly. We will use several tools in Fusion 360 to make sure that these assemblies are constrained appropriately
Creating A Grade Sheet With Microsoft Excel
 Creating A Grade Sheet With Microsoft Excel Microsoft Excel serves as an excellent tool for tracking grades in your course. But its power is not limited to its ability to organize information in rows and
SolarTrak Users Guide GPS Satellites
 SolarTrak Users Guide GPS Satellites Your PC or Smartphone How SolarTrak Works 1. GPS signal received from the Satellite Cell Tower SolarTrak Tracker installed on Equipment 2. Communication is established
Triggers & Actions 10
 Triggers & Actions 10 CHAPTER Introduction Triggers and actions are the building blocks that you can use to create interactivity and custom features. Once you understand how these building blocks work,
Utilizing Microsoft Access Forms and Reports
 Utilizing Microsoft Access Forms and Reports The 2014 SAIR Conference Workshop #3 October 4 th, 2014 Presented by: Nathan Pitts (Sr. Research Analyst The University of North Alabama) Molly Vaughn (Associate
CREATE A 3D MOVIE IN DIRECTOR
 CREATE A 3D MOVIE IN DIRECTOR 2 Building Your First 3D Movie in Director Welcome to the 3D tutorial for Adobe Director. Director includes the option to create three-dimensional (3D) images, text, and animations.
Excel 2007 Basic knowledge
 Ribbon menu The Ribbon menu system with tabs for various Excel commands. This Ribbon system replaces the traditional menus used with Excel 2003. Above the Ribbon in the upper-left corner is the Microsoft
Exploratory Spatial Data Analysis
 Exploratory Spatial Data Analysis Part II Dynamically Linked Views 1 Contents Introduction: why to use non-cartographic data displays Display linking by object highlighting Dynamic Query Object classification
Excel -- Creating Charts
 Excel -- Creating Charts The saying goes, A picture is worth a thousand words, and so true. Professional looking charts give visual enhancement to your statistics, fiscal reports or presentation. Excel
Creating Drawings in Pro/ENGINEER
 6 Creating Drawings in Pro/ENGINEER This chapter shows you how to bring the cell phone models and the assembly you ve created into the Pro/ENGINEER Drawing mode to create a drawing. A mechanical drawing
Learning Services IT Guide. Access 2013
 Learning Services IT Guide Access 2013 Microsoft Access is a programme which allows you to store a lot of information easily in the form of a database. For example you could create a database which stored
MATHEMATICS Y6 Geometry 6750 Use co-ordinates and extend to 4 quadrants Equipment MathSphere www.mathsphere.co.uk
 MATHEMATICS Y6 Geometry 675 Use co-ordinates and etend to quadrants Paper, pencil, ruler Equipment MathSphere 675 Use co-ordinates and etend to quadrants. Page Concepts Children should be familiar with
Publisher 2010 Cheat Sheet
 April 20, 2012 Publisher 2010 Cheat Sheet Toolbar customize click on arrow and then check the ones you want a shortcut for File Tab (has new, open save, print, and shows recent documents, and has choices
Reflection and Refraction
 Equipment Reflection and Refraction Acrylic block set, plane-concave-convex universal mirror, cork board, cork board stand, pins, flashlight, protractor, ruler, mirror worksheet, rectangular block worksheet,
Instructions for Creating a Poster for Arts and Humanities Research Day Using PowerPoint
 Instructions for Creating a Poster for Arts and Humanities Research Day Using PowerPoint While it is, of course, possible to create a Research Day poster using a graphics editing programme such as Adobe
Microsoft PowerPoint 2010 Handout
 Microsoft PowerPoint 2010 Handout PowerPoint is a presentation software program that is part of the Microsoft Office package. This program helps you to enhance your oral presentation and keep the audience
Getting Started in Tinkercad
 Getting Started in Tinkercad By Bonnie Roskes, 3DVinci Tinkercad is a fun, easy to use, web-based 3D design application. You don t need any design experience - Tinkercad can be used by anyone. In fact,
Microsoft Office Excel 2007 Key Features. Office of Enterprise Development and Support Applications Support Group
 Microsoft Office Excel 2007 Key Features Office of Enterprise Development and Support Applications Support Group 2011 TABLE OF CONTENTS Office of Enterprise Development & Support Acknowledgment. 3 Introduction.
Roof Tutorial. Chapter 3:
 Chapter 3: Roof Tutorial The majority of Roof Tutorial describes some common roof styles that can be created using settings in the Wall Specification dialog and can be completed independent of the other
Stellarium a valuable resource for teaching astronomy in the classroom and beyond
 Stellarium 1 Stellarium a valuable resource for teaching astronomy in the classroom and beyond Stephen Hughes Department of Physical and Chemical Sciences, Queensland University of Technology, Gardens
How to Design Your Perfect Kitchen in Just 15 Minutes Using Microsoft Word
 How to Design Your Perfect Kitchen in Just 15 Minutes Using Microsoft Word A Simple Guide to Planning the Most Important Room in Your House! www.cutpricekitchens.co.uk 1 CONTENTS Part 1: Professional Kitchen
Visualization Quick Guide
 Visualization Quick Guide A best practice guide to help you find the right visualization for your data WHAT IS DOMO? Domo is a new form of business intelligence (BI) unlike anything before an executive
Layout Tutorial. Getting Started
 Getting Started Layout Tutorial This tutorial will explain how create a layout template, send views to a layout page, then save the document in PDF format. In this tutorial you will learn about: Creating
4 Manipulating Elements
 4 Manipulating Elements In the context of this course, Manipulation of elements means moving, copying, rotating, scaling and some other similar operations. We will find that manipulations are always a
Ohio University Computer Services Center August, 2002 Crystal Reports Introduction Quick Reference Guide
 Open Crystal Reports From the Windows Start menu choose Programs and then Crystal Reports. Creating a Blank Report Ohio University Computer Services Center August, 2002 Crystal Reports Introduction Quick
Unit 6 Direction and angle
 Unit 6 Direction and angle Three daily lessons Year 4 Spring term Unit Objectives Year 4 Recognise positions and directions: e.g. describe and find the Page 108 position of a point on a grid of squares
Introduction to MS WINDOWS XP
 Introduction to MS WINDOWS XP Mouse Desktop Windows Applications File handling Introduction to MS Windows XP 2 Table of Contents What is Windows XP?... 3 Windows within Windows... 3 The Desktop... 3 The
Using Microsoft Word. Working With Objects
 Using Microsoft Word Many Word documents will require elements that were created in programs other than Word, such as the picture to the right. Nontext elements in a document are referred to as Objects
Intellect Platform - Tables and Templates Basic Document Management System - A101
 Intellect Platform - Tables and Templates Basic Document Management System - A101 Interneer, Inc. 4/12/2010 Created by Erika Keresztyen 2 Tables and Templates - A101 - Basic Document Management System
So you want to create an Email a Friend action
 So you want to create an Email a Friend action This help file will take you through all the steps on how to create a simple and effective email a friend action. It doesn t cover the advanced features;
Plots, Curve-Fitting, and Data Modeling in Microsoft Excel
 Plots, Curve-Fitting, and Data Modeling in Microsoft Excel This handout offers some tips on making nice plots of data collected in your lab experiments, as well as instruction on how to use the built-in
Information Literacy Program
 Information Literacy Program Excel (2013) Advanced Charts 2015 ANU Library anulib.anu.edu.au/training ilp@anu.edu.au Table of Contents Excel (2013) Advanced Charts Overview of charts... 1 Create a chart...
@ MAXSTOR=1000000. 1 Note that it s tempting to use the auxiliary variables representing loga, logb or logc since, as we noted last time,
 Bifurcation Analysis with AUTO Marc R. Roussel May 20, 2004 In this lecture, we will learn how to do a bifurcation analysis with the computer program AUTO. AUTO is built into xppaut, which is where the
Introduction. Purpose of this Module. Objectives of this Module
 Introduction Welcome to the module series. This module is your first step toward learning how to complete various details of your project in 3D using the Bentley InRoads software. Purpose of this Module
An introduction to 3D draughting & solid modelling using AutoCAD
 An introduction to 3D draughting & solid modelling using AutoCAD Faculty of Technology University of Plymouth Drake Circus Plymouth PL4 8AA These notes are to be used in conjunction with the AutoCAD software
SECTION 2-1: OVERVIEW SECTION 2-2: FREQUENCY DISTRIBUTIONS
 SECTION 2-1: OVERVIEW Chapter 2 Describing, Exploring and Comparing Data 19 In this chapter, we will use the capabilities of Excel to help us look more carefully at sets of data. We can do this by re-organizing
User Manual igo primo
 User Manual igo primo Navigation software for the igo primo UK English July 2012, ver. 2.0 Thank you for choosing the igo primo as your navigator. Start using igo primo right away. This document is the
Excel Project Creating a Stock Portfolio Simulation
 Background Vocabulary Excel Project Creating a Stock Portfolio Simulation 1. What is a stock? A stock is a share in the ownership of a corporation, a large business organization. A stock, also, represents
Chapter 19 Operational Amplifiers
 Chapter 19 Operational Amplifiers The operational amplifier, or op-amp, is a basic building block of modern electronics. Op-amps date back to the early days of vacuum tubes, but they only became common
Linkage 3.2. User s Guide
 Linkage 3.2 User s Guide David Rector Wednesday, April 06, 2016 Table of Contents Table of Contents... 2 Installation... 3 Running the Linkage Program... 3 Simple Mechanism Tutorial... 5 Mouse Operations...
Sweet Home 3D user's guide
 1 de 14 08/01/2013 13:08 Features Download Online Gallery Blog Documentation FAQ User's guide Video tutorial Developer's guides History Reviews Support 3D models Textures Translations Forum Report a bug
3D Drawing. Single Point Perspective with Diminishing Spaces
 3D Drawing Single Point Perspective with Diminishing Spaces The following document helps describe the basic process for generating a 3D representation of a simple 2D plan. For this exercise we will be
Interactive Voting System. www.ivsystem.nl. IVS-Basic IVS-Professional 4.4
 Interactive Voting System www.ivsystem.nl IVS-Basic IVS-Professional 4.4 Manual IVS-Basic 4.4 IVS-Professional 4.4 1213 Interactive Voting System The Interactive Voting System (IVS ) is an interactive
Preparing a Slide Show for Presentation
 In this chapter Find out why it s important to put finishing touches on a slide show Learn how to use the slide sorter Explore the use of slide transitions Learn how to change slide color schemes and backgrounds
TABLE OF CONTENTS. INTRODUCTION... 5 Advance Concrete... 5 Where to find information?... 6 INSTALLATION... 7 STARTING ADVANCE CONCRETE...
 Starting Guide TABLE OF CONTENTS INTRODUCTION... 5 Advance Concrete... 5 Where to find information?... 6 INSTALLATION... 7 STARTING ADVANCE CONCRETE... 7 ADVANCE CONCRETE USER INTERFACE... 7 Other important
DataPA OpenAnalytics End User Training
 DataPA OpenAnalytics End User Training DataPA End User Training Lesson 1 Course Overview DataPA Chapter 1 Course Overview Introduction This course covers the skills required to use DataPA OpenAnalytics
Tutorial 2: Using Excel in Data Analysis
 Tutorial 2: Using Excel in Data Analysis This tutorial guide addresses several issues particularly relevant in the context of the level 1 Physics lab sessions at Durham: organising your work sheet neatly,
Gas Dynamics Prof. T. M. Muruganandam Department of Aerospace Engineering Indian Institute of Technology, Madras. Module No - 12 Lecture No - 25
 (Refer Slide Time: 00:22) Gas Dynamics Prof. T. M. Muruganandam Department of Aerospace Engineering Indian Institute of Technology, Madras Module No - 12 Lecture No - 25 Prandtl-Meyer Function, Numerical
Drawing a histogram using Excel
 Drawing a histogram using Excel STEP 1: Examine the data to decide how many class intervals you need and what the class boundaries should be. (In an assignment you may be told what class boundaries to
LabVIEW Day 1 Basics. Vern Lindberg. 1 The Look of LabVIEW
 LabVIEW Day 1 Basics Vern Lindberg LabVIEW first shipped in 1986, with very basic objects in place. As it has grown (currently to Version 10.0) higher level objects such as Express VIs have entered, additional
Microsoft Word 2010 Tutorial
 1 Microsoft Word 2010 Tutorial Microsoft Word 2010 is a word-processing program, designed to help you create professional-quality documents. With the finest documentformatting tools, Word helps you organize
IN THE HANDS OF TIME
 MATHS B-DAY 2006 Friday 24 November IN THE HANDS OF TIME The Maths B-Day is sponsored by and Maths B-day 2006-1- Wiskunde B-dag 2006 0 Introduction The maths B-day assignment this year is totally focused
Windows 7 for beginners
 Windows 7 for beginners Hardware Hardware: the physical parts of a computer. What s in the computer? CPU: the central processing unit processes information (the brain) Hard drive: where all of your software
CATIA Basic Concepts TABLE OF CONTENTS
 TABLE OF CONTENTS Introduction...1 Manual Format...2 Log on/off procedures for Windows...3 To log on...3 To logoff...7 Assembly Design Screen...8 Part Design Screen...9 Pull-down Menus...10 Start...10
Design document Goal Technology Description
 Design document Goal OpenOrienteering Mapper is a program to draw orienteering maps. It helps both in the surveying and the following final drawing task. Support for course setting is not a priority because
Introduction to the Professional Development Center
 Introduction to the Professional Development Center Overview Materials Navigation Troubleshooting Professional Development Center Materials Skyward Software Tips and Tricks General Simulation Tips Feedback
Using Excel for descriptive statistics
 FACT SHEET Using Excel for descriptive statistics Introduction Biologists no longer routinely plot graphs by hand or rely on calculators to carry out difficult and tedious statistical calculations. These
Basic AutoSketch Manual
 Basic AutoSketch Manual Instruction for students Skf-Manual.doc of 3 Contents BASIC AUTOSKETCH MANUAL... INSTRUCTION FOR STUDENTS... BASIC AUTOSKETCH INSTRUCTION... 3 SCREEN LAYOUT... 3 MENU BAR... 3 FILE
Session 25 Revit MEP Tips and Tricks
 Session 25 Revit MEP Tips and Tricks Page 1 of 17 Sometimes it's the little things which make all the difference. I thought I would share some nifty tricks that can help make Revit MEP go down a little
Hello. What s inside? Ready to build a website?
 Beginner s guide Hello Ready to build a website? Our easy-to-use software allows to create and customise the style and layout of your site without you having to understand any coding or HTML. In this guide
10. THERM DRAWING TIPS
 10. THERM DRAWING TIPS 10.1. Drawing Tips The THERM User's Manual describes in detail how to draw cross-sections in THERM. This section of the NFRC Simualation Training Manual presents some additional
SpaceClaim Introduction Training Session. A SpaceClaim Support Document
 SpaceClaim Introduction Training Session A SpaceClaim Support Document In this class we will walk through the basic tools used to create and modify models in SpaceClaim. Introduction We will focus on:
Multimedia Navigation Philadelphia 835
 www.blaupunkt.com Multimedia Navigation Philadelphia 835 Operating instructions Navigation Thank you for choosing our product as your navigator. Start using Blaupunkt Navigation right away. This document
Ten Easy Steps to Intersections in AutoCAD Civil 3D
 in AutoCAD Civil 3D Robert Gadbaw Team Blue22 Ltd. CV110-2L This class takes students step by step through creating an intersection using Civil 3D 2009. Students will learn about alignments, profiles,
Solving Simultaneous Equations and Matrices
 Solving Simultaneous Equations and Matrices The following represents a systematic investigation for the steps used to solve two simultaneous linear equations in two unknowns. The motivation for considering
Gestation Period as a function of Lifespan
 This document will show a number of tricks that can be done in Minitab to make attractive graphs. We work first with the file X:\SOR\24\M\ANIMALS.MTP. This first picture was obtained through Graph Plot.
Tutorial 1: The Freehand Tools
 UNC Charlotte Tutorial 1: The Freehand Tools In this tutorial you ll learn how to draw and construct geometric figures using Sketchpad s freehand construction tools. You ll also learn how to undo your
Using Excel for your assignments
 [Type here] Using Excel for your assignments This document covers the basics of using Excel to perform simple data analysis and represent that data visually. Excel is a very powerful data analysis tool.
11 Printing Designs. When you have completed this chapter, you will be able to:
 11 Printing Designs Creating printed documents is the end we have worked towards from the beginning of this course. We have already been introduced to it very briefly with Printing - A First Look on page
Plotting: Customizing the Graph
 Plotting: Customizing the Graph Data Plots: General Tips Making a Data Plot Active Within a graph layer, only one data plot can be active. A data plot must be set active before you can use the Data Selector
Creating PDF Forms in Adobe Acrobat
 Creating PDF Forms in Adobe Acrobat Flinders University Centre for Educational ICT Contents What are PDF forms?... 1 Viewing a PDF form... 1 Types of PDF forms... 1 Printing and saving PDF forms... 1 Forms
Laser cutter setup instructions:
 Laser cutter setup instructions: 1. Cut your material to 18 x 24 or smaller. 2. Turn on the laser cutter by flipping the wall switch on the right behind Station B. You will hear the cooling fan and air
2013 Getting Started Guide
 2013 Getting Started Guide The contents of this guide and accompanying exercises were originally created by Nemetschek Vectorworks, Inc. Vectorworks Fundamentals Getting Started Guide Created using: Vectorworks
How To Draw In Autocad
 DXF Import and Export for EASE 4.0 Page 1 of 9 DXF Import and Export for EASE 4.0 Bruce C. Olson, Dr. Waldemar Richert ADA Copyright 2002 Acoustic Design Ahnert EASE 4.0 allows both the import and export
GeoGebra. 10 lessons. Gerrit Stols
 GeoGebra in 10 lessons Gerrit Stols Acknowledgements GeoGebra is dynamic mathematics open source (free) software for learning and teaching mathematics in schools. It was developed by Markus Hohenwarter
Quickstart for Desktop Version
 Quickstart for Desktop Version What is GeoGebra? Dynamic Mathematics Software in one easy-to-use package For learning and teaching at all levels of education Joins interactive 2D and 3D geometry, algebra,
Microsoft PowerPoint 2010 Templates and Slide Masters (Level 3)
") IT Services Microsoft PowerPoint 2010 Templates and Slide Masters (Level 3) Contents Introduction... 1 Installed Templates and Themes... 2 University of Reading Templates... 3 Further Templates and Presentations...
IT Services Microsoft PowerPoint 2010 Templates and Slide Masters (Level 3) Contents Introduction... 1 Installed Templates and Themes... 2 University of Reading Templates... 3 Further Templates and Presentations...
Statics problem solving strategies, hints and tricks
 Statics problem solving strategies, hints and tricks Contents 1 Solving a problem in 7 steps 3 1.1 To read.............................................. 3 1.2 To draw..............................................
Introduction to the TI-Nspire CX
 Introduction to the TI-Nspire CX Activity Overview: In this activity, you will become familiar with the layout of the TI-Nspire CX. Step 1: Locate the Touchpad. The Touchpad is used to navigate the cursor
Excel 2003 A Beginners Guide
 Excel 2003 A Beginners Guide Beginner Introduction The aim of this document is to introduce some basic techniques for using Excel to enter data, perform calculations and produce simple charts based on
Basic Excel Handbook
 2 5 2 7 1 1 0 4 3 9 8 1 Basic Excel Handbook Version 3.6 May 6, 2008 Contents Contents... 1 Part I: Background Information...3 About This Handbook... 4 Excel Terminology... 5 Excel Terminology (cont.)...
How To Write A Cq5 Authoring Manual On An Ubuntu Cq 5.2.2 (Windows) (Windows 5) (Mac) (Apple) (Amd) (Powerbook) (Html) (Web) (Font
 (Windows 5) (Mac) (Apple) (Amd) (Powerbook) (Html) (Web) (Font") Adobe CQ5 Authoring Basics Print Manual SFU s Content Management System SFU IT Services CMS Team ABSTRACT A summary of CQ5 Authoring Basics including: Setup and Login, CQ Interface Tour, Versioning, Uploading
Adobe CQ5 Authoring Basics Print Manual SFU s Content Management System SFU IT Services CMS Team ABSTRACT A summary of CQ5 Authoring Basics including: Setup and Login, CQ Interface Tour, Versioning, Uploading
Introduction To Microsoft Office PowerPoint 2007. Bob Booth July 2008 AP-PPT5
 Introduction To Microsoft Office PowerPoint 2007. Bob Booth July 2008 AP-PPT5 University of Sheffield Contents 1. INTRODUCTION... 3 2. GETTING STARTED... 4 2.1 STARTING POWERPOINT... 4 3. THE USER INTERFACE...
Enhancing Your Smart Board Lessons
 Idea #1: Dragging -great for sorting or matching Hint: Right click on object (or click arrow) to pull down menu and choose Locking Allow Move. Another Hint: Make sure you put each item in its own text