The design for ion exchange column
|
|
|
- Barnaby Harvey
- 10 years ago
- Views:
Transcription
1 The design for ion exchange column Jiali Wang + Kenchouw Wu March 2015

2 ii

3 The design for ion exchange column (Internship report) Submitted to: Mr. Harmen van der Laan (Oasen Drinking water company) Ms. C. Mok Kai Rine (The Hague University) Submitted by: Jiali Wang + Kenchouw Wu BSc. Students Process and Food Technology The Hague University Date of submission: March 2015 iii

4 iv

5 Summary The aim of the work described in this report was to design an ion exchange column for the removal of ammonium ions from RO permeate. The ion exchangers used in this research project were i) clinoptilolite, a naturally occurring zeolite and ii) a resin in H + form with functional group sulfonic acid (Lewatit S2568H). A four columns set-up has been designed based previous research done by Mikkers (2009) in which above described ion exchangers have been used. The main scope of this report was to look at the influence of surface loading and bed height on the ammonium removal capacity. Several experiments were conducted with varying bed heights (5 20cm), flow rates per column (12 100L/h) and the two ion exchange media. The results of experiments were compared with those of the previous research studies done by KWR (2005) and Ekowati (2014) and were found to be comparable. The zeolite was found to have a 7 times lower breakthrough capacity compared to the Lewatit resin. The average breakthrough capacity was found to be 2.17 mg NH 4 per gram for the resin. Due to the influence of the film diffusion, the breakthrough capacity was similar for different surface loading rates. The results were used to design an ion exchange column for the new to build water treatment at ZS De Hooge Boom. Using the average breakthrough capacity from the experiments a design was made for four ion exchange vessels with each a capacity of 120m 3 /h, a bed height of 2m, and surface loading of 99m/h, and Empty Bed Contact Time (EBCT) of 1.2minutes and a breakthrough time of 10 days. The costs were estimated to be per m 3. Recommendations for future research are to conduct experiments with higher bed heights (60 100cm) and to use a ammonium dosing in the feed water to vary with different ammonium concentrations. Keywords: Ion exchange column, zeolite, resin, surface loading, bed height v

6 vi

7 Contents 1. Introduction and research question Oasen Drinking Water Company Drinking water treatment "De Hooge Boom" The research project Previous research Problem introduction Boundary conditions Outline of the report Theoretical background Ion Exchange Selectivity of ion exchange Kinetics of Ion Exchange Kinetics Parameters in Ion Exchange Ion Exchange capacity Breakthrough Methods and materials Set-up Materials Measurement methods The validation of spectrophotometer Hach-Lang DR The validation of ammonium analyzer Applikon Colorimeter The validation of ammonium dosing pump Results The performance of 10 and 20 cm Lewatit S2568H Comparison between Lewatit S2568H and clinoptilolite Comparison between clinoptilolite with different particle size Discussion Influence of bed height Influence of flow rate Kinetics Performance of zeolite and resin vii

8 5.5 Influence of particle size Difficulties of doing pilot experiments Ion exchange column design calculation Introduction Design calculation Conclusion and recommendations for future research Conclusion Main uncertainties in the research and design Recommendations for future research Reference Appendix A: Drinking water quality standards Appendix B: Schematic drawing Set-up by Yvonne Mikkers Appendix C: Material data sheet Appendix D: The results of validation of equipment s Appendix E: Measuring reports Appendix F: The design of future treatment plant Appendix H: The pressure drop data of Lewatit S2568H viii

9 1. Introduction and research question 1.1 Oasen Drinking Water Company Oasen, is an public drinking water supply company with 130 years history. It offers drinking water to people and companies in the south east Holland. (Figure 1.1.1) The purpose of Oasen is to make sure that the water is of impeccable quality and the same level quality of drinking water should be always kept. Figure Oasen s supply area Every year, Oasen provides its customers with 48 billion liters of drinking water produced from groundwater. 1.2 Drinking water treatment "De Hooge Boom" Drinking water treatment plant "De Hooge Boom" is located in Kamerik, South Holland, with total capacity of m 3 per year. In 2013, Oasen started its multi-annual plan Better than Possible, which will be put into practice at De Hooge Boom in the future. The current treatment processes showed in (Figure and Figure 1.2.2) have been producing water with good quality that meets the standards. Figure Drinking water treatment plant De Hooge Boom 1

10 Figure Treatment scheme in De Hooge Boom treatment plant (Source: Yuli Ekowati, 2014) Figure shows the plan of new treatment processes that will be operated in the near future in De Hooge Boom. Figure New treatment scheme for De Hooge Boom treatment plant (Source: Yuli Ekowati, 2014) 1.3 The research project The raw water at the ZS De Hooge Boom is distracted from a deeper level where the water originates from the river. This is called river bank filtrate. It does not reach the quality standard of drinking water in the Netherlands (See Appendix A); even though the groundwater is naturally purified after it moves so slowly in the subsurface. In the new to build treatment plant de Hooge Boom, the raw water passes through RO (reverse osmosis) membrane filters first. Then another treatment step is required, because the ammonium removal by the membrane technique is not good enough at present. It results in the higher concentration of ammonium in the RO permeate (up to 0.6mg/L), whereas the limit is 0.03mg/L. In order to reach the purpose, ion exchange technology is selected to be applied in this research project. This research project focuses on this part of new to build the treatment: the ion exchange step to remove ammonium. 1.4 Previous research This research is performed based on previous studies about ion exchangers efficiency and regeneration. In summary, the research of KWR, Yuli Ekowati and Yvonne Mikkers provide essential ideas and information for this research project. KWR, 2005 Research topic: Ammonium removal in drinking water using natural zeolite In the research experiments, in order to make the experiment condition more persuasive and accurate, ammonium chloride solution was added in to the dematerialized water. The KWR research has founded out the two main effects on ammonium removal capacity: o o The grain size of the clinoptilolite (done by feed water with 2 mg NH + 4 /L) The initial ammonium concentration in aqueous solution (done by feed water with mg NH + 4 /L) It was found that ammonium removal was faster with the smaller grains and a high removal capacity is obtained quickly. An increase in ammonium concentration in the solution will result in an increasing ammonium removal capacity by clinoptilolite. Yvonne Mikkers, 2009 Ammonium removal with zeolite on anaerobic groundwater In this research, the effectiveness of chemical regeneration of two kind zeolites which were used to remove ammonium from groundwater has been studied at Oasen. To perform the experiments, Yvonne designed the set-up (see Appendix B) for pilot scale study from which the idea for the present research s column set-up came. In her research experiments, the raw water with average NH 4 + concentration of 6.5 mg/l was used as feed water. 2
; even though the groundwater is naturally purified after it moves so slowly in the subsurface.")
11 Yuli Ekowati, 2014 In this research, the efficiency of ion exchange resin/zeolite in removing low concentration of ammonium was investigated at Oasen in Kamerik, as a part of the research program. Based on Yuli s literature research, several adsorption isotherms for calculation of run length for zeolite were found. According to the experimental data, the KWR report (2005) provides the most accurate/realistic adsorption isotherm. This adsorption isotherm will be used in the present research for calculating breakthrough run length of zeolite. Furthermore, she made the present setup, but was not able to reach the breakthrough of resin. 1.5 Problem introduction Ammonium in ground water In the Netherlands, the groundwater is required to be treated before it becomes drinking water. High ammonium concentration in the groundwater needs to be lower at a certain level. Reason is that the nitrogen can maybe serve as nutrient for some bacteria. Furthermore, NH 4 + can be formed to nitrite which is a cause of health problems if the amount of nitrite occurred in the drinking water exceed the maximum contaminant level allowed. To solve the problem, the ion exchange is regarded as an effective post treatment to remove ammonium Research question The Oasen Drinking Water Company, is planning to build a new treatment plant in De Hooge Boom, Kamerik in And the new treatment plant will employ ion exchange technique after ground water experiences filtration of the RO (reverse osmosis) membrane. This effluent called permeate water attains a relative lower concentration of ammonium, which becomes the influent to pass ion exchange step. At the beginning, the concentration of ammonium is around 0.1 mg NH 4+ /L, and the target ammonium concentration in the outflow is required to achieve <0.03 mg NH 4+ /L. At present, resin and zeolite are two main ion exchange materials (see chapter 2) in water treatment. In order to determine the efficiency of zeolite and resin to be appropriately applied in lower ammonium removal, the research question is defined as follow: What should be the design of the ion exchange post treatment step for permeate when it comes to surface loading and bed height? Sub questions: What is the influence of the surface loading (which is flow rate of feed water on the effectiveness of ammonium removal by ion exchange)? What is the influence of the bed height of the ion exchange for the effectiveness of ammonium removal? 1.6 Boundary conditions For this research project, the limited conditions were described as following. Due to the limited time for only two months, it was not possible to do experiments related to every parameter that has influence on ammonium removal in ion exchange process. Based on the plan of action, three main parameters should be considered in experiments: (1) bed heights of ion exchange, (2) initial concentration of ammonium in feed water and (3) flow rate of feed water. In literature, the important parameters also include temperature of water, particle size of ion exchangers, ph level and etc. In the project, only different bed heights of ion exchangers and different flow rates of permeate water has been done. For different initial concentration of ammonium, it had been ever planned to utilize a dosing pump for getting a higher ammonium concentration in feed water. But it was not successful; because the dosing 3

12 ammonium solution didn t mix well with permeate water (see in chapter 3). Last but not least, the concentration of ammonium after the RO (reverse osmosis) membrane could not maintain a stable level in the duration of the project. That is due to the groundwater comes from different wells. In this case, the breakthrough capacities, SFR (service flow rate) and the design of full scale will be influenced (see chapter 4 and 5). 1.7 Outline of the report In chapter 2 the general theory of ion exchange will be presented. Chapter 3 will go about the description of pilot setup, materials, and measurement methods. The experiment results will be shown in chapter 4. In chapter 5 the results will be discussed and compared with previous research studies. And the difficulties of doing pilot scale will be discussed as well. In chapter 6 the ion exchange design will be given and finally, in chapter 7 the conclusion of this report will be presented. 4


13 2. Theoretical background 2.1 Ion Exchange Ion exchange is used in water treatment to remove the unwanted soluble ionized substances from water being treated. Ion exchange resins can be divided into two groups. One is the polymer on which the fixed groups are permanently ionized at. The fixed groups are positive or negative charged. To keep the resin electrical neutral, ions of opposite charge have to attached on it. The ions of opposite charge are unlike the fixed groups, exchange with mobile ions from water, are so called counter-ion. The ions that have the same charge as that of the fixed groups (exchange sites) are known as co-ions. Figure 2.1 shows an example of cation exchange resin bead. Na + = mobile ions (counter-ions) SO 3 - =fixed group Dark line = polymeric skeleton Figure 2.1. Schematic cation exchange resin bead (Rohm and Haas, 2008) An ion exchange that is capable of exchanging cations are known as cation exchange, and capable of exchanging anions are known as anion exchange. An overview of the compositions can be made as follows: Type Fixed groups Counterions Coions Cation exchange Anion exchange Another one is the inorganic ion exchange. The inorganic materials initially used were natural crystalline aluminosillicates which had cation exchange properties. (B.A.Bolto and L.Pawlowski,1987). Ammonium can be removed from water by strongly acidic cation resins or by zeolites. The most used zeolite type for the application in removing ammonium is clinoptlolite. They remove ammonium more selectively with little competition from other cations (George J. Crits, 2012). The matrix made of aluminum, silicates and oxygen is highly negatively charged, because of the shared oxygen atoms between aluminum and silicon. To keep electrical neutrality, the zeolites are commonly neutralized with sodium, potassium and calcium. It is of importance that the zeolite prefers ammonium ion over them. The adsorbent is exchanged for an unwanted ion (for example NH 4 + ions) in the water. For the sake of accomplishing the exchange reaction, a packed bed of ion-exchange resin beads or zeolite is used. Raw water is continually passed through the bed in a down flow or up flow mode until the adsorbent is exhausted, as evidenced by the appearance (breakthrough) of the unwanted contaminant at an unacceptable concentration in the effluent. Also, it is regarded that the most effective ion exchange reactions are reversible. Zeolite is inorganic and other important kind of ion exchangers in ion exchange application for water treatment. There is one sample of zeolite show in figure 2.2 about the ion exchange process. 5

14 Figure 2.2 Ion-Exchange on a zeolite (Source: Schmidt, 2008) In figure 2.2, the mobile ions are sodium that is loosely held by the zeolite. The fixed ions are aluminosilicates. To remove ammonium ions (NH 4 + ), the groundwater is passed through a column filled with sodium (Na + ) form zeolites. So ammonium ions going into the zeolite will be replaced by sodium ions getting out of it and dissolving in the water. In above process, the exchange reaction can be written as: (R - Na + ) + NH 4 + (R - NH 4 + ) + Na + The brackets represents the zeolite matrix phase, R - is aluminosillicates.from the reaction equation it can be seen that the salinity of the water remain the same, only the composition of the salinity is changed at the end of the process. Of course, the exchange is limited. The total ion-exchange capacity is determined by the concentration of fixed charges. It describes the maximum amount of unwanted substances which have been replaced and there is no place more for removing more. In other word, ion exchange is an intrinsic property of ion exchange material. There are two necessary requirements for ion exchange reaction: (1) the ion exchange material immerses in solution, and (2) the solution contains unwanted ions. 2.2 Selectivity of ion exchange The ion exchange can only work efficiently when there is a difference in affinity for counterions in the resin and those in the external solution. In the zeolites, ammonium ions can be removed selectively from water, because zeolites have more affinity for the ammonium than for the sodium ions. The selectivity of a variety of cations on clinoptilolite shows (Langwaldt, 2008): Cs + > Rb + > K + > NH4 + > Ba 2+ > Sr 2+ > Na + > Ca 2+ > Fe 3+ > Al 3+ > Mg + > Li + Fortunately, there are no Cs +, Rb +, K + presented in the permeate at De Hooge Boom.The selectivity for a certain ion is determined by the selectivity coefficient K s applied to the cation exchange in the reaction equation as follows: (R - A + ) + B + (R - B + ) + A + K s = [(R B + )] [A + ] [(R A + )] [B + ] The K s describes how counterions are present in the exchange beads and solution when the exchange in the A + form is placed in a solution having B + ions. The value of K s might be dependent on the porosity and the 6
 + NH 4 + (R - NH 4 + ) + Na + The brackets represents the zeolite matrix phase, R - is aluminosillicates.")
15 concentration of the solution. From the equation, it seems that the affinity of zeolite for ammonium increases as the concentration of it increases in the solution. Also, the selectivity coefficient K s relies on various factors (Kunin R, 1951): 1. Higher valence ions are more preferred: Tetravalent > Trivalent > Divalent > Monovalent Th 4+ >Fe 3+ >Ca 2+ >K + PO 4 3- >SO 4 2- >Cl - 2. Least hydrated ion is the most preferred: The higher the ionic radius, the lower is the radius of the hydrated ion. Cs + >Rb + >K + >Na + >Li + SCN - >ClO 4 - >I - >NO 3 - >Br - >CN - 3. Ions with greater ability to polarize are preferred: NO 3 - > Br - > NO 2 - > Cl - 4. Ions with least tendency to form complexes in solution: Cl - > HCO 3 - > CH 3 COO - > OH - >F Kinetics of Ion Exchange Kinetics The kinetic mechanism is important factor to consider when it comes to mass transfer. The main mechanism in ion exchange is summarized as follows (also see Figure ): Ions in solution travel through the bulk of the solution (diffusion in solution) Diffusion of the specific ions from bulk liquid to a boundary layer surrounding the bead. (film diffusion) Diffusion through the boundary layer to the outer surface of the bead. Diffusion from the bead surface into the pores of the bead. (particle diffusion) Exchanging of counterions at the fixed site. Film diffusion Particle diffusion Diffusion in solution Film (Resin) (Solution) Film Figure Schematic description of ion exchange process (source: Wang, 2015) The rate is determined by the slowest kinetic step, thus the ion exchange reaction will not be taken into consideration. Depending on the conditions, either film diffusion or particle diffusion is rate controlling. The 7

16 other factors are insignificant and can be ignored. (Tony C. Jorgensen, 2002) Parameters in Ion Exchange Ion exchanger type On the basis of origin, there are two general types of ion exchange materials, they are resins and natural exchangers; for the former one, the majority are synthetic polymers available in cationic and anionic forms whereas the latter exists in cation-exchange form only (e.g., zeolites and betonites). Thus, synthetic ion exchange materials can be cationic, anionic, and combined cationic/anionic (amphoteric) exchangers considering the nature of fixed ion exchange sites (functional groups). ph The performance of ion exchange is influenced by the ph of the solution. In the experiments done by (R.R.Harries, 1988), it can be concluded that anion exchange is faster in an acidic medium and cation exchange is more rapid in alkaline medium. Anion exchange To find the relation between anion exchange kinetics and ph, the mass transfer coefficient of chloride and sulphate were tested in the condition where strong base resin was used. It s found that there is a strong decrease in chloride or sulphate exchange kinetics in moving from an acidic influent to a neutral or alkaline influent. The reaction occurring during the exchange can be represented by the following equation: (R + OH - ) + A - (R + A - ) + OH - R + is the charged matrix and A - is chloride or sulphate. Based on the above, anion exchange is more favorable under acidic environment. The reaction will be more shifted towards the right when there are enough H + reacting with OH -. Cation exchange The variation of cation exchange kinetics with ph was carried out. Sodium and ammonium ions were tested in the condition where strong acid resin was used. There was an increase in exchange rate as the ph was increased. If the permeate has a ph of 5 which is basic, it would help to increase the ph. Thus it would also to increase ion exchange rate. Initial ammonium concentration In the presence of low ammonium concentration, the running time will be very long. When the concentration is high, the ion exchange reaches the breakthrough quickly which results in high demand of regenerates to uneconomical levels. Besides the high affinity discussed before, it also has influence on the particle diffusion. In dilute solutions (usually below 0.001M), film diffusion is rate controlling. In this research project, the film diffusion is expected to be rate determined. In more concentrated solutions (usually above 0.1 M), particle diffusion is a rate determined factor. (B.A. Bolto and L. Pawlowski, 1987) This can be explained that dilute solutions increase the flow rate of water through the pores of the bead. Particle size From described above, it can be seen that the exchange rate in concentrated solutions can be improved by the decreasing of the particle size. Higher productivity can be obtained by using smaller particle size which provides a larger surface area. But the particle is allowed to reduce to a certain size, because of a high pressure lose in the process. The rate is inversely proportional to the particle radius when film diffusion dominated, and inversely proportional to the square of the radius when the rate-limiting step is particle diffusion.(helfferich,f., 1962) In this project, the chosen particle size range of zeolite is mm or mm. Lewatit S2568H has its 8
 exchangers considering the nature of fixed ion exchange sites (functional groups).")
17 mean bead size of 0.65 mm. The smaller particle size of Lewatit S2568H could increase its ion exchange rate. Volumetric flow rate At a low flow rate, there is a static water layer around the resin held by friction. The diffusion of ions through the matrix of the resin is faster than the diffusion of ions across the static film. The film diffusion is a rate determining factor and the film becomes denuded of ammonium. In an example of ammonium containing solution flowing down resin in H + form, there would be a lot of difference of components between an upper layer of resin in the ammonium form and a down layer of resin in the H + form. The upper layer is surrounded by ammonium ions and the lower layer is surrounded by H +. It could happen when the flow is so slow that the rate of arrival of ammonium ions is similar to that of diffusion through the static film. Thus, there is no need for ammonium ions to enter another lower layer of resin. Another reason might be the low flow rate increases the contact time. In comparison to it, the rate of ammonium ions arrives on the resin is faster than the rate of diffusion through the static film at a certain high flow rate. As a consequence, the sharp distinction between layers in H + form and Na + form will be disappeared. Therefore, the breakthrough point at a low flow rate is higher than that at the higher flow rate. Also the quality of effluent is obtained as the contact time increases with a decrease in flow rate. However the total ion exchange capacity would be the same under both conditions after passage of excess solution. In the practice of water treatment, it is recommended to terminate the run at the breakthrough point. By combining the flow rate and ionic concentration of the water, the breakthrough curve is plotted. (T.V.Arden, et al., 1968) Regeneration At a certain point, the resins are saturated with unwanted substances, they can be used again by bring them back to the fresh state. Since a suitable time is needed for the required degree of regeneration, the best way of regenerating resins is to let regenerant go through columns with deep beds. The deeper the bed, the more efficient of the regenerant. Because the resin can have more time in contact with regenerant. For example, Zeolite is regenerated with sodium ions obtained by NaCl. The regeneration reaction: RNH 4 + NaCl RNa + NH 4 Cl Ammonium ions within the zeolite are released into the solution and replaced by sodium ions from the NaCl solution. For this regeneration, high concentration of NaCl is required since the reaction is reversible. Regeneration not only optimizes the exchange capacity but also reduces the ion leakage. The concentrated NaCl helps to remove contaminants at the bottom of the resin effectively within a short time. After regeneration rinsing is required. In this case, the remained Cl - and Na + have to be removed Ion Exchange capacity The exchange capacity of an ion exchange material is a measurement of the ability, in which of an insoluble material to experience replacement of ions previously attached and loosely incorporated into its structure, by oppositely charged ions present in the surrounding solution. It is a constant value for a given exchange material. The unit is expressed as mg/g of dry resin. There are two capacity parameters to characterize ion exchangers: the total static capacity and the dynamic capacity. The former is determined under static conditions, while the latter is determined by passing the solution through a bed of the exchanger (usually a packed bed or a in a column). Actually, in practice, this capacity can never be exploited due to interference from coexisting counterions. In a column type exchanger, the operating capacity or the breakthrough capacity bases on the concentration of the ions being removed, the effects of interfering ions, ionic size, ionic valence, design of the column, and operating parameters. 9

18 2.3.4 Breakthrough A plot (see Figure ) between the concentrations of the removed ions in the effluent (ordinate) versus the effluent volume (abscissa) is drawn. The breakthrough is defined as the point where the unwanted ions in the effluent appear in appreciable quantity. (c, start of breakthrough). The extent of breakthrough rises to a point e where no more ion exchange occurs, that is, the effluent includes the original concentration of the ions. This point records the stage at which the ion exchanger is completely exhausted and must be regenerated or replaced. In order to enhance the extent of column utilization, it is always beneficial to get as steep a breakthrough curve (adce). Effluent volume Figure Schematic representation of breakthrough curve (Source: Inamuddin, 2012) In Figure , C o means the initial influent concentration of ammonium; Cx means the instantaneous effluent concentration of ammonium. Figure Breakthrough curve showing the outlet concentration (source: Tony C. Jorgensen, 2002) In Figure , it illustrates a normal breakthrough curve at three different flow-rates. A high flow-rate is related with early breakthrough and a gentle breakthrough curve. Low flow-rates may be related with later breakthrough and a narrow breakthrough curve. At low flow-rates, a greater volume of water may be treated until breakthrough occurs. 10

19 3. Methods and materials For this project, a column set-up was designed and two kinds of materials were chosen for the experiments. 3.1 Set-up To determine the breakthrough capacity of Lewatit and zeolite, a four-column set-up was designed to perform the experiments. The conditions were that the feed water (RO permeate) had an ammonium concentration around 0.1 mg and average temperature of 12 o C. The ammonium concentration of effluent was not allowed more than 0.03 mg/l which was considered as a breakthrough point. The schematic overview of the set-up is presented in Figure Figure 3.1.1: Schematic overview of the set-up Specifications of the pilot column setup Number of columns: 4, diaphanous PVC 4 columns for ion exchange beds Column height: 1 m, Inner diameter: 34 mm Filter plates holes: 0.4 mm Taps at the top and bottom of the columns Feed water: RO permeate Direction of flow: inflow and outflow Sampling points and codes Column 1: influent = XKMKOX01A effluent= XKMKOX01Z Column 2: influent = XKMKOX02A effluent= XKMKOX02Z Column 3: influent = XKMKOX03A effluent= XKMKOX03Z Column 4: influent = XKMKOX04A effluent= XKMKOX04Z The feed water flows through the gate valve followed by the column and out to drain. The selected resin/zeolite should be placed in the column with a designed height for testing. Filter plates are at the top and bottom of the columns. To prevent the material flow out of the columns, the filter stone (3 cm height) is put at the bottom of 11

20 NH4 concentration (mg/l) the column and continued with three layers of sand filter (h=3,3,5cm and size range of , , mm ) on the top of each other. Before running the column, water flows upward through the bed for 5 minutes, causing the bed expansion. In this manner, the smaller beads will be brought to the top and the larger bead to the bottom. This provides a better distribution. Another purpose for doing this is to get air and dirt particles out of the column. 3.2 Materials For the ion-exchange, both resin and zeolite are used. The synthetic ion exchange resin, Lewatit S2568H is a cation exchange resin in the hydrogen form with functional group sulfonic acid provided by Lanxess. Zeolite is in the form of natural clinoptilolite received from Zeolite Products. The color of the zeolite is yellow and green. The chosen size for zeolite is mm and mm. The particle size of resin has a mean bead size of 0.67mm (+/-0.05). For more information about the material, it is to be found in Appendix. 3.3 Measurement methods The ammonium analyses were performed by spectrophotometer Hach-Lang DR 2800 using Hach-Lang cuvettes LCK 304. The detection range of ammonium concentration is from 0.02 to 2.5 mg/l. One of the columns can be connected to analyzer Applikon Colorimeter from which more continuous data will be obtained. The limit of detection for ammonium is mg/l. For the validation of equipments samples were analyzed by the Vitens Drinking water Laboratories. 3.4 The validation of spectrophotometer Hach-Lang DR 2800 To calibrate the spectrophotometer Hach-Lang DR 2800, samples were measured under different conditions and also sent to the Vitens lab to for comparison. One measurement was done by spectrophotometer Hach-Lang DR The sample was tested twice at different time to see if the equipment works properly. One was tested after a reaction time of 15 minutes. Another one was tested after 30 minutes. And from the manual of the tester, the final absorbance is reached after a reaction time of 15 min and then remains constant for a further 15 min. Therefore, one was tested after a reaction time of 15 minutes. Another one was tested after 30 minutes. If it works well, the ammonium concentration of both being measured should be the same. The other measurement was done by Vitens Laboratories to see if the results matched with each other. (see Table in Appendix C and Figure 3.4.1) 0,12 0,1 0,08 0,06 0,04 0,02 0-0,02 Column 2 5cm Lewatit S2568H Time (h) R.T t=15min R.T t=30min t=15min t=30min Vitens lab data + Figure 3.4.1: 5 cm bed height Lewatit S2568H with flow rate of 12L/h, about 0.1 mg/l NH 4 measured by Spectrophotometer Hach-Lang DR 2800 and Vitens lab feed water 12

21 NH4 concentration(mg/l) From the data, it can be seen there was a big difference between the two measurements at different time. The reason might be the sample was not kept at 20 C according to the manual of Hach-Lang DR To find out the influence of temperature, new measurement was done with one of the samples kept at room temperature. The result shows the accuracy of measurement is strongly depended on temperature. The measured results from Vitens Laboratories matched better with the results measured by spectrometer when the samples kept at room temperature. In case of not working at the right recommended temperature an incorrect result may be obtained. Therefore it is recommended to keep samples in a water bath at 20 C before measuring. Sample in water bath The permeate samples were kept in the water bath at a constant temperature of 20 ºC. The measuring results were obtained as follows in table 3.4.2: t=15 min t=20 min t=25 min t=30 min NH + 4 (mg/l) NH + 4 (mg/l) NH + 4 (mg/l) Table 3.4.2: permeate measured by Spectrophotometer Hach-Lang DR 2800 The spectrometer provides now much more stable measuring results than before. The results were quite stable at t=20 min. Therefore, the ammonium concentration will be recorded after a reaction time of 20 minutes. 3.5 The validation of ammonium analyzer Applikon Colorimeter In order to examine the accuracy of ammonium analyzer Applikon Colorimeter, some samples were taken for Vitens Laboratories. At the same time, two samples were respectively taken from column 4 for lab test every hour. The ammonium analyzer Applikon Colorimeter measured automatically the ammonium concentration of effluent every 5 minutes. 0,1 0,09 0,08 0,07 Comparison of Vitens and Applikon Colorimeter 0,06 0,05 0,04 0,03 Vitens Applikon Colorimeter 0,02 0, Effluent volume(l) Figure Comparison of Vitens and Applikon Colorimeter data from column 4 (5 cm bed height Lewatit + S2568H with flow rate of 12L/h, about 0.1 mg/l NH 4 feed water) 13
22 Conclusion According to (Table and Table in Appendix D), there were 6 times that the lab data didn t match with the Applikon Colorimeter data (The red shows lab data in table 2). However, the data in blue color that were just taken after a few minutes matched better with the one in red. This appearance was probably caused by the measuring process of analyzer which analyzed samples every 5 minutes. The biggest difference in measuring results was at 10:45 15 th January It might be regarded as the error of ammonium analyzer Applikon Colorimeter, because the ammonium concentration was zero at 10:35 and mg/l at 10:55, which totally didn t make any sense. Based on the figure 3.5.2, the results obtained by analyzer Applikon Colorimeter were different from those by Vitens Laboratories, when the concentration of ammonium was low in effluent. The difference might due to the limit of detection in Vitens Laboratories for ammonium. When the concentration of ammonium was high in effluent, the results of the two measurements were almost the same. Therefore, the result of ammonium analyzer Applikon Colorimeter is reliable. 3.6 The validation of ammonium dosing pump Dosing ammonium to the RO permeate was attempted to get a higher ammonium concentration in influent in order to obtain a breakthrough curve in a short time. The validation of ammonium dosing pump was done by comparing the results of different experiment set-ups. For the sake of dosing ammonium concentration, it was divided into several steps. At first, it was required to figure out the size of tubes and their flow rate. A 10 ml measuring column and a timer were used. The record shows in table Table Calibration of pump Rotating speed (rpm) Flow rate of tube 1 (ml/min) Flow rate of tube 2 (ml/min) Flow rate of tube 3 (ml/min) Flow rate of tube 4 (ml/min) According to the measured results above, the diameter of tubes should be 0.76 mm which provides flow rate of 4.2 ml/min at 100 rpm and 2.1 ml/min at 50 rpm. However, the actual flow rate is depended on how the pump, tube and solution tank are placed Experiment set-up Experiment 1 The second step was to calculate the amount of required dosing ammonium concentration. The required ammonium dosing concentration to reach an influent concentration of 40 mg/l NH 4 + is calculated as follows: Condition: Pump: 100rpm=4.20 ml/min =0.252 L/h Flow rate of feed water: 12L/h Ammonium concentration of feed water: 0.1mg/L Dosing NH 4 + concentration: X 40 mg L *12.252L h =490.08mg h L h * X mg L + 12L h * 0.1mg L = mg h X=1940 mg L =1.94g/L NH 4 + occupies 34% in ammonia chloride. NH 4 Cl =1.94g/L /34%=5.71 g/l. The next step was to check the accuracy of dosing ammonium concentration. 14
23 In the next experiments, an ammonium dosing solution was made using the same method to get an effluent of 10 mg/l. Experiment 2 Tried to make a better mixing; a few joints were connected with each other (figure 3.6.2). Experiment 3 The one way direction valve was taken off that the tube was directly connected with the tube of feed water (see figure 3.6.3). Figure Experiment 1 Figure 3.6.2: Experiment 2 Figure Experiment 3 Results Experiment 1 Instead of 5.71 g/l NH 4 Cl, 1.94g/L NH 4 Cl was prepared by mistaking the mass of NH 4 Cl the same as that of NH + 4. In this case, dosing NH4 + together with RO permeate should give 13.7 mg/l as influent ammonium concentration. The sample of influent was taken and diluted 20 times. The results was mg/l. But it should be mg/l. Experiment 2 Experiment No. NH 4 NH No. 4 (mg/l) (mg/l) Experiment 2: Average=4.486 mg/l Minimum=3.52 mg/l Maximum=6.04 mg/l STD=5.84 Experiment 3: Average=8.96 mg/l Minimum=7.70 mg/l Maximum=9.76 mg/l STD=2.86 Conclusion/Discussion Due to the measuring range of ammonium analyzer Applikon Colorimeter is from 0 to 1 mg/l, which means it could not provide a complete breakthrough curve. As the ammonium concentration was so high, the ammonium analyzer Applikon Colorimeter might just record the beginning part of the curve. From the results, it can be concluded the tube without one way direction valve gave the most stable ammonium concentration in comparison with other methods. This method might provide a better mixing and more continuous water flow. To improve the experiment setup, it is recommended to use a tube with a bigger diameter. 15
24 16
25 Breakthrough capacity (mg/g) 4. Results The main purpose of this research is to design an ion exchange column for the ammonium removal of feed water (RO permeate). Therefore, the optimum volumetric flow rate should be determined during the experiments over a range of choices which would provide a maximum breakthrough capacity. Since there was a limitation of time, it would take too long to determine the breakthrough capacity at a high bed height. It s easier to find the relation between the bed height and the breakthrough capacity. A complete list of results can be found in the measuring results in Appendix E. 4.1 The performance of 10 and 20 cm Lewatit S2568H For each flow rate the breakthrough capacity was compared at the same bed height. Also, the performance of different bed height was compared at the same flow rate. The overview of the results is presented in Table and Figure Bed height (cm) Flow rate (L/h) Surface loading (m/s) Average permeate concentration (NH4 mg/l) Breakthrough capacity (mg/l) Breakthrough capacity (mg/g) Breakthrough time (h) Table Breakthrough capacity of Lewatit S2568H at different bed heights and flow rates 3,00 2,50 2,00 1,50 1,00 0,50 0,00 Breakthrough capacity of Lewatit S2568H Flow rate (L/h) 10 cm resin 20 cm resin Figure Breakthrough capacity of Lewatit S2568H at different bed heights and flow rates 17
26 NH4 concentration(mg/l) The breakthrough capacity is calculated as follows, in the following example: 0,05 0,045 0,04 0,035 0,03 0,025 0,02 0,015 0,01 0,005 0 Breakthrough curve of 20cm Lewatit S2568H with 100L/h permeate water y = 1E-15x 4-3E-12x 3 + 4E-09x 2-2E-06x + 0, Effluent volume(l) Breakthrough point 20cm resin 100L/h The area beneath the curve is calculated by integrating the equation of the best fit curve as following: y = 1E-15x 4-3E-12x 3 + 4E-09x 2-2E-06x y = 1E-15/5x 5-3E-12/4x 4 + 4E-09/3x 3-2E-06/2x x=27 Average concentration of feed water=0.132 mg/l Breakthrough capacity=0.132* =324 mg 324 mg/0.18 L=1784 mg/l =2.41 mg/g It was expected the trend of breakthrough capacity over a range of flow rates would be similar at different bed height. Unfortunately, the results from the measurements showed differently. Figure 4.1 shows that the optimum breakthrough capacity was at flow rate of 60 L/h in a resin column with bed height of 10 cm, while in a resin column with bed height of 20 cm the optimum breakthrough capacity was at flow rate of 40 L/h or 100 L/h. If 10 cm resin bed was compared to 20 cm resin bed, it shows that the capacity of 20 cm resin bed is getting bigger as the flow rate increases above 60L/h, while the performance of 10 cm resin bed didn t demonstrate the similar trend. At flow rate of 60L/h, both resin columns with different bed height have almost the same breakthrough capacity. If two different bed heights of resin columns were compared though, it can be seen that the capacity of resin increased with 38% at flow rate of 80L/h and 57% at flow rate of 100 L/h, when the bed height was increased from 10 cm to 20 cm. This indicates that the breakthrough capacity is related to the bed height. Whether the increasing rate of capacity is proportional to the bed height cannot be told though. 18
27 NH4 concentration(mg/l) NH4 concentration (mg/l) Breakthrough curve of 20cm Lewatit S2568H 0,14 0,12 0,1 0,08 0,06 0,04 0, Effluent volume (L) Breakthrough point 20cm resin 60L/h 20cm resin 40L/h 20cm resin 80L/h 20cm resin 100L/h 20cm resin 12L/h Figure 4.1.2: Breakthrough curve of 20 cm Lewatit S2568H with different flow rte measured by ammonium analyzer Applikon Colorimeter and Hach Lang spectrometer DR 2800 (flow rate of 12L/h) 0,14 0,12 Breakthrough curve of 10cm Lewatit S2568H 0,1 0,08 0,06 0,04 0, Effluent volume(l) Breakthrough point 10cm resin 60L/h 10cm resin 100L/h 10cm resin 40L/h 10cm resin 80L/h Figure 4.1.3:Breakthrough curve of 10 cm Lewatit S2568H with different flow rate measured by ammonium analyzer Applikon Colorimeter Figure and Figure give an overview of the breakthrough curves of resin at different flow rates. The breakthrough curves demonstrate the similar trend. Only at 10 cm bed height, there was an obvious difference between flow rate of 60L/h and the rest. Compared with other flow rates, the flow rate of 40L/h for 20cm bed height might provide the most steep breakthrough curve. Since the complete curve was not obtained, this inference was based on the distribution and characteristics of the data values. 19
28 NH4 cncentration (mg/l) 4.2 Comparison between Lewatit S2568H and clinoptilolite Effluent volume(l) Figure Breakthrough curve of 20 cm Lewatit S2568H measured by ammonium analyzer Applikon Colorimeter and that of clinoptilolite by Hach Lang spectrometer DR 2800 The chosen particle size range here for the zeolite is mm. Figure shows that the performance of resin is much better than that of zeolite. The zeolite reached the breakthrough at effluent volume of around 150 L, while the resin at effluent volume of around 2500 L. This is probably 17 times better. The breakthrough times for zeolite were 1.7 h and 1.3 h and for resins were 30 h and 26 h at flow rate 80 L/h and 100 L/h respectively. 4.3Comparison between clinoptilolite with different particle size zeolite mm zeolite mm 0,09 0,08 0,07 0,06 0,05 0,04 0,03 0,02 0,01 Breakthrough curve of 20cm clinoptilolite and Lewatit S2568H 20cm resin 80L/h 20cm resin 100L/h 20cm zeolite 80L/h 20cm zeolite 100L/h duration (h) 2 NH4 (mg/l) 0.02 duration (h) NH4 (mg/l) Table Performance of zeolites in different particle size at bed height of 30 cm, flow rate of 12L/h (measured by Hach Lang spectrometer DR 2800 Two kind of zeolite with different particle sizes were used. One has a range between mm; the other has a range between mm. As expected, it is advantageous to use smaller particle size grading. (see paragraph 2.3.2). In a condition where 30 cm bed height zeolite was at flow rate of 12 L/h, the zeolite of big particle size reached 0.02 mg NH 4 + in effluent after 2 hours. For zeolite of small particle size, the ammonium concentration in effluent was under measuring range even after 70 hours. (see Table 4.3.1) 20
29 5. Discussion 5.1 Influence of bed height In ion exchange, if the separation factor for the unwanted ion to be removed is greater than 1, the mass transfer zone length or exchange zone will be relatively small in comparison with the column height. (John C. Ctrittenden et al., 2015). This indicates that an increase in bed height for the column at the same flow rate will not change the breakthrough capacity. From the literature, it shows that the NH 4 + /H + separation factor is 1.9. Since the separation factor is greater than 1, it was expected that the breakthrough capacity would remain the same for different bed height. Unfortunately, the results showed differently. Some studies recommend doing column experiments at a reasonable height between 0.6 to 1m. This is probably due to the fact that the feed water would flow downward along with the column walls, which results in less efficient contact with the resin when the bed height is not high enough. From the Figure 4.1.1, it can be seen that the resin with a higher bed height also has a higher breakthrough capacity. But it was expected that the rate of an increase in breakthrough capacity would be lower as the bed height increases. At a certain bed height, the influence of it on breakthrough capacity would be neglected. 5.2 Influence of flow rate Normally, in the case of strong acid resin in dilute solutions, the flow rate of ions arrived on the beads is faster than ions diffuse through the film. As described in paragraph (2.3.2), the distinction between H + form and NH 4 + form resin will not be obvious. Thus, the breakthrough capacity is expected to be lower at a higher flow rate. If the thickness of the film remains the same, the breakthrough capacity would decrease proportional to the flow rate. In fact, the thickness of the film wouldn t stay unchanged; it decreases with an increase in flow rate. Therefore, the rate of arrival of ions would be faster. But the loss of breakthrough capacity would be minimized by the thicker flim. This helps to explain why Figure 4.1 shows that the flow rates over a range between 12 and 100L/h do not have significantly impact on the breakthrough capacity of the resin. This also implies that the breakthrough time is long enough for the ion exchange process to happen in the resin. The resin is at equilibrium with the solution. Breakthrough capacity (mg/g) Breakthrough time (h) Flow rate (L) Figure 5.1 Effect of breakthrough time and flow rate on the breakthrough capacity The Figure 5.1 presents how the relation between breakthrough capacity and flow rate and breakthrough time could look like. At a certain short breakthrough time and high flow rate, the time required for ions diffuse through the film is longer than that for ions to be presented to the resin beads. Thus, the film diffusion begins to take the effect. 21
30 5.3 Kinetics The figures 4.2 and 4.3 also indicate that the film diffusion is rate controlling. As the ion concentration in the feed water increases, the rate of film diffusion increases and becomes even faster than the rate of particle diffusion. The overall rate of ion exchange process is determined by the particle diffusion. If it is so, the breakthrough capacity would increase proportional to the flow rate. In other word, the film diffusion is rate controlling in the diluted solution. In the experiment condition, the feed water had only ammonium concentration of around 0.1 mg/l. The concentration of other ions should be very low, because the feed water was obtained after the RO membrane process. Therefore, the feed water was a diluted solution, in which the rate of ion exchange process was film diffusion determined. 5.4 Performance of zeolite and resin The resin performed much better than zeolite. This might because the surface of zeolite was much rougher than that of resin. Therefore, there was an increase in thickness of the film and ammonium need more time to diffuse through the surrounding film. Lewatit S 2568H is a cation exchange resin in the hydrogen form. Zeolite is in the form of clinoptilolite with Na + as counter-ions. Since the size of H + is smaller than that of Na +, it might easier for H + to diffuse from the beads to the bulk solution. In the comparison of the previous research done by Ekowati, the results were the same. The resin performed better than zeolite. In her research, no breakthrough of the resin was observed until the experiments were stopped. But when it comes to the run length of the zeolite, the results were not comparable. The run lengths calculated base on the KWR isotherm were 18h and 14h at flow rate 80 L/h and 100 L/h. According to the experiment results, they were 1.7 h and 1.3 h. This might because the bed height was too low to prevent the feed water flows down along with the walls effectively. 5.5 Influence of particle size. Reaction is a function of particle size. As explained in paragraph 2.2.3, the smaller particle size provides a larger surface area. The time an ion needs to travel through the resin bead itself decreases with decreasing particle size. From the experiments, it can be seen that the results were comparable to that found in KWR report. In this report, it s concluded that ammonium removal is faster with the smaller grains. 5.6 Difficulties of doing pilot experiments The ammonium concentration of feed water was not so stable during the experiments. In the extreme case, the lowest concentration was 0.08 NH 4 + mg/l and the highest concentration was 0.16 NH 4 + mg/l. If the experiments were done at different bed heights, more data would be obtained to help investigate the relation between the bed height and the breakthrough capacity. But, it s not possible to do due to the time limitation. A higher bed height would require more time to run the experiment. Sometimes, it was not possible to get a complete and reliable breakthrough curve by using Hach Lang spectrometer DR 2800, because the breakthrough point occurred during the night. It was planned to increase the NH 4 + concentration in feed water by doing pump. Unfortunately, it was not succeeding and the mixing problem still has to be dissolved. 22
31 6. Ion exchange column design calculation 6.1 Introduction For the up-scaling calculation it is required to know how much water is produced. Drinking water treatment plant De Hooge Boom in Kamerik is designed to have an average production of 300m 3 /hour with a peak production of 420m 3 /hour. From this and other boundary conditions the preliminary design of the membrane filtration step is to have 4 stacks of each a capacity of 120m 3 /hour. Following the first treatment, every succeeding step in the treatment plant will consist of 4 unit with each a capacity of 120m 3 /hour (see Appendix F). Based on the results of the experiments, it was found that Lewatit S2568H resin is more effective than clinoptilolite for the removal of ammonium ions from permeate. To design ion exchange columns there are some aspects that should be taken into consideration, such as the volume of resin, the surface area of resin, the height of columns, the number of columns and the pressure drop. The data obtained from small-column (1.0 to 5.0 cm inside diameter) can be scaled up directly to full-scale design if the surface loading rate and empty bed contact time are the same. (John C. Ctrittenden et al., 2015) This rule can be applied to scale-up this design, because the diameter of columns is 3.4 cm. To get the above described parameters, the optimum volumetric flow rate should be determined during the experiments over a range of choices to find out if there is a maximum breakthrough capacity at a certain flow rate. According to John C. Ctrittenden, the minimum bed height used in the industry is 0.75 m, and the maximum 3 m. The maximum bed height is established to prevent the big pressure drop that would affect the stability of the resin. From the results, it can be seen that by increasing the bed height at the same flow rate the breakthrough capacity would be increased. Thus, a higher bed height is preferred but not exceeds the maximum. Based on manufacture s production information, the minimum bed depth for Lewatit S2568H is 800mm. 6.2 Design calculation Since the experiment results show that the breakthrough capacity was quite stable over a range of flow rate between 12L/h and 100L/h, the following assumptions are made: - The maximum capacity is all used. - Average breakthrough capacity of 2.17 mg/g (1606 mg/l) at 20 cm bed height is used for calculation for different bed heights. It is assumed that the breakthrough capacity remains the same. - The ammonium concentration of permeate is 0.14 mg/l. An example of calculation for the column design In this example a flow rate of 100L/h is taken. Pressure drop Based on the manufacture s data, the maximum pressure drop for the resin bed is 300kPa. Both of surface loading and bed height have impact on pressure drop through the resin. The relevant information can be found in pressure drop formula sheet (Appendix B) provided by manufacture. The pressure drop of ion exchange resin beds is calculated according the following formula: Δp [kpa] = h [m] x v [m/h] x FV x FT x FR h = Resin bed depth [m] v = Linear velocity [m/h] FV = Velocity factor (from diagram 6.1 and Appendix C) FT = Temperature factor (Appendix C) FR = Resin factor (specific pressure drop [kpa x m -2 x h] 23
32 Velocity Factor 1,8 1,7 1,6 1,5 1,4 1,3 1,2 1,1 1 velocity factor of Lewatit S2568H y = 4E-05x 2 + 0,003x + 0, Flow rate (m/h) velocity factor Diagram 6.1 Velocity factor FR in this case is 0.8 [kpa x m -2 x h] FT=1.1 Linear velocity/surface loading (m/h)= 100/1000/(π*0.017^2)=110 m/h Maximum resin bed height (m) h= 300/(110*(4*(10^-5)*110^ * )*1.1*0.8)=1.8m Service flow rate The volume of the bed occupied by the resin: BV=area depth=π(0.17dm)2 18dm=1.63L SFR=100L/h 1BV/1.63L=61BV/h Volume of resin Treated water flow rate=120 m 3 /h Total required resin volume= Surface area of resin required Total required surface area= Diameter= (1.1 m 2 /π)^0.5*2=1.2m Breakthrough time Treated water flow rate = 120L/h SFR 61 BV/h Resin volume m3 =2.0 Resin depth 1.8 m =1.1m2 ==2.0 m3 Approximate breakthrough time= 2.0 m 3 *1000 L m 3*1606mg L /0.14mg L /120000L h =186h=7.7days Cost of material If the exhausted resin is replaced by new resin after each 7.7 days without considering regeneration, the total cost per year would be: Lewatit S2568H= 2.55 euro per Liter Total cost= =2.55 euro *2.0 L m3 *1000 L m3/(7.7days/365days)= euro Total produced water per year= 130 m3 *4*24*365= m3 h The cost per m 3 water produced would be euro/ m 3 =0.06 euro This price is also for flow rate between L/h, because the breakthrough capacities are almost the same. 24
33 Column height As there is bed expansion during backwashing with considerable risk of resin loss, an extra space is needed. The bed expansion is about 70% at the flow rate of 12 L and the water temperature is 12. The required height for backwashing= 1.8m*70%=1.26 m The minimum column height without considering of the height for resin support and inlet distributor should be: 1.8m+1.26m=2.06 m. An over view of column design Flow rate Surface loading Resin bed height (m) SFR Required resin volume (m3) Required surface area (m2) Diameter Break- Through Time (h) Break- Through time (days) Material cost per year (euro) (L/h) (m/h) (BV/h) (m) Table 6.1 overview of column design with maximum resin bed height The influence of different surface loadings on the design is presented in table 6.1. The resin bed height above presented the maximum bed height a column can have without exceeding the limited pressure drop. As the surface loading increases, the size of the column and breakthrough time decrease. Although, a smaller column requires replacement or regeneration of resin more frequently, it saves the space and equipment investment and maintenance cost. Recommendation It was noticed that the breakthrough time for each flow rate above is quite long. It is considerable to replace with the new resin after each service run, if the financial aspect is not considered. However, in real life it is always good to have a cost as low as possible while maintaining quality. The material cost of 6 cents per m 3 water is a bit too expensive. The ion exchange process with regeneration might be a good solution. The following assumptions are made: - Bed height is 2m (feasible, a common bed height for ion exchange) - Regeneration cost is maximum 25% of the resin cost An overview of column design at bed height of 2 m is shown in Table 6.1. Flow rate at 100L/h is not excluded from the calculation table, because its maximum allowed bed height is 1.8 m.the calculation method is the same as before. The material cost per m 3 produced water is calculated as follows: For example at flow rate of 90 L/h Material cost per year= 2.55 euro L *2.42m3 *1000 L m euro L *2.42m3 *1000 L m3*0.25*365days/9.6days= euro Material cost per m 3 produced water= euro/ m 3 =0.014euro 25
34 flow rate linear velocity Resin Bed Height (m) SFR Required resin volume (m3) Required surface area (m2) Diameter Breakthrough time (days) Material cost per year (euro) Material cost per m 3 water (euro) (L/h) (m/h) (BV/h) (m) Table 6.1 overview of column design with 2m resin bed height From the table, it can be seen that the size of column and material cost decrease as the flow rate (surface loading) decreases. Thus, for a 2 m bed height column, it s best to operate at a surface loading of 99 m/h. Both equipment cost and material cost would be the lowest. The empty bed contact time is calculated with the formula: EBCT= H V EBCT=empty bed contact time (h) V=surface loading (m/h) H=bed height (m) The EBCT would be: EBCT= 2m 99m/h =0.02 h= 1.2 minutes The minimum column height without considering of the height for resin support and inlet distributor would be: 2.0m(1+70%)=3.4 m. 26
35 7. Conclusion and recommendations for future research 7.1 Conclusion The goal of this research project is to design ion exchange column for the future full scale treatment plant De Hooge Boom in Kamerik. In order to reach this goal the following research questions were asked and needed to be answered. What is the influence of the surface loading (which is flow rate of feed water on the effectiveness of ammonium removal by ion exchange)? It was expected that the breakthrough capacity would increase as the flow rate increases. However, the results showed differently. The breakthrough curves demonstrated the similar trend at the flow rate between 12L/h and 100L/h. The possible explanation for this phenomenon was discussed in chapter 6. If the thickness of the film remains the same, the breakthrough capacity would be lower at a higher flow rate. In fact, the thickness of the film wouldn t remain unchanged; it decreases with an increase in flow rate. This results in faster arrival of ions on the beads. But the loss of breakthrough capacity would be minimized or avoided by the thicker film. For the ion exchange column design, the average breakthrough capacity of 2.17 mg/g (1606 mg/l) was used. What is the influence of the bed height of the ion exchange for the effectiveness of ammonium removal? From the results, it can be concluded that the ion exchanger with a higher bed height also has a higher breakthrough capacity. This is because the column walls are every smooth in comparison with the bed so that the feed water would flow downward along with the column walls. The feed water would have less contact with the ion exchanger. But it was expected that the rate of an increase in breakthrough capacity would be lower as the bed height increases. At a certain bed height, the influence of it on breakthrough capacity would be neglected. What would the design in the future treatment plant look like? Based on the experiment results and calculation, the ion exchange is design as follows: Number of vessels: 4 each with a capacity of 120m 3 /h Bed height: 2m Column height (without considering of the height for resin support and inlet distributor)=3.4m Surface loading: 99m/h EBCT: 1.2 minutes Breakthrough time: 10 days Material cost of resin per m 3 water produced:
36 7.2 Main uncertainties in the research and design One of the main uncertainties would be the relation between the flow rate and the breakthrough capacity. From the experiment results, the breakthrough capacities were quite similar between 12L/h and 100L/h. But, what will happen with the breakthrough capacity at a higher flow rate still need to be tested through experiments. Another uncertainty was the influence of bed height on the breakthrough capacity and to what degree. 7.3 Recommendations for future research It s recommended to do experiments at higher bed heights, for example at 80 cm. The effect of less contact time with the ion exchanger that caused by the fact that water flows down along with the column walls would be minimized in this manner. Since the ammonium concentration of feed water was not constant, it s better to measure the concentration more frequently. Higher flow rate can be tried in the future research to see how it will affect the breakthrough capacity. It is also interesting to dose an ammonium concentration to the feed water to see how NH 4 + concentration related to the breakthrough capacity at the same flow rate. 28
37 Reference B.A.Bolto and L.Pawlowski (1987) wastewater treatment by ion exchange., E.& F. N. Spon George J. Crits (2012) Crits Notes on Water and Ion Exchange., Chemical Publishing Helfferich,F. (1961) Ion exchange, McGraw-Hill, pp Inamuddin Mohammad Luqman (2012) Ion exchange technology I theory and materials, Springer, London. pp.22. John C. Ctrittenden, R.R.Trussell, D.W.Hand, K.J.Howe, G.Tchobanoglous (2015) John Wiley & Sons, Inc, Water treatment, principles and design. MWH. Second edition. P Kiwa N.V. (2005) Ammonium removal in drinking water using natural zeolite Kunin R (1951) Ion exchange. Ind Eng Chem 43: Langwaldt, J. R. (2008) Ammonium Removal From Water by Eight Natural Zeolites: A Comparative Study. Separation Science and Technology, 43, Rohm and Haas (2008) Ion exchange introduction R.R.Harries. (1988) The role of ph in ion exchange kinetics, Ion Exchange for Industry, Nottingham NG11 OEE, UK, pp Schmidt, W (2008) Tony C. Jorgensen (2002) Removal of ammonia from wastewater by ion exchange in the presence of organic compounds. Master of Engineering, University of Canterbury. T.V.Arden., F.R.I.C.,M.I.M.M., P.A.I.W.E (1968) Water purification by ion exchange., Plenum Press Yuli Ekowati (2014) From RO permeate to an impeccable drinking water and biologically stable water. Oasen&UNESCO-IHE Institute for Water Education. Yvonne Mikkers (2009) Regeneration of zeolites used for ammonium removal from anaerobic groundwater. Oasen&Master of Science in civil engineering, Delft University of Technology. 29
38 Appendix A: Drinking water quality standards The following environmental quality standards are target values which relate to surface water used for the preparation of drinking water. Parameter Unit Standard acidity ph 7,0 8,5 suspended solids mg/l 25 Conductivity electricity ms/m at 20 C 100 Odor dilution factor at 20 C 3 chloride mg/l Cl 150 sulphate mg/l SO fluoride mg/l F 0,7 ammonium mg/l N 0,2 Organic nitrogen mg/l N 1 nitrate mg/l NO 3 25 dissolved oxygen mg/l O 2 > 6 Chemical oxygen demand mg/l O 2 30 Biochemical oxygen demand mg/l O 2 3 sodium mg/l Na 90 Iron resolved mg/l Fe 0,1 manganese μg/l Mn 50 buyer μg/l Cu 20 zinc μg/l Zn 200 drill μg/l B 1000 arsenic μg/l As 10 cadmium μg/l Cd 1 Chromium (total) μg/l Cr 20 lead μg/l Pb 30 selenium μg/l Se 10 mercury μg/l Hg 0,3 barium μg/l Ba 100 cyanide μg/l CN 50 Surface-active substances which react with methyleenblau μg/l 200 Water vapor volatile phenols μg/l C 6 H 5 OH 5 mineral oil μg/l 50 Polycyclic aromatic hydrocarbons μg/l 0,2 Human toxicological relevant plant protection products, biocides, and their relevant degradation products (sum) Pesticides, biocides and their relevant degradation products per individual substance μg/l 0,5 μg/l 0,1 Choline-esterase inhibitors, μg/l 1,0 Coliform bacteria (total) number per 100 ml 50 30
39 Parameter Unit Standard Thermo-tolerant coliform bacteria number per 100 ml fecal streptococce number per 100 ml algae Biomass μg/l chlorofyl-a 100 Table 1. Environmental quality standards with respect to surface water used for the preparation of drinking water
40 Appendix B: Schematic drawing Set-up by Yvonne Mikkers 32
41 Appendix C: Material data sheet 33
42 PRODUCT INFORMATION LEWATIT S 2568 H Lewatit S 2568 H is a food grade, macroporous, monodisperse, strongly acidic cation exchange resin based on a styrene-divinylbenzene copolymer. Lewatit S 2568 H is especially applicable for:» the decationization of solutions of organic products, e.g. sugar beet, sugar cane, starch sugar, glycerine, gelatine, whey and food acids etc.» the extraction of amino acids, e.g. lysine» mixed bed polishing Lewatit S 2568 H is adding special features to the resin bed:» high exchange flow rates during regeneration and loading» a good utilization of the capacity, low rinse water demand» a homogeneous throughput of regenerants, water and solutions; therefore an homogeneous working zone» a nearly linear pressure drop gradient for the whole bed depth; therefore an operation with higher bed depth possible» a good separation behaviour of the components in a mixed bed application If using Lewatit S 2568 H to treat potable water and the aqueous solutions listed above, special care should be given to the initial cycles of the new resin. Please refer to the recommended start-up conditions available on request. The special properties of this product can only be fully utilized if the technology and process used correspond to the current state-of-the-art. Further advice in this matter can be obtained from Lanxess, Business Unit Liquid Purification Technologies (LPT). This document contains important information and must be read in its entirety. Edition: /5 Previous Edition:
43 PRODUCT INFORMATION LEWATIT S 2568 H General Description Ionic form as shipped H + Functional group Sulfonic acid Matrix Structure Appearance Specified Data metric units Uniformity Coefficient max. 1.1 Crosslinked polystyrene Macroporous Beige-grey, opaque Mean bead size mm 0.67 (+/- 0.05) Total capacity min. eq/l 1.6 Physical and Chemical Properties metric units Bulk density (+/- 5 %) g/l 740 Density approx. g/ml 1.18 Water retention wt. % Volume change H + --> Na + max. vol. % - 8 Stability at ph-range 0-14 Stability temperature range C Storability of the product max. years 2 Storability temperature range C This document contains important information and must be read in its entirety. Edition: /5 Previous Edition:
44 PRODUCT INFORMATION LEWATIT S 2568 H Recommended Operating Conditions* OPERATION metric units Operating temperature max. C 120 Operating ph-range 0-14 Bed depth min. mm 800 Specific pressure drop (15 C) approx. kpa*h/m Pressure drop max. kpa 300 REGENERATION, COUNTER-CURRENT Regenerant type HCl H 2 SO 4 NaCl Regenerant quantity approx. g/l HCl 60 H 2 SO NaCl 100 Regenerant concentration wt. % HCl 4-6 H 2 SO / 3** NaCl 8-10 Linear velocity approx. m/h HCl 5 H 2 SO NaCl 5 Linear velocity rinsing approx. m/h 5 Rinse water requirement slow / fast approx. BV 2.5 REGENERATION, CO- CURRENT Regenerant type HCl H 2 SO 4 NaCl Regenerant quantity approx. g/l HCl 100 H 2 SO NaCl 200 Regenerant concentration approx. wt. % HCl 4-6 H 2 SO / 3** NaCl 8-10 Linear velocity backwash (20 C) approx. m/h Linear velocity rinsing approx. m/h 5 Bed expansion (20 C, per m/h) approx. vol. % 4 Freeboard backwash vol. % 60 (extern / intern) * The recommended operating conditions refer to the use of the product under normal operating conditions. It is based on tests in pilot plants and data obtained from industrial applications. However, This document contains important information and must be read in its entirety. Edition: /5 Previous Edition:
45 PRODUCT INFORMATION LEWATIT S 2568 H additional data are needed to calculate the resin volumes required for ion exchange units. These data are to be found in our Technical Information Sheets. ** Regeneration progressive This document contains important information and must be read in its entirety. Edition: /5 Previous Edition:
46 PRODUCT INFORMATION LEWATIT S 2568 H Additional Information & Regulations Safety precautions Strong oxidants, e.g. nitric acid, can cause violent reactions if they come into contact with ion exchange resins. Toxicity The safety data sheet must be observed. It contains additional data on product description, transport, storage, handling, safety and ecology. Disposal In the European Community Ion exchange resins have to be disposed, according to the European waste nomenclature which can be accessed on the internet-site of the European Union. Storage It is recommended to store ion exchange resins at temperatures above the freezing point of water under roof in dry conditions without exposure to direct sunlight. If resin should become frozen, it should not be mechanically handled and left to thaw out gradually at ambient temperature. It must be completely thawed before handling or use. No attempt should be made to accelerate the thawing process. This information and our technical advice whether verbal, in writing or by way of trials are given in good faith but without warranty, and this also applies where proprietary rights of third parties are involved. Our advice does not release you from the obligation to check its validity and to test our products as to their suitability for the intended processes and uses. The application, use and processing of our products and the products manufactured by you on the basis of our technical advice are beyond our control and, therefore, entirely your own responsibility. Our products are sold in accordance with the current version of our General Conditions of Sale and Delivery. LANXESS Deutschland GmbH BU LPT D Leverkusen Edition: /5 38
47 Appendix D: The results of validation of equipment s Column 2 Lewatit S2568H with bed height of 5cm Datum : Time Taking T=15 min NH + 4 (mg/l) T=30 min NH + 4 (mg/l) Temperature (ºC) Lab data NH + 4 (mg/l) 11: R.T 11: : R.T : : R.T : : R.T : : R.T : Datum : : R.T : : R.T : : R.T : : R.T : Datum : : R.T : : R.T : : R.T : : R.T : Negative value: under measuring range ( mg/l ammonium) R.T= Room temperature + Table 3.4.1: (5 cm bed height Lewatit S2568H with flow rate of 12L/h, about 0.1 mg/l NH 4 feed water measured by Spectrophotometer Hach-Lang DR 2800 and Vitens lab) 39
48 Date time Parameter laboratory Validated Value 13/1/ :45 Ammonium - mg/l NH Vitens Yes /1/ :45 Ammonium - mg/l NH Vitens Yes /1/ :45 Ammonium - mg/l NH Vitens Yes /1/ :25 Ammonium - mg/l NH Vitens Yes /1/ :45 Ammonium - mg/l NH Vitens Yes 0,035 14/1/ :45 Ammonium - mg/l NH Vitens Yes 0,036 14/1/ :45 Ammonium - mg/l NH Vitens Yes 0,041 14/1/ :45 Ammonium - mg/l NH Vitens Yes /1/ :45 Ammonium - mg/l NH Vitens Yes 0,046 14/1/ :45 Ammonium - mg/l NH Vitens Yes 0,042 15/1/ :45 Ammonium - mg/l NH Vitens Yes 0,069 15/1/ :45 Ammonium - mg/l NH Vitens Yes 0,073 15/1/ :45 Ammonium - mg/l NH Vitens Yes 0,073 15/1/ :45 Ammonium - mg/l NH Vitens Yes 0,073 15/1/ :45 Ammonium - mg/l NH Vitens Yes 0,073 15/1/ :45 Ammonium - mg/l NH Vitens Yes 0,076 + Table 3.5.1: Data of column 4 (5 cm bed height Lewatit S2568H with flow rate of 12L/h, about 0.1 mg/l NH 4 Spectrophotometer Hach-Lang DR 2800 and Vitens lab) feed water measured by 40
49 Date and time Status Value 2015/1/13 12:45 OK /1/13 13:45 OK /1/13 14:45 OK /1/13 15:25 OK /1/14 8:45 OK /1/14 9:45 OK /1/14 10:45 OK /1/14 10:50 OK /1/14 11:45 OK < /1/14 12:45 OK /1/14 13:45 OK /1/15 10:35 OK /1/15 10:45 OK /1/15 10:55 OK /1/15 10:55 OK /1/15 11:45 OK /1/15 12:45 OK /1/15 13:45 OK /1/15 14:45 OK /1/15 14:50 OK Table 3.5.2:Data of column 4 (5 cm bed height Lewatit S2568H with flow rate of 12L/h, about 0.1 mg/l NH 4 ammonium analyzer Applikon Colorimeter and shows in black and blue. feed water measured 41
50 NH4 concentration (mg/l) Appendix E: Measuring reports 5 cm Lewatit S2568H Condition: Feed water = RO permeate with probably 0.1 mg/l ammonium concentration Temperature of feed water= 12 0 C Flow rate =12L/h 0,1 0,09 0,08 0,07 Breakthrough curve 0,06 0,05 0,04 0,03 0,02 0, Time(minutes) breakthrough Exp2 NH4(mg/L) Exp1.NH4(mg/L) Graph 1: Experiment 1 and experiment 2 (5 cm resin with flow rate of 12L/h measured by analyzer Applikon Colorimeter) The ion exchange experiments with resin bed height of 5cm were done twice. Both gave the similar results. The breakthrough curves were expected to be constant at the beginning and sharp later on. In fact, the ammonium concentration already started to increase when the experiment began. A lot of peaks and dips can be recognized. The value of zero ammonium in effluent seems very strange. It looks like the resin was regenerated during the experiment. Thus, it could be considered as measuring error. Despite of these inconsistencies a general trend in ammonium concentration in effluent can be recognized. From the graphics, it can be seen the ammonium concentration was increasing linearly with the effluent volume. A reason for this could be the bed height is too short or the flow rate is too high. 42
51 NH4 concentration (mg/l) 1 cm Clinoptilolite ( mm) Condition: Feed water = RO permeate with probably 0.1 mg/l ammonium concentration Temperature of feed water= 12 0 C Flow rate =12L/h Breakthrough curve of 1 cm clinoptilolite with 12L/h permeate water 0,1 0,09 0,08 0,07 0,06 0,05 0,04 0,03 0,02 0,01 0 NH4 concentration Breakthrough time (minutes) Graph 2: 1cm zeolite with flow rate of 12L/h measured by analyzer Applikon Colorimeter From Graph 2, the beginning concentration of ammonium was 0.07 mg/l. As the permeate inflow was 0.1 mg/l, it could be considered that ion exchange was not complete. That is to say, at the begging, it reached at the breakthrough point. The bed height of zeolite was only 0.01m that was the main reason of 0.07 mg/l ammonium concentration at the start point. Specifically, the graph of ammonium concentration fluctuated between 0.06 mg/l and 0.1 mg/l. Some moment even reached at 0 mg/l. The above breakthrough curve was absolutely different as the usual one. Reason: Due to the shearing strength, the flow rate was different among the middle and the wall of the column. Specifically, the velocity of middle equaled to the inflow rate and should be much higher than the velocity of the column s wall. But in fact, the bed height of zeolie was only 1cm. The bed which contains zeolite has very rough surface. In comparison with that, the column wall is very smooth. Because of this, the water flow rate should be the highest along with the wall and slowest in the zeolite. In case of 1 cm of zeolite bed, water might go through the column too fast without enough contact time with zeolite to perform ion exchange. Therefore, the effluent already reached breakthrough at the beginning. 43
52 NH4 Concentration (mg/l) 10 cm Clinoptilolite ( mm) Condition: Feed water = RO permeate with probably 0.1 mg/l ammonium concentration Temperature of feed water= 12 0 C Flow rate =12L/h Breakthrough curve of 10 cm clinoptilolite with 12L/h permeate water 0,1 0,09 0,08 0,07 0,06 0,05 0,04 0,03 0,02 0,01 0 Permeate breakthrough Effluent volume (L) NH4 Graph 3: 10 cm clinoptilolite at flow rate of 12L/h measured by ammonium analyzer Applikon Colorimeter The Graph 3 shows that at the beginning, the ammonium concentration of effluent had exceeded breakthrough point (0.03 mg/l) and started at 0.06 mg/l, this is due to some not exchanged feed water exited in the pipe. And the ammonium analyzer Applikon Colorimeter directly tested it at first. Besides of this element, the experiment 4 still can reach at breakthrough start point quickly, the zeolite might be consumed very soon and the roughness of zeolite will influence the ion exchange efficiency. 44
53 NH4 concentration (mg/l) 20 cm Clinoptilolite ( mm) Condition: Feed water = RO permeate with probably 0.1 mg/l ammonium concentration Temperature of feed water= 12 0 C Flow rate =12L/h Breakthrough curve of 20 cm clinoptilolite with 12L/h permeate water 0,12 0,1 0,08 Permeate 0,06 0,04 0,02 Column 2 20cm zeolite Column 3 20cm zeolite Breakthrough Effluent volume (L) Graph 4: (20 cm bed height zeolite clinoptilolite with flow rate of 12L/h measured by Spectrophotometer Hach-Lang DR 2800) The samples were checked every 1 hour for the first two hours and then the columns left running overnight. The ammonium concentration was very low at the beginning and started to increase slowly to the breakthrough point. The breakthrough is when the effluent volume is between 150L and 200L. After this, the concentration was increasing faster than before and tending to reach the ammonium concentration of influent. From the tendency, it s been estimated the concentration of 0.1 mg/l will be reached at effluent volume of 400 L. Remark: At t=0 the measured NH4+ concentration in effluent were very close to that in influent. There might be influent left in the tubes where samples were taken. 45
54 1, 10 and 20 cm Clinoptilolite ( mm) in comparison Condition: Feed water = RO permeate with probably 0.1 mg/l ammonium concentration Temperature of feed water= 11 0 C Flow rate =12L/h 0,12 0,1 0,08 Ammonium concentration 0,06 in effluent (mg/l) 0,04 0,02 Breakthrough curve of 1, 10 and 20 cm clinoptilolite with 12L/h permeate water Permeate 1 cm zeolite 10 cm zeolite Column 2 20cm zeolite Column 3 20cm zeolite Breakthrough Effluent volume (L) Graph 5: 1 cm, 10 cm and 20cm zeolite clinoptilolite with flow rate of 12L/h measured by ammonium analyzer Applikon Colorimeter Graph 5 shows breakthrough curve of clinoptilolite at three different bed heights, it can be seen that a higher bed height gives a better ion exchange result. Mainly, the ammonium concentration in effluent won t start at high value that exceeds the breakthrough point. Also, the results provide a good explanation for the assumption that water might leak along with the wall. 46
55 NH4 concentration (mg/l) 10 cm Lewatit S2568H at flow rate of 40L/h Condition: Feed water = RO permeate with average ammonium concentration of mg/l (STD 0.02mg/L) Temperature of feed water= 12.0 o C on average Flow rate =40L/h 0,16 Breakthrough curve of 10cm Lewatit S2568H with 40L/h permeate water 0,14 0,12 y = 9E-21x 6-5E-17x 5 + 8E-14x 4-1E-11x 3-8E-09x 2 + 7E-06x + 0,0062 0,1 0,08 0,06 10cm resin 40L/h Permeate water (average) 0,04 0,02 Breakthrough Effluent volume (L) Graph 6: 10 cm Lewatit S2568H with flow rate of 40L/h measured by ammonium analyzer Applikon Colorimeter 47
56 NH4 concentration(mg/l) 10 cm Lewatit S2568H at flow rate of 60L/h Condition: Feed water = RO permeate with average ammonium concentration of mg/l (STD 0.006mg/L) Temperature of feed water= 12.1 o C on average 0,14 Breakthrough curve of 10cm Lewatit S2568H with 60l/h permeate water 0,12 y = 2E-18x 5-2E-14x 4 + 7E-11x 3-8E-08x 2 + 4E-05x + 0,0086 0,1 0,08 0,06 10cm resin 60L/h 0,04 0,02 Breakthrough Effluent volume(l) Graph 7: 10 cm Lewatit S2568H with flow rate of 60L/h measured by ammonium analyzer Applikon Colorimeter 48
57 NH4 concentration(mg/l) 10 cm Lewatit S2568H at flow rate of 80L/h Condition: Feed water = RO permeate with average ammonium concentration of mg/l (STD 0.006mg/L) Temperature of feed water= 12.0 o C on average 0,14 Breakthrough curve of 10cm Lewatit S2568H with 80L/h permeate water 0,12 0,1 0,08 0,06 10cm resin 80L/h 0,04 0,02 Breakthrough Effluent volume(l) Graph 8: 10 cm Lewatit S2568H with flow rate of 80L/h measured by ammonium analyzer Applikon Colorimeter 49
58 NH4 concentration(mg/l) Breakthrough curve for breakthrough capacity calculation Breakthrough curve of 10cm Lewatit S2568H with 80L/h permeate water 0,05 0,045 0,04 0,035 0,03 0,025 0,02 0,015 0,01 0, cm resin 80L/h y = 1E-11x 3 + 2E-09x 2 Breakthrough + 3E-06x + 0, Effluent volume(l) 50
59 NH4 concentration(mg/l) 10 cm Lewatit S2568H at flow rate of 100L/h Condition: Feed water = RO permeate with ammonium concentration of mg/l (only measured once) Temperature of feed water= 11.9 o C 0,14 Breakthrough curve of 10cm Lewatit S2568H with 100L/h permeate water 0,12 0,1 0,08 0,06 0,04 0,02 y = 3E-08x 2-1E-05x + 0, cm resin 100L/h Permeate water (average) Effluent volume(l) Graph 8: 10 cm Lewatit S2568H with flow rate of 100L/h measured by ammonium analyzer Applikon Colorimeter 51
60 NH4 concentration(mg/l) 20 cm Lewatit S2568H at flow rate of 40L/h Condition: Feed water = RO permeate with average ammonium concentration of mg/l (STD 0.001mg/L) Temperature of feed water= 11.9 o C on average Breakthrough curve of 20cm Lewatit S2568H with 40L/h permeate water 0,16 0,14 0,12 0,1 0,08 0,06 y = 1E-15x 4-2E-12x 3 + 1E-09x 2-2E-06x + 0, cm resin 40L/h permeate water (average) 0,04 0, Effluent volume(l) Graph 9: 20 cm Lewatit S2568H with flow rate of 40L/h measured by ammonium analyzer Applikon Colorimeter 52
61 NH4 concentration(mg/l) 20 cm Lewatit S2568H at flow rate of 60L/h Condition: Feed water = RO permeate with average ammonium concentration of mg/l (STD 0.02mg/L) Temperature of feed water= 11.8 o C on average Breakthrough curve of 20cm Lewatit S2568H with 60L/h permeate water 0,16 0,14 0,12 y = 4E-19x 5-5E-15x 4 + 2E-11x 3-2E-08x 2 + 3E-06x + 0,0132 0,1 0,08 0,06 0,04 Breakthrough 20cm resin 60L/h Permeate water (average) 0, Effluent volume(l) Graph 10: 20 cm Lewatit S2568H with flow rate of 60L/h measured by ammonium analyzer Applikon Colorimeter 53
62 NH4 concentration(mg/l) 20 cm Lewatit S2568H at flow rate of 80L/h Condition: Feed water = RO permeate with average ammonium concentration of mg/l (STD 0.003mg/L) Temperature of feed water= 11.8 o C on average 0,16 0,14 0,12 Breakthrough curve of 20cm Lewatit S2568H with 80L/h permeate water 0,1 y = -2E-18x 5 + 1E-14x 4-3E-11x 3 + 2E-08x 2-4E-06x + 0,0065 0,08 0,06 0,04 0,02 20cm resin 80L/h Breakthrough Permeate water (average) Effluent volume(l) Graph 11: 20 cm Lewatit S2568H with flow rate of 80L/h measured by ammonium analyzer Applikon Colorimeter 54
63 NH4 concentration(mg/l) 20 cm Lewatit S2568H at flow rate of 100L/h Condition: Feed water = RO permeate with average ammonium concentration of mg/l (STD 0.003mg/L) Temperature of feed water= 12.0 o C on average 0,16 Breakthrough curve of 20cm Lewatit S2568H with 100L/h permeate water 0,14 0,12 0,1 0,08 0,06 0,04 0,02 y = 1E-15x 4-3E-12x 3 + 4E-09x 2-2E-06x + 0, cm resin 100L/h Permeate water (average) Breakthrough Effluent volume(l) Graph 12: 20 cm Lewatit S2568H with flow rate of 100L/h measured by ammonium analyzer Applikon Colorimeter 55
64 Appendix F: The design of future treatment plant 56

65 Appendix H: The pressure drop data of Lewatit S2568H 57
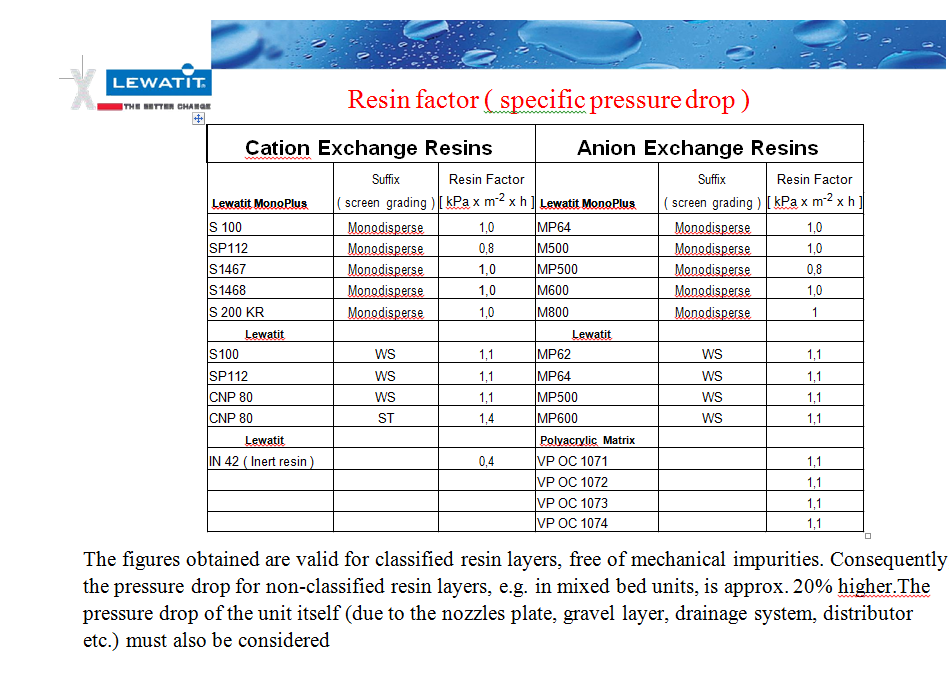
66 58
ION EXCHANGE FOR DUMMIES. An introduction
 ION EXCHANGE FOR DUMMIES An introduction Water Water is a liquid. Water is made of water molecules (formula H 2 O). All natural waters contain some foreign substances, usually in small amounts. The water
Enhanced Organic Precursor Removals Using Aged Filter Media Page 1. Enhanced Organic Precursor Removals Using Aged Filter Media
 Enhanced Organic Precursor Removals Using Aged Media Page 1 Enhanced Organic Precursor Removals Using Aged Media O b j e c t i v e s The main goals of this project was to evaluate the dissolved organic
Ion Exchange Design Hand calculation. Brian Windsor (Purolite International Ltd)
") Ion Exchange Design Hand calculation Brian Windsor (Purolite International Ltd) Introduction Before design programmes were introduced, every engineer had to calculate the design by hand using resin manufacturers
Ion Exchange Design Hand calculation Brian Windsor (Purolite International Ltd) Introduction Before design programmes were introduced, every engineer had to calculate the design by hand using resin manufacturers
ION EXCHANGE RESINS INTRODUCTION
 ION EXANGE RESINS Ion exchange resins are polymers that are capable of exchanging particular ions within the polymer with ions in a solution that is passed through them. This ability is also seen in various
REMOVAL OF PHOSPHATE FROM WASTEWATER USING LOW-COST ADSORBENTS
 International Journal of Engineering Inventions ISSN: 2278-7461, www.ijeijournal.com Volume 1, Issue 7 (October2012) PP: 44-50 REMOVAL OF PHOSPHATE FROM WASTEWATER USING LOW-COST ADSORBENTS Dr. C.R.Ramakrishnaiah
Engineered Media for Removal of Fission Products from Aqueous Streams 14580. Abigail Holmquist, UOP - A Honeywell Company
 Engineered Media for Removal of Fission Products from Aqueous Streams 14580 Abigail Holmquist, UOP - A Honeywell Company ABSTRACT Nuclear fission products from fuel have the potential to be released into
Cadmium Reduction Method Method 8039 0.3 to 30.0 mg/l NO 3 N (HR) Powder Pillows or AccuVac Ampuls
 Powder Pillows or AccuVac Ampuls") Nitrate DOC316.53.01066 Cadmium Reduction Method Method 8039 0.3 to 30.0 mg/l NO 3 N (HR) Powder Pillows or AccuVac Ampuls Scope and application: For water, wastewater and seawater. Test preparation Instrument-specific
Nitrate DOC316.53.01066 Cadmium Reduction Method Method 8039 0.3 to 30.0 mg/l NO 3 N (HR) Powder Pillows or AccuVac Ampuls Scope and application: For water, wastewater and seawater. Test preparation Instrument-specific
Phosphorus, Reactive (Orthophosphate)
") Phosphorus, Reactive (Orthophosphate) DOC316.53.01113 Amino Acid Method 1 Method 8178 0.23 to 30.00 mg/l PO 4 Reagent Solution Scope and application: For water, wastewater and seawater. 1 Adapted from
Phosphorus, Reactive (Orthophosphate) DOC316.53.01113 Amino Acid Method 1 Method 8178 0.23 to 30.00 mg/l PO 4 Reagent Solution Scope and application: For water, wastewater and seawater. 1 Adapted from
SODIUM CATION EXCHANGE (ZEOLITE) WATER SOFTENING PROCESS
 WATER SOFTENING PROCESS") SODIUM CATION EXCHANGE (ZEOLITE) WATER SOFTENING PROCESS A. History The name zeolite comes from the two Greek words zein and lithos which mean boiling stone. It was first applied by Granstedt, a Swedish
SODIUM CATION EXCHANGE (ZEOLITE) WATER SOFTENING PROCESS A. History The name zeolite comes from the two Greek words zein and lithos which mean boiling stone. It was first applied by Granstedt, a Swedish
ph: Measurement and Uses
 ph: Measurement and Uses One of the most important properties of aqueous solutions is the concentration of hydrogen ion. The concentration of H + (or H 3 O + ) affects the solubility of inorganic and organic
q = 6.74x1 =6.74 10-1 mg/l x 3.78x10 L/d = 3.4x10 mg / day a) Single CMFR mg/g C Organic Load = Carbon requirement = 6.74 mg 1000 g C inf = 10 mg/l
 Single CMFR mg/g C Organic Load = Carbon requirement = 6.74 mg 1000 g C inf = 10 mg/l") Example An industrial wastewater contains 10 mg/l chlorophenol, and is going to be treated by carbon adsorption. 90% removal is desired. The wastewater is discharged at a rate of 0.1 MGD. Calculate the
Example An industrial wastewater contains 10 mg/l chlorophenol, and is going to be treated by carbon adsorption. 90% removal is desired. The wastewater is discharged at a rate of 0.1 MGD. Calculate the
C-100E Strong Acid Cation Exchange Resin (For use in water softening applications)
") ION EXCHANGE RESINS C-1E Strong Acid Cation Exchange Resin (For use in water softening applications) Lenntech [email protected] www.lenntech.com Tel. +31-15-61.9. Fax. +31-15-61.6.89 Technical Data PRODUCT
ION EXCHANGE RESINS C-1E Strong Acid Cation Exchange Resin (For use in water softening applications) Lenntech [email protected] www.lenntech.com Tel. +31-15-61.9. Fax. +31-15-61.6.89 Technical Data PRODUCT
Chemistry B11 Chapter 6 Solutions and Colloids
 Chemistry B11 Chapter 6 Solutions and Colloids Solutions: solutions have some properties: 1. The distribution of particles in a solution is uniform. Every part of the solution has exactly the same composition
LAB 5 - PLANT NUTRITION. Chemical Ionic forms Approximate dry Element symbol Atomic weight Absorbed by plants tissue concentration
 LAB 5 PLANT NUTRITION I. General Introduction All living organisms require certain elements for their survival. Plants are known to require carbon (C), hydrogen (H), oxygen (O), nitrogen (N), phosphorus
EPB 311- Strategies for Dealing with Groundwater Treatment Systems Having High Natural Ammonia
 EPB 311- Strategies for Dealing with Groundwater Treatment Systems Having High Natural Ammonia Background The occurrence of ammonia (NH 3 ) in the water source is often associated with pollution due to
How To Remove Ammonium From Water
 Ammonium removal in drinking water using natural zeolite Ammonium removal in drinking water using natural zeolite Projectnumber 11.1577.700 / 30.6419.080 2005 Kiwa N.V. All rights reserved. No part of
Electrical Conductivity of Aqueous Solutions
 Electrical Conductivity of Aqueous Solutions PRE-LAB ASSIGNMENT: Reading: Chapter 4.-4.3 in Brown, LeMay, Bursten & Murphy.. Using Table in this handout, determine which solution has a higher conductivity,.
DEIONIZATION IN A "NUT SHELL"
 Deionized Water (DI) DEIONIZATION IN A "NUT SHELL" City water is passed through dark amber colored, caviar sized plastic beads called cation ion exchange resin. The cation resin is in the hydrogen form
Direct ISE Method Method 8359 10 to 1000 mg/l Na + Sodium ISE
 Sodium DOC316.53.01240 Direct ISE Method Method 8359 10 to 1000 mg/l Na + Sodium ISE Scope and application: For drinking water and process water. Test preparation Instrument-specific information This procedure
ENE 806, Project Report 3 CHEMICAL PRECIPITATION: WATER SOFTENING. Grégoire Seyrig Wenqian Shan
 ENE 806, Project Report 3 CHEMICAL PRECIPITATION: WATER SOFTENING Grégoire Seyrig Wenqian Shan College of Engineering, Michigan State University Spring 2007 ABSTRACT The groundwater with high level initial
Hardness ions also interfere with many chemical processes such as chemical compounding and aqueous cleaners.
 Water Softeners Industrial Water Purification (800) CAL-WATER By Dave Peairs, Cal Water, Technical Director Rev: 06/08/2004 Before any discussion of water softeners, we must first define what hard water
Removing Heavy Metals from Wastewater
 Removing Heavy Metals from Wastewater Engineering Research Center Report David M. Ayres Allen P. Davis Paul M. Gietka August 1994 1 2 Removing Heavy Metals From Wastewater Introduction This manual provides
CHEMICAL PRECIPITATION: WATER SOFTENING
 CHEMICAL PRECIPITATION: WATER SOFTENING Submitted to: Dr. Hashsham Research Complex Engineering Department of Civil and Environmental Engineering Michigan State University East Lansing, MI 4884 Authors
Question Bank Electrolysis
 Question Bank Electrolysis 1. (a) What do you understand by the terms (i) electrolytes (ii) non-electrolytes? (b) Arrange electrolytes and non-electrolytes from the following substances (i) sugar solution
Molecular Models in Biology
 Molecular Models in Biology Objectives: After this lab a student will be able to: 1) Understand the properties of atoms that give rise to bonds. 2) Understand how and why atoms form ions. 3) Model covalent,
DOWEX Resins as Organic Solvent Desiccants
 Product Information DOWEX Resins as Organic Solvent Desiccants DOWEX* ion exchange resins can be used as desiccants for organic solvents, after having been dried to a low moisture level, in a manner similar
Well Water Iron Removal Using Quantum DMI-65 Granular Filter Media
 Well Water Iron Removal Using Quantum DMI-65 Granular Filter Media ASME Research Committee Power Plant and Environmental Chemistry Overland Park, Kansas April 2-4, 2007 Prepared by: W. H. Stroman Primary
6 Reactions in Aqueous Solutions
 6 Reactions in Aqueous Solutions Water is by far the most common medium in which chemical reactions occur naturally. It is not hard to see this: 70% of our body mass is water and about 70% of the surface
Ion Exchange Softening
 Ion Exchange Softening Ion-exchange is used extensively in small water systems and individual homes. Ion-exchange resin, (zeolite) exchanges one ion from the water being treated for another ion that is
Magnesium (II), Sodium (I), Potassium (I), Ammonium (I)
, Sodium (I), Potassium (I), Ammonium (I)") s (The Soluble Group) Magnesium (II), Sodium (I), Potassium (I), Ammonium (I) The salts of the cations of group V, with few exceptions, are quite soluble, this accounts for the fact that there is no common
s (The Soluble Group) Magnesium (II), Sodium (I), Potassium (I), Ammonium (I) The salts of the cations of group V, with few exceptions, are quite soluble, this accounts for the fact that there is no common
Purolite Water Softening Resin Guide By: Chubb Michaud
 Application Notes Water Softening Basics Purolite Water Softening Resin Guide By: Chubb Michaud Water, passing through the atmosphere as snow or rain, picks up carbon dioxide (CO2) and other acid gases
Water Softening for Hardness Removal. Hardness in Water. Methods of Removing Hardness 5/1/15. WTRG18 Water Softening and Hardness
 Water Softening for Removal 1 in Water High concentration of calcium (Ca2+) and magnesium (Mg2+) ions in water cause hardness Generally, water containing more than 100 mg/l of hardness expressed as calcium
General Chemistry II Chapter 20
 1 General Chemistry II Chapter 0 Ionic Equilibria: Principle There are many compounds that appear to be insoluble in aqueous solution (nonelectrolytes). That is, when we add a certain compound to water
Calculating Atoms, Ions, or Molecules Using Moles
 TEKS REVIEW 8B Calculating Atoms, Ions, or Molecules Using Moles TEKS 8B READINESS Use the mole concept to calculate the number of atoms, ions, or molecules in a sample TEKS_TXT of material. Vocabulary
WRITING CHEMICAL FORMULA
 WRITING CHEMICAL FORMULA For ionic compounds, the chemical formula must be worked out. You will no longer have the list of ions in the exam (like at GCSE). Instead you must learn some and work out others.
Separation by Solvent Extraction
 Experiment 3 Separation by Solvent Extraction Objectives To separate a mixture consisting of a carboxylic acid and a neutral compound by using solvent extraction techniques. Introduction Frequently, organic
Measurement by Ion Selective Electrodes
 Measurement by Ion Selective Electrodes Adrian Vazquez May 8, 2012 Why Use Ion Selective Electrodes? Responsive over a wide concentration range Not affected by color or turbidity of sample Rugged and durable
(1) e.g. H hydrogen that has lost 1 electron c. anion - negatively charged atoms that gain electrons 16-2. (1) e.g. HCO 3 bicarbonate anion
 e.g. H hydrogen that has lost 1 electron c. anion - negatively charged atoms that gain electrons 16-2. (1) e.g. HCO 3 bicarbonate anion") GS106 Chemical Bonds and Chemistry of Water c:wou:gs106:sp2002:chem.wpd I. Introduction A. Hierarchy of chemical substances 1. atoms of elements - smallest particles of matter with unique physical and
GS106 Chemical Bonds and Chemistry of Water c:wou:gs106:sp2002:chem.wpd I. Introduction A. Hierarchy of chemical substances 1. atoms of elements - smallest particles of matter with unique physical and
Calculation of Molar Masses. Molar Mass. Solutions. Solutions
 Molar Mass Molar mass = Mass in grams of one mole of any element, numerically equal to its atomic weight Molar mass of molecules can be determined from the chemical formula and molar masses of elements
Periodic Table, Valency and Formula
 Periodic Table, Valency and Formula Origins of the Periodic Table Mendelѐѐv in 1869 proposed that a relationship existed between the chemical properties of elements and their atomic masses. He noticed
Chemistry 51 Chapter 8 TYPES OF SOLUTIONS. A solution is a homogeneous mixture of two substances: a solute and a solvent.
 TYPES OF SOLUTIONS A solution is a homogeneous mixture of two substances: a solute and a solvent. Solute: substance being dissolved; present in lesser amount. Solvent: substance doing the dissolving; present
Continuous process of sodium bicarbonate production by Solvay method
 Continuous process of sodium bicarbonate production by Solvay method Manual to experiment nr 10 Instructor: Dr Tomasz S. Pawłowski 1 Goal of the experiment The goal of the experiment is introduction of
Chapter 17. How are acids different from bases? Acid Physical properties. Base. Explaining the difference in properties of acids and bases
 Chapter 17 Acids and Bases How are acids different from bases? Acid Physical properties Base Physical properties Tastes sour Tastes bitter Feels slippery or slimy Chemical properties Chemical properties
Silica Over-Saturation, Precipitation, Prevention and Remediation In Hot Water Systems Edited By Dave Peairs, Cal Water, Technical Director
 Silica Over-Saturation, Precipitation, Prevention and Remediation In Hot Water Systems Edited By Dave Peairs, Cal Water, Technical Director Background Silica scaling becomes a problem when any hot water
AG 501-X8 and Bio-Rex MSZ 501(D) Mixed Bed Resin Instruction Manual. Bio-Rad Laboratories, 2000 Alfred Nobel Dr., Hercules CA 94547 LIT205 Rev B
 Mixed Bed Resin Instruction Manual. Bio-Rad Laboratories, 2000 Alfred Nobel Dr., Hercules CA 94547 LIT205 Rev B") AG 501-X8 and Bio-Rex MSZ 501(D) Mixed Bed Resin Instruction Manual Bio-Rad Laboratories, 2000 Alfred Nobel Dr., Hercules CA 94547 LIT205 Rev B Introduction Mixed bed resins are used for deionizing water
AG 501-X8 and Bio-Rex MSZ 501(D) Mixed Bed Resin Instruction Manual Bio-Rad Laboratories, 2000 Alfred Nobel Dr., Hercules CA 94547 LIT205 Rev B Introduction Mixed bed resins are used for deionizing water
CHAPTER 10: INTERMOLECULAR FORCES: THE UNIQUENESS OF WATER Problems: 10.2, 10.6,10.15-10.33, 10.35-10.40, 10.56-10.60, 10.101-10.
 CHAPTER 10: INTERMOLECULAR FORCES: THE UNIQUENESS OF WATER Problems: 10.2, 10.6,10.15-10.33, 10.35-10.40, 10.56-10.60, 10.101-10.102 10.1 INTERACTIONS BETWEEN IONS Ion-ion Interactions and Lattice Energy
Topic 4 National Chemistry Summary Notes. Formulae, Equations, Balancing Equations and The Mole
 Topic 4 National Chemistry Summary Notes Formulae, Equations, Balancing Equations and The Mole LI 1 The chemical formula of a covalent molecular compound tells us the number of atoms of each element present
Feasibility study of crystallization process for water softening in a pellet reactor
 International A. H. Mahvi, Journal et al. of Environmental Science & Technology Feasibility study of crystallization... Vol. 1, No. 4, pp. 1-4, Winter 5 Feasibility study of crystallization process for
Anion chromatography using on-line recycled eluents
 Journal of Chromatography A, 1089 (2005) 82 86 Anion chromatography using on-line recycled eluents Takashi Yokoyama, Hitoe Maekubo, Asami Sakai, Michio Zenki Department of Chemistry, Faculty of Science,
CHEMICAL DETERMINATION OF EVERYDAY HOUSEHOLD CHEMICALS
 CHEMICAL DETERMINATION OF EVERYDAY HOUSEHOLD CHEMICALS Purpose: It is important for chemists to be able to determine the composition of unknown chemicals. This can often be done by way of chemical tests.
A meaningful, cost-effective solution for polishing reverse osmosis permeate
 A meaningful, cost-effective solution for polishing reverse osmosis permeate Electrodeionization or EDI, is a continuous and chemicalfree process of removing ionized and ionizable species from the feed
Lab #11: Determination of a Chemical Equilibrium Constant
 Lab #11: Determination of a Chemical Equilibrium Constant Objectives: 1. Determine the equilibrium constant of the formation of the thiocyanatoiron (III) ions. 2. Understand the application of using a
HiPer Ion Exchange Chromatography Teaching Kit
 HiPer Ion Exchange Chromatography Teaching Kit Product Code: HTC001 Number of experiments that can be performed: 5 Duration of Experiment: Protocol: 5-6 hours Storage Instructions: The kit is stable for
Chapter 16: Tests for ions and gases
 The position of hydrogen in the reactivity series Hydrogen, although not a metal, is included in the reactivity series because it, like metals, can be displaced from aqueous solution, only this time the
CHAPTER 7 THE DEHYDRATION AND SWEETENING OF NATURAL GAS
 CHAPTER 7 THE DEHYDRATION AND SWEETENING OF NATURAL GAS Natural gases either from natural production or storage reservoirs contain water, which condense and form solid gas hydrates to block pipeline flow
Wastewater Reuse. Typical treated wastewater is:
 Wastewater Reuse Most metal finishing industries have in-house wastewater treatment to economically dispose of the acids, alkali, oils, and dissolved metals in the rinse water and occasional tank solution
A NOVEL ION-EXCHANGE/ELECTROCHEMICAL TECHNOLOGY FOR THE TREATMENT OF AMMONIA IN WASTEWATER
 A NOVEL ION-EXCHANGE/ELECTROCHEMICAL TECHNOLOGY FOR THE TREATMENT OF AMMONIA IN WASTEWATER ABSTRACT Leonard P. Seed, M.Sc., P.Eng., Enpar Technologies Inc. * Daren D. Yetman, A.Sc.T., Enpar Technologies
Lead Testing and On Site Calibration for Water Testing Detection Range: 2 100ppb
 Document: AND Lead 100 7 2013 Lead Testing and On Site Calibration for Water Testing Detection Range: 2 100ppb July, 2013 Edition 1 ANDalyze, Inc., 2012. All rights reserved. Printed in USA. Table of Contents
Removal of ammonia by natural clay minerals using fixed and fluidised bed column reactors
 Removal of ammonia by natural clay minerals using fixed and fluidised bed column reactors M.S. Çelik*, B. Özdemir*, M. Turan**, I. Koyuncu**, G. Atesok* and H.Z. Sarikaya** * Istanbul Technical University,
Chemistry at Work. How Chemistry is used in the Water Service
 Chemistry at Work How Chemistry is used in the Water Service WATER TREATMENT Everyday, more than 100 water treatment works in Northern Ireland put approximately 680 million litres of water into the supply
USEPA 1 FerroVer Method 2 Method 8008 0.02 to 3.00 mg/l Fe Powder Pillows or AccuVac Ampuls
 Iron, Total DOC316.53.01053 USEPA 1 FerroVer Method 2 Method 8008 0.02 to 3.00 mg/l Fe Powder Pillows or AccuVac Ampuls Scope and application: For water, wastewater and seawater; digestion is required
= 1.038 atm. 760 mm Hg. = 0.989 atm. d. 767 torr = 767 mm Hg. = 1.01 atm
 Chapter 13 Gases 1. Solids and liquids have essentially fixed volumes and are not able to be compressed easily. Gases have volumes that depend on their conditions, and can be compressed or expanded by
Guide to Reverse Phase SpinColumns Chromatography for Sample Prep
 Guide to Reverse Phase SpinColumns Chromatography for Sample Prep www.harvardapparatus.com Contents Introduction...2-3 Modes of Separation...4-6 Spin Column Efficiency...7-8 Fast Protein Analysis...9 Specifications...10
Dimethylglyoxime Method Method 10220 0.1 to 6.0 mg/l Ni TNTplus 856
 Nickel DOC316.53.01065 Dimethylglyoxime Method Method 10220 0.1 to 6.0 mg/l Ni TNTplus 856 Scope and application: For water and wastewater. Test preparation Instrument-specific information Table 1 shows
FerroVer Method 1 Method 10249 0.1 to 3.0, 1.0 to 30.0 and 10.0 to 300.0 mg/l Fe Powder Pillows
 Iron, Total DOC316.53.01314 FerroVer Method 1 Method 10249 0.1 to 3.0, 1.0 to 30.0 and 10.0 to 300.0 mg/l Fe Powder Pillows Scope and application: For oil and gas field waters; digestion is required for
VIPCLEAN Via Goretta 96/A Mappano di Caselle (TO) Tel 011.2207783 Fax 011.2207927 e-mail [email protected]
 Tel 011.2207783 Fax 011.2207927 e-mail info@vipclean.it") INTRODUCTION VIP Clean, acronym of Very Important Purewater, is an exclusive and innovative line dedicated to cleaning systems with pure water. VIP Clean products are been designed and conceived to meet
INTRODUCTION VIP Clean, acronym of Very Important Purewater, is an exclusive and innovative line dedicated to cleaning systems with pure water. VIP Clean products are been designed and conceived to meet
Experiment 16-Acids, Bases and ph
 Definitions acid-an ionic compound that releases or reacts with water to form hydrogen ion (H + ) in aqueous solution. They taste sour and turn litmus red. Acids react with certain metals such as zinc,
6.5 Periodic Variations in Element Properties
 324 Chapter 6 Electronic Structure and Periodic Properties of Elements 6.5 Periodic Variations in Element Properties By the end of this section, you will be able to: Describe and explain the observed trends
ECOAZUR BLUEWATER WATER PURIFICATION PLANTS
 ECOAZUR BLUEWATER WATER PURIFICATION PLANTS CONTACT EcoAzur Calle 11a #492 x 60 y 62 Tel: +52-999-920-1972 Col. Residencial Pensiones Email: [email protected] C.P. 97217 Merida, Yucatan, Mexico Website:
Determining the Quantity of Iron in a Vitamin Tablet. Evaluation copy
 Determining the Quantity of Iron in a Vitamin Tablet Computer 34 As biochemical research becomes more sophisticated, we are learning more about the role of metallic elements in the human body. For example,
7. 1.00 atm = 760 torr = 760 mm Hg = 101.325 kpa = 14.70 psi. = 0.446 atm. = 0.993 atm. = 107 kpa 760 torr 1 atm 760 mm Hg = 790.
 CHATER 3. The atmosphere is a homogeneous mixture (a solution) of gases.. Solids and liquids have essentially fixed volumes and are not able to be compressed easily. have volumes that depend on their conditions,
Solubility Product Constant
 Solubility Product Constant Page 1 In general, when ionic compounds dissolve in water, they go into solution as ions. When the solution becomes saturated with ions, that is, unable to hold any more, the
IB Chemistry. DP Chemistry Review
 DP Chemistry Review Topic 1: Quantitative chemistry 1.1 The mole concept and Avogadro s constant Assessment statement Apply the mole concept to substances. Determine the number of particles and the amount
CHEMISTRY II FINAL EXAM REVIEW
 Name Period CHEMISTRY II FINAL EXAM REVIEW Final Exam: approximately 75 multiple choice questions Ch 12: Stoichiometry Ch 5 & 6: Electron Configurations & Periodic Properties Ch 7 & 8: Bonding Ch 14: Gas
Chapter 6. Solution, Acids and Bases
 Chapter 6 Solution, Acids and Bases Mixtures Two or more substances Heterogeneous- different from place to place Types of heterogeneous mixtures Suspensions- Large particles that eventually settle out
Chapter 8: Chemical Equations and Reactions
 Chapter 8: Chemical Equations and Reactions I. Describing Chemical Reactions A. A chemical reaction is the process by which one or more substances are changed into one or more different substances. A chemical
Understanding ph management and plant nutrition Part 5: Choosing the best fertilizer
 Understanding ph management and plant nutrition Part 5: Choosing the best fertilizer Bill Argo, Ph.D. Blackmore Company, Tel: 800-874-8660, Int l 734-483-8661, E-mail: [email protected] Originally
Electrons in Atoms & Periodic Table Chapter 13 & 14 Assignment & Problem Set
 Electrons in Atoms & Periodic Table Name Warm-Ups (Show your work for credit) Date 1. Date 2. Date 3. Date 4. Date 5. Date 6. Date 7. Date 8. Electrons in Atoms & Periodic Table 2 Study Guide: Things You
Unit 3 Notepack Chapter 7 Chemical Quantities Qualifier for Test
 Unit 3 Notepack Chapter 7 Chemical Quantities Qualifier for Test NAME Section 7.1 The Mole: A Measurement of Matter A. What is a mole? 1. Chemistry is a quantitative science. What does this term mean?
ATOMS. Multiple Choice Questions
 Chapter 3 ATOMS AND MOLECULES Multiple Choice Questions 1. Which of the following correctly represents 360 g of water? (i) 2 moles of H 2 0 (ii) 20 moles of water (iii) 6.022 10 23 molecules of water (iv)
Chapter 16 Acid-Base Equilibria
 Chapter 16 Acid-Base Equilibria Learning goals and key skills: Understand the nature of the hydrated proton, represented as either H + (aq) or H 3 O + (aq) Define and identify Arrhenuis acids and bases.
Chem 1A Exam 2 Review Problems
 Chem 1A Exam 2 Review Problems 1. At 0.967 atm, the height of mercury in a barometer is 0.735 m. If the mercury were replaced with water, what height of water (in meters) would be supported at this pressure?
Chemistry Post-Enrolment Worksheet
 Name: Chemistry Post-Enrolment Worksheet The purpose of this worksheet is to get you to recap some of the fundamental concepts that you studied at GCSE and introduce some of the concepts that will be part
Moles Lab mole. 1 mole = 6.02 x 10²³. This is also known as Avagadro's number Demo amu amu amu
 Moles I. Lab: Rice Counting II. Counting atoms and molecules I. When doing reactions chemists need to count atoms and molecules. The problem of actually counting individual atoms and molecules comes from
Lab 7 Soil ph and Salinity OBJECTIVE INTRODUCTION Soil ph active
 Lab 7 Soil ph and Salinity OBJECTIVE In this lab you will learn the effect of the concentration of hydrogen ions (ph) and various salts on the fertility of a soil. You will perform some tests which are
Experiment 5. Chemical Reactions A + X AX AX A + X A + BX AX + B AZ + BX AX + BZ
 Experiment 5 Chemical Reactions OBJECTIVES 1. To observe the various criteria that are used to indicate that a chemical reaction has occurred. 2. To convert word equations into balanced inorganic chemical
ACUSOL 810A Detergent Grade Rheology Modifier and Stabilizer
 ACUSOL 810A Detergent Grade Rheology Modifier and Stabilizer Description ACUSOL 810A is an Alkali Soluble acrylic polymer Emulsion (ASE). ACUSOL 810A can be directly incorporated into formulations without
RESOURCE Q, 1 ml and 6 ml RESOURCE S, 1 ml and 6 ml
 GE Healthcare Life Sciences Instructions 71-7146-00 AI Ion Exchange Columns RESOURCE Q, 1 ml and 6 ml RESOURCE S, 1 ml and 6 ml Introduction RESOURCE Q and S are pre-packed columns for separating biomolecules
EXPERIMENT 5. Molecular Absorption Spectroscopy: Determination of Iron With 1,10-Phenanthroline
 EXPERIMENT 5 Molecular Absorption Spectroscopy: Determination of Iron With 1,10-Phenanthroline UNKNOWN Submit a clean, labeled 100-mL volumetric flask to the instructor so that your unknown iron solution
CHAPTER 13: SOLUTIONS
 CHAPTER 13: SOLUTIONS Problems: 1-8, 11-15, 20-30, 37-88, 107-110, 131-132 13.2 SOLUTIONS: HOMOGENEOUS MIXTURES solution: homogeneous mixture of substances present as atoms, ions, and/or molecules solute:
Total Suspended Solids Total Dissolved Solids Hardness
 Total Suspended Solids (TSS) are solids in water that can be trapped by a filter. TSS can include a wide variety of material, such as silt, decaying plant and animal matter, industrial wastes, and sewage.
Trace Gas Exchange Measurements with Standard Infrared Analyzers
 Practical Environmental Measurement Methods Trace Gas Exchange Measurements with Standard Infrared Analyzers Last change of document: February 23, 2007 Supervisor: Charles Robert Room no: S 4381 ph: 4352
HS 1003 Part 2 HS 1003 Heavy Metals Test
 HS 1003 Heavy Metals Test 1. Purpose This test method is used to analyse the heavy metal content in an aliquot portion of stabilised hot acetic acid extract by Atomic Absorption Spectroscopy (AAS). Note:
Resin Types and Production. Brian Windsor (Purolite International Ltd)
") Resin Types and Production Brian Windsor (Purolite International Ltd) Properties of an Ion Exchanger Synthetic Ion Exchangers require certain properties to perform demineralisation. The three main properties
Resin Types and Production Brian Windsor (Purolite International Ltd) Properties of an Ion Exchanger Synthetic Ion Exchangers require certain properties to perform demineralisation. The three main properties
Chemistry 52. Reacts with active metals to produce hydrogen gas. Have a slippery, soapy feeling. React with carbonates to produce CO 2
 ACID AND BASE STRENGTH Experiment #2 PURPOSE: 1. To distinguish between acids, bases and neutral substances, by observing their effect on some common indicators. 2. To distinguish between strong and weak
THE NWF WATER PURIFICATION PROCESS FRESH WATER IN A NATURAL WAY. Esko Meloni Ferroplan Oy
 THE NWF WATER PURIFICATION PROCESS FRESH WATER IN A NATURAL WAY Esko Meloni Ferroplan Oy 1 The NWF Water Purification Process: list of contents 1. NWF biological purification of groundwater Iron and manganese
Dissolved Mineral Radioactivity in Drinking Water
 WD-WSEB-3-11 2004 Dissolved Mineral Radioactivity in Drinking Water General New Hampshire's bedrock contains naturally occurring radioactivity. A few examples with health importance include radon, radium
Properties of Acids and Bases
 Lab 22 Properties of Acids and Bases TN Standard 4.2: The student will investigate the characteristics of acids and bases. Have you ever brushed your teeth and then drank a glass of orange juice? What
POLLUTED EMISSION TREATMENTS FROM INCINERATOR GASES
 POLLUTED EMISSION TREATMENTS FROM INCINERATOR GASES Ecole Nationale Supérieure de Chimie Avenue du Général Leclerc, Campus de Beaulieu 35700 Rennes, France Tel 33 (0)2 23 23 80 02 Fax 33 (0)2 23 23 81
Ion Exchange Determination of Na+ by Displacement and Zn 2+ Using Preconcentration. Reading: Harris pp. 641-647, 699
 Ion Exchange Determination of a+ by Displacement and Zn 2+ Using Preconcentration Reading: Harris pp. 641647, 699 Prelab Assignment: 1. The ph of a solution is 4.56. Determine the concentration and use