PAM Prediction Analysis of Microarrays Users guide and manual
|
|
|
- Bryce Stevens
- 10 years ago
- Views:
Transcription
1 PAM Prediction Analysis of Microarrays Users guide and manual Trevor J. Hastie Balasubramanian Narasimhan Robert J. Tibshirani Gilbert Chu Contents 1 PAM User Group Announcement 3 2 Summary of Changes Changes in PAM Changes in PAM Changes in PAM Changes in PAM 1.21a Changes in PAM Changes in PAM Changes in PAM Changes in PAM Changes in PAM Changes in PAM Introduction 5 4 Obtaining PAM 5 Department of Statistics and Department of Health Research & Policy, Stanford University, Stanford CA [email protected]. Department of Statistics and Department of Health Research & Policy, Stanford University, Stanford CA [email protected]. Department of Health Research & Policy and Department of Statistics, Stanford University, Stanford CA [email protected]. Department of Biochemistry, Stanford University, Stanford CA [email protected]. 1

2 5 System Requirements 6 6 Installation New installation Upgrading from Previous Version Uninstalling PAM 7 8 Documentation 7 9 Examples 7 10 Data Formats Batch Labels and Batch Adjustment Normalization of experiments Handling Missing Data 9 12 Running PAM: classification problems Training the Classifier Test Set Prediction Using data in Multiple Sheets Format of the Gene Listing Running PAM: Survival analysis and regression Basic idea of supervised principal components Opening screen Training, Cross-validation and Test Set Prediction Learning competing predictors from expression data Details of the R Excel Connection Frequently Asked Questions General Questions PAM Registration Questions Installation, Uninstallation Questions PAM Usage Questions Technical Details- Classification Details of the centroid shrinkage Choosing the amount of shrinkage Class probabilities and discriminant functions

3 16.4 Relationship to other approaches Technical details- supervised principal components Extracting supervised princapl components Importance scores and a reduced predictor List of Figures 1 Data Format and Highlighting data The PAM Dialog Box The PAM Controller The PAM Controller after training PAM Plots More PAM Plots The PAM Prediction Dialog The PAM Prediction output for Khan data The test error and probability plots for Khan data List of Tables 1 PAM User Group Announcement To foster communication between PAM users and make new announcements, we plan to establish a new Yahoo user group. When the group is active, we ll put a notice in this manual as well as the web site. Stay tuned. 2 Summary of Changes The following are changes since the initial release of PAMR Note that all releases of PAMR for Excel prior to PAM 1.10 were internal releases. 2.1 Changes in PAM 2.0 Thsi is a major new release of PAM. We have implemented the supervised principal components method for analyzing survival and regression outcomes. The old PAM survival method- discretizing the time axis and then applying PAM/classification, was not very effective and is no longer available 3

4 2.2 Changes in PAM 1.23 Bug fix release. Fixed bug in pamr.predict and gene names in the correct order. Fixed bug in nsccv affecting cv folds: balance and number of folds 2.3 Changes in PAM 1.22 Bug fix release. Fixed pamr.to.excel so that it now expects the gene id and gene names in the correct order. Fixed nsccv.r to match R handling of arguments. This resulted in cross validation failing. 2.4 Changes in PAM 1.21a Changed the installer to include a Stanford Tool manager that would manage all Stanford tools. PAM can be activated and deactivated using the menu. Changed pamr.listgenes to fix a typo. This cause problems. 2.5 Changes in PAM 1.21 Fixed nsscv so that unclass is used instead of codes. This used to make PAM bomb in R versions and higher. Changed pamr.listgenes so that it doesn t bomb when significant gene list is of length 1. Reported by Markus Ruschhaupt. Fixed pamr.confusion bug that screwed up individual plots. Long standing request of Rob Gentleman to add a namespace. The excel pamr package always had a namespace, but now Rob Tibshirani is syncing his source as well. 2.6 Changes in PAM 1.20 Added survival analysis capability. Replaced the default missing data imputation algorithm with a faster and more accurate version; the old algorithm is available for reproducibility, but deprecated. Streamlined the installation process to make it more user-friendly: PAM now installs and uninstalls like a standard windows application. Reorganized the controller buttons into more sensible groupings. Versions were internal releases and skipped. 4

5 2.7 Changes in PAM 1.12 Bug fixes, mostly in installation process. 2.8 Changes in PAM 1.10 Fixed batch adjustment bug. New dialogs added and so the PAM GUI interface is a bit different. Added test error and test probability plots. First public release. 2.9 Changes in PAM 1.06 The first stable version that was beta tested internally Changes in PAM 1.05 PAMR now has a companion: an Excel front-end that uses the R DCOM connector. 3 Introduction PAM (Prediction Analysis of Microarrays) is a statistical technique for class prediction from gene expression data using nearest shrunken centroids. It is described in Tibshirani, Hastie, Narasimhan, and Chu (2002). The method of nearest shrunken centroids identifies subsets of genes that best characterize each class. The technique is general and can be used in many other classification problems. It can also be applied to survival analysis problems. PAM Software for the R package (Ihaka and Gentleman, 1996) has been available for some time now. This manual describes the same software adapted to an Excel front-end. Our goal was to produce an environment much like that of the SAM (Tusher, Tibshirani, and Chu, 2001) except with R as the computation engine. A key component that makes this possible is the R DCOM server by Thomas Baier (see The new version PAM 2.0 includes for the first time the supervised principal components method for survival and regression outcomes. This utilizes the R package superpc. One can build gene expression predictors for survival times, and can also compare them to existing clinical predictors like grade, stage etc. 4 Obtaining PAM PAM can be freely downloaded from the url tibs/ PAM. Please note that the Excel front-end is an addition to PAM for R. Therefore, new users must download both the PAM for R package and the PAM for Excel package. 5
 is a statistical technique for class prediction from gene expression data using nearest shrunken centroids.")
6 5 System Requirements PAM for Excel requires: The latest updates for your operating system available from microsoft.com. To prevent any problems, access this and other Microsoft sites using Internet Explorer rather than Netscape. Clicking on the Product Updates link pops up a box that will automate the installation of the latest patches. Beware that several (timeconsuming) reboots are usually needed and you might need administrative privileges to install the patches. It is generally a good idea to update your system for security reasons any way. Microsoft Excel 97 or higher. We recommend that users install appropriate Microsoft Office service packs that are available from Office 97 users are especially encouraged to do so; there are two service packs for Office 97. The Office 97 service packs are not easy to find; one often has to search the Microsoft website to access them. The latest version of R. This is freely available from the web-site org. Use any of the mirrors and download a Windows executable version. The installation is very simple; one has to merely run the setup program. Please note that people have reported some problems with PAM for Excel when multiple versions of R as installed on the same computer. If that is the case with your computer, you might want to uninstall all but the latest version. We have tested this version (1.20) of software with R version on the following platforms: Excel 97 and Windows NT, Excel 2000 and Windows 98, Excel 2000 and Windows ME, Excel 2000 and Windows XP, Excel 2002 and Windows XP. 6 Installation Prior to version 1.20, the installation of PAM for Excel was quite involved. One had to install an R package and follow it up with the installation of the PAM Excel addin. The installation/removal is far simpler now, and will be for future versions. However, those of you who are upgrading from earlier versions of PAM for Excel should follow the instructions below quite carefully to avoid problems. 6.1 New installation If you have not installed PAM for excel before, this section is for you. 6
 reboots are usually needed and you might need administrative privileges to install the patches.")
7 Double click on the pamsetup.exe file and follow the instructions. If all went well, PAM will be automatically available the next time you fire up Excel. 6.2 Upgrading from Previous Version If you had previously installed an older version of PAM for Excel (i.e., a version earlier than 1.20), this section is for you. 1. Fire up Excel and click on the Tools menu. Choose Addins and uncheck the box against the phrase Prediction Analysis for Microarrays or Pam. 2. Use the Control Panel to uninstall PAM software. If you are asked if shared components should be kept and not discarded, elect to keep them as a conservative measure, unless you are really hard-pressed for space. 3. Fire up R. In the command window, type the command: remove.packages("pamr"). This will remove the R package. 4. Double click on pamsetup.exe and follow the instructions. PAM will be automatically loaded the next time you fire up Excel. 7 Uninstalling PAM To uninstall PAM for Excel, choose the Uninstall PAM for Excel item from the Programs menu. 8 Documentation After PAM has been installed, the manual is also available as a PDF file in the subdirectory doc of the PAM installation directory. If you don t already have a PDF reader installed, you can do so from the web-site http: // 9 Examples Some examples of the use of PAM are in the directory C:\Program Files\PAMVB\Examples in the default installation. All the examples contain essentially one dataset, that described in the PNAS paper. They are meant to familiarize the users with the format in which PAM expects the data. We briefly describe the examples below. 7

8 khan This is the data discussed in the PNAS paper (Tibshirani et al., 2002). It contains two sheets, the data on one sheet and prediction data on another. khan-missing The same data as above with some missing values. khan-multi The same data as the first but spread over multiple sheets. This allows one to overcome the limitation of 256 columns in a single worksheet in Excel. khan-multi-missing Same data as the one before with some missing values. survival A dataset with censored survival times. Instructions on using PAM on these examples is discussed in section Data Formats The data should be put in an Excel spreadsheet. The format should be familiar to users of SAM. PAM now handles three kinds of problems: a standard classification problem, survival analysis and regression. Standard Classification Problem PAM requires the training data set to contain Class Labels. Optionally, Sample Labels and Batch Labels can be specified when available. Although sample labels are optional, they are highly recommended for identifying samples in PAM output. These can appear in the first few rows of the data set in any order; all remaining rows have gene expression data, one row per gene. The columns represent the different experimental samples. The first few rows can contain the class labels, sample labels and batch labels, in any order. The last two are optional, but the class labels are required. The data must start at column 3. See the examples for details. The remaining lines contain gene expression measurements one line per gene. We describe the format below. Column 1 This should contain the gene name. It is for the user s reference. Column 2 This should contain the gene ID, for the user s reference. Note that the gene ID column is the column that is linked to the SOURCE website by PAM. Hence a unique identifier (e.g. Clone ID, Accession number, Gene Name/Symbol or LocusLink ID) should be used in this column, if SOURCE web-site gene lookup is desired. 8

9 Remaining Columns These should contain the expression measurements as numbers. Missing expression measurements can be left blank or coded as NA, if desired. (The latter is done easily in a good editor editor or in Excel. In Excel, to change blank fields to NA, choose all columns, pull done the Edit menu, choose Replace and then nothing (Blank) with NA). The expression measurements need not start directly after the label rows. They can start further down. For example, rows 1 and 2 can contain the sample and class labels and row 15 can be the start of the expression data. The intervening rows will be ignored. Survival Analysis and Regression Problems For survival analysis, the data format is the same as above, except that in lieu of Class Labels, one specifies Survival time and Censoring status. Survival times must be real numbers, in any units (days, months etc.); the censoring indicator can be coded as 1=event (e.g. death) and 0=censored), or as uncensored and censored. For regression, one specifies the Outcome. For both suvrival and regression problems, sample labels are not required but highly recommended. If you want to compare the gene expression predictor to other competing predictors, sample labels must be present. Batch labels are optional as before Batch Labels and Batch Adjustment When batch labels are specified, PAM adjusts the data for the estimated batch effect. Specifically, a one-way analysis of variance is carried out for each gene, with batch as the grouping variable. The residuals from this ANOVA are the adjusted data. In other words, each gene is centered to have mean zero within each batch Normalization of experiments Different experimental platforms require different normalizations. Therefore, the user is required to normalize the data from the different experiments (columns) before running PAM. PAM does not do any normalization! For cdna data, centering the columns of the expression matrix (that is, making the columns mean equal to zero) is often sufficient. For oligonucleotide data, a stronger calibration may be necessary: for example, a linear normalization of the data for each experiment versus the row-wise average for all experiments. 11 Handling Missing Data PAM checks for missing values and imputes them if needed. Currently, the only engine that is used is K-Nearest Neighbor. The default set up uses 10 nearest neighbors. Here s is a description of 9

10 how it works. K-Nearest Neighbor In the other (default) option missing values are imputed using a k-nearest neighbor average in gene space (default k = 10): 1. For each gene i having at least one missing value: (a) Let S i be the samples for which gene i has no missing values. (b) find the k nearest neighbors to gene i, using only samples S i to compute the Euclidean distance. When computing the Euclidean distances, other genes may have missing values for some of the samples S i ; the distance is averaged over the nonmissing entries in each comparison. (c) impute the missing sample values in gene i, using the averages of the non-missing entries for the corresponding sample from the k nearest neighbors. 2. If a gene still has missing values after the above steps, impute the missing values using the average (non-missing) expression for that gene. If the number of genes is large, the near-neighbor computations above can take too long. To overcome this, we combine the K-Nearest Neighbor imputation algorithm with a Recursive Two-Means Clustering procedure: 1. If number of genes p is greater than p max (default 1500): (a) Run a two-means clustering algorithm in gene space, to divide the genes into two more homogeneous groups. The distance calculations use averages over nonmissing entries, as do the mean calculations. (b) Form two smaller expression arrays, using the two subsets of genes found in (a). For each of these, recursively repeat step If p is less than p max, impute the missing genes using K-Nearest-Neighbor averaging. This imputation part is actually self-contained and will appear in the near future as a standalone R package. 12 Running PAM: classification problems It is best to familiarize yourself with PAM using the examples provided. We ll assume that you have loaded the data in the example file khan-missing.xls into Excel. Generally, to begin, you highlight an area of the spreadsheet that represents the data by first clicking on the top-left corner and then shift-clicking on the bottom right corner of the rectangle. Then, click on the PAM button in the toolbar. See illustration in figure 1. A dialog form shown in figure 2 now pops up. Several input parameters have to specified. 10


11 11 Figure 1: Data Format and Highlighting data


12 Figure 2: The PAM Dialog Box 12

13 Class Labels Enter the row number that contains the class labels. For the Khan data example we have provided, this is row 2. Sample Labels Sample labels are optional, however, they are highly recommended. They allow one to identify sample predictions in plots and other output. Therefore, it is possible that they may be mandatory in the future. The Khan data example has sample labels in row 1. Batch Labels Batch labels are optional. If specified, they force a batch adjustment. This is useful when combining expression data from different experiments. An example file named khanbatch.xls containing batch labels is distributed with the software. It has batch labels in row 1 class labels in row 3, sample labels in row 2. Imputation Engine One can type in the number of neighbors required for the imputation. The default is 10. Web Link Option PAM can hyperlink worksheet cells to source database. The default is to do no hyperlinking. (Some users of SAM worried that when they clicked things by accident Stanford was snooping their genes! So we chose this default). There are several choices for the criterion to search by, all self-explanatory. Additional Sheets Additional sheets can be specified to overcome the Excel limitation of 256 columns. Control-click to make multiple selections. Click the OK button to do the analysis. After some time a PAM Controller dialog shown in figure 3 pops up. When the PAM Controller is active, all input is directed to it (it is modal!). One can dismiss this dialog any time. When needed it can be resurrected by clicking on the PAM Plot Control menu button in Excel (right next to the PAM Button). If you had any missing data in your spreadsheet, a new worksheet with the same name as the original sheet but suffixed by (Imputed) containing the imputed dataset is added to the workbook. This data can be used in subsequent analyses to save time. If there is no missing data, this worksheet is not added. Note that since PAM adds the (Imputed) suffix to an existing sheet name, it is important that the existing sheet name not be too long. Otherwise, an error will occur. PAM adds three more worksheets to the workbook. The one called PAM Plots will contain plots that can be produced. The sheet named PAM Output will contain the list of significant genes when it is asked for. The remaining sheet called PAM Worksheet (Do Not Edit!) is used for writing intermediate calculations and data used for plotting. The user can inspect this worksheet to see what the values that were computed by R. As the name of the sheet warns, it is not meant to be edited; the columns in this worksheet are linked to plots and changing anything could clobber a plot. One can use the data to generate other plots as needed. Each column in this worksheet has a header field 13


14 that describes the column. Moving the mouse over any header field will provide a more verbose description of what the column was used for. Figure 3: The PAM Controller 12.1 Training the Classifier When the PAM Controller first appears, the only thing one can do is Train the classifier. Just click on the train button and the training should be done. Once the training is done, some other buttons in the controller are enabled and a text field appears for setting the Threshold. See figure 4. Here is an explanation of the controls. Current Threshold is a textbox where one enters a threshold value to use for shrinkage and for prediction. Until this is done, many of the other buttons are disabled. The choice of the threshold is typically made after a judicious examination of training errors and the cross-validation results. Train will train the classifer. This is always the first step. 14

15 Figure 4: The PAM Controller after training 15


16 16 Figure 5: PAM Plots


17 17 Figure 6: More PAM Plots

18 Plot Training Error will plot the training error and place the plot in the PAM Plots sheet. Confusion Matrix button will output a training confusion matrix for a given threshold. The matrix is deposited in the PAM Plots sheet as we decided not to fatten the workbook with yet another additional worksheet. (This means that some of the plots could be obscuring the confusion matrix!) If a threshold has not been entered already, then you are asked to enter one. Cross Validate will do a balanced 10-fold cross validation to enable one to choose a threshold that minimizes classification errors. Plot CV Curves will plot the misclassification errors obtained by cross-validation for various values of the threshold. Plot CV Probabilities will plot classification probabilities for a specified threshold. Plot Centroids will plot the shrunken centroids for a specified threshold. List Genes will list the significant genes in the format described in section Predict Test Set can be used to predict a test set. More on this in section Plot Test Error can be used to plot the prediction errors for a number of values of the threshold. Plot Test Probabilities will plot the class probabilities for each sample in the test set for a specified threshold. Show Prediction will create a worksheet with the prediction confusion matrix, if computable, and a list of actual and predicted class labels along with the prediction probabilities for each class. The last four buttons are used in prediction and are further described in section We emphasize that almost all of the button controls may appear to be enabled or disabled depending on the stage of the analysis. For example, the button Plot CV Probabilities remains disabled until one has performed the cross validation and entered a valid threshold. Please note that one can produce a number of plots and there is the very real problem of screen real estate. Often one plot can get obscured by another. Furthermore, some generated plots usually are more comprehensible when resized. All the interactive capabilities that Excel provides for plots are available to the user. Of course, these can only be exploited when one exits the PAM Controller menu because all events are directed to the controller when it is active. Figures 5 and 6 show some of the plots produced by PAM for the khan data example. 18


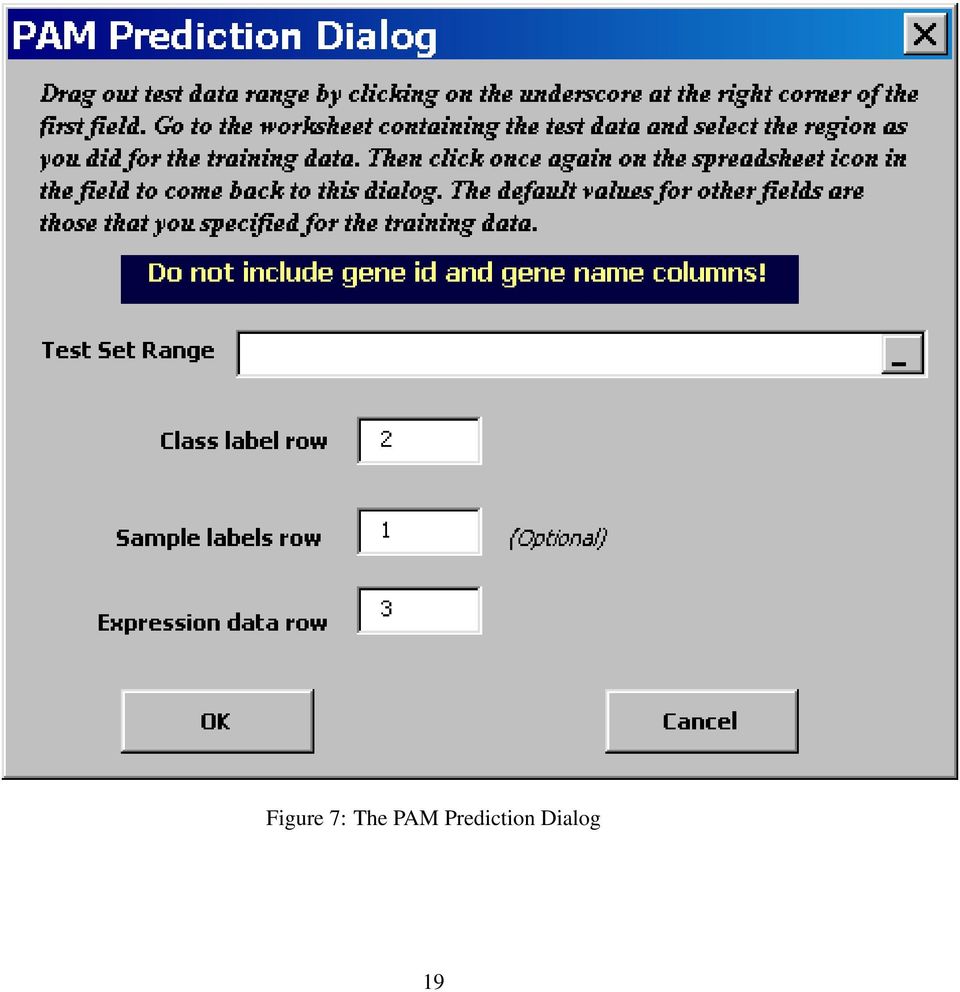
19 Figure 7: The PAM Prediction Dialog 19

20 20 Figure 8: The PAM Prediction output for Khan data


21 21 Figure 9: The test error and probability plots for Khan data
22 12.2 Test Set Prediction Before venturing into prediction, we note that the test data set for prediction is expected to have the same number of genes as the training data set. All or some class labels cells for the test set can be empty but the class labels row must exist! Sample labels are once again optional but recommended so that one can identify the samples in prediction output. If specified, none of them should be empty. To predict class labels for a new test data set, one first clicks on the Predict Test Set button. A new dialog see 7 pops up. To select a test sample, one clicks on the underscore to the right of the Test Set Range field. This has the effect of replacing all other dialogs temporarily with a new one with a spreadsheet icon at the right of the field. You can now navigate through various sheets and select an area for prediction. If you were following along using the example file khanmissing.xls, there is a test data set available in the sheet names Khan Test Data. Click on the cell containing Test1, scroll down to the right corner and then shift click on the right corner of the data set. It is important that the selected area not contain the gene names or ids. After selecting the area, click on the spreadsheet icon and you will get back to the previous dialog. The rows containing class labels, sample labels and start of expression data are by default assumed to be what one specified for the training set. They can be edited or changed depending on your test data set. Clicking on the OK button will prepare PAM for predicting the test set. If all goes well, the buttons in the last row are all enabled. At this point, one can plot the test errors and, if the threshold is set, plot the predicted probabilities for the test set. Clicking on the Show Prediction button produces an output sheet with a detailed summary. If the test data set contained all class labels, a confusion matrix is printed at the top of the sheet. If the test data contains a few missing labels, they are highlighted in red color. See Using data in Multiple Sheets The maximum number of columns one can have in an Excel worksheet is 256 columns (A through IV). If you have more than 256 samples, you can arrange the data in multiple sheets before invoking PAM. For example, consider the situation where you have 5000 genes and 300 samples. Assume you don t have sample labels or batch labels. Per the data format required by PAM, this means that the data set would contain = 302 columns and 5001 rows. The extra two columns contain the gene name and identifier and the top row contains the class labels. One possibility is to put the first 256 columns in one sheet and the remaining 46 in another sheet. Or a 100, 100, 102 split over three, not necessarily contiguous worksheets, is also possible it is your call. Then, highlight the regions in each sheet as usual by clicking on the top-left corner of the rectangle and shift-clicking on the right-bottom corner. Then switch back to the sheet that 22
23 contains the gene names and ids. PAM must be invoked from the sheet that contains the gene names and ids. Failure to do so will result in all kinds of hell breaking loose. The PAM dialog will offer you the option of choosing the additional sheets. Control-click on the sheets that contain the additional data. Proceed as usual after this point. If any of the n input sheets contains missing data, please note that PAM will add n sheets with the prefix (Imputed) Format of the Gene Listing The gene listing has the following format: ID The gene ID specified in the second column selected data rectangle. This is for the user s reference and is linked to the SOURCE website if so desired. Gene Name The gene name specified in the first column selected data rectangle. This is for the user s reference. These columns are followed by the centroid scores for the various classes specified in the data set. 13 Running PAM: Survival analysis and regression We give a briefer description of the survival and regression problems, highlighting the places where they differ from the classification setting Basic idea of supervised principal components Supervised principal components is a generalization of principal components regression. The first (or first few) principal components are the linear combinations of the features that capture the directions of largest variation in a dataset. But these directions may or may not be related to an outcome variable of interest. To find linear combinations that are related to an outcome variable, we compute univariate scores for each gene and then retain only those features whose score exceeds a threshold. A principal components analysis is carried out using only the data from these selected features. Finally, these supervised principal components are used in a regression model to predict the outcome. To summarize, the steps are: 1. Compute (univariate) standard regression coefficients for each feature 23
24 2. Form a reduced data matrix consisting of only those features whose univariate coefficient exceeds a threshold theta in absolute value (theta is estimated by cross-validation) 3. Compute the first (or first few) principal components of the reduced data matrix 4. Use these principal component(s) in a regression model to predict the outcome This idea can be used in standard regression problems with a quantitative outcome, and also in generalized regression problems such as survival analysis. In the latter problem, the regression coefficients in step (1) are obtained from a proportional hazards model. The PAM handles these two cases: standard regression and survival data. There is one more important point: the features (e.g genes) which important in the prediction are not necessarily the ones that passed the screen in step 2. There are other features that may have as high a correlation with the supervised PC predictor. So we compute an importance score for each feature equal to its correlation with the supervised PC predictor. A reduced predictor is formed by soft-thresholding the importance scores, and using these shrunken scores as weights. The soft-thresholding sets the weight of some features to zero, hence throwing them out of the model. The amount of shrinkage is determined by cross-validation. The reduced predictor often performs as well or better than than the supervised PC predictor, and is more interpretable. Thus the user should think of the analysis in two distinct stages. In the first stage, a threshold is chosen, yielding a supervised principal component predictor which is fit to test data. Note that this predictor has non-zero importance scores (loadings) for all genes. In the second stage, a shrinkage parameter is chosen, to reduce the number of genes with non-zero loadings. This reduced predictor is the fit to test data. Hopefully, it will perform as well as the full predictor and will use far fewer genes. This two-stage view provides a useful way to consider the results from a microarray analysis. First it looks for a global predictor than captures the overall prediction information in the genes. Then it looks for a subset of genes that show the strongest correlation with this overall predictor. This process separates out the discrete feature selection step, and acknowledges that there may be many different gene sets that produce similar models over the data. To summarize: Steps in a typical supervised PC analysis 1. Training: compute Cox survival scores for each gene 2. Cross-validation: use cross-validation to estimate best score threshold 3. Testing: use this threshold to construct the supervised PC predictor and apply it to predict test data. Examine survival curves for the discretized predictor and the output from multivariate model. 4. As a second stage, seek a reduced model by soft-thresholding the loadings. Form the resulting reduced supervised PC predictor and see how well it predicts. 24
25 13.2 Opening screen For survival analysis problems, you are asked for Survival Time and Censoring Status instead of Class Labels. For regression analysis problems, you will be asked for the Outcome variable. Sample labels are not required in general, but are required if a comparison to competing predictors is desired (details below) 13.3 Training, Cross-validation and Test Set Prediction Here is an explanation of the controls. Current Threshold is a textbox where one enters a threshold value to use for shrinkage and for prediction. Until this is done, many of the other buttons are disabled. For survival or regression, this is the threshold for the univariate score that correlates each gene with the outcome. Specifically- the Score statistics from the proportional hazards model for survival data, and the standardized regression coefficient for regression problems. The choice of the threshold is typically made after a judicious examination of training errors and the cross-validation results. Train will train the classifer. This is always the first step. Plot Training Error will plot the log-likelihood ratio statistic from the proportional hazards or linear regression supervised principal components fit, and place the plot in the PAM Plots sheet. Note that high values are better, in contrast to misclassification error. List Gene scores will list the significant genes. The format is geneid, genename, importance score- the loading of each gene on the supervised principal component, and the raw scorethe univariate score of each gene with the outcome. Princ comp number of gene scores is where the user must choose which of the first 3 supervised principal components (1,2 or 3) is to be used to compute gene important scores. The scores are the loadings (inner products) of each gene with the supervised principal component. Decorrelate with competing allows the user to first decorrelate the expression data from competing predictors (such as clinical stage, grade etc), before training the model. This encourages the procedure to find a gene expression-based predictor that is independent of the competing predictors. The training data for competing predictors are entered in a separate spreadsheet, with the format shown on the Get competing predictors Dialog Box. An example is given in the survival workbook. Note that predictor names must contain only letters and digits, with no spaces. In the Test set prediction menu, Decorrelate with competing decorrelates the test set expression data from the test set competing-predictor data. 25
26 Fit with competing allows the user to compare the gene expression-based predictor to competing predictors (such as clinical stage, grade etc) on test data. The test data for the competing predictors are entered into a separate spreadsheet, with the format shown in the Input Competing Predictors Dialog Box. An example is given in the survival workbook. Note that predictor names must contain only letters and digits, with no spaces. The user can choose Fit with competing, whether or not they have decorrelated the expression data before training. If they have decorrelated the training data, the will be reminded to also decorrelate the test data, before proceeding with test set predictions. Cross Validate will do two balanced 3-fold cross validations to enable one to choose a threshold that maximizes the log-likelihood ratio statistic. The two cross-validations are then combined. Plot CV Curves will plot the log-likelihood ratio statistic. obtained by cross-validation for various values of the threshold. Seek reduced model applies soft-thresholding of various shrinkage amounts to the gene loadings, to yield predictors that use a subset of the genes. Plot reduced model will plot the log-likelihood ratio statistic. obtained by cross-validation for various values of the shrinkage parameter. The threshold is fixed a teh value entred in the threshold box. Predict Test Set can be used to predict a test set. More on this in section Plot Test Error can be used to plot the prediction errors (log-likelihood ratio statistic) for a number of values of the threshold. Response Prediction plot creates a plot and summary for the predictive model. For survival analysis, these are Kaplan-Meier curves for the categorized predictor, discretized at the appropriate percentiles of the training data. For regression, this is a plot of predicted vs actual values. Note that for survival test data, the cutpoints from the training set are used in the test data. When the number principal components is bigger than 1, the results for individual components are shown, as well as the combined predictor that uses a weighted average of all components (weights determined by the predictive model fit to the training data) Output Prediction info Output the predicted value for each test sample, and summaries of the proportional hazards or regression models that have been fit to test data. Shrinkage value This Box allows the user to define a shrinkage value for soft-thresholding the gene loadings. This produces a model that uses fewer genes. This reduced model is then used if any of the Plot Test Error, Response Prediction plot or Output 26
27 Prediction info buttons are pressed. The results, including the number of genes in the reduced model, are listed in the prediction worksheet. Number of Survival Classes setting indicates how many survival classes (2, 3, or 4) are to be used in discreting the supervised PC predictor for the Response Prediction plot. Number of Principal components setting indicates how many supervised principal components (1,2 or 3) are to be used in the predictive models Learning competing predictors from expression data Since traditional clinical predictors like stage, grade and blood pressure are often powerful and useful, it is of interest to ask whether they can be learned from expression data. That is whether a gene expression-based model can accurately predict them. The PAM package has all of the tools needed to do this. For categorical competing predictor (eg. stage), one would run PAM in classification mode, with the competing predictor as the class label. For a quantatitive competing predictor (like blood prressure), one would run PAM in regression mode. Finally the predicted stage and blood pressure can be used as competing predictors in PAM, in for example, a model to predict patient survival. We have only briefly experimented with this idea, but it does seem to have potential. 14 Details of the R Excel Connection A forthcoming document will provide more details on how to build applications using the R DCOM server. 15 Frequently Asked Questions 15.1 General Questions 1. How is PAM licensed? PAM is distributed under the GNU Public License Is there a version of PAM that works on Macintosh computers? We have not tried it on Macintoshes. We know that SAM works on a Windows emulator on Macs such as Virtual PC from Connectix Corporation. So the same is probably true for PAM. Let us know if it does and we ll update this answer. 27
28 15.2 PAM Registration Questions 1. I registered for PAM and I have still not received an confirming my registration. This is most likely due to your server being down. Hundreds of requests have been successfully sent out to people. Our registration server tries every hour to r the pending requests. If you do not receive your registration user-id and password within the day, you may always register again and use another address that works Installation, Uninstallation Questions 1. How do I uninstall PAM? With the current and future versions, the uninstallation process is very simple. Click on Start, then Programs and choose Uninstall PAM for Excel from the menu. With versions of PAM prior to 1.20, the process is more involved. One pretty much reverses the steps in the install process. However, please make sure you do it in the following order. (a) First you must unlink PAM from the list of Addins loaded into Excel. The list of addins is available by choosing the Addins item from the Tools menu. (b) PAM can be uninstalled via the Control Panel. Double Click Add/Remove Programs and double click on Prediction Analysis of Microarrays. (c) To be complete, you should also uninstall the PAM for R package by typing in an R command window remove.packages("pamr"). 2. How do I install a newly released version of PAM? Do I just install it on top of the old version? Installing new software on top of old versions is a good way to hose your Windows machine. If you want to preserve the little sanity that Windows has, you must first uninstall the old version and then install the new version. 3. When I install PAM, I get an error that a library was not registered. However, at the end, the program says that the installation was successful. Does this mean that PAM is installed correctly? No! Anytime an error occurs, it means that PAM is not installed properly. The problem must be fixed before you can rely on PAM working for you. This often happens when the prerequisites are not met. See section I am using office 97. Where can I download the Service packs for it? 28
29 The last time we looked, it was at the following URL: com/downloads/9798/sr2off97detail.aspx. If you don t find it there, search for the words office97 service release at the web-site http: //office.microsoft.com. Beware these things keep being moved around! 15.4 PAM Usage Questions 1. PAM generates an error saying that it could not start the R server. What can I do? For, versions prior to 1.20: Please make sure you have installed R! Please make sure you have installed the R package pamr! Remember that PAM for Excel is a front-end to PAM for R and so the latter is needed. For versions 1.20 and higher, this is probably a bug. 2. PAM generates an error when I run it on my dataset. What should I do? The Excel R DCOM connection is quite brittle and is easily broken. In general, DCOM errors can be hard to debug. Please make sure that your data is formatted exactly as described in section 10. Particular attention needs to be paid to the class labels, sample labels or batch labels as described in section 12. It is easy to misspecify these rows. For prediction, it is imperative that you not include the gene id and gene names columns they are implicit. Please make sure that you have chosen your data area appropriately as discussed in 12. It is easy to highlight the wrong area or accidentally highlight unwanted cells. Have you installed several versions of R? We ve seen some problems in such situations. 3. My plots are no longer interactive. Help! When the PAM controller is active, all input is directed to it. To get interaction with plots, exit the PAM Controller and click on the plot you want to interact with. 4. PAM generates an error saying that an illegal name was specified for a sheet. Does your workbook have long names for worksheets? You might want to change such names to shorter ones. There is a limit on the length of names for worksheets. The current version is not very intelligent about naming sheets and it will be improved in subsequent versions. 29
30 5. PAM generated an error. Now when I get back into Excel, I have several PAM buttons. Help! This is an annoying bug that we doubt we can ever fix satisfactorily. For versions below 1.20, fire Excel up again uncheck the PAM Excel addin. Quit excel. Then bring up Excel again and check the addin. That should take care of the problem. For version 1.20 or higher, just fire up Excel, exit and fire it up again. The multiple buttons will go away. 6. PAM gave an error message: The R server said this: There is no package called pamr. This can only happen with versions below You did not install the PAM for R package. We suggest upgrading to version 1.20 as outlined in section How come probabilities don t add to 1 in the PAM Worksheet? They do. Excel has the bad habit of rounding numbers for presentation purposes. Thus 0.91 can appear as 1 if there isn t enough space to display two digits. Select the cell containing the value and you can see the actual number. 8. I get pound signs (#) where I expect numbers. Why? Excel will display pound signs in cells where it cannot fit the actual values. Just enlarge the cell width and you should see the values. 9. How do I interpret the probablity plots? Suppose you have three classes A, B and C. For each sample, three numbers plottted: the prediction probability for class A, that for class B and for class C. Thus for a single sample, three y values will be shown in different colors. The predicted class is the class corresponding to the highest probability. We also order the probability plot so that there would be three panels for the three-class example. The panels are usually labelled. When doing prediction, an extra panel is added, containing those samples for which no class labels were specified. This panel is labelled Unspecified. 10. How large a dataset can PAM handle? There is really no hard limit per se in PAM. Excel itself has some limit on the number of rows and columns it can handle. There are additional overheads involved in marshalling the data between Excel and the core of PAM. Therefore, the practical limit is lower. In general, the more memory you have, the larger problems you can handle. 30
31 11. How do I know what PAM is doing? Why don t I see a Progress Bar? At this point, there is no mechanism to show progress when one is deep in R computation. This should be possible in the near future though, given some new developments. For now, until the computation ends, successfully or in error, one has to simply wait. 12. This document does not answer my questions. Where should I look? As we get asked new questions, we update this list of frequently asked questions with answers. Please visit the url tibs/pam where you may find further information. 13. Where is the PAM manual? It should be located in C:\Program Files\PAMVB\doc in the default installation. If you used a different directory, then it should be in the analogous place. In the worst case, search for the file pam.pdf. 14. Where are the examples? They should be located in the C:\Program Files\PAMVB\Examples in the default installation. If you used a different directory, then it should be in the analogous place. In the worst case, search for the file khan.xls. 15. What does the gene hyperlink lookup do? Does it mean that my identified genes are snooped by Stanford? The web lookup facility is provided merely a convenience. By default, it is off. One doesn t have to use it. Please remember that all websites have logs and surely your query gets recorded somewhere. But as to what happens to it, we cannot answer as we have really no affiliation with that site. So the bottom line is that if you are really concerned, you should just refrain from using that feature. 16. Where can I go for help if I just cannot get PAM to work? We are very interested in making PAM work for all users. However, before reporting problems or bugs, we d really like you to make sure that the problem is really with PAM. The following checklist should help. Please make sure you have installed all the prerequisites. See section 5. If the problem is with PAM usage, please make sure that you have formatted your data exactly as mentioned in the PAM manual. 31
32 If you are having problem on a particular type of data, please make sure that you have formatted the response labels appropriately and have chosen the correct applicable data type. If you still cannot get PAM to work, send to [email protected] with complete details including (a) The error message (b) The system you are using (Windows 95, Windows 98, Windows ME, Windows NT or Windows 2000) (c) Whether you have installed all the prerequisites mentioned in the PAM manual. (d) The dataset you used that generated the error. 16 Technical Details- Classification 16.1 Details of the centroid shrinkage Let x ij be the expression for genes i = 1, 2,... p and samples j = 1, 2,... n. We have classes 1, 2,... K, and let C k be indices of the n k samples in class k. The ith component of the centroid for class k is x ik = j C k x ij /n k, the mean expression value in class k for gene i; the ith component of the overall centroid is x i = n j=1 x ij/n. In words, we shrink the class centroids towards the overall centroids. However, we first normalize by the within class-standard deviation for each gene. Let where s i is the pooled within-class standard deviation for gene i: d ik = x ik x i m k s i, (16.1) s 2 i = 1 (x ij x ik ) 2. (16.2) n K i C k k and m k = 1/n k 1/n makes the denominator equal to the standard error of the numerator in d ik. Thus d ik is a t-statistic for gene i, comparing class k to the other classes. One important detail in the denominator of the statistics d ik in (16.1) we add (the same) positive constant s 0 to each of the s i values. This guards against the possibility of large d ik values arising by chance, from genes at very low expression levels. We set s 0 equal to the median value s i over the set of genes. A similar strategy was used in the SAM methodology of Tusher, Tibshirani, and Chu (2001), although instead of the median it chooses the quantile of the s i values in an 32
33 adaptive fashion. For this reason in the two-class case, the genes scores in SAM and PAM can differ a little. We can write x ik = x i + m k s i d ik (16.3) Our proposal shrinks each d ik towards zero, giving d ik and new shrunken centroids or prototypes x ik = x i + m k s i d ik (16.4) The shrinkage we use is called soft-thresholding: each d ik is reduced by an amount in absolute value, and is set to zero if its absolute value is less than zero. Algebraically, this is expressed as d ik = sign(d ik )( d ik ) + (16.5) where + means positive part (t + = t if t > 0, and zero otherwise). Since many of the x ik will be noisy and close to the overall mean x i, soft-thresholding produces better (more reliable) estimates of the true means (Donoho and Johnstone, 1994a; Tibshirani, 1996). It has the nice property that many of the components (genes) are eliminated as far as class prediction is concerned, if the shrinkage parameter is large enough. Specifically if for a gene i, d ik is shrunken to zero for all classes k, then the centroid for gene i is x i, the same for all classes. Thus gene i does not contribute to the nearest centroid computation. We choose by cross-validation. Note that the standardization by s i above has the effect of giving higher weight to genes whose expression is stable within samples of the same class. This same standardization is inherent in other common statistical methods, such as linear discriminant analysis (see section 16.4) Choosing the amount of shrinkage The Plotcv button plots cross-validation error as the shrinkage parameter is varied. Shown along the top of the plot is the number of genes retained (for the training data) at that particular threshold. We use balanced 10-fold cross-validation, ensuring that the classes were distributed evenly among the 10 folds. From this we choose a threshold value to select a list of genes. The Plot centroids button plots the shrunken differences d ik for only the genes having at least one non-zero difference Class probabilities and discriminant functions We classify test samples to the closest shrunken centroid, again standardizing by s i. We also make a correction for the relative abundance of members of each class. 33
34 Suppose we have a test sample (vector) with expression levels x = (x 1, x 2,... x p). We define the discriminant score for class k δ k (x ) = p i=1 (x i x ik )2 s 2 i 2 log π k (16.6) The first part of (16.6) is simply the standardized squared distance of x to the kth shrunken centroid. The second part is a correction based on the class prior probability π k, where K k=1 π k = 1. This prior gives the overall proportion of class k in the population. The classification rule is then C(x ) = l if δ l (x ) = min k δ k (x ) (16.7) If the smallest distances are close and hence ambiguous, the prior correction gives a preference for larger classes, since they potentially account for more errors. We usually estimate the π k by the sample priors ˆπ k = n k /n. If the sample prior is not representative of the population, then more realistic priors can be used instead, or even uniform priors π k = 1/K. We can use the discriminant scores to construct estimates of the class probabilities, by analogy to Gaussian linear discriminant analysis: ˆp k (x ) = e 1 2 δ k(x ) K l=1 e 1 2 δ l(x ) (16.8) The Plot CV Probs button displays these probabilities, for each sample, for each class. At each ascissa value, the class probabilities for a given sample are plotted. The Predict Test Set button computes these probabilities for a test set Relationship to other approaches The discriminant scores (16.6) are similar to those used in linear discriminant analysis (LDA), which arise from using the Mahalanobis metric in computing distance to centroids: δ LDA k (x ) = (x x k ) T W 1 (x x k ) 2 log π k. (16.9) Here we are using a vector notation, and W is the pooled, within-class covariance matrix. With thousands of genes and tens of samples (p n), W is huge and any sample estimate will be singular (and hence its inverse is undefined) Our scores can be seen to be a heavily restricted form of LDA, necessary to cope with the large number of variables (genes). The differences are that we assume a diagonal within-class covariance matrix for W ; without this LDA would be ill-conditioned and fail. we use shrunken centroids rather than centroids as a prototype for each class. 34
35 as the shrinkage parameter increases, an increasing number of genes will have all their d ik = 0, k = 1,..., K due to the soft-thresholding in (16.5). Such genes contribute no discriminatory information in (16.6), and in fact cancel in (16.8) Both our scores (16.6) and (16.9) are effectively linear in the x i. If we expand the square in (16.6), discard the terms involving x i 2 (since they are independent of the class index k and hence do not contribute towards class discrimination), and multiply by 2, we get δ k (x ) = p i=1 x i x ik s 2 i 1 2 p i=1 x 2 ik + log π s 2 k, (16.10) i which is linear in the x i. Because of the sign change, our rule classifies to the largest δ k (x ). Likewise the LDA discriminant scores have the equivalent linear form δ LDA k (x ) = x T W 1 x k 1 2 x kt W 1 x k + log π k (16.11) Both Golub et al. (1999) and Hedenfalk et al. (2001) present linear scoring procedures for the two-class problem, which are very similar to each other, and also similar to our procedure and hence LDA in the two-class case. Both methods essentially work by 1. selecting a set of genes based on a two-sample t-statistic, and then 2. forming a linear classifier in the selected x i using these t-statistics as weights. We describe each in turn, using our own re-expression and terminology, but remaining faithful to the original in each case. Hedenfalk et al. (2001) use a standard t-test at level α to select differentially expressed genes in two breast cancer types. They then construct a compound covariate class predictor, which they threshold to classify a sample into one of the two classes. Their compound covariate is h(x ) = t i x i (16.12) i S(α) where x is the gene expression vector for the sample to be classified, t j is the t-statistic for comparing the two classes in the training data at level-α, and S(α) is the subset of genes with a significant t-statistic at level α. They use as a threshold the same compound formala applied to ( x 1 + x 2 )/2. Now t i = x i1 x i2, (16.13) 1 s i n n 2 35
36 where s i is the pooled within-class standard deviation for gene i as before, and hence (ignoring constants in n 1 and n 2 ) H(x ) = h(x ) h( x 1 + x 2 ) 2 = ( x i1 x i2 )x i s i i S(α) i S(α) ( x i1 x i2 ) ( x i1 + x i2 ) s i 2 (16.14) They classify to class 1 if H(x ) > 0, else to class 2. Golub et al. (1999) use a very similar procedure. They screen the genes using the absolute value of a correlation measure ρ i = x i1 x i2 s i1 + s i2, (16.15) where s i1 and s i2 are the class-1 and class-2 standard deviations for gene i. This is very similar to a t-statistic, using a somewhat unorthodox estimate of the common standard deviation. They then form a weighted vote, which amounts to using the linear function G(x ) = i S(m) = i S(m) ρ i (x i x i1 + x i2 ) 2 ( x i1 x i2 )x i s i1 + s i2 i S(m) ( x i1 x i2 ) ( x i1 + x i2 ) s i1 + s i2 2 (16.16) Again, if G(x ) > 0, we assign to class 1, else class 2. The actual screening procedure used by Golub et al. (1999) is fairly complex, and depends on a parameter m (the number of genes retained per class); m is determined by cross-validation. We can re-express our linear discriminant scores for the two class case. Rather than picking the maximum of δ 1 (x ) and δ 2 (x ), we can form the difference and threshold at zero. These differences, after a little manipulation, can be seen to be l(x ) = δ 1 (x ) δ 2 (x ) = ( x i1 x i2)x i s 2 i i S( ) i S( ) ( x i1 x i2) ( x i1 + x i2) + log π 1 s 2 i 2 π 2 (16.17) The sums are over the set S( ) of genes remaining after soft-thresholding. Here it is clear that if both genes are shrunk to the overall mean, they drop out of the sum. The procedures are similar in form but differ in the details. 36
37 The LDA score uses a pooled variance s 2 i in the denominator, whereas the other two use standard deviations. The variance is the natural quantity to use since it arises from the squared standardized distance. The selection methods are different. Both Golub et al. (1999) and Hedenfalk et al. (2001) use hard thresholding of the t-statistics as the basis of selection (hard thresholding selects only those genes whose t-statistics falls above a threshold). Our selection is based on soft thresholding of t-statistics. Soft thresholding is known to perform better in other settings, see e.g. Donoho and Johnstone (1994b). We use cross-validation to select, and Golub et al. (1999) use it to select their m. We could not determine whether Hedenfalk et al. (2001) use cross-validation to select α (it would be reasonable to do so). Our procedure can adjust the classification according to the class prior probabilities. Our procedure produces probabilities (16.8) for each of the classes. Our nearest prototype procedure works for more than two classes. With more than two classes, nearest shrunken centroids soft-thresholds all of the differences between the class centroids and the overall centroid. In the process, it chooses different sets of genes for characterizing each class. We saw in Section 16.3 that our nearest prototype scores (16.6) are a restricted form of the LDA scores (16.9) δk LDA (x ) = (x x k ) T W 1 (x x k ). Since p n, the within-class covariance W is singular, and so this solution is undefined. Nearest shrunken centroids makes W diagonal which solves the singularity problem; in addition it shrinks the x k. 17 Technical details- supervised principal components The main references for this technique are Bair and Tibshirani (2004) and Bair et al. (2004) Extracting supervised princapl components We assume there are p features measured on N observations (e.g. patients). Let X be an N p matrix of feature measurements (e.g. genes), and y the N-vector of outcome measurements. We assume that the outcome is a quantitative variable; below we discuss other types of outcomes such as censored survival times. Here in a nutshell is the supervised principal component proposal: 37
38 Supervised principal components 1. Compute (univariate) standard regression coefficients for each feature 2. Form a reduced data matrix consisting of only those features whose univariate coefficient exceeds a threshold θ in absolute value (θ is estimated by cross-validation) 3. Compute the first (or first few) principal components of the reduced data matrix 4. Use these principal component(s) in a regression model to predict the outcome We now give details of the method. Assume that the columns of X (variables) have been centered to have mean zero. Write the singular value decomposition of X as X = UDV T (17.1) where U, D, V are N m, m m and m p respectively, and m = min(n 1, p) is the rank of X. D is a diagonal matrix containing the singular values d j ; the columns of U are the principal components u 1, u 2,... u m ; these are assumed to be ordered so that d 1 d 2... d m 0. Let s be the p-vector of standardized regression coefficients for measuring the univariate effect of each gene separately on y: with x j = s j = xt j y x j, (17.2) x T j x j. Actually, a scale estimate ˆσ is missing in each of the s j, but since it is common to all, we can omit it. Let C θ be the collection of indices such that s j > θ. We denote by X θ the matrix consisting of the columns of X corresponding to C θ. The SVD of X θ is X θ = U θ D θ V T θ (17.3) Letting U θ = (u θ,1, u θ,2,... u θ,m ), we call u θ,1 the first supervised principal component of X, and so on. We now fit a univariate linear regression model with response y and predictor u θ,1, ŷ spc,θ = ȳ + ˆγ u θ,1. (17.4) Note that since u θ,1 is a left singular vector of X θ, it has mean zero and unit norm. Hence ˆγ = u T θ,1 y, and the intercept is ȳ, the mean of y (expanded here as a vector of such means). We use cross-validation of the log-likelihood (or log partial-likelihood) ratio statistic to estimate the best value of θ. 38
39 Note that from (17.3), U θ = X θ V θ D 1 θ = X θ W θ. (17.5) So, for example, u θ,1 is a linear combination of the columns of X θ : u θ,1 = X θ w θ,1. Hence our linear regression model estimate can be viewed as a restricted linear model estimate using all the predictors in X θ : ŷ spc,θ = ȳ + ˆγ X θ w θ,1 (17.6) = ȳ + X θ ˆβθ, (17.7) where ˆβ θ = ˆγw θ,1. In fact, by padding w θ,1 with zeros (corresponding to the genes excluded by C θ ), our estimate is linear in all p genes. Given a test feature vector x, we can make predictions from our regression model as follows: 1. We center each component of x using the means we derived on the training data: x j x j x j. 2. ŷ = ȳ + ˆγ x θt w θ,1 = ȳ + x θt ˆβθ, where x θ is the appropriate sub-vector of x. In the case of uncorrelated predictors, it is easy to verify that the supervised principal components procedure has the desired behavior: it yields all predictors whose standardized univariate coefficients exceed θ in absolute value. Our proposal is also applicable to generalized regression settings, for example survival data, classification problems, or data typically analyzed by a generalized linear model. In these cases we use a score statistic in place of the standardized regression coefficients in (17.2) and use a proportional hazards or appropriate generalized regression in (17.4). Let l j (β) be the loglikelihood or partial likelihood relating the data for a single predictor X j and the outcome y, and let U j (β 0 ) = dl/dβ β=β0, I j (β 0 ) = d 2 l j /dβ 2 β=β0. Then the score statistic for predictor j has the form s j = U j(0) 2 I j (0). (17.8) Of course for the Gaussian log-likelihood, this quantity is equivalent to the standardized regression coefficient (17.2). 39
40 17.2 Importance scores and a reduced predictor Having derived the predictor u θ,1, how do we assess the contributions of the p individual features? We compute the importance score as the inner product between each centered feature that has been selected and u θ,1 : imp j = (x j x j ) T, u θ,1 ) (17.9) This is proportional to the loading for that gene. Features j with large values of imp j contribute most to the prediction of y. In some applications we would like to have a model that uses only a small number of features. For example, a predictor that requires expression measurements for a few thousand genes is not likely to be useful in a everyday clinical settings: microarrays are too expensive and complex for everyday use, and simpler assays like RT-PCR can only measure 50 or 100 genes at a time. In addition, isolation of a smaller gene set could aid in biological understanding of the disease. There are a number of ways to obtain a series of reduced models. One would be to apply the lasso Tibshirani (1996) to the data (X, ŷ spc ). The LAR algorithm Efron et al. (2004) provides a convenient method for computing the lasso solutions. One drawback of this approach is that the series of models will typically involve different sets of features, and this can be difficult for a scientist to assimilate. Here we take a simpler approach. We define û red = l j x j (17.10) imp j >γ where l j = u T θ,1 x j/d 1, the loading for the jth feature (d 1 is the first singular value from the SVD (17.3)). This predictor keeps only features with importance scores γ or larger, and weights these features by their loadings. We illustrate this idea in the next section. References Bair, E., Hatsie, T., Paul, D., and Tibshirani, R. (2004), Prediction by suprvised princiapl compotents, Tech. rep., Stanford University. Bair, E. and Tibshirani, R. (2004), Semi-supervised methods to predict patient survival from gene expression data, PLOS Biology, 2, Donoho, D. and Johnstone, I. (1994a), Ideal Spatial Adaptation By Wavelet Shrinkage, Biometrika, 81, (1994b), Ideal spatial adaptation by wavelet shrinkage, Biometrika, 81,
41 Efron, B., Hastie, T., Johnstone, I., and Tibshirani, R. (2004), Least angle regression, Annals of Statistics, Golub, T., Slonim, D., Tamayo, P., Huard, C., Gaasenbeek, M., Mesirov, J., Coller, H., Loh, M., Downing, J., Caligiuri, M., Bloomfield, C., and Lander, E. (1999), Molecular classification of cancer: class discovery and class prediction by gene expression monitoring, Science, 286, Hedenfalk, I., Duggan, D., Chen, Y., Radmacher, M., Bittner, M., Simon, R., Meltzer, P., Gusterson, B., Esteller, M., Raffeld, M., Yakhini, Z., Ben-Dor, A., Dougherty, E., Kononen, J., Bubendorf, L., Fehrle, W., Pittaluga, S., Gruvbergerm, S., Loman, N., Johannsson, O., Olsson, H., Wilfond, B., Bor, A., and Trent, J. (2001), Gene-expression profiles in hereditary breast cancer, N. Engl. J. Med., 344, Ihaka, R. and Gentleman, R. (1996), R: A Language for Data Analysis and Graphics, Journal of Computational and Graphical Statistics, 5, Tibshirani, R. (1996), Regression shrinkage and selection via the lasso, J. Royal. Statist. Soc. B., 58, Tibshirani, R. J., Hastie, T. J., Narasimhan, B., and Chu, G. (2002), Diagnosis of multiple cancer types by shrunken centroids of gene expression, Proceedings of the National Academy of Sciences, 99, Tusher, V., Tibshirani, R., and Chu, C. (2001), Significance analysis of microarrays applied to ionizing radiation response, Proceedings of the National Academy of Sciences, first published April 17, 2001, /pnas
Prediction Analysis of Microarrays in Excel
 New URL: http://www.r-project.org/conferences/dsc-2003/ Proceedings of the 3rd International Workshop on Distributed Statistical Computing (DSC 2003) March 20 22, Vienna, Austria ISSN 1609-395X Kurt Hornik,
Tutorial: Get Running with Amos Graphics
 Tutorial: Get Running with Amos Graphics Purpose Remember your first statistics class when you sweated through memorizing formulas and laboriously calculating answers with pencil and paper? The professor
Data Analysis Tools. Tools for Summarizing Data
 Data Analysis Tools This section of the notes is meant to introduce you to many of the tools that are provided by Excel under the Tools/Data Analysis menu item. If your computer does not have that tool
Polynomial Neural Network Discovery Client User Guide
 Polynomial Neural Network Discovery Client User Guide Version 1.3 Table of contents Table of contents...2 1. Introduction...3 1.1 Overview...3 1.2 PNN algorithm principles...3 1.3 Additional criteria...3
Drawing a histogram using Excel
 Drawing a histogram using Excel STEP 1: Examine the data to decide how many class intervals you need and what the class boundaries should be. (In an assignment you may be told what class boundaries to
Using MS Excel to Analyze Data: A Tutorial
 Using MS Excel to Analyze Data: A Tutorial Various data analysis tools are available and some of them are free. Because using data to improve assessment and instruction primarily involves descriptive and
EXCEL PIVOT TABLE David Geffen School of Medicine, UCLA Dean s Office Oct 2002
 EXCEL PIVOT TABLE David Geffen School of Medicine, UCLA Dean s Office Oct 2002 Table of Contents Part I Creating a Pivot Table Excel Database......3 What is a Pivot Table...... 3 Creating Pivot Tables
Model Selection. Introduction. Model Selection
 Model Selection Introduction This user guide provides information about the Partek Model Selection tool. Topics covered include using a Down syndrome data set to demonstrate the usage of the Partek Model
How to Use a Data Spreadsheet: Excel
 How to Use a Data Spreadsheet: Excel One does not necessarily have special statistical software to perform statistical analyses. Microsoft Office Excel can be used to run statistical procedures. Although
Hypercosm. Studio. www.hypercosm.com
 Hypercosm Studio www.hypercosm.com Hypercosm Studio Guide 3 Revision: November 2005 Copyright 2005 Hypercosm LLC All rights reserved. Hypercosm, OMAR, Hypercosm 3D Player, and Hypercosm Studio are trademarks
SECTION 2-1: OVERVIEW SECTION 2-2: FREQUENCY DISTRIBUTIONS
 SECTION 2-1: OVERVIEW Chapter 2 Describing, Exploring and Comparing Data 19 In this chapter, we will use the capabilities of Excel to help us look more carefully at sets of data. We can do this by re-organizing
Migrating to Excel 2010 from Excel 2003 - Excel - Microsoft Office 1 of 1
 Migrating to Excel 2010 - Excel - Microsoft Office 1 of 1 In This Guide Microsoft Excel 2010 looks very different, so we created this guide to help you minimize the learning curve. Read on to learn key
Tips and Tricks SAGE ACCPAC INTELLIGENCE
 Tips and Tricks SAGE ACCPAC INTELLIGENCE 1 Table of Contents Auto e-mailing reports... 4 Automatically Running Macros... 7 Creating new Macros from Excel... 8 Compact Metadata Functionality... 9 Copying,
Tutorial: Get Running with Amos Graphics
 Tutorial: Get Running with Amos Graphics Purpose Remember your first statistics class when you sweated through memorizing formulas and laboriously calculating answers with pencil and paper? The professor
IBM SPSS Statistics 20 Part 4: Chi-Square and ANOVA
 CALIFORNIA STATE UNIVERSITY, LOS ANGELES INFORMATION TECHNOLOGY SERVICES IBM SPSS Statistics 20 Part 4: Chi-Square and ANOVA Summer 2013, Version 2.0 Table of Contents Introduction...2 Downloading the
Using Excel for Statistical Analysis
 Using Excel for Statistical Analysis You don t have to have a fancy pants statistics package to do many statistical functions. Excel can perform several statistical tests and analyses. First, make sure
MultiExperiment Viewer Quickstart Guide
 MultiExperiment Viewer Quickstart Guide Table of Contents: I. Preface - 2 II. Installing MeV - 2 III. Opening a Data Set - 2 IV. Filtering - 6 V. Clustering a. HCL - 8 b. K-means - 11 VI. Modules a. T-test
GP REPORTS VIEWER USER GUIDE
 GP Reports Viewer Dynamics GP Reporting Made Easy GP REPORTS VIEWER USER GUIDE For Dynamics GP Version 2015 (Build 5) Dynamics GP Version 2013 (Build 14) Dynamics GP Version 2010 (Build 65) Last updated
Tutorial Segmentation and Classification
 MARKETING ENGINEERING FOR EXCEL TUTORIAL VERSION 1.0.8 Tutorial Segmentation and Classification Marketing Engineering for Excel is a Microsoft Excel add-in. The software runs from within Microsoft Excel
Team Foundation Server 2012 Installation Guide
 Team Foundation Server 2012 Installation Guide Page 1 of 143 Team Foundation Server 2012 Installation Guide Benjamin Day [email protected] v1.0.0 November 15, 2012 Team Foundation Server 2012 Installation
Business Objects InfoView Quick-start Guide
 Business Objects InfoView Quick-start Guide Last Modified: 10/28/2015 The latest PDF version of this document can be found at: http://www.calpolycorporation.com/docs/finance/boeinfoviewquickstart.pdf What
Inquisite Reporting Plug-In for Microsoft Office. Version 7.5. Getting Started
 Inquisite Reporting Plug-In for Microsoft Office Version 7.5 Getting Started 2006 Inquisite, Inc. All rights reserved. All Inquisite brand names and product names are trademarks of Inquisite, Inc. All
Getting Started with Excel 2008. Table of Contents
 Table of Contents Elements of An Excel Document... 2 Resizing and Hiding Columns and Rows... 3 Using Panes to Create Spreadsheet Headers... 3 Using the AutoFill Command... 4 Using AutoFill for Sequences...
Team Foundation Server 2013 Installation Guide
 Team Foundation Server 2013 Installation Guide Page 1 of 164 Team Foundation Server 2013 Installation Guide Benjamin Day [email protected] v1.1.0 May 28, 2014 Team Foundation Server 2013 Installation Guide
InventoryControl for use with QuoteWerks Quick Start Guide
 InventoryControl for use with QuoteWerks Quick Start Guide Copyright 2013 Wasp Barcode Technologies 1400 10 th St. Plano, TX 75074 All Rights Reserved STATEMENTS IN THIS DOCUMENT REGARDING THIRD PARTY
Hosting Users Guide 2011
 Hosting Users Guide 2011 eofficemgr technology support for small business Celebrating a decade of providing innovative cloud computing services to small business. Table of Contents Overview... 3 Configure
User Manual. Onsight Management Suite Version 5.1. Another Innovation by Librestream
 User Manual Onsight Management Suite Version 5.1 Another Innovation by Librestream Doc #: 400075-06 May 2012 Information in this document is subject to change without notice. Reproduction in any manner
DataPA OpenAnalytics End User Training
 DataPA OpenAnalytics End User Training DataPA End User Training Lesson 1 Course Overview DataPA Chapter 1 Course Overview Introduction This course covers the skills required to use DataPA OpenAnalytics
Site Maintenance. Table of Contents
 Site Maintenance Table of Contents Adobe Contribute How to Install... 1 Publisher and Editor Roles... 1 Editing a Page in Contribute... 2 Designing a Page... 4 Publishing a Draft... 7 Common Problems...
IBM SPSS Statistics 20 Part 1: Descriptive Statistics
 CALIFORNIA STATE UNIVERSITY, LOS ANGELES INFORMATION TECHNOLOGY SERVICES IBM SPSS Statistics 20 Part 1: Descriptive Statistics Summer 2013, Version 2.0 Table of Contents Introduction...2 Downloading the
Intellect Platform - Tables and Templates Basic Document Management System - A101
 Intellect Platform - Tables and Templates Basic Document Management System - A101 Interneer, Inc. 4/12/2010 Created by Erika Keresztyen 2 Tables and Templates - A101 - Basic Document Management System
SPSS: Getting Started. For Windows
 For Windows Updated: August 2012 Table of Contents Section 1: Overview... 3 1.1 Introduction to SPSS Tutorials... 3 1.2 Introduction to SPSS... 3 1.3 Overview of SPSS for Windows... 3 Section 2: Entering
SAM Significance Analysis of Microarrays Users guide and technical document
 SAM Significance Analysis of Microarrays Users guide and technical document Gil Chu Michael Seo Jun Li Balasubramanian Narasimhan Robert Tibshirani Virginia Tusher Acknowledgments: We would like to thank
Abstract. For notes detailing the changes in each release, see the MySQL for Excel Release Notes. For legal information, see the Legal Notices.
 MySQL for Excel Abstract This is the MySQL for Excel Reference Manual. It documents MySQL for Excel 1.3 through 1.3.6. Much of the documentation also applies to the previous 1.2 series. For notes detailing
ICP Data Entry Module Training document. HHC Data Entry Module Training Document
 HHC Data Entry Module Training Document Contents 1. Introduction... 4 1.1 About this Guide... 4 1.2 Scope... 4 2. Step for testing HHC Data Entry Module.. Error! Bookmark not defined. STEP 1 : ICP HHC
How To Sync Between Quickbooks And Act
 QSalesData User Guide Note: In addition to this User Guide, we have an extensive Online Video Library that you can access from our website: www.qsalesdata.com/onlinevideos Updated: 11/14/2014 Installing
Installing and Using the Monte Carlo Simulation Excel Add-in. Software for
 Installing and Using the Monte Carlo Simulation Excel Add-in Software for Introductory Econometrics By Humberto Barreto and Frank M. Howland [email protected] and [email protected] (765) 658-4531 and
Business Objects. Report Writing - CMS Net and CCS Claims
 Business Objects Report Writing - CMS Net and CCS Claims Updated 11/28/2012 1 Introduction/Background... 4 Report Writing (Ad-Hoc)... 4 Requesting Report Writing Access... 4 Java Version... 4 Create A
Universal Simple Control, USC-1
 Universal Simple Control, USC-1 Data and Event Logging with the USB Flash Drive DATA-PAK The USC-1 universal simple voltage regulator control uses a flash drive to store data. Then a propriety Data and
ACCESS 2007. Importing and Exporting Data Files. Information Technology. MS Access 2007 Users Guide. IT Training & Development (818) 677-1700
 677-1700") Information Technology MS Access 2007 Users Guide ACCESS 2007 Importing and Exporting Data Files IT Training & Development (818) 677-1700 [email protected] TABLE OF CONTENTS Introduction... 1 Import Excel
Information Technology MS Access 2007 Users Guide ACCESS 2007 Importing and Exporting Data Files IT Training & Development (818) 677-1700 [email protected] TABLE OF CONTENTS Introduction... 1 Import Excel
Chapter 15: Forms. User Guide. 1 P a g e
 User Guide Chapter 15 Forms Engine 1 P a g e Table of Contents Introduction... 3 Form Building Basics... 4 1) About Form Templates... 4 2) About Form Instances... 4 Key Information... 4 Accessing the Form
BillQuick Agent 2010 Getting Started Guide
 Time Billing and Project Management Software Built With Your Industry Knowledge BillQuick Agent 2010 Getting Started Guide BQE Software, Inc. 2601 Airport Drive Suite 380 Torrance CA 90505 Support: (310)
FileMaker Pro and Microsoft Office Integration
 FileMaker Pro and Microsoft Office Integration page Table of Contents Executive Summary...3 Introduction...3 Top Reasons to Read This Guide...3 Before You Get Started...4 Downloading the FileMaker Trial
POINT OF SALES SYSTEM (POSS) USER MANUAL
 USER MANUAL") Page 1 of 24 POINT OF SALES SYSTEM (POSS) USER MANUAL System Name : POSI-RAD System Release Version No. : V4.0 Total pages including this covering : 23 Page 2 of 24 Table of Contents 1 INTRODUCTION...
Page 1 of 24 POINT OF SALES SYSTEM (POSS) USER MANUAL System Name : POSI-RAD System Release Version No. : V4.0 Total pages including this covering : 23 Page 2 of 24 Table of Contents 1 INTRODUCTION...
Ansur Test Executive. Users Manual
 Ansur Test Executive Users Manual April 2008 2008 Fluke Corporation, All rights reserved. All product names are trademarks of their respective companies Table of Contents 1 Introducing Ansur... 4 1.1 About
Simple Predictive Analytics Curtis Seare
 Using Excel to Solve Business Problems: Simple Predictive Analytics Curtis Seare Copyright: Vault Analytics July 2010 Contents Section I: Background Information Why use Predictive Analytics? How to use
Getting started manual
 Getting started manual XLSTAT Getting started manual Addinsoft 1 Table of Contents Install XLSTAT and register a license key... 4 Install XLSTAT on Windows... 4 Verify that your Microsoft Excel is up-to-date...
Strategic Asset Tracking System User Guide
 Strategic Asset Tracking System User Guide Contents 1 Overview 2 Web Application 2.1 Logging In 2.2 Navigation 2.3 Assets 2.3.1 Favorites 2.3.3 Purchasing 2.3.4 User Fields 2.3.5 History 2.3.6 Import Data
CheckBook Pro 2 Help
 Get started with CheckBook Pro 9 Introduction 9 Create your Accounts document 10 Name your first Account 11 Your Starting Balance 12 Currency 13 Optional password protection 14 We're not done yet! 15 AutoCompletion
Results CRM 2012 User Manual
 Results CRM 2012 User Manual A Guide to Using Results CRM Standard, Results CRM Plus, & Results CRM Business Suite Table of Contents Installation Instructions... 1 Single User & Evaluation Installation
Sage 500 ERP (7.4) Business Intelligence
 Business Intelligence") Sage 500 ERP (7.4) Business Intelligence Release Notes for Product Update 3 Sage 500 Business Intelligence (7.4) Product update 3 The software described in this document is protected by copyright, and
Sage 500 ERP (7.4) Business Intelligence Release Notes for Product Update 3 Sage 500 Business Intelligence (7.4) Product update 3 The software described in this document is protected by copyright, and
BulkSMS Text Messenger Product Manual
 BulkSMS Text Messenger Product Manual 1. Installing the software 1.1. Download the BulkSMS Text Messenger Go to www.bulksms.com and choose your country. process. Click on products on the top menu and select
BIGPOND ONLINE STORAGE USER GUIDE Issue 1.1.0-18 August 2005
 BIGPOND ONLINE STORAGE USER GUIDE Issue 1.1.0-18 August 2005 PLEASE NOTE: The contents of this publication, and any associated documentation provided to you, must not be disclosed to any third party without
How To Run Statistical Tests in Excel
 How To Run Statistical Tests in Excel Microsoft Excel is your best tool for storing and manipulating data, calculating basic descriptive statistics such as means and standard deviations, and conducting
Task Force on Technology / EXCEL
 Task Force on Technology EXCEL Basic terminology Spreadsheet A spreadsheet is an electronic document that stores various types of data. There are vertical columns and horizontal rows. A cell is where the
Two new DB2 Web Query options expand Microsoft integration As printed in the September 2009 edition of the IBM Systems Magazine
 Answering the Call Two new DB2 Web Query options expand Microsoft integration As printed in the September 2009 edition of the IBM Systems Magazine Written by Robert Andrews [email protected] End-user
Search help. More on Office.com: images templates
 Page 1 of 14 Access 2010 Home > Access 2010 Help and How-to > Getting started Search help More on Office.com: images templates Access 2010: database tasks Here are some basic database tasks that you can
Intellect Platform - The Workflow Engine Basic HelpDesk Troubleticket System - A102
 Intellect Platform - The Workflow Engine Basic HelpDesk Troubleticket System - A102 Interneer, Inc. Updated on 2/22/2012 Created by Erika Keresztyen Fahey 2 Workflow - A102 - Basic HelpDesk Ticketing System
Chapter 4 Displaying and Describing Categorical Data
 Chapter 4 Displaying and Describing Categorical Data Chapter Goals Learning Objectives This chapter presents three basic techniques for summarizing categorical data. After completing this chapter you should
INTEGRATING MICROSOFT DYNAMICS CRM WITH SIMEGO DS3
 INTEGRATING MICROSOFT DYNAMICS CRM WITH SIMEGO DS3 Often the most compelling way to introduce yourself to a software product is to try deliver value as soon as possible. Simego DS3 is designed to get you
MAS 500 Intelligence Tips and Tricks Booklet Vol. 1
 MAS 500 Intelligence Tips and Tricks Booklet Vol. 1 1 Contents Accessing the Sage MAS Intelligence Reports... 3 Copying, Pasting and Renaming Reports... 4 To create a new report from an existing report...
SYSTEM REQUIREMENTS...
 Contents INTRODUCTION... 1 BillQuick HR Setup Checklist... 2 SYSTEM REQUIREMENTS... 3 HARDWARE REQUIREMENTS... 3 SOFTWARE REQUIREMENTS... 3 Operating System Requirements... 3 Other System Requirements...
Creating Personal Web Sites Using SharePoint Designer 2007
 Creating Personal Web Sites Using SharePoint Designer 2007 Faculty Workshop May 12 th & 13 th, 2009 Overview Create Pictures Home Page: INDEX.htm Other Pages Links from Home Page to Other Pages Prepare
Install MS SQL Server 2012 Express Edition
 Install MS SQL Server 2012 Express Edition Sohodox now works with SQL Server Express Edition. Earlier versions of Sohodox created and used a MS Access based database for storing indexing data and other
aims sql server installation guide
 aims sql server installation guide Document Version: 4000 February 2015 CONTENTS AIMS Installation Guide... 3 Installing the AIMS Software... 4 Pre-Requisites... 4 Installation... 4 Shortcuts... 4 Directory
Site Maintenance Using Dreamweaver
 Site Maintenance Using Dreamweaver As you know, it is possible to transfer the files that make up your web site from your local computer to the remote server using FTP (file transfer protocol) or some
Personal Call Manager User Guide. BCM Business Communications Manager
 Personal Call Manager User Guide BCM Business Communications Manager Document Status: Standard Document Version: 04.01 Document Number: NN40010-104 Date: August 2008 Copyright Nortel Networks 2005 2008
C:\Users\<your_user_name>\AppData\Roaming\IEA\IDBAnalyzerV3
 Installing the IDB Analyzer (Version 3.1) Installing the IDB Analyzer (Version 3.1) A current version of the IDB Analyzer is available free of charge from the IEA website (http://www.iea.nl/data.html,
Spreadsheet software for linear regression analysis
 Spreadsheet software for linear regression analysis Robert Nau Fuqua School of Business, Duke University Copies of these slides together with individual Excel files that demonstrate each program are available
Tutorial for proteome data analysis using the Perseus software platform
 Tutorial for proteome data analysis using the Perseus software platform Laboratory of Mass Spectrometry, LNBio, CNPEM Tutorial version 1.0, January 2014. Note: This tutorial was written based on the information
Installation Assistance... 3. Windows/Microsoft Updates... 3. Updating from Spectra 7.0.1 or 7.1... 4. Upgrading from Spectra 6.x...
 Spectra 7.1.1/Access 2010 Windows Upgrade Installation Instructions Installation Assistance... 3 Windows/Microsoft Updates... 3 Updating from Spectra 7.0.1 or 7.1... 4 Important Notices... 4 Downloading
Figure 1. An embedded chart on a worksheet.
 8. Excel Charts and Analysis ToolPak Charts, also known as graphs, have been an integral part of spreadsheets since the early days of Lotus 1-2-3. Charting features have improved significantly over the
Pristine s Day Trading Journal...with Strategy Tester and Curve Generator
 Pristine s Day Trading Journal...with Strategy Tester and Curve Generator User Guide Important Note: Pristine s Day Trading Journal uses macros in an excel file. Macros are an embedded computer code within
Introduction to Microsoft Access 2003
 Introduction to Microsoft Access 2003 Zhi Liu School of Information Fall/2006 Introduction and Objectives Microsoft Access 2003 is a powerful, yet easy to learn, relational database application for Microsoft
Calc Guide Chapter 9 Data Analysis
 Calc Guide Chapter 9 Data Analysis Using Scenarios, Goal Seek, Solver, others Copyright This document is Copyright 2007 2011 by its contributors as listed below. You may distribute it and/or modify it
So you want to create an Email a Friend action
 So you want to create an Email a Friend action This help file will take you through all the steps on how to create a simple and effective email a friend action. It doesn t cover the advanced features;
Databases in Microsoft Access David M. Marcovitz, Ph.D.
 Databases in Microsoft Access David M. Marcovitz, Ph.D. Introduction Schools have been using integrated programs, such as Microsoft Works and Claris/AppleWorks, for many years to fulfill word processing,
An introduction to using Microsoft Excel for quantitative data analysis
 Contents An introduction to using Microsoft Excel for quantitative data analysis 1 Introduction... 1 2 Why use Excel?... 2 3 Quantitative data analysis tools in Excel... 3 4 Entering your data... 6 5 Preparing
Using Excel for Analyzing Survey Questionnaires Jennifer Leahy
 University of Wisconsin-Extension Cooperative Extension Madison, Wisconsin PD &E Program Development & Evaluation Using Excel for Analyzing Survey Questionnaires Jennifer Leahy G3658-14 Introduction You
1-Step Appraisals Jewelry Appraisal Software
 User Guide for 1-Step Appraisals Jewelry Appraisal Software Version 5.02 Page Table of Contents Installing 1-Step Appraisals... Page 3 Getting Started... Page 4 Upgrading from a Previous Version... Page
Data Management Software. CL-S10w. Installation Guide
 Data Management Software CL-S10w Installation Guide Safety Warning Please read this manual and the instrument and computer manual carefully beforehand and use the software properly and safely. Official
7.x Upgrade Instructions. 2015 Software Pursuits, Inc.
 7.x Upgrade Instructions 2015 Table of Contents INTRODUCTION...2 SYSTEM REQUIREMENTS FOR SURESYNC 7...2 CONSIDERATIONS BEFORE UPGRADING...3 TERMINOLOGY CHANGES... 4 Relation Renamed to Job... 4 SPIAgent
Package GSA. R topics documented: February 19, 2015
 Package GSA February 19, 2015 Title Gene set analysis Version 1.03 Author Brad Efron and R. Tibshirani Description Gene set analysis Maintainer Rob Tibshirani Dependencies impute
Creating and Using Forms in SharePoint
 Creating and Using Forms in SharePoint Getting started with custom lists... 1 Creating a custom list... 1 Creating a user-friendly list name... 1 Other options for creating custom lists... 2 Building a
Seagate Manager. User Guide. For Use With Your FreeAgent TM Drive. Seagate Manager User Guide for Use With Your FreeAgent Drive 1
 Seagate Manager User Guide For Use With Your FreeAgent TM Drive Seagate Manager User Guide for Use With Your FreeAgent Drive 1 Seagate Manager User Guide for Use With Your FreeAgent Drive Revision 1 2008
STC: Descriptive Statistics in Excel 2013. Running Descriptive and Correlational Analysis in Excel 2013
 Running Descriptive and Correlational Analysis in Excel 2013 Tips for coding a survey Use short phrases for your data table headers to keep your worksheet neat, you can always edit the labels in tables
Team Foundation Server 2010, Visual Studio Ultimate 2010, Team Build 2010, & Lab Management Beta 2 Installation Guide
 Page 1 of 243 Team Foundation Server 2010, Visual Studio Ultimate 2010, Team Build 2010, & Lab Management Beta 2 Installation Guide (This is an alpha version of Benjamin Day Consulting, Inc. s installation
How to Configure Outlook 2007 to connect to Exchange 2010
 How to Configure Outlook 2007 to connect to Exchange 2010 Outlook 2007 will install and work correctly on any version of Windows XP, Vista, Windows 7 or Windows 8. These instructions describe how to setup
FREEping Installation and User Guide
 FREEping Installation and User Guide Tools4ever Hermesweg 46 3741 GP Baarn Version 1.6 (c) Tools4ever 1998-2000 http://www.tools4ever.com 1. Contents 1. Contents...2 2. Introduction...3 3. Installation...4
EzyScript User Manual
 Version 1.4 Z Option 417 Oakbend Suite 200 Lewisville, Texas 75067 www.zoption.com (877) 653-7215 (972) 315-8800 fax: (972) 315-8804 EzyScript User Manual SAP Transaction Scripting & Table Querying Tool
Gene Expression Macro Version 1.1
 Gene Expression Macro Version 1.1 Instructions Rev B 1 Bio-Rad Gene Expression Macro Users Guide 2004 Bio-Rad Laboratories Table of Contents: Introduction..................................... 3 Opening
Differences in Use between Calc and Excel
 Differences in Use between Calc and Excel Title: Differences in Use between Calc and Excel: Version: 1.0 First edition: October 2004 Contents Overview... 3 Copyright and trademark information... 3 Feedback...3
EVALUATION ONLY. WA2088 WebSphere Application Server 8.5 Administration on Windows. Student Labs. Web Age Solutions Inc.
 WA2088 WebSphere Application Server 8.5 Administration on Windows Student Labs Web Age Solutions Inc. Copyright 2013 Web Age Solutions Inc. 1 Table of Contents Directory Paths Used in Labs...3 Lab Notes...4
KSTAT MINI-MANUAL. Decision Sciences 434 Kellogg Graduate School of Management
 KSTAT MINI-MANUAL Decision Sciences 434 Kellogg Graduate School of Management Kstat is a set of macros added to Excel and it will enable you to do the statistics required for this course very easily. To
Horizon Debt Collect. User s and Administrator s Guide
 Horizon Debt Collect User s and Administrator s Guide Microsoft, Windows, Windows NT, Windows 2000, Windows XP, and SQL Server are registered trademarks of Microsoft Corporation. Sybase is a registered
The Social Accelerator Setup Guide
 The Social Accelerator Setup Guide Welcome! Welcome to the Social Accelerator setup guide. This guide covers 2 ways to setup SA. Most likely, you will want to use the easy setup wizard. In that case, you
POS Connector Installation and Setup Guide
 POS Connector Installation and Setup Guide Contents About POS Connector for Small Business Accounting... 1 What is POS Connector?... 1 How does POS Connector work?... 1 Is POS Connector easy to install
IBM SPSS Data Preparation 22
 IBM SPSS Data Preparation 22 Note Before using this information and the product it supports, read the information in Notices on page 33. Product Information This edition applies to version 22, release
PLEASE NOTE: The client data used in these manuals is purely fictional.
 Welcome! CAREWare Quick Start guides will walk you through the basics of setting up, managing and using the main CAREWare functions. It is intended for non-technical users who just need to get basic information