PEMS Conference & Workshop April 3 & 4, 2014
|
|
|
- Vernon Baldwin
- 10 years ago
- Views:
Transcription


1 PEMS Conference & Workshop April 3 & 4, 2014

2 Outline Overall Test Program Objectives/Scope CRADA (HGAC) and State of Texas: Texas Commission on Environmental Quality (TCEQ) Remote Sensing (RSD) screening study PEMS Equipment Improvements Emissions Analyses (EPA) Activity Analyses (Joint EPA/HGAC thru 2 nd CRADA) Future Modeling & Data Efforts 2
 Future Modeling & Data")
3 Sponsors & Project Team U.S. EPA s Office of Transportation & Air Quality (OTAQ) Houston-Galveston Area Council (HGAC) (CRADA) Texas Commission on Environmental Quality (TCEQ) (partner) Port of Houston Authority (partner) Contractors: Eastern Research Group Sensors Inc. University of Denver 3
 Contractors: Eastern Research Group Sensors Inc.")
4 Houston Port Study Objective: Characterize activity and emissions of HD drayage trucks in Houston Differences in activity and emissions between off-network within the port and on-road were previously unknown Provides a new source of data for validating and potentially improving MOVES Heavy-Duty emission rates Allows improvement in inventory/transportation modeling by providing activity information, such as VMT, age distribution, speed distribution, to better reflect local situations Logistics: CRADA formed with HGAC in 2009 providing $430K for emissions testing and $85K for activity analyses EPA contributed equipment, staffing, and expertise to the project Over $2 million in support to program 4

5 Major Activities Conducted Preliminary analysis on Terminal Port Entry data (June 09) RSD screening study (July 09) Analyses of RSD data (August - December 09) Develop sampling and vehicle recruitment methodology using RSD (December 09) Mockup & develop testing procedures (Nov 09) Field testing (December 09 March 10) Portable Emissions: 8 hours, 36 unique trucks (46 PEMS tests) Portable Activity: 7 days, 23 trucks Further Analyzed Port of Houston Gate Entry Data (Bayport and Barbour Cut) (September 2012 February 2013) 5
 (September 2012 February")
6 Number of trucks recruited for field testing Model Year PEMS PAMS 1989 and prior TOTAL

7 RSD Screening Study To gather preliminary emissions information on the Houston drayage fleet Used to develop sampling methodology for PEMS and PAMS testing Conducted by University of Denver (July 2009) At entry gate of Barbour s Cut Port Collected gaseous pollutants (NOx, THC, CO and CO 2, SO 2,NH 3 and PM by opacity) Matched license plates to TX DOT database RSD valid readings: 4,032 Number of unique vehicles: 1,877 7
 Matched license plates to TX DOT database RSD valid readings: 4,032 Number of unique vehicles:")
8 Location of RSD equipment RSD equipment 8

9 Sampling methodology Classification Stratified sampling Population divided into separate classes based on RSD NOx emissions and model year groups Each class sampled as an independent sub-population Quota sampling within each class based on Probability that a vehicle is actually in the assigned NOx Bin Frequency that the vehicle will drive in the Port of Houston during PEMS & PAMS instrumentation 9

10 PEMS partially inside with Filters/MPS outside cab PEMS filters and DS inside cab with MPS flowmeter outside 10

11 Typical PAMS installation to gather activity: GPS & RPM (older vehicles) GPS & engine parameters (J1708/J1939) 11

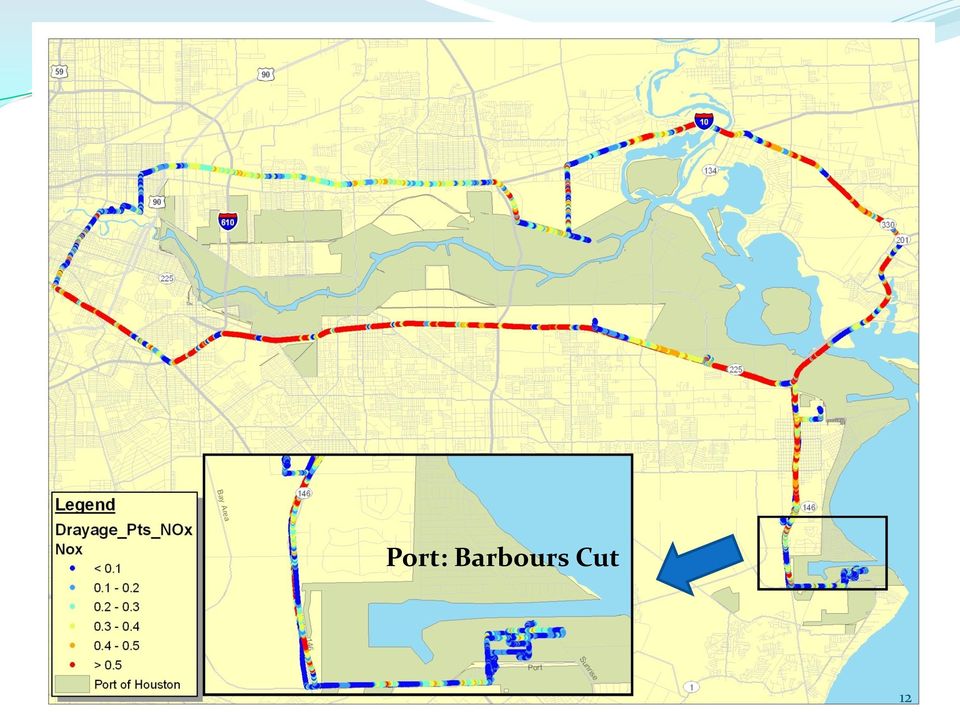
12 Port: Barbours Cut 12
13 Emissions Analysis Assign second-by-second measurements from PEMS into MOVES operating mode bins Function of vehicle speed and Scaled Tractive Power (STP) Consist of idle, braking, coast, and cruise modes Additional detail provided in the Appendix Calculate average emission rates by model year groups 13

14 Emissions Analysis (cont d) Apply population weights based on RSD sampling methodology Why apply the weights? In order to capture high-emitting trucks in the sample, trucks were recruited with unequal probabilities of selection Thus, it is necessary to adjust the sample distribution to conform to the known distribution in the RSD population Trucks without RSD measurements excluded from the analysis Compare in the wild emissions data to MOVES emission rates for heavy-duty short-haul combination trucks 14

15 PEMS NOx (g/hr) PEMS NOx (g/hr) PEMS NOx (g/hr) PEMS NOx (g/hr) PEMS NOx vs. STP by RSD NOx Bin Cleaner MYG STP MYG Deterioration?? MYG STP MYG STP Bottom line: correlation between RSD readings and PEMS measurements can be improved. STP 15

16 NOx (g/hr) 3500 Houston Drayage (weighted) vs. MOVES: MY (n=10) MOVES Drayage 1-25 mph mph 50+ mph inc. STP inc. STP inc. STP 3000 MOVES compares well with the data opmodeid 16

17 NOx (g/hr) NOx Results for MY 2005 drayage truck (n=1) MOVES Drayage Without matching RSD measurement; thus, not included in the comparison in previous slide Potentially due to deterioration and malmaintenance 1-25 mph mph 50+ mph inc. STP inc. STP inc. STP opmodeid 17

18 NOx Maps for Common Engine Family (MY 2005) EGR Failure?? Houston Drayage 5 yrs old, 750K miles Compliance Program 2 yrs old, 350K miles 18

19 Summary Emissions Analysis Pre-MY2003 Drayage compares well with MOVES Applying the population weights does not change the overall picture No proposed update for MOVES2013 MYG Drayage shows higher NOx compared to MOVES, but within variability of the data. No proposed update for MOVES2013 Comparisons to other independent sources of data, such as Heavy-Duty In-Use Compliance data, suggest current MOVES heavy-duty rates are reasonable 19

20 Summary Emissions Analysis (cont d) RSD sampling methodology Correlation between RSD and PEMS measurements was lower than expected due to difficulties in recruiting trucks from a broad range of RSD bins, test-to-test and temporal variability in RSD measurement. Potential area of improvement for future studies Based on our review, the drayage truck operations may be estimated using MOVES default short-haul combination truck category Drayage emissions data invaluable in confirming and validating the existing on-road heavy-duty truck emission rates in MOVES Further data gathering on newer MY vehicles to understand how they age would be beneficial 20

21 HD Drayage Activity Analysis Analyzed 18 months of data from two terminals within the Port of Houston: (HGAC MSA area: Barbour s Cut and Bayport) Each Terminal Separate Terminal to Terminal Entry Points Similarities/Differences in Vehicle Registration, Activity (total visits, time within port) & type of driving (Idle, creep, transit, & highway) Port Terminal Entry Data linked to TxDOT registration databases (2009/2010) via license plate to give vehicle parameters (e.g. MY, model, make, etc.) Port Vehicles Similarities/Differences to TxDOT Database Port vs Non-Port Activity Similarities/Differences (key on/off, trip lengths, idle, creep, transient & highway times, etc) 21
22 Datasets Dataset # Observations Description of Dataset and How Used TxDOT09 1,109,841 A slightly trimmed down version of the 2009 Reg Data the TxDOT provided, with the key IDs merged in as well TxDOT10 1,097,823 A slightly trimmed down version of the 2010 Reg Data the TxDOT provided, with the key IDs merged in as well TXCRDB 1,463,721 The complete consolidated registration database including key IDs BC 693,227 The Barbours Cut gate entry database with corresponding registration data merged in - Redundant entries removed BP 585,009 The Bayport gate entry database with corresponding registration data merged in - Redundant entries removed

23 Non-Port Activity Example Engine Idle Periods Port Activity Example 23
24 2009 TxDOT Registration HD Vehicle Database Both Terminals Have Same MY Distribution Barbours Cut ~ MY1999 Bayport ~ MY1999 Typical Houston Terminal Entry HD Vehicle Database over 18 months Over 27 month period in Terminal Entry HD visits (BC: 01/08 04/10 & BP: 01/09 04/10): MY distribution is older than TxDOT HD database. Less than 5% of HD vehicles which visit terminals are new MY vehicles (MY ) 24
25 Truck Activity to Terminals: How many visits by the same vehicle? Barbours Cut Terminal: Jan 2008 April 2010 Avg # of visits per month 1 Total # of trucks in this group 2 0 or more (all visitors) Total % of trucks in this group Total # of visits by trucks in this group 3 % of total visits by trucks in this group 100.0% 37, ,991 4 or more 5, , % 8 or more 1, , % 12 or more , % 16 or more , % 20 or more , % 24 or more , % 28 or more , % 32 or more , % 36 or more , % 40 or more , % 44 or more , % Note: Define Drayage truck as visiting a terminal 20 or more times per month (~ 1 trip per day) Question: What are the truck s operations? They are not visiting the port on a regular basis. Note: 84% of trucks visit less than 4 times per month (31,400 trucks) which represents 40% of total trips to terminal. Only 118 trucks representing 0.32% of total truck fleet but makes up about 5% of trips to terminal 1,506 trucks representing 4% of fleet makes up 25% of trips to terminal 25
26 Overall Activity Analysis from PAMS/PEMS How far are these Drayage Truck traveling? 66% of all trips < 10 miles in length 42 vehicles recording trip activity using PEMS/PAMS. (Note: Data is from 1 day to 1 week from five different companies) Compared each company for trip length distributions and found little difference 89% of all trips ( key on/off ) are less than 70 miles 26

27 Port vs Non-Port Operations based on Total Mileage Average for all companies was less than 3% Less than 6% of total trip mileage was within the Port area for one company. 27
28 Question: How Different are HD (container) vehicles in Operating Modes between Port and non-port Activities? Percent Time in Operating Modes Location Type Idle Creep Transient Cruise Non-Port Port Terminals: Barbours Cut PHA Bayport PHA Greens Port Private Jacintoport Private Note: Very little difference in percentage of time between four different terminals Data from PEMS/PAMS Activity including GPS Creep mode: up to 8.2 mph Transient mode: mph Cruise mode: > 47.5 mph 28
29 Vehicle Engine Load % Analysis from PEMS/PAMS data Engine load profiles when combined with speed profiles gives a good indication of MOVES opmodes being used (very few) in Port when compared to non-port Port Operations Engine load: Idle Non-Port Operations Note: Frequency of engine load % Engine load at Idle - 92% Engine load % decreases quickly Engine load % is below 34% (low gears) Note: Frequency of engine load % Engine load at Idle - 55% Engine load distribution like Gauss normal Engine load 50% - 3% Engine load 100% - 4% 29
 Speed Bin Speed Range, mph Idle speed = 0 Creep 0 < speed")
30 Are Speed Bins Different between two Terminals? Speed Bin Distributions for All Trucks inside Terminals (Based on Tioga s Report parameters) Speed Bin Speed Range, mph Idle speed = 0 Creep 0 < speed 8.2 Transient 8.2 < speed 47.5 Cruise speed > 47.5 Port: Barbours Cut Similar Results Port: Bayport 30
31 Percent of Total Operation Time Percent of Total Operation Time Comparing Time Spent in each Speed Bin from Tioga s Report vs PEMS/PAMS Data 80% 70% 60% 50% Tioga Rpt. Drayage PEMS/PAMS Data 60% 50% 40% Tioga Rpt. Drayage PEMS/PAMS Data 40% 30% 20% 10% 30% 20% 10% 0% Idle Creep Transient Cruise Speed Bin or Smartway Mode In-Port Speed Bin Speed Range, mph Idle speed = 0 Creep 0 < speed 8.2 Transient 8.2 < speed 47.5 Cruise speed > 47.5 Non-Port Note: In-Port: Higher Operating Time for Idle/Transient Modes.. Lower for Creep Non-Port: Higher Idle Mode and Lower Time for Cruise Mode 0% Idle Creep Transient Cruise Speed Bin or Smartway Mode 31
32 Port Terminal Visit Duration Statistics How long are vehicles staying at the port? From PEMS/PAMS From Gate DB Data* Avg Visit Avg Visit Duration (min) Std Dev (min) Duration (min) Std Dev (min) Overall Barbours Cut Bayport *Note that the gate db data was adjusted for obviously erroneous values; *Note that the Gate Database data was adjusted for apparently erroneous values by removing Gate data time period was Oct April 2010 visits < 1 min and visits > 8 hrs. The gate data time period is October 2009 April 2010
33 Typical Distribution of Port Visit Time for PHA (Barbours Cut/Bayport) ~1 hr - ~3 hrs - Frequency
34 Duration - Minutes Typical Distribution of Port Visit Time for PHA by Time of Day: (Barbours Cut/Bayport) Question: When Do Trucks Arrive at Terminals? High Traffic Volumes in Morning & mid-day
35 Preliminary Findings: PEMS s gathered emission rates compare very well with MOVES rates for most Mys Newer MY HDVs with age (mileage) might have higher emission rates (deterioration and/or malmaintenance) Drayage HDVs are not that special Looks like Short-Hauler HDVs category in MOVES Drayage Fleet is older (MYs) than overall Houston HDV fleet Most trips are short (time & mileage) and local (MSA) 35
36 Preliminary Findings: Trip Frequency to terminal very low per week compared to overall trips that vehicle takes. It appears that economic activity does not change fleet MYs or time spent in Port. Engine load % very low within Port (low emission rates) when compared to engine load % distribution outside of Port Both Terminals analyzed were very similar to each other in time and operational modes Houston Data shows some differences in modes operations than what is referenced as defaults settings for both in-port and non-port. 36
37 Preliminary Findings: Houston Terminal data and PEMS/PAMS data similar for average port time. No Difference in weekday Terminal Traffic Higher terminal frequency in the morning vs afternoon Estimated HDV emissions within Port are small (low load/low speeds) when compared to overall HDV driving operations outside of Port. 37
38 CRADA Benefits: CRADA allows for partnerships to be formed to address common need(s). Major benefit to EPA that allows us to get local cooperation to conduct real world testing Allows State and local governments to gain a better understanding on proper testing methods for gathering data and conducting modeling for their specific needs Allows EPA to refine sampling protocols, testing procedures & equipment to gather data for MOVES. Major leverage of resources : (staff/equipment/contractor(s)/partnership(s)/$$$ Estimated total cost: Over $2 million including equipment use 38
39 Acknowledgments EPA Office of Transportation & Air Quality: Carl Fulper, Connie Hart, David Hawkins, James Warila, Robert Caldwell, Ethan Schauer, Brian Ratkos, Craig Swan, Charles Schenk, Michael Christianson, Prashanth Gururaja, Phil Carlson, David Choi Eastern Research Group: Sandeep Kishan, Timothy DeFries, Michael Sabisch, Alan Stanard, Scott Fincher, Gopi Manne, Rick Baker, Diane Preusse Sensors, Inc: Christopher Darby, Louis Moret Houston-Galveston Area Council (HGAC): Shelley Whitworth, Patricia Franco Lawhorn, Melissa Bain-Dorney Texas Commission on Environmental Quality (TCEQ): Donna Huff, Mary McGarryBarber, Amy Muttoni, David Brymer Port of Houston Authority: Dana Blume, Ken Gathright EPA Region 6: Sandra Rennie, Carl Young 39
40 Reports & Data Location: Contact Information: Carl Fulper, US EPA 40
41 Questions? 41
42 Appendix 42
43 Percent (%) Sampling classes based on RSD scores 1 NOx Bin -2 (2.5%) NOx Bin -1 (20%) NOx Bin 0 (55%) NOx Bin 1 (20%) NOx Bin 2 (2.5%) RSD NOx z-value 1 Data Collection of Drayage Trucks in Houston-Galveston Port Area Draft Report. EP-C May 27,
44 PEMS Vehicle Example MY 1994 Freightliner Portable Emissions Semtech DS Gaseous Emissions (CO2, CO, NO, NO2 & THC) PM filters via Proportional Sampling PM Filters Semtech_DS PM Proportional Sampler System Exhaust System 44
45 NOx (g/hr) 6000 Houston Drayage (weighted) vs. MOVES: MY (n=8) MOVES Drayage 1-25 mph mph 50+ mph inc. STP inc. STP inc. STP 5000 MOVES compares well with the data opmodeid 45
46 NOx (g/hr) Houston Drayage (weighted) vs. MOVES: MY 1998 (n=1) MOVES Drayage MOVES compares well with the data NOTE: only a single vehicle 1-25 mph mph 50+ mph inc. STP inc. STP inc. STP opmodeid 46
47 NOx (g/hr) 3000 Houston Drayage (weighted) vs. MOVES: MY (n=10) MOVES Drayage 1-25 mph mph 50+ mph inc. STP inc. STP inc. STP 2500 MOVES under-predicts the drayage data, but within the data variability opmodeid 47
48 Barbours Cut Terminal: Highest month: Jan 08 Lowest month: Nov 08 Question: Does the change in economic activity play a role on MY distribution? Answer: Probably No. Compared highest and lowest monthly vehicle traffic over 18 months time period Bayport Terminal : Highest month: June 09 Lowest month: April 10
49 Truck Activity to Terminals: How many visits by the same vehicle? Bayport Terminal: Jan 2009 April 2010 Avg # of visits per month 1 0 or more (all visitor) Total # of trucks in this group 2 Total % of trucks in this group Total # of visits by trucks in this group 3 % of total visits by trucks in this group 100.0% 21, ,456 4 or more 5, , % 8 or more 2, , % 12 or more 1, , % 16 or more , % 20 or more , % 24 or more , % 28 or more , % 32 or more , % 36 or more , % 40 or more , % 44 or more , % Note: Define Drayage truck as visiting a terminal 20 or more times per month (~ 1 trip per day in month) Question: What are these truck s operations? They are not visiting the port on a regular basis. Question: Why the difference between terminals? Note: 75% of trucks visit less than 4 times per month (16,100 trucks) which represents 22% of total trips to terminal. 520 trucks representing 2.41% of total truck fleet but makes up about 19% of trips to terminal 2,818 trucks representing 13% of fleet makes up 57% of trips to terminal. 49
50 Typical Distribution of Port Visit Time for PHA by Week: (Barbours Cut/Bayport) Question: Any Difference in Traffic by Weekday? 50
51 Question: What are the Drayage HDVs Emissions missed within Port? Estimated Total Emissions of Gaseous Pollutants from the Barbours Cut and Bayport Fleet in Port and non-port (Nov 1, 2009 to April 30, 2010, trucks visiting at least 1 time per month) Pollutant (metric tons): HC CO CO2 NOx Estimated In-Port Emissions Estimated Non-Port Emissions , , , Total Emissions , , , In-port percentage of total 3.4% 2.7% 1.0% 1.1% Based on: port entry data (PHA), model year distribution at ports, estimated average activity in and out of port (PEMS/PAMS) using PEMS emissions rates (no MOVES emission rates used in analysis) 51
 represent: 74% (Barbours Cut) & 79% (Bayport) of Truck Traffic Other Counties located 225")
52 Question: Where are HD trucks located (stationed) who visit the Terminals? Within Houston MSA or outside? County Barbours Cut Bayport Note: HD Drayage very similar distribution between Terminals Local Trucks (MSA) represent: 74% (Barbours Cut) & 79% (Bayport) of Truck Traffic Other Counties located 225 to 380 miles from MSA represent (22 27%) Trucks visiting the Port in top five MSA counties represent 4-10% of total trucks registered in county when compared to about 1% in other counties # Trucks % # Trucks % Harris, MSA 8, , Fort Bend, MSA Brazoria, MSA Montgomery, MSA Galveston, MSA Five Other MSA Hidalgo (370 miles) Tarrant (Ft Worth, 290 miles) Dallas ( Dallas, 270 miles) All 239 other counties 1, , About 2% of all Trucks registered in the state visit these PHA terminals Total 13,131 11,353 52
53 HD Drayage Emissions Analysis Objective: To validate and potentially improve/update the heavy-duty emission rates, which is the core of the MOVES framework Number of Trucks with PEMS measurements Model Year With RSD measurements Without RSD measurements 1989 and prior TOTAL
Exhaust Temperature, Air Conditioning and Inspection and Maintenance Adjustments in MOVES2010a
 Exhaust Temperature, Air Conditioning and Inspection and Maintenance Adjustments in MOVES2010a MOVES Workshop June 14, 2011 David Brzezinski USEPA Office of Transportation & Air Quality Assessment and
Methods to Find the Cost-Effectiveness of Funding Air Quality Projects
 Methods to Find the Cost-Effectiveness of Funding Air Quality Projects For Evaluating Motor Vehicle Registration Fee Projects and Congestion Mitigation and Air Quality Improvement (CMAQ) Projects Emission
Validation of the COPERT road emission inventory model with real-use data
 1 Validation of the COPERT road emission inventory model with real-use data P. Dilara (P), V. Franco European Commission Joint Research Centre -Transport and Air Quality Unit M. Kousoulidou, L. Ntziachristos,
Truck Lane Restriction Expansion
 Truck Lane Restriction Expansion Dallas City Council Transportation and Environment Committee August 25, 2009 North Central Texas Council of Governments Transportation Department 1 Truck Lane Restrictions
The Senate Committee on Natural Resources
 The Senate Committee on Natural Resources Interim Report to the 80th Legislature State Air Programs December 2006 TABLE OF CONTENTS INTERIM CHARGE 1 INTERIM CHARGE... 1 BACKGROUND... 1 TEXAS EMISSIONS
QUANTIFYING THE EMISSIONS BENEFIT OF OPACITY TESTING AND REPAIR OF HEAVY-DUTY DIESEL VEHICLES
 QUANTIFYING THE EMISSIONS BENEFIT OF OPACITY TESTING AND REPAIR OF HEAVY-DUTY DIESEL VEHICLES Robert L. McCormick, Michael S. Graboski, Teresa L. Alleman, Javier R. Alvarez Colorado Institute for Fuels
Texas. DeVry Impact. Summary Statistics. Earnings by Education Level. Total Wage Growth Over Studied Period. 65% Growth $44,262. 42% Growth $39,478
 Texas DeVry Inc. s eight Texas locations 1 produced $82.7 million in economic impact in FY2010. As part of this economic impact, DeVry Inc. schools supported 809 jobs. Wage Impact annually, while the degree
EPA s SmartWay Technology Program & Tire Testing Updates. Dennis Johnson, U.S. EPA
 EPA s SmartWay Technology Program & Tire Testing Updates Dennis Johnson, U.S. EPA EPA s SmartWay Technology Program and Tire Testing Update Dennis Johnson, Director Technology Assessment Center Transportation
HEAVY-DUTY ON-ROAD VEHICLE INSPECTION AND MAINTENANCE PROGRAM
 HEAVY-DUTY ON-ROAD VEHICLE INSPECTION AND MAINTENANCE PROGRAM I. OBJECTIVE The objective of this study is to develop, evaluate, and assess the cost-effectiveness and economic impacts of alternatives for
Emission Facts. The amount of pollution that a vehicle emits and the rate at which
 Average Annual Emissions and Fuel for Gasoline-Fueled Passenger Cars and Light Trucks The amount of pollution that a vehicle emits and the rate at which it consumes fuel are dependent on many factors.
By: Kim Heroy-Rogalski, P.E. California Air Resources Board. Delhi, India April 29, 2015
 By: Kim Heroy-Rogalski, P.E. California Air Resources Board Delhi, India April 29, 2015 1 Heavy-Duty Truck Background Emissions Contribution Drivers for Reducing GHG and Criteria Pollutants NOx & PM Standards
Modifying Driver Behavior An Important Piece to Greening Your Fleet
 Modifying Driver Behavior An Important Piece to Greening Your Fleet September 24, 2014 Panelists: C.R. England, Roehl Transport, and Saddle Creek Transportation Gary Thompson Standards and Curriculum Manager
APPENDIX D PUBLIC AWARENESS INFORMATION
 APPENDIX D PUBLIC AWARENESS INFORMATION READINESS FAILURE FACT SHEET Beginning December 2004, New York will implement a new motor vehicle emission testing program in 53 of New York s upstate counties,
FLEET MANAGEMENT. SASHTO NEW ORLEANS, LOUISIANA Tuesday, August 26 th 2014 10:30 a.m. 12:00 p.m.
 FLEET MANAGEMENT SASHTO NEW ORLEANS, LOUISIANA Tuesday, August 26 th 2014 10:30 a.m. 12:00 p.m. REPLACEMENT PROGRAM The theory behind our replacement program is to charge the user for each piece of equipment
Practical Approach to Deriving Peak-Hour Estimates from 24-Hour Travel Demand Models
 Practical Approach to Deriving Peak-Hour Estimates from 24-Hour Travel Demand Models CHARLES C. CREVO AND UDAY VIRKUD 1 The Clean Air Act Amendments of 1990 have created a need for accurate and reliable
Portable Emission Measurement System (PEMS)
") Portable Emission Measurement System (PEMS) Dr. Jesse Tu In-Use Retrofit Section Purpose of PEMS Testing To Evaluate Performance of After-treatment Devices On Off- Road / On-Road Equipments To Compare
Portable Emission Measurement System (PEMS) Dr. Jesse Tu In-Use Retrofit Section Purpose of PEMS Testing To Evaluate Performance of After-treatment Devices On Off- Road / On-Road Equipments To Compare
Virginia's Transportation Performance Management System
 Virginia's Transportation Performance Management System Office of Intermodal Planning and Investment Commonwealth Transportation Board Presented by: David Tyeryar, Deputy Secretary of Transportation September
Green Fleet Policy Ordinance
 Green Fleet Policy Ordinance Section 1 Basis for ordinance 1. The total energy bill in for the City and/or County of was $ million and in projected to increase by percent to about $ million by. 2. Public
ARB s Diesel Emissions Programs
 ARB s Diesel Emissions Programs Green Fleets: Kicking Tires and Crunching Numbers April 7, 2008 Kathleen Mead, Manager Retrofit Implementation Section Mobile Source Control Division Presentation Outline
Air Resources Board. Alan C. Lloyd, Ph.D. Chairman 9528 Telstar Avenue P.O. Box 8001 El Monte, California 91731 www.arb.ca.gov
 Winston H. Hickox Agency Secretary Air Resources Board Alan C. Lloyd, Ph.D. Chairman 9528 Telstar Avenue P.O. Box 8001 El Monte, California 91731 www.arb.ca.gov Gray Davis Governor DATE: May 9, 2003 TO:
Cobb County School District: Reducing School Bus Fleet Diesel Emissions and Idling
 Cobb County School District: Reducing School Bus Fleet Diesel Emissions and Idling Chris Rome, Randall Guensler Vetri Elango, and Sara Khoeini http://transportation.ce.gatech.edu/busemissions Outline Project
RESOLUTIONS FOR APPROVAL OF AMENDMENTS TO THE 2015-2018 TRANSPORTATION IMPROVEMENT PROGRAM (TIP) AND 2040 REGIONAL TRANSPORTATION PLAN (RTP)
 AND 2040 REGIONAL TRANSPORTATION PLAN (RTP)") TPC Agenda Item 6A Mailout - 10/16/15 RESOLUTIONS FOR APPROVAL OF AMENDMENTS TO THE 2015-2018 TRANSPORTATION IMPROVEMENT PROGRAM (TIP) AND 2040 REGIONAL TRANSPORTATION PLAN (RTP) OCTOBER AMENDMENTS Amendment
TPC Agenda Item 6A Mailout - 10/16/15 RESOLUTIONS FOR APPROVAL OF AMENDMENTS TO THE 2015-2018 TRANSPORTATION IMPROVEMENT PROGRAM (TIP) AND 2040 REGIONAL TRANSPORTATION PLAN (RTP) OCTOBER AMENDMENTS Amendment
A Public Sector Perspective on Consolidation. Kevin Churchill Head of Procurement London Borough of Camden
 A Public Sector Perspective on Consolidation. Kevin Churchill Head of Procurement London Borough of Camden What is the Consolidation Centre A new method of doing Last Mile deliveries in London. Managing
Chicago Area Clean Cities
 Chicago Area Clean Cities Fleet Efficiency Strategies: Saving Money and Fuel 9/11/14 Samantha Bingham Environmental Policy Analyst, City of Chicago Coordinator, Chicago Area Clean Cities Email: [email protected]
SmartWay Transport Partnership UN CSD 19 Learning Center. Buddy Polovick US Environmental Protection Agency 09 May 2011
 SmartWay Transport Partnership UN CSD 19 Learning Center Buddy Polovick US Environmental Protection Agency 09 May 2011 Outline Part 1 Freight Sustainability Drivers and Challenges SmartWay Overview Questions
Final Technical Support Document. Fuel Economy Labeling of Motor Vehicle Revisions to Improve Calculation of Fuel Economy Estimates
 Final Technical Support Document Fuel Economy Labeling of Motor Vehicle Revisions to Improve Calculation of Fuel Economy Estimates Office of Transportation and Air Quality EPA420-R-06-017 December 2006
Elements of Three I/M Programs
 In-Use Emissions by Vehicle Model Tom Wenzel and Etan Gumerman, Lawrence Berkeley National Laboratory Poster presented at the Ninth CRC On-Road Vehicle Emissions Workshop, April 21, 1999, San Diego CA.
Clean Diesel versus CNG Buses: Cost, Air Quality, & Climate Impacts
 CONCORD, MA - MANCHESTER, NH - WASHINGTON, DC 1000 ELM STREET, 2 ND FLOOR MANCHESTER, NH 03101 603-647-5746 www.mjbradley.com DATE February 22, 2012 TO FROM RE: Conrad Schneider, Clean Air Task Force Dana
Emissions Readiness Monitor Strategies
 Emissions Readiness Monitor Strategies A presentation by NYS DMV s Office of Clean Air for New York State Automobile Dealers Association 10/30/2012 1 What is the payoff for mastering readiness monitor
Presentation of Vehicle Energy consumption Calculation TOol (VECTO)
") Presentation of Vehicle Energy consumption Calculation TOol (VECTO) Dimitrios Savvidis DG CLIMA Transport and Ozone Unit C2 Stakeholder Meeting Brussels, 16 th of September 2014 Simulation tool to calculate
Presentation of Vehicle Energy consumption Calculation TOol (VECTO) Dimitrios Savvidis DG CLIMA Transport and Ozone Unit C2 Stakeholder Meeting Brussels, 16 th of September 2014 Simulation tool to calculate
Alternative Fuels and Advanced Vehicles: Resources for Fleet Managers
 Alternative Fuels and Advanced Vehicles: Resources for Fleet Managers April 12, 2011 NREL/PR-7A30-51687 Ann H. Brennan National Renewable Energy Laboratory Golden, CO NREL Clean is a Cities national /
BEST PRACTICES & RECOMMENDATIONS FOR OPTIMIZING YOUR FUEL MANAGEMENT PROGRAM
 WHITE PAPER WINTER 2015 BEST PRACTICES & RECOMMENDATIONS FOR OPTIMIZING YOUR FUEL MANAGEMENT PROGRAM WWW.MERCHANTSFLEETMANAGEMENT.COM 1.866.6LEASES 1.866.653.2737 OVERVIEW In our ever-evolving landscape,
Policy Measures for Improving Air Quality in the U.S.
 Policy Measures for Improving Air Quality in the U.S. The 4 th SINO-US Workshop on Motor Vehicle Pollution Prevention and Control Office of Transportation and Air Quality Mission and Focus EPA The mission
Caution: Children Breathing An overview of air pollution and idling vehicles at Colorado schools
 Caution: Children Breathing An overview of air pollution and idling vehicles at Colorado schools Mothers for Clean Air - Colorado Clean Air at Schools: Engines Off (CASEO) is a partnership between federal
TxDOT Project 0-6697-CTR: Integration of Data Sources to Optimize Freight Transportation in Texas
 0-6697-CTR-P2 COMPANION POWERPOINT PRESENTATION TO UNITY DATABASE TxDOT Project 0-6697-CTR: Integration of Data Sources to Optimize Freight Transportation in Texas DECEMBER 2013; PUBLISHED SEPTEMBER 2014
Where Do We Want to Go? How Can We Get There?
 Where Do We Want to Go? How Can We Get There? The BRTB has adopted nine goals, with supporting strategies, performance measures, and performance targets. Together, these goals, strategies, measures, and
V-MAC IV DataMax (Vehicle Data Logger) Fleet. Fleet Trip. (12 Segments) (Driver Defined Company Trips)
 Fleet. Fleet Trip. (12 Segments) (Driver Defined Company Trips)") DATAMAX BASICS DataMax is Mack s standard comprehensive on-board data logger/trip recorder. With nearly 10 years of proven service since its V-MAC III introduction in 1998, DataMax provides the customer
DATAMAX BASICS DataMax is Mack s standard comprehensive on-board data logger/trip recorder. With nearly 10 years of proven service since its V-MAC III introduction in 1998, DataMax provides the customer
Measurement of Off-Road Vehicle Emissions in Mexico using three PEMS platforms
 Measurement of Off-Road Vehicle Emissions in Mexico using three PEMS platforms Miguel Zavala, Rodrigo Gonzalez, Marco Balam, Luisa T. Molina Molina Center for Energy and the Environment Andres Aguilar,
Fuel Usage and Fuel Consumption Monitoring
 Fuel Usage and Fuel Consumption Monitoring 1. Introduction Fuel (Gas) pricing growing and growing and reaching record levels. Yours vehicle fleet (special machinery) require more and more money on fuel
Wolf Creek Hydropower Rehabilitation Analysis Report
 Wolf Creek Hydropower Rehabilitation Analysis Report David Bishop Kris Atanassov Team Cumberland, September 16, 2015 US Army Corps of Engineers Agenda Overview Water Availability Energy Modeling Preliminary
MD PHEV/EV ARRA Project Data Collection and Reporting
 MD PHEV/EV ARRA Project Data Collection and Reporting DC NY KS FL OR MD VA GA MO TX IN Miles Driven in Each State CA Led by: Kevin Walkowicz With support from: Laurie Ramroth Adam Duran Ben Rosen NREL/PR-5400-53878
Nonroad Mobile Source Compliance Management Program in the U.S.
 Nonroad Mobile Source Compliance Management Program in the U.S. The 4 th SINO-US Workshop on Motor Vehicle Pollution Prevention and Control U.S. Environmental Protection Agency Office of Transportation
PAY AS YOU DRIVE (PAYD) INSURANCE PILOT PROGRAM PHASE 2 MID-COURSE PROJECT REPORT. Prepared by Progressive County Mutual Insurance Company.
 INSURANCE PILOT PROGRAM PHASE 2 MID-COURSE PROJECT REPORT. Prepared by Progressive County Mutual Insurance Company.") PAY AS YOU DRIVE (PAYD) INSURANCE PILOT PROGRAM PHASE 2 MID-COURSE PROJECT REPORT Prepared by Progressive County Mutual Insurance Company March 2007 This report was prepared in cooperation with the Texas
PAY AS YOU DRIVE (PAYD) INSURANCE PILOT PROGRAM PHASE 2 MID-COURSE PROJECT REPORT Prepared by Progressive County Mutual Insurance Company March 2007 This report was prepared in cooperation with the Texas
FINAL REPORT DEVELOPMENT OF CONGESTION PERFORMANCE MEASURES USING ITS INFORMATION. Sarah B. Medley Graduate Research Assistant
 FINAL REPORT DEVELOPMENT OF CONGESTION PERFORMANCE MEASURES USING ITS INFORMATION Sarah B. Medley Graduate Research Assistant Michael J. Demetsky, Ph.D., P.E. Faculty Research Scientist and Professor of
Development of a World-wide Harmonised Heavy-duty Engine Emissions Test Cycle
 Informal document No. 1 */ UNITED NATIONS (41st GRPE, 16-18 January 2001, agenda item 1.1.) Development of a World-wide Harmonised Heavy-duty Engine Emissions Test Cycle (Draft) Executive Summary Report
2010 Fleet Manager and Fleet Director Compensation Survey
 2010 Fleet Manager and Fleet Director Compensation Survey Over 200 Fleet Managers and Fleet Directors from 42 states and Canada participated in this survey effort. 82% of participants are Fleet Managers
CELEBRATING YEARS MARKET LEADERSHIP 1989-2013
 CELEBRATING YEARS MARKET LEADERSHIP 1989-2013 WHAT IS TELEMATICS? Telematics is the use of a device (black box) that collects and transmit data about how a vehicle is performing, the speed and distance
Truck Drayage Practices National Cooperative Freight Research Program Project 14/Report 11
 Truck Drayage Practices National Cooperative Freight Research Program Project 14/Report 11 The Tioga Group, Inc. Center for Transportation Research, Univ. of Texas, Austin University of South Carolina
Nearly 38,000 vehicles cross the Shinnecock Canal on Sunrise Highway (NYS Route 27) daily, during peak summer months.
 daily, during peak summer months.") 2. Traffic Characteristics Traffic volumes have increased in concert with population growth in the Towns of Southampton and East Hampton. The New York State Department of Transportation (NYSDOT) maintains
2. Traffic Characteristics Traffic volumes have increased in concert with population growth in the Towns of Southampton and East Hampton. The New York State Department of Transportation (NYSDOT) maintains
REDUCING THE CARBON FOOTPRINT OF FREIGHT MOVEMENT THROUGH ECO-DRIVING
 REDUCING THE CARBON FOOTPRINT OF FREIGHT MOVEMENT THROUGH ECO-DRIVING Kanok Boriboonsomsin June 25, 2015 1 TRANSFORMING THE TRANSPORTATION SYSTEM R E S E A R C H Producing state of knowledge white papers
Emissions pollutant from diesel, biodiesel and natural gas refuse collection vehicles in urban areas
 Emissions pollutant from diesel, biodiesel and natural gas refuse collection vehicles in urban areas José Mª López, Nuria Flores, Felipe Jiménez, Francisco Aparicio Polytechnic University of Madrid (UPM),
Proposed Local Law No. 3 Of 2015. County Of Ulster
 BE IT ENACTED, by the Legislature of the County of Ulster, as follows: SECTION 1. LEGISLATIVE INTENT AND PURPOSE. The Ulster County Legislature finds that government must be innovative, efficient, and
Comparison of US and EU programs to control lightduty vehicle emissions
 Comparison of US and EU programs to control lightduty vehicle emissions Kate Blumberg, Francisco Posada April 8, 2015 Outline Slide 2 Overview on new vehicle standards Weight classifications Test cycles
Dan Kempton Deputy Chief Information Officer, DOT
 Department of Transportation Information Technology Update Presentation to the House Appropriations Subcommittee on Information Technology February 28, 2013 Dan Kempton Deputy Chief Information Officer,
Green Global NCAP labelling / green scoring Workshop, 30.04.2013
 Green Global NCAP labelling / green scoring Workshop, 30.04.2013 Homologation test cycles worldwide Status of the WLTP Heinz Steven 13.04.2013 1 Introduction Road vehicles have to comply with limit values
Ports Drayage Truck Registry (PDTR) Glossary
 Glossary") Banned Indicates a truck is barred entry from port access based on the emissions standard of the truck as set by the progressive ban schedules of the Ports of Long Beach & Los Angeles. Authoritative Source:
Banned Indicates a truck is barred entry from port access based on the emissions standard of the truck as set by the progressive ban schedules of the Ports of Long Beach & Los Angeles. Authoritative Source:
Canadian Vehicle Use Study: Electronic Data Collection
 Proceedings of Statistics Canada Symposium 2014 Beyond traditional survey taking: adapting to a changing world Canadian Vehicle Use Study: Electronic Data Collection Émile Allie 1 Abstract The Canadian
How to Green Your. Township Fleet. Sponsored by Maine Township Highway Department. Purpose. How to Green Your Township Fleet
 How to Green Your How to Green Your Township Fleet Township Fleet Purpose In an effort to make Maine Township more environmentally friendly, the Maine Township Highway Department (MTHD) partnered with
CLEAN FLEET VEHICLE PROCUREMENT POLICY
 CLEAN FLEET VEHICLE PROCUREMENT POLICY Surface Transportation Technical Committee September 23, 2005 North Central Texas Council of Governments Transportation Department Air Quality Clean Fleet Focus Public
Houston-Galveston Regional Transit Services
 Houston-Galveston Regional Transit Services SUMMARY Transit providers in the Houston-Galveston area demonstrate several examples of regional transit services that cross jurisdictional boundaries: Harris
VEHICLE INSPECTION FOR REDUCING EMISSION
 VEHICLE INSPECTION FOR REDUCING EMISSION Stakeholders Workshop on Air Quality and Transportation Challenges in Nigeria Presented by Prince Segun Obayendo MD/CEO Temple Resources Nig Ltd Content Introduction
1 FIXED ROUTE OVERVIEW
 1 FIXED ROUTE OVERVIEW Thirty transit agencies in Ohio operate fixed route or deviated fixed route service, representing a little less than half of the 62 transit agencies in Ohio. While many transit agencies
Software Features of Auto Gas Gas Analyzer Features HC, CO, CO2, Lambda, Air Fuel, NOx. Has optional RPM and Oil Temp.
 Auto Gas Ultimate Model Shown Above Software Features of Auto Gas Gas Analyzer Features HC, CO, CO2, Lambda, Air Fuel, NOx. Has optional RPM and Oil Temp. Durable high strength aluminum case with all of
Step Away from That Truck September 2011
 George Recktenwald, Director of Public Works Harry Lorick, P.E., LA Consulting Inc. Lorick Associates CONSULTING 2 3 and Exhibition 1 Background Process and Benchmarks Results Future Steps 4 1,263 square
Insurance Telematics:
 Insurance Telematics: Big Data, Big Potential, Big Headache Dave Huber, President Kairos Solutions IFSUG March 2012 Big Data 2 ne of the few products whose price is set before costs are known Known costs
USE OF STATE FLEET VEHICLE GPS DATA FOR TRAVEL TIME ANALYSIS
 USE OF STATE FLEET VEHICLE GPS DATA FOR TRAVEL TIME ANALYSIS David P. Racca Center for Applied Demography and Survey Research (CADSR) University of Delaware Graham Hall, Rm 284, Newark, Delaware 19716
VEHICLE EMISSIONS INSPECTION & MAINTENANCE RULES & REGULATIONS MANUAL FOR OFFICIAL VEHICLE INSPECTION STATIONS AND CERTIFIED INSPECTORS
 STATE OF TEXAS DEPARTMENT OF PUBLIC SAFETY AUSTIN VEHICLE EMISSIONS INSPECTION & MAINTENANCE RULES & REGULATIONS MANUAL FOR OFFICIAL VEHICLE INSPECTION STATIONS AND CERTIFIED INSPECTORS VI-51 (Rev. 11/07)