GeoGebra. 10 lessons. Gerrit Stols
|
|
|
- Nathaniel Tate
- 10 years ago
- Views:
Transcription
1 GeoGebra in 10 lessons Gerrit Stols

2 Acknowledgements GeoGebra is dynamic mathematics open source (free) software for learning and teaching mathematics in schools. It was developed by Markus Hohenwarter and an international team of programmers. They did a brilliant job and we as mathematics teachers and lecturers must salute them. GeoGebra combines geometry, algebra, statistics and calculus. You can download it for free. Download GeoGebra from ytrtttrttttttttt For more information contact the author: Gerrit Stols University of Pretoria South Africa [email protected] Last modified: October 05, 2009 ytrtttrttttttttt

3 Contents The GeoGebra Interface 1 GeoGebra menu.. 2 Construction tools Lesson 1: Polygons and Angles 5 Lesson 2: Perpendicular and parallel lines. 7 Lesson 3: Drawing graphs Lesson 4: Using sliders to transform graphs.. 15 Lesson 5: Transformation Geometry Lesson 6: User define tools (centroid construction) Lesson 7: Kites an parallelograms Lesson 8: Statistics Lesson 9: Calculus Lesson 10: Matrices
... 21 Lesson 7: Kites an parallelograms.")
4 GeoGebra Interface The GeoGebra basic interface is divided into three sections: Input bar, Algebra View, and Graphic View. ALGEBRA VIEW: Show and edit all the created objects and functions. Just double click on equation to edit it. GRAPHIC VIEW: Show and construct objects and the graphs of functions. Construction tools: INPUT BAR: Create new objects, equations and functions E.g. Construct the graph of Type: "y = 3x^2+4x+6" or "y = 3*x^2+4*x+6" and Menu: 1

5 Menus 2

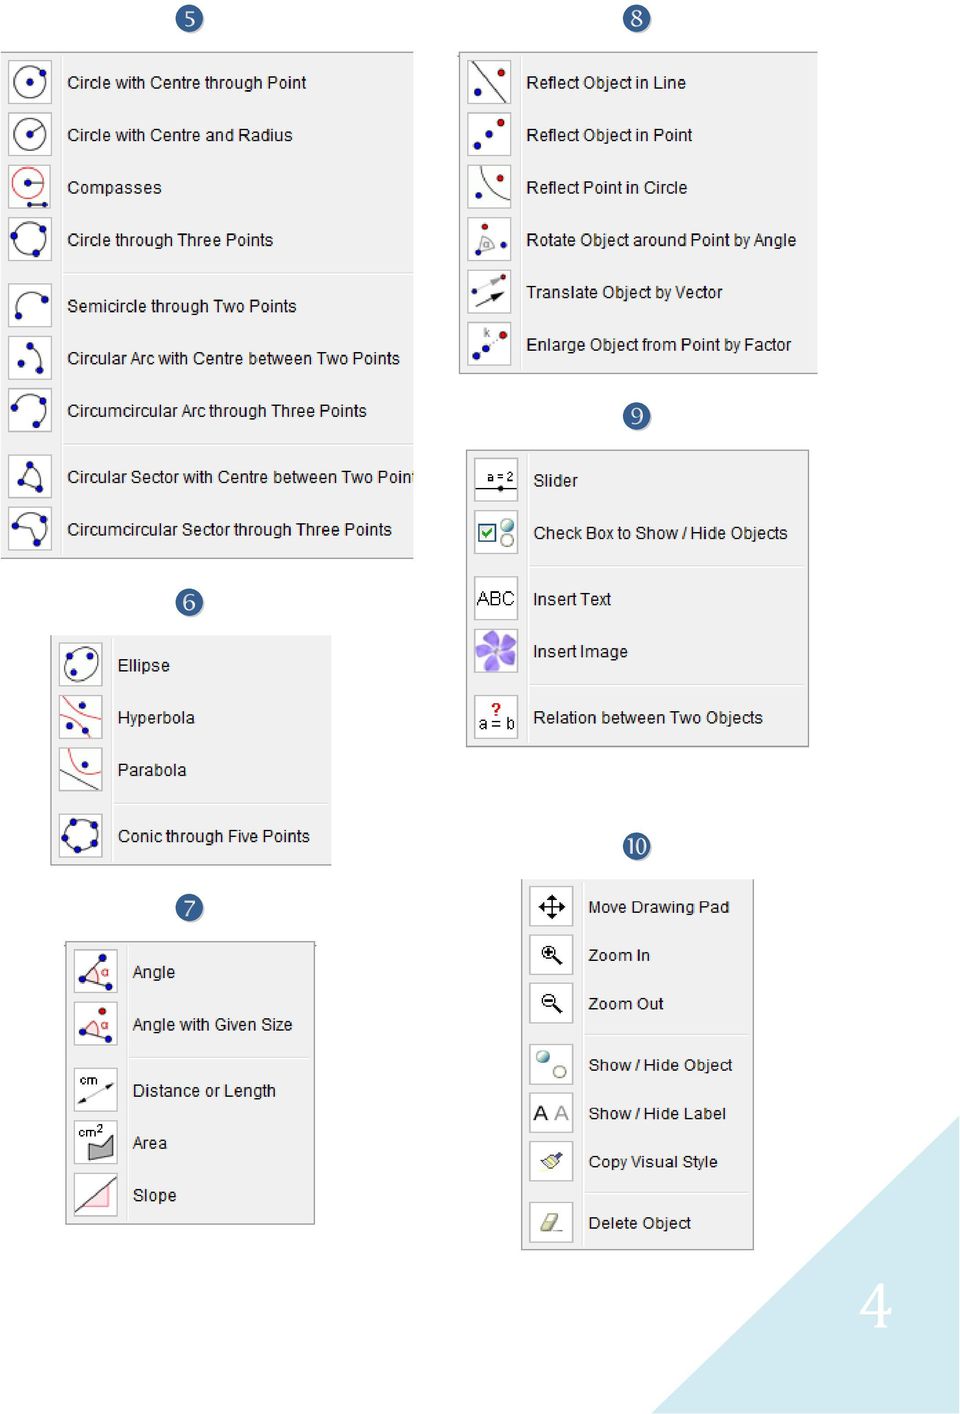
6 Construction Tools 3

7 4
8 1 Polygons and Angles Construct a triangle and measure the sum of the interior angles Let s hide the axes because we do not need them now: In the View menu, click the Axes button. Go to the Construction Tools: select the Polygon tool In the Graphic View area: create a triangle by selecting three points which will be the vertices of the polygon. (Remember to click the first point again in order to close the polygon) Measure the interior angles: Go to the Construction Tools & select the Angle tool Select the three vertices counter clockwise (the measured angle second) Calculate the sum of the interior angles Go to the Input bar and type: Because there is no, and on the keyboard you have to select them from the dropdown list at the bottom: The sum of the angles (which is 180 ) will appear in the Algebra window 5
 Calculate the sum of the interior angles Go to the Input bar and type: Because there is no, and on the keyboard you have to select them from the dropdown list at the")
9 The question that any mathematician will ask is if this is a special case or is it always true? Go to the Construction Tools and select the Arrow Drag the vertices (A, B and C) of the triangle. GeoGebra will measure the angles imediately and also update the sum of the interior angles. To save the construction: select the File tab and click the Save button Construction of a regular polygon Hide the axes: select View / Click Axes button Select the Regular Polygon (click the small arrow in the bottom righthand corner of the icon to see all the options) Create an equilateral triangle by selecting the two base points. A window will open: type the number of vertices (in the case of a triangle 3, square 4, regular pentagon 5) and hit the enter key. Measure an interior angle: select the Angle tool / Select the three vertices counter clockwise (the measured angle second). Repeat the steps 1 to 5 to construct a square, regular polygon, etc. 6
 Create an equilateral triangle by selecting the two base points.")
10 2 Perpendicular and Parallel lines To construct a median, altitude, perdendicular bisector, and angle bisector of a triangle you need to know the following: Construct the midpoint of a line segment Construct a line segment Use the Segment between Two Points tool Construct the midpoint of the line segment: Use the Midpoint or Centre tool Construct a line perpendicular to a given line and through a given point Construct a line segment using the Segment between Two Points tool Construct a point on the line segment: select the New Point tool and click on the line segment Construct a perpendicular line: select the Perpendicular Line tool and click on the point and the line. 7

11 Construct a line parallel to a given line and through a given point: Construct a line segment using the Segment between Two Points tool Construct any other point (not on the line segment) using the New Point tool. Construct a parallel line: select the Parallel Line tool and click on the point and the line. Construct the perpendicular bisector of a line segment: Construct a line segment using the Segment between Two Points tool Construct the perpendicular bisector of the line segment: select the Perpendicular Bisector tool and click on the two end points of the line segment. 8

12 Construct the angle bisector of an angle: Construct an angle by clicking the Segment between Two Points tool twice in succession. Construct the angle bisector: select the Angle Bisector tool and click on the three points of the angle. 9

13 3 Drawing graphs You can create and modify algebraic coordinates and equations by using the Input Bar at the bottom of the GeoGebra window. Construction of the graphs of a) b) y c) 3 2 3y 25 d) 3 e) Click on the Input Bar on the bottom of the GeoGebra window. Use the keyboard and the dropdown menus (next to the Input Bar) to type the equation: Press the enter key on the keyboard after typing each equation. 10
 to type the equation: 3 2 6 3 4 6 3 2 3 25 3 2.")
14 You can create and modify trigonometric equations by using the Input Bar at the bottom of the GeoGebra window. You can use radian measure or degrees. The default mode is radian measure. Construction of a trigonometric graphs (in radian measure) Click on the Input Bar on the bottom of the GeoGebra window. Use the keyboard and the dropdown menus (next to the Input Bar) to type the equation: a) sin Press the enter key on the keyboard. 11

15 Construction of a trigonometric graphs using degrees: sin Move the cursor to the x axis. Press the right button on the mouse (right click). The following screen will appear: From the dropdown list select degrees: Adjust the minimum and maximum x values: Change the distance between the x values: Close the window and click on the Input Bar on the bottom of the GeoGebra window. Use the keyboard and the dropdown menus (next to the Input Bar) to type the equation: Use the dropdown list for the degree sign: 12

16 Press the enter key on the keyboard. If you want to you can change the appearance of the graph: Right click on the graph and select properties. Click the Colour tab and select any colour. Click the style tab and select the line thickness and style. 13

17 Construction of a trigonometric graphs using degrees: 2cos 1 and tan 30 in degrees. Follow steps 1 to 4 in the previous section, but type: To add a grid as you noticed in the background of the previous sketch right click the x axis and make the following selections: 14

18 4 Use sliders to transform graphs You can create and use sliders to change the coefficients of the equations of graphs. Creating sliders Select the Slider tool from the Construction Tools: Click where you want to locate the slider. The following window will appear: Click the Apply button and a slider will appear. Go to the Construction Tools and select the Arrow Use the arrow to drag the point a on the slider. You will notice the value of point a on the slider will change. Repeat steps 1 to 4 to create more sliders but rename them k, p and q. Using sliders in equations Click on the Input Bar on the bottom of the GeoGebra window. Use the keyboard and the dropdown menus (next to the Input Bar) to type the equation (on separate pages) and press enter: : y a.2 q 15

19 y a.sink x p q Go to the Construction Tools and select the Arrow. Use the arrow to drag the points on the sliders. You will notice what the effect of the changing coefficient is on the graph. 16

20 5 Transformation Geometry You can do all the basic transformation geometry in GeoGebra. You will find all the transformation functions if you click the third icon from the left on the Toolbox: Constructing a reflection in the x axis Example: Determine the coordinates of the image of P(3; 2) if P is reflected across the x axis. Select View / Grid in order to show the grid. Type: (3,2) in the Input bar Select the Reflect Object in Line option Click the point (3, 2) and the x axis. GeoGebra will in fact give you instructions needed on the right hand side of the Toolbox. 17

21 Constructing a reflection of a point in the line y = x Example: Determine the coordinates of the image of P(3; 2) if P is reflected across the line y = x. Type: (3,2) in the Input bar Type: y = x in the Input bar Select the Reflect Object in Line option Click the point (3, 2) and the line y = x. Rotation of a point Example: Determine the coordinates of the image of P(3; 2) if P has been rotated about the origin through 90 in an anti clockwise direction. Type: (3,2) in the Input bar and press the enter key Type: (0,0) in the Input bar and press the enter key Select the Rotate Object around Point by Angle option The following message will appear next to the Construction Tools: Follow the instructions: Select the point (3, 2), then the centre (0, 0). The following screen will appear: Type 90 and select the degree sign from the dropdown menu. Select anticlockwise and press the enter key. 18
22 Translation of a point Example: Determine the coordinates of the image of P(3; 2) if P has been translated 4 units horizontally to the left. Type: (3,2) in the Input bar and press the enter key Select Vector between two points from the Toolbox. Construct any vector of 4 units horizontally to the left. Select the Translate Object by Vector option from the Toolbox. The following message will appear next to the Construction Tools: Follow the instructions: Select the point (3, 2), then the vector. You will notice that the vector detemines the translation. You can changes the translation by dragging the vector. 19
23 Enlargement of a point Example: Determine the coordinates of the image of P(3; 2) if P has been enlarged by a factor 3 with the origin as centre of enlargement. Type: (3,2) in the Input bar and press the enter key Type: (0,0) in the Input bar and press the enter key Select the Rotate Object around Point by Angle option The following message will appear next to the Construction Tools: Follow the instructions: Select the point (3, 2), then the centre (0, 0). The following screen will appear: Type 3 and Click OK. 20
24 6 User define tools (centroid) Construction of the centroid of a triangle. Construct a triangle Construct the midpoint of each of the sides of the triangle: use the Midpoint or Centre Tool Construct the medians: select the Ray through Two Points. Connect the vertex with the midpoint of the opposite side. Construct a point on the intersection of the medians. Use Intersect Two Objects tool Hide all the unwanted information and constructions. Go to the Algebra View: click all the dots except for A, B, C and the centroid G. 21
25 GeoGebra allows you to create your own construction tools based on your existing constructions. All these tools created by you are saved in your GeoGebra file. Create your own Centroid tool for future use. Use the Arrow tool and select the points A, B, C and G by dragging. Select the Tools menu and Create New Tool. Click Next twice and enter the name for the new tool. If you want to construct a centroid in future, use this tool. To construct a centroid: select the Centroid tool and select the three vertices of any triangle. If you open GeoGebra again your custom tools will not appear in the Construction Tools unless you save the settings. Select the Option menu and click Save Settings. 22
26 7 Kites and parallelograms Construction of a parallelogram A parallelogram is a quadrilateral with 2 pairs of opposite sides parallel. Construct a line segment using the Segment between Two Points tool Construct any other point (not on the line segment) using the New Point tool. Connect point A and C using the Segment between Two Points tool Construct a parallel line by selecting the Parallel Line tool and click on the point C and the line segment AB. Construct another parallel line by selecting the Parallel Line tool and click on the point B and the line segment AC. Construct a point on the intersection of the two newly constructed parallel lines using the Intersect Two Objects tool 23
27 Select the Polygon Tool and select the four vertices of the parrallelogram. Hide all the unwanted information and constructions. Right click on the line or object and select either Show Object or Show Label. 24
28 Construction of a kite A kite is a quadrilateral with two pairs of adjacent sides equal. Construct two intersecting circles using the Circle with Centre through Point tool Construct the two points of intersection using the Intersect Two Objects tool Select the Polygon tool and select the four vertices of the kite (the centre of the two circles and the two intersections of the circles). Hide all the unwanted information and constructions. Right click on the line or object and select either Show Object or Show label. 25
29 8 Statistics GeoGebra has a range of statistical uses which can be used with or without the Spreadsheet View. It has a number of statistical functions and graphing tools. Finding the mean, median and mode The marks for a math test, out of 60, are given below. Use GeoGebra to find the mean, median and mode: Method 1: Use the Input bar: Type the following in the Input bar GeoGebra will list the results in the Algebra Window: Mean = Median = 42 Mode = 26 Method 2: Use the Input bar and Spreadsheet View: Open the Spreadsheet View: click the View menu / Spreadsheet View Type the data in the first column of the spreadsheet. Select the data by dragging the mouse. Right click on the selected block and select Create List. The following list will appear in the Algebra window: Type the following in the Input bar 26
30 Drawing a histogram Example: The marks for a math test, out of 60, are given below. Use GeoGebra to draw a histogram for the marks: Method 1: Use the Input bar: Type the following in the Input bar to creates a histogram using the raw data: Histogram[{List of Class Boundaries}, {List of Raw Data}] The class boundaries determine the width and position of each bar of the histogram. GeoGebra will construct the following histogram: Method 2: Use the Input bar and Spreadsheet View: Open the Spreadsheet View: click the View menu / Spreadsheet View Type the data in the first column of the spreadsheet. Select the data by dragging the mouse. Right click on the selected block and select Create List. The following list will appear in the Algebra window: Type the following in the Input bar 27
31 Drawing a box and whisker diagram Example: The marks for a math test, out of 60, are given below. Use GeoGebra to draw a box and whisker diagram for the marks: Open the Spreadsheet View: click the View menu / Spreadsheet View Type the data in the first column of the spreadsheet. Select the data by dragging the mouse. Right click on the selected block and select Create List. The following list will appear in the Algebra window: Type the following in the Input bar to creates a Box and whisker plot: BoxPlot[a, b, L_1] where a is the vertical position on the coordinate system b is the relative height of the box and whisker diagram GeoGebra will construct the following Box and whisker plot: a b value Changing the first two values to a = 1 and b = 0.2 will result in: 28
32 Finding the quartiles, standard deviation and variance The marks for a math test, out of 60, are given below. Use GeoGebra to find the quartiles, standard deviation and variance: Open the Spreadsheet View: click the View menu / Spreadsheet View Type the data in the first column of the spreadsheet. Select the data by dragging the mouse. Right click on the selected block and select Create List. The following list will appear in the Algebra window: Type the following in the Input bar: For calculating the Lower Quartile (Q1): For calculating the Upper Quartile (Q3): For calculating the Standard Deviation (SD): For calculating the Variance ( ): GeoGebra will list the results in the same order as it was created in the Algebra Window: 29
33 Drawing Scatter plots and lines of best fit Example: The table below represents the number of new businesses that were started in Pretoria between 2003 and Year Number of businesses Sketch a scatter plot which represents the information above and draw the line of best fit. Open the Spreadsheet View: click the View menu / Spreadsheet View Type the data in the first and second columns of the spreadsheet. Select the Best Fit Line from the Construction Tools The equation of the line will appear in the Algebra window 30
34 9 Calculus Construct a tangent at a point (must be able to drag the point of contact) to any curve of a function f Example: Construct a tangent to the graph of Type the equation in the Input Bar and press enter. Select the New Point from the Construction Tools and click on the graph. Select the Tangents from the Toolbox and click on the point and on the graph. Drag the point on the graph 31
35 Differentiation and construction of the curve of f'(x) Example: Find the derivate of Type the equation in the Input Bar and press enter. Type the following command (or select it from the drop down list) in the Input Bar and press enter. or GeoGebra will calculate the derivative in the algebra view and construct the curve of f'(x). 32
36 Finding the approximating the total area underneath a curve on a graph (integral) using the Riemann sum method. Example: Evaluate and demonstrate the Riemann sum for taking the sample points to be under the curve and 3, 1, and 8. Sketch a graph of the function and the Riemann rectangles and use the GeoGebra to determine these areas. Type the equation in the Input Bar and press enter. Type the following command (or select it from the drop down list) in the Input Bar and press enter. This command will yields the lower sum of the function f on the interval [ 3, 1] with 8 rectangles. A similar command is available for the upper sum. If you want to increase the number of rectangles you can also create a slider. 33
37 Calculating the area under curve: Finding definite integrals Example: Calculate the area under the graph of between 3 and 2. Type the equation in the Input Bar and press enter. Type the following command (or select it from the drop down list) in the Input Bar and press enter. In the algebra view GeoGebra will returns the definite integral of the function f in the interval [ 3, 1]. 34
38 You can also calculate the area between two curves The following command will yields the definite integral of the difference f(x) g(x) in the interval [a, b]: Integral[f, g, a, b] Example find the area between the curves of and between their points of intersection. Type the equation in the Input Bar and press enter. From the Construction Tools select Intersect Two Objects and click on the two graphs. GeoGebra will constructs the points of intersection A and B. Type the following command (or select it from the drop down list) in the Input Bar and press enter. GeoGebra will construct and measure the area between the curves of f and g between the x value of point A and the x value of point B. 35
39 10 Matrices You can use GeoGebra to do matrix operations. For example: calculate: Open the Spreadsheet View: click the View menu / Spreadsheet View Type the data in the same order as the matrix in the spreadsheet. Highlight the cells an right click. Select Create Matrix. A new matrix will be created in the Algebra View area Repeat steps 1 to 4 and create another matrix. Type the following command (or select it from the drop down list) in the Input Bar and press enter. The result will appear in the Algebra View under matrix 3: It is also possible to calculate the determinant, or to invert or transpose matrices using the following commands: 36
http://school-maths.com Gerrit Stols
 For more info and downloads go to: http://school-maths.com Gerrit Stols Acknowledgements GeoGebra is dynamic mathematics open source (free) software for learning and teaching mathematics in schools. It
Quickstart for Desktop Version
 Quickstart for Desktop Version What is GeoGebra? Dynamic Mathematics Software in one easy-to-use package For learning and teaching at all levels of education Joins interactive 2D and 3D geometry, algebra,
GeoGebra Statistics and Probability
 GeoGebra Statistics and Probability Project Maths Development Team 2013 www.projectmaths.ie Page 1 of 24 Index Activity Topic Page 1 Introduction GeoGebra Statistics 3 2 To calculate the Sum, Mean, Count,
GeoGebra Transformation Activities
 GeoGebra Transformation Activities Move New Point Line Between Two Points Perpendicular Line Circle w/ Center Through Point If needed: Go to www.geogebra.org Click on Download Click on GeoGebra WebStart
GeoGebra Help Official Manual 3.2
 GeoGebra Help Official Manual 3.2 Markus Hohenwarter and Judith Hohenwarter www.geogebra.org GeoGebra Help 3.2 Last modified: April 22, 2009 Authors Markus Hohenwarter, [email protected] Judith Hohenwarter,
Introduction to the TI-Nspire CX
 Introduction to the TI-Nspire CX Activity Overview: In this activity, you will become familiar with the layout of the TI-Nspire CX. Step 1: Locate the Touchpad. The Touchpad is used to navigate the cursor
Understand the Sketcher workbench of CATIA V5.
 Chapter 1 Drawing Sketches in Learning Objectives the Sketcher Workbench-I After completing this chapter you will be able to: Understand the Sketcher workbench of CATIA V5. Start a new file in the Part
How to make a line graph using Excel 2007
 How to make a line graph using Excel 2007 Format your data sheet Make sure you have a title and each column of data has a title. If you are entering data by hand, use time or the independent variable in
Biggar High School Mathematics Department. National 5 Learning Intentions & Success Criteria: Assessing My Progress
 Biggar High School Mathematics Department National 5 Learning Intentions & Success Criteria: Assessing My Progress Expressions & Formulae Topic Learning Intention Success Criteria I understand this Approximation
Tutorial 1: The Freehand Tools
 UNC Charlotte Tutorial 1: The Freehand Tools In this tutorial you ll learn how to draw and construct geometric figures using Sketchpad s freehand construction tools. You ll also learn how to undo your
Using GeoGebra to create applets for visualization and exploration.
 Handouts for ICTCM workshop on GeoGebra, March 2007 By Mike May, S.J. [email protected] Using GeoGebra to create applets for visualization and exploration. Overview: I) We will start with a fast tour
Geometry Course Summary Department: Math. Semester 1
 Geometry Course Summary Department: Math Semester 1 Learning Objective #1 Geometry Basics Targets to Meet Learning Objective #1 Use inductive reasoning to make conclusions about mathematical patterns Give
Geometry Progress Ladder
 Geometry Progress Ladder Maths Makes Sense Foundation End-of-year objectives page 2 Maths Makes Sense 1 2 End-of-block objectives page 3 Maths Makes Sense 3 4 End-of-block objectives page 4 Maths Makes
KaleidaGraph Quick Start Guide
 KaleidaGraph Quick Start Guide This document is a hands-on guide that walks you through the use of KaleidaGraph. You will probably want to print this guide and then start your exploration of the product.
Plotting: Customizing the Graph
 Plotting: Customizing the Graph Data Plots: General Tips Making a Data Plot Active Within a graph layer, only one data plot can be active. A data plot must be set active before you can use the Data Selector
TI-Nspire CAS Graphing Calculator
 TI-Nspire CAS Graphing Calculator Contents Opening a New Document 2 Setting Auto/Approximate Mode 2 Setting Degree Mode 2 Copying and Pasting a Expression or Equation 3 Accessing the Catalogue 3 Defining
DEFINITIONS. Perpendicular Two lines are called perpendicular if they form a right angle.
 DEFINITIONS Degree A degree is the 1 th part of a straight angle. 180 Right Angle A 90 angle is called a right angle. Perpendicular Two lines are called perpendicular if they form a right angle. Congruent
MATHS LEVEL DESCRIPTORS
 MATHS LEVEL DESCRIPTORS Number Level 3 Understand the place value of numbers up to thousands. Order numbers up to 9999. Round numbers to the nearest 10 or 100. Understand the number line below zero, and
SECTION 2-1: OVERVIEW SECTION 2-2: FREQUENCY DISTRIBUTIONS
 SECTION 2-1: OVERVIEW Chapter 2 Describing, Exploring and Comparing Data 19 In this chapter, we will use the capabilities of Excel to help us look more carefully at sets of data. We can do this by re-organizing
Conjectures. Chapter 2. Chapter 3
 Conjectures Chapter 2 C-1 Linear Pair Conjecture If two angles form a linear pair, then the measures of the angles add up to 180. (Lesson 2.5) C-2 Vertical Angles Conjecture If two angles are vertical
Geometer s Sketchpad. Discovering the incenter of a triangle
 Geometer s Sketchpad Discovering the incenter of a triangle Name: Date: 1.) Open Geometer s Sketchpad (GSP 4.02) by double clicking the icon in the Start menu. The icon looks like this: 2.) Once the program
Appendix 2.1 Tabular and Graphical Methods Using Excel
 Appendix 2.1 Tabular and Graphical Methods Using Excel 1 Appendix 2.1 Tabular and Graphical Methods Using Excel The instructions in this section begin by describing the entry of data into an Excel spreadsheet.
Algebra III. Lesson 33. Quadrilaterals Properties of Parallelograms Types of Parallelograms Conditions for Parallelograms - Trapezoids
 Algebra III Lesson 33 Quadrilaterals Properties of Parallelograms Types of Parallelograms Conditions for Parallelograms - Trapezoids Quadrilaterals What is a quadrilateral? Quad means? 4 Lateral means?
Conjectures for Geometry for Math 70 By I. L. Tse
 Conjectures for Geometry for Math 70 By I. L. Tse Chapter Conjectures 1. Linear Pair Conjecture: If two angles form a linear pair, then the measure of the angles add up to 180. Vertical Angle Conjecture:
Table of Contents TASK 1: DATA ANALYSIS TOOLPAK... 2 TASK 2: HISTOGRAMS... 5 TASK 3: ENTER MIDPOINT FORMULAS... 11
 Table of Contents TASK 1: DATA ANALYSIS TOOLPAK... 2 TASK 2: HISTOGRAMS... 5 TASK 3: ENTER MIDPOINT FORMULAS... 11 TASK 4: ADD TOTAL LABEL AND FORMULA FOR FREQUENCY... 12 TASK 5: MODIFICATIONS TO THE HISTOGRAM...
Section 1: How will you be tested? This section will give you information about the different types of examination papers that are available.
 REVISION CHECKLIST for IGCSE Mathematics 0580 A guide for students How to use this guide This guide describes what topics and skills you need to know for your IGCSE Mathematics examination. It will help
0 Introduction to Data Analysis Using an Excel Spreadsheet
 Experiment 0 Introduction to Data Analysis Using an Excel Spreadsheet I. Purpose The purpose of this introductory lab is to teach you a few basic things about how to use an EXCEL 2010 spreadsheet to do
2. If C is the midpoint of AB and B is the midpoint of AE, can you say that the measure of AC is 1/4 the measure of AE?
 MATH 206 - Midterm Exam 2 Practice Exam Solutions 1. Show two rays in the same plane that intersect at more than one point. Rays AB and BA intersect at all points from A to B. 2. If C is the midpoint of
MATHEMATICS Y6 Geometry 6750 Use co-ordinates and extend to 4 quadrants Equipment MathSphere www.mathsphere.co.uk
 MATHEMATICS Y6 Geometry 675 Use co-ordinates and etend to quadrants Paper, pencil, ruler Equipment MathSphere 675 Use co-ordinates and etend to quadrants. Page Concepts Children should be familiar with
Pro/ENGINEER Wildfire 4.0 Basic Design
 Introduction Datum features are non-solid features used during the construction of other features. The most common datum features include planes, axes, coordinate systems, and curves. Datum features do
New York State Student Learning Objective: Regents Geometry
 New York State Student Learning Objective: Regents Geometry All SLOs MUST include the following basic components: Population These are the students assigned to the course section(s) in this SLO all students
KEANSBURG SCHOOL DISTRICT KEANSBURG HIGH SCHOOL Mathematics Department. HSPA 10 Curriculum. September 2007
 KEANSBURG HIGH SCHOOL Mathematics Department HSPA 10 Curriculum September 2007 Written by: Karen Egan Mathematics Supervisor: Ann Gagliardi 7 days Sample and Display Data (Chapter 1 pp. 4-47) Surveys and
(Least Squares Investigation)
") (Least Squares Investigation) o Open a new sketch. Select Preferences under the Edit menu. Select the Text Tab at the top. Uncheck both boxes under the title Show Labels Automatically o Create two points
(Least Squares Investigation) o Open a new sketch. Select Preferences under the Edit menu. Select the Text Tab at the top. Uncheck both boxes under the title Show Labels Automatically o Create two points
GEOMETRY CONCEPT MAP. Suggested Sequence:
 CONCEPT MAP GEOMETRY August 2011 Suggested Sequence: 1. Tools of Geometry 2. Reasoning and Proof 3. Parallel and Perpendicular Lines 4. Congruent Triangles 5. Relationships Within Triangles 6. Polygons
Solving Simultaneous Equations and Matrices
 Solving Simultaneous Equations and Matrices The following represents a systematic investigation for the steps used to solve two simultaneous linear equations in two unknowns. The motivation for considering
Years after 2000. US Student to Teacher Ratio 0 16.048 1 15.893 2 15.900 3 15.900 4 15.800 5 15.657 6 15.540
 To complete this technology assignment, you should already have created a scatter plot for your data on your calculator and/or in Excel. You could do this with any two columns of data, but for demonstration
Below is a very brief tutorial on the basic capabilities of Excel. Refer to the Excel help files for more information.
 Excel Tutorial Below is a very brief tutorial on the basic capabilities of Excel. Refer to the Excel help files for more information. Working with Data Entering and Formatting Data Before entering data
Curriculum Map by Block Geometry Mapping for Math Block Testing 2007-2008. August 20 to August 24 Review concepts from previous grades.
 Curriculum Map by Geometry Mapping for Math Testing 2007-2008 Pre- s 1 August 20 to August 24 Review concepts from previous grades. August 27 to September 28 (Assessment to be completed by September 28)
Parallel and Perpendicular. We show a small box in one of the angles to show that the lines are perpendicular.
 CONDENSED L E S S O N. Parallel and Perpendicular In this lesson you will learn the meaning of parallel and perpendicular discover how the slopes of parallel and perpendicular lines are related use slopes
Visualizing Triangle Centers Using Geogebra
 Visualizing Triangle Centers Using Geogebra Sanjay Gulati Shri Shankaracharya Vidyalaya, Hudco, Bhilai India http://mathematicsbhilai.blogspot.com/ [email protected] ABSTRACT. In this paper, we will
Geometry Module 4 Unit 2 Practice Exam
 Name: Class: Date: ID: A Geometry Module 4 Unit 2 Practice Exam Multiple Choice Identify the choice that best completes the statement or answers the question. 1. Which diagram shows the most useful positioning
CREATING EXCEL PIVOT TABLES AND PIVOT CHARTS FOR LIBRARY QUESTIONNAIRE RESULTS
 CREATING EXCEL PIVOT TABLES AND PIVOT CHARTS FOR LIBRARY QUESTIONNAIRE RESULTS An Excel Pivot Table is an interactive table that summarizes large amounts of data. It allows the user to view and manipulate
Microsoft Excel Tutorial
 Microsoft Excel Tutorial by Dr. James E. Parks Department of Physics and Astronomy 401 Nielsen Physics Building The University of Tennessee Knoxville, Tennessee 37996-1200 Copyright August, 2000 by James
Cabri Geometry Application User Guide
 Cabri Geometry Application User Guide Preview of Geometry... 2 Learning the Basics... 3 Managing File Operations... 12 Setting Application Preferences... 14 Selecting and Moving Objects... 17 Deleting
Unit 7 Quadratic Relations of the Form y = ax 2 + bx + c
 Unit 7 Quadratic Relations of the Form y = ax 2 + bx + c Lesson Outline BIG PICTURE Students will: manipulate algebraic expressions, as needed to understand quadratic relations; identify characteristics
Adobe Illustrator CS5 Part 1: Introduction to Illustrator
 CALIFORNIA STATE UNIVERSITY, LOS ANGELES INFORMATION TECHNOLOGY SERVICES Adobe Illustrator CS5 Part 1: Introduction to Illustrator Summer 2011, Version 1.0 Table of Contents Introduction...2 Downloading
Using Excel for descriptive statistics
 FACT SHEET Using Excel for descriptive statistics Introduction Biologists no longer routinely plot graphs by hand or rely on calculators to carry out difficult and tedious statistical calculations. These
Using Excel to find Perimeter, Area & Volume
 Using Excel to find Perimeter, Area & Volume Level: LBS 4 V = lwh Goal: To become familiar with Microsoft Excel by entering formulas into a spreadsheet in order to calculate the perimeter, area and volume
This activity will show you how to draw graphs of algebraic functions in Excel.
 This activity will show you how to draw graphs of algebraic functions in Excel. Open a new Excel workbook. This is Excel in Office 2007. You may not have used this version before but it is very much the
Tessellating with Regular Polygons
 Tessellating with Regular Polygons You ve probably seen a floor tiled with square tiles. Squares make good tiles because they can cover a surface without any gaps or overlapping. This kind of tiling is
TABLE OF CONTENTS. INTRODUCTION... 5 Advance Concrete... 5 Where to find information?... 6 INSTALLATION... 7 STARTING ADVANCE CONCRETE...
 Starting Guide TABLE OF CONTENTS INTRODUCTION... 5 Advance Concrete... 5 Where to find information?... 6 INSTALLATION... 7 STARTING ADVANCE CONCRETE... 7 ADVANCE CONCRETE USER INTERFACE... 7 Other important
Chapter 8 Geometry We will discuss following concepts in this chapter.
 Mat College Mathematics Updated on Nov 5, 009 Chapter 8 Geometry We will discuss following concepts in this chapter. Two Dimensional Geometry: Straight lines (parallel and perpendicular), Rays, Angles
Creating HTML5 Apps with Geometry Expressions. A Guide to Making Interactive Math Apps
 Creating HTML5 Apps with Geometry Expressions A Guide to Making Interactive Math Apps Marissa Miller 6/9/2014 CONTENTS Introduction... 3 The Basics... 4 JavaScript Applet Generator... 5 UI Types: Making
Situation: Proving Quadrilaterals in the Coordinate Plane
 Situation: Proving Quadrilaterals in the Coordinate Plane 1 Prepared at the University of Georgia EMAT 6500 Date Last Revised: 07/31/013 Michael Ferra Prompt A teacher in a high school Coordinate Algebra
39 Symmetry of Plane Figures
 39 Symmetry of Plane Figures In this section, we are interested in the symmetric properties of plane figures. By a symmetry of a plane figure we mean a motion of the plane that moves the figure so that
Using Spreadsheets, Selection Sets, and COGO Controls
 Using Spreadsheets, Selection Sets, and COGO Controls Contents About this tutorial... 3 Step 1. Open the project... 3 Step 2. View spreadsheets... 4 Step 3. Create a selection set... 10 Step 4. Work with
TIgeometry.com. Geometry. Angle Bisectors in a Triangle
 Angle Bisectors in a Triangle ID: 8892 Time required 40 minutes Topic: Triangles and Their Centers Use inductive reasoning to postulate a relationship between an angle bisector and the arms of the angle.
SpaceClaim Introduction Training Session. A SpaceClaim Support Document
 SpaceClaim Introduction Training Session A SpaceClaim Support Document In this class we will walk through the basic tools used to create and modify models in SpaceClaim. Introduction We will focus on:
Excel Basics By Tom Peters & Laura Spielman
 Excel Basics By Tom Peters & Laura Spielman What is Excel? Microsoft Excel is a software program with spreadsheet format enabling the user to organize raw data, make tables and charts, graph and model
Using Microsoft Excel to Plot and Analyze Kinetic Data
 Entering and Formatting Data Using Microsoft Excel to Plot and Analyze Kinetic Data Open Excel. Set up the spreadsheet page (Sheet 1) so that anyone who reads it will understand the page (Figure 1). Type
Intro to Excel spreadsheets
 Intro to Excel spreadsheets What are the objectives of this document? The objectives of document are: 1. Familiarize you with what a spreadsheet is, how it works, and what its capabilities are; 2. Using
Area. Area Overview. Define: Area:
 Define: Area: Area Overview Kite: Parallelogram: Rectangle: Rhombus: Square: Trapezoid: Postulates/Theorems: Every closed region has an area. If closed figures are congruent, then their areas are equal.
of surface, 569-571, 576-577, 578-581 of triangle, 548 Associative Property of addition, 12, 331 of multiplication, 18, 433
 Absolute Value and arithmetic, 730-733 defined, 730 Acute angle, 477 Acute triangle, 497 Addend, 12 Addition associative property of, (see Commutative Property) carrying in, 11, 92 commutative property
Geometry of 2D Shapes
 Name: Geometry of 2D Shapes Answer these questions in your class workbook: 1. Give the definitions of each of the following shapes and draw an example of each one: a) equilateral triangle b) isosceles
There are six different windows that can be opened when using SPSS. The following will give a description of each of them.
 SPSS Basics Tutorial 1: SPSS Windows There are six different windows that can be opened when using SPSS. The following will give a description of each of them. The Data Editor The Data Editor is a spreadsheet
The University of the State of New York REGENTS HIGH SCHOOL EXAMINATION MATHEMATICS B. Thursday, January 29, 2004 9:15 a.m. to 12:15 p.m.
 The University of the State of New York REGENTS HIGH SCHOOL EXAMINATION MATHEMATICS B Thursday, January 9, 004 9:15 a.m. to 1:15 p.m., only Print Your Name: Print Your School s Name: Print your name and
PERIMETER AND AREA. In this unit, we will develop and apply the formulas for the perimeter and area of various two-dimensional figures.
 PERIMETER AND AREA In this unit, we will develop and apply the formulas for the perimeter and area of various two-dimensional figures. Perimeter Perimeter The perimeter of a polygon, denoted by P, is the
Chapter 6 Notes: Circles
 Chapter 6 Notes: Circles IMPORTANT TERMS AND DEFINITIONS A circle is the set of all points in a plane that are at a fixed distance from a given point known as the center of the circle. Any line segment
Grade Level: High School
 Lesson I: Triangles- Exterior Angle Theorem KEY WORDS: Triangles, exterior-angle theorem, and remote interior angles. Grade Level: High School SUMMARY: With this investigation students will discover the
Geometry Enduring Understandings Students will understand 1. that all circles are similar.
 High School - Circles Essential Questions: 1. Why are geometry and geometric figures relevant and important? 2. How can geometric ideas be communicated using a variety of representations? ******(i.e maps,
Scatter Plots with Error Bars
 Chapter 165 Scatter Plots with Error Bars Introduction The procedure extends the capability of the basic scatter plot by allowing you to plot the variability in Y and X corresponding to each point. Each
Algebra Geometry Glossary. 90 angle
 lgebra Geometry Glossary 1) acute angle an angle less than 90 acute angle 90 angle 2) acute triangle a triangle where all angles are less than 90 3) adjacent angles angles that share a common leg Example:
UCL Depthmap 7: Data Analysis
 UCL Depthmap 7: Data Analysis Version 7.12.00c Outline Data analysis in Depthmap Although Depthmap is primarily a graph analysis tool, it does allow you to investigate data that you produce. This tutorial
Excel 2007 Basic knowledge
 Ribbon menu The Ribbon menu system with tabs for various Excel commands. This Ribbon system replaces the traditional menus used with Excel 2003. Above the Ribbon in the upper-left corner is the Microsoft
5: Magnitude 6: Convert to Polar 7: Convert to Rectangular
 TI-NSPIRE CALCULATOR MENUS 1: Tools > 1: Define 2: Recall Definition --------------- 3: Delete Variable 4: Clear a-z 5: Clear History --------------- 6: Insert Comment 2: Number > 1: Convert to Decimal
Week 1 Chapter 1: Fundamentals of Geometry. Week 2 Chapter 1: Fundamentals of Geometry. Week 3 Chapter 1: Fundamentals of Geometry Chapter 1 Test
 Thinkwell s Homeschool Geometry Course Lesson Plan: 34 weeks Welcome to Thinkwell s Homeschool Geometry! We re thrilled that you ve decided to make us part of your homeschool curriculum. This lesson plan
EVERY DAY COUNTS CALENDAR MATH 2005 correlated to
 EVERY DAY COUNTS CALENDAR MATH 2005 correlated to Illinois Mathematics Assessment Framework Grades 3-5 E D U C A T I O N G R O U P A Houghton Mifflin Company YOUR ILLINOIS GREAT SOURCE REPRESENTATIVES:
Vector Notation: AB represents the vector from point A to point B on a graph. The vector can be computed by B A.
 1 Linear Transformations Prepared by: Robin Michelle King A transformation of an object is a change in position or dimension (or both) of the object. The resulting object after the transformation is called
Conjunction is true when both parts of the statement are true. (p is true, q is true. p^q is true)
") Mathematical Sentence - a sentence that states a fact or complete idea Open sentence contains a variable Closed sentence can be judged either true or false Truth value true/false Negation not (~) * Statement
Mathematical Sentence - a sentence that states a fact or complete idea Open sentence contains a variable Closed sentence can be judged either true or false Truth value true/false Negation not (~) * Statement
Spreadsheet - Introduction
 CSCA0102 IT and Business Applications Chapter 6 Spreadsheet - Introduction Spreadsheet A spreadsheet (or spreadsheet program) is software that permits numerical data to be used and to perform automatic
The Area of a Triangle Using Its Semi-perimeter and the Radius of the In-circle: An Algebraic and Geometric Approach
 The Area of a Triangle Using Its Semi-perimeter and the Radius of the In-circle: An Algebraic and Geometric Approach Lesson Summary: This lesson is for more advanced geometry students. In this lesson,
Basic Pivot Tables. To begin your pivot table, choose Data, Pivot Table and Pivot Chart Report. 1 of 18
 Basic Pivot Tables Pivot tables summarize data in a quick and easy way. In your job, you could use pivot tables to summarize actual expenses by fund type by object or total amounts. Make sure you do not
Excel Guide for Finite Mathematics and Applied Calculus
 Excel Guide for Finite Mathematics and Applied Calculus Revathi Narasimhan Kean University A technology guide to accompany Mathematical Applications, 6 th Edition Applied Calculus, 2 nd Edition Calculus:
Chapters 6 and 7 Notes: Circles, Locus and Concurrence
 Chapters 6 and 7 Notes: Circles, Locus and Concurrence IMPORTANT TERMS AND DEFINITIONS A circle is the set of all points in a plane that are at a fixed distance from a given point known as the center of
MS Excel. Handout: Level 2. elearning Department. Copyright 2016 CMS e-learning Department. All Rights Reserved. Page 1 of 11
 MS Excel Handout: Level 2 elearning Department 2016 Page 1 of 11 Contents Excel Environment:... 3 To create a new blank workbook:...3 To insert text:...4 Cell addresses:...4 To save the workbook:... 5
CAMI Education linked to CAPS: Mathematics
 - 1 - TOPIC 1.1 Whole numbers _CAPS curriculum TERM 1 CONTENT Mental calculations Revise: Multiplication of whole numbers to at least 12 12 Ordering and comparing whole numbers Revise prime numbers to
Common Core Unit Summary Grades 6 to 8
 Common Core Unit Summary Grades 6 to 8 Grade 8: Unit 1: Congruence and Similarity- 8G1-8G5 rotations reflections and translations,( RRT=congruence) understand congruence of 2 d figures after RRT Dilations
Intermediate Math Circles October 10, 2012 Geometry I: Angles
 Intermediate Math Circles October 10, 2012 Geometry I: Angles Over the next four weeks, we will look at several geometry topics. Some of the topics may be familiar to you while others, for most of you,
Engineering Problem Solving and Excel. EGN 1006 Introduction to Engineering
 Engineering Problem Solving and Excel EGN 1006 Introduction to Engineering Mathematical Solution Procedures Commonly Used in Engineering Analysis Data Analysis Techniques (Statistics) Curve Fitting techniques
Mathematics Georgia Performance Standards
 Mathematics Georgia Performance Standards K-12 Mathematics Introduction The Georgia Mathematics Curriculum focuses on actively engaging the students in the development of mathematical understanding by
Basic AutoSketch Manual
 Basic AutoSketch Manual Instruction for students Skf-Manual.doc of 3 Contents BASIC AUTOSKETCH MANUAL... INSTRUCTION FOR STUDENTS... BASIC AUTOSKETCH INSTRUCTION... 3 SCREEN LAYOUT... 3 MENU BAR... 3 FILE
Introduction to CATIA V5
 Introduction to CATIA V5 Release 16 (A Hands-On Tutorial Approach) Kirstie Plantenberg University of Detroit Mercy SDC PUBLICATIONS Schroff Development Corporation www.schroff.com www.schroff-europe.com
What is a piper plot?
 What is a piper plot? A piper plot is a way of visualizing the chemistry of a rock, soil, or water sample. It s comprised of three pieces: a ternary diagram in the lower left representing the cations,
Target To know the properties of a rectangle
 Target To know the properties of a rectangle (1) A rectangle is a 3-D shape. (2) A rectangle is the same as an oblong. (3) A rectangle is a quadrilateral. (4) Rectangles have four equal sides. (5) Rectangles
If there is not a Data Analysis option under the DATA menu, you will need to install the Data Analysis ToolPak as an add-in for Microsoft Excel.
 If there is not a Data Analysis option under the DATA menu, you will need to install the Data Analysis ToolPak as an add-in for Microsoft Excel. 1. Click on the FILE tab and then select Options from the
56 questions (multiple choice, check all that apply, and fill in the blank) The exam is worth 224 points.
 The exam is worth 224 points.") 6.1.1 Review: Semester Review Study Sheet Geometry Core Sem 2 (S2495808) Semester Exam Preparation Look back at the unit quizzes and diagnostics. Use the unit quizzes and diagnostics to determine which
6.1.1 Review: Semester Review Study Sheet Geometry Core Sem 2 (S2495808) Semester Exam Preparation Look back at the unit quizzes and diagnostics. Use the unit quizzes and diagnostics to determine which
GEOMETRY. Constructions OBJECTIVE #: G.CO.12
 GEOMETRY Constructions OBJECTIVE #: G.CO.12 OBJECTIVE Make formal geometric constructions with a variety of tools and methods (compass and straightedge, string, reflective devices, paper folding, dynamic
In this example, Mrs. Smith is looking to create graphs that represent the ethnic diversity of the 24 students in her 4 th grade class.
 Creating a Pie Graph Step-by-step directions In this example, Mrs. Smith is looking to create graphs that represent the ethnic diversity of the 24 students in her 4 th grade class. 1. Enter Data A. Open