Load Imbalance Analysis
|
|
|
- Rafe Davidson
- 10 years ago
- Views:
Transcription
1 With CrayPat
2 Load Imbalance Analysis Imbalance time is a metric based on execution time and is dependent on the type of activity: User functions Imbalance time = Maximum time Average time Synchronization (Collective communication and barriers) Imbalance time = Average time Minimum time Identifies computational code regions and synchronization calls that could benefit most from load balance optimization Estimates how much overall program time could be saved if corresponding section of code had a perfect balance Represents upper bound on potential savings Assumes other processes are waiting, not doing useful work while slowest member finishes Time% Time Imb Imb Calls Group Time Time% Function PE=HIDE 1000% Total % USER % % 20 jacobi 77% % 10 initmt ============================================================= 12% MPI % % 1590 MPI_Waitall 04% % 3180 MPI_Isend

3 Load Imbalance Analysis Imbalance time percentage represents the percentage of resources available for parallelism that is wasted Imbalance% = 100 X Corresponds to percentage of time that rest of team is not engaged in useful work on the given function Perfectly balanced code segment has imbalance of zero percentage Serial code segment has imbalance of 100 percent Imbalance time Max Time N X N - 1 Time% Time Imb Imb Calls Group Time Time% Function PE=HIDE 1000% Total % USER % % 20 jacobi 77% % 10 initmt ============================================================= 12% MPI % % 1590 MPI_Waitall 04% % 3180 MPI_Isend

4 Load Imbalance Analysis MPI Sync time measures load imbalance in programs instrumented to trace MPI functions to determine if MPI ranks arrive at collectives together Separates potential load imbalance from data transfer Sync times reported by default if MPI functions traced If desired, PAT_RT_MPI_SYNC=0 deactivates this feature Only reported for tracing experiments Time% Time Imb Imb Calls Group Time Time% Function PE=HIDE 1000% Total % MPI_SYNC % % 20 MPI_Barrier(sync) 00% % 550 MPI_Allreduce(sync) 00% % 10 MPI_Init(sync) 00% % 10 MPI_Finalize(sync) ===================================================================

5 Causes and hints What is causing the load imbalance? Need profiler reports like CrayPAT gives for the where Need application expertise for the why Computation Is decomposition appropriate? Would reordering ranks help? Communication Is decomposition appropriate? Would reordering ranks help? Are receives pre-posted? Any All-to-1 communication? I/O synchronous single-writer I/O will cause significant load imbalance already with a couple of MPI tasks (More on IO tomorrow)

6 Rank placement The default ordering can be changed using the following environment variable: export MPICH_RANK_REORDER_METHOD=N These are the different values (N) that you can set it to: N=0: Round-robin placement Sequential ranks are placed on the next node in the list 0, 1, 2, 3, 0, 1, 2, 3 (8 tasks on 4 nodes, 2 tasks per node) N=1: (DEFAULT) SMP-style- (block-) placement 0, 0, 1, 1, 2, 2, 3, 3 (8 tasks on 4 nodes, 2 tasks per node) N=2: Folded rank placement 0, 1, 2, 3, 3, 2, 1, 0 (8 tasks on 4 nodes, 2 tasks per node) N=3: Custom ordering The ordering is specified in a file named MPICH_RANK_ORDER
 N=3: Custom ordering The ordering is specified in a file named")
7 Rank placement with CrayPat When is rank placement a priori useful? Point-to-point communication consumes a significant fraction of program time and a load imbalance detected Also shown to help for collectives (alltoall) on subcommunicators Spread out I/O servers across nodes CrayPat can provide the following feedback ================ Observations and suggestions ======================== MPI Grid Detection: There appears to be point- to- point MPI communication in a 4 X 2 X 8 grid pattern The execution time spent in MPI functions might be reduced with a rank order that maximizes communication between ranks on the same node The effect of several rank orders is estimated below A file named MPICH_RANK_ORDERGrid was generated along with this report and contains usage instructions and the Hilbert rank order from the following table Rank On- Node On- Node MPICH_RANK_REORDER_METHOD Order Bytes/PE Bytes/PE% of Total Bytes/PE Hilbert 5533e+10 Fold 4907e+10 SMP 4883e+10 RoundRobin 3740e % % % % 0 # The 'Custom' rank order in this file targets nodes with multi- core # processors, based on Sent Msg Total Bytes collected for: # # Program: /lus/nid00030/heidi/sweep3d/mod/sweep3dmpi # Ap2 File: sweep3dmpi+pat tap2 # Number PEs: 48 # Max PEs/Node: 4 # # To use this file, make a copy named MPICH_RANK_ORDER, and set the # environment variable MPICH_RANK_REORDER_METHOD to 3 prior to # executing the program # # The following table lists rank order alternatives and the grid_order # command- line options that can be used to generate a new order 0,532,64,564,32,572,96,540,8,596,72,524,40,604,24, ,556,16,628,80,636,56,620,48,516,112,580,88,548,120,612 1,403,65,435,33,411,97,443,9,467,25,499,105,507,41,475 73,395,81,427,57,459,17,419,113,491,49,387,89,451,121,483

8 Hybrid MPI + OpenMP? OpenMP may help Able to spread workload with less overhead Large amount of work to go from all-mpi to (better performing) hybrid - must accept challenge to hybridize large amount of code When does it pay to add OpenMP to my MPI code? Add OpenMP when code is network bound Adding OpenMP to memory bound codes may aggravate memory bandwidth issues, but you have more control when optimizing for cache Look at collective time, excluding sync time: this goes up as network becomes a problem Look at point-to-point wait times: if these go up, network may be a problem If an all-to-all communication pattern becomes a bottleneck, hybridization often overcomes this Hybridization can be used to avoid replicated data

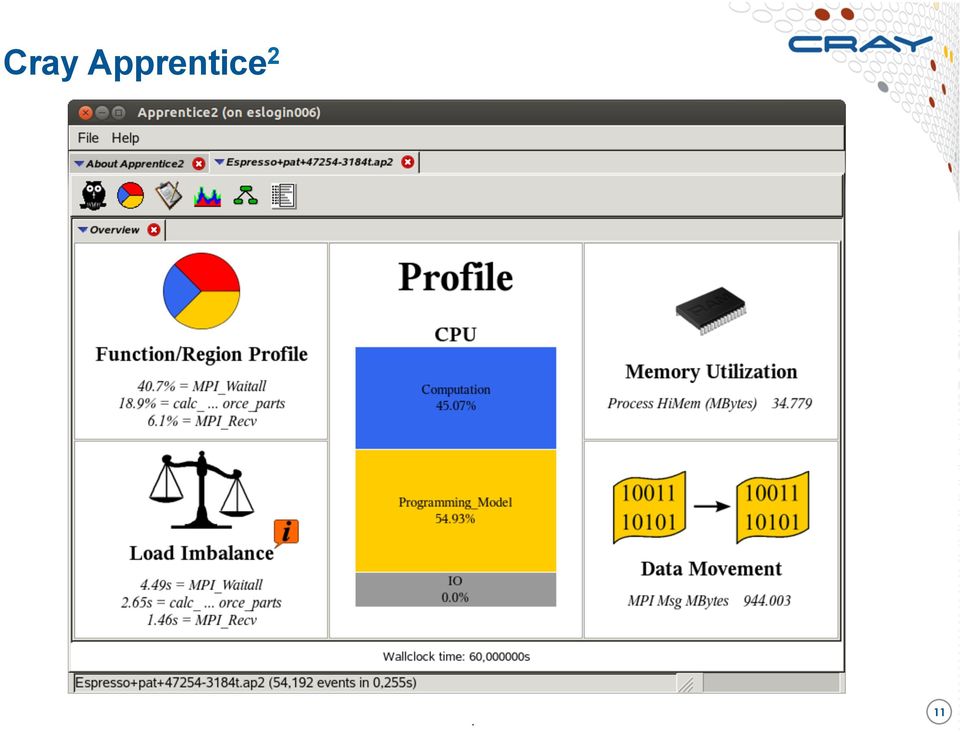
9 Cray Apprentice 2 Cray Apprentice2 is a post-processing performance data visualization tool Takes *ap2 files as input Main features are Call graph profile Communication statistics Time-line view for Communication and IO Activity view Pair-wise communication statistics Text reports Source code mapping Cray Apprentice 2 helps identify: Load imbalance Excessive communication Network contention Excessive serialization I/O Problems > module load perftools > app2 my_programap2 & 10

10 Cray Apprentice 2 11
11 Call Tree View Width ó inclusive time Height ó exclusive time Load balance overview: Height ó Max time Middle bar ó Average time Lower bar ó Min time Yellow represents imbalance time DUH Button: Provides hints for performance tuning Filtered nodes or sub tree Function List Zoom 12

12 Call Tree View Function List Right mouse click: View menu: eg, Filter Right mouse click: Node menu eg, hide/unhide children Sort options % Time, Time, Imbalance % Imbalance time Function List off 13

13 Apprentice 2 Call Tree View of Sampled Data 14

14 Load Balance View (from Call Tree) Min, Avg, and Max Values -1, +1 Std Dev marks 15

15 Time Line View Full trace (sequence of events) enabled by setting PAT_RT_SUMMARY=0 Helpful to see communication bottlenecks Use it only for small experiments! 16

16 Time Line View (Zoom) User Functions, MPI & SHMEM Line I/O Line 17

17 Time Line View (Fine Grain Zoom) 18

Optimization tools. 1) Improving Overall I/O
 Improving Overall I/O") Optimization tools After your code is compiled, debugged, and capable of running to completion or planned termination, you can begin looking for ways in which to improve execution speed. In general, the
Optimization tools After your code is compiled, debugged, and capable of running to completion or planned termination, you can begin looking for ways in which to improve execution speed. In general, the
Basics of VTune Performance Analyzer. Intel Software College. Objectives. VTune Performance Analyzer. Agenda
 Objectives At the completion of this module, you will be able to: Understand the intended purpose and usage models supported by the VTune Performance Analyzer. Identify hotspots by drilling down through
End-user Tools for Application Performance Analysis Using Hardware Counters
 1 End-user Tools for Application Performance Analysis Using Hardware Counters K. London, J. Dongarra, S. Moore, P. Mucci, K. Seymour, T. Spencer Abstract One purpose of the end-user tools described in
ICP Data Validation and Aggregation Module Training document. HHC Data Validation and Aggregation Module Training Document
 HHC Data Validation and Aggregation Module Training Document Contents 1. Introduction... 4 1.1 About this Guide... 4 1.2 Scope... 4 2. Steps for Testing HHC Data Validation and Aggregation Module.. Error!
Performance Monitoring of Parallel Scientific Applications
 Performance Monitoring of Parallel Scientific Applications Abstract. David Skinner National Energy Research Scientific Computing Center Lawrence Berkeley National Laboratory This paper introduces an infrastructure
Also on the Performance tab, you will find a button labeled Resource Monitor. You can invoke Resource Monitor for additional analysis of the system.
 1348 CHAPTER 33 Logging and Debugging Monitoring Performance The Performance tab enables you to view the CPU and physical memory usage in graphical form. This information is especially useful when you
Test Run Analysis Interpretation (AI) Made Easy with OpenLoad
 Made Easy with OpenLoad") Test Run Analysis Interpretation (AI) Made Easy with OpenLoad OpenDemand Systems, Inc. Abstract / Executive Summary As Web applications and services become more complex, it becomes increasingly difficult
Test Run Analysis Interpretation (AI) Made Easy with OpenLoad OpenDemand Systems, Inc. Abstract / Executive Summary As Web applications and services become more complex, it becomes increasingly difficult
Performance Analysis and Optimization Tool
 Performance Analysis and Optimization Tool Andres S. CHARIF-RUBIAL [email protected] Performance Analysis Team, University of Versailles http://www.maqao.org Introduction Performance Analysis Develop
NetBeans Profiler is an
 NetBeans Profiler Exploring the NetBeans Profiler From Installation to a Practical Profiling Example* Gregg Sporar* NetBeans Profiler is an optional feature of the NetBeans IDE. It is a powerful tool that
Linux tools for debugging and profiling MPI codes
 Competence in High Performance Computing Linux tools for debugging and profiling MPI codes Werner Krotz-Vogel, Pallas GmbH MRCCS September 02000 Pallas GmbH Hermülheimer Straße 10 D-50321
InfoScale Storage & Media Server Workloads
 InfoScale Storage & Media Server Workloads Maximise Performance when Storing and Retrieving Large Amounts of Unstructured Data Carlos Carrero Colin Eldridge Shrinivas Chandukar 1 Table of Contents 01 Introduction
- An Essential Building Block for Stable and Reliable Compute Clusters
 Ferdinand Geier ParTec Cluster Competence Center GmbH, V. 1.4, March 2005 Cluster Middleware - An Essential Building Block for Stable and Reliable Compute Clusters Contents: Compute Clusters a Real Alternative
Windows 2003 Performance Monitor. System Monitor. Adding a counter
 Windows 2003 Performance Monitor The performance monitor, or system monitor, is a utility used to track a range of processes and give a real time graphical display of the results, on a Windows 2003 system.
Running a Workflow on a PowerCenter Grid
 Running a Workflow on a PowerCenter Grid 2010-2014 Informatica Corporation. No part of this document may be reproduced or transmitted in any form, by any means (electronic, photocopying, recording or otherwise)
DNS (Domain Name System) is the system & protocol that translates domain names to IP addresses.
 is the system & protocol that translates domain names to IP addresses.") Lab Exercise DNS Objective DNS (Domain Name System) is the system & protocol that translates domain names to IP addresses. Step 1: Analyse the supplied DNS Trace Here we examine the supplied trace of a
Lab Exercise DNS Objective DNS (Domain Name System) is the system & protocol that translates domain names to IP addresses. Step 1: Analyse the supplied DNS Trace Here we examine the supplied trace of a
Parallel Computing. Benson Muite. [email protected] http://math.ut.ee/ benson. https://courses.cs.ut.ee/2014/paralleel/fall/main/homepage
 Parallel Computing Benson Muite [email protected] http://math.ut.ee/ benson https://courses.cs.ut.ee/2014/paralleel/fall/main/homepage 3 November 2014 Hadoop, Review Hadoop Hadoop History Hadoop Framework
The Complete Performance Solution for Microsoft SQL Server
 The Complete Performance Solution for Microsoft SQL Server Powerful SSAS Performance Dashboard Innovative Workload and Bottleneck Profiling Capture of all Heavy MDX, XMLA and DMX Aggregation, Partition,
Comparing the OpenMP, MPI, and Hybrid Programming Paradigm on an SMP Cluster
 Comparing the OpenMP, MPI, and Hybrid Programming Paradigm on an SMP Cluster Gabriele Jost and Haoqiang Jin NAS Division, NASA Ames Research Center, Moffett Field, CA 94035-1000 {gjost,hjin}@nas.nasa.gov
Azure VM Performance Considerations Running SQL Server
 Azure VM Performance Considerations Running SQL Server Your company logo here Vinod Kumar M @vinodk_sql http://blogs.extremeexperts.com Session Objectives And Takeaways Session Objective(s): Learn the
Uncovering degraded application performance with LWM 2. Aamer Shah, Chih-Song Kuo, Lucas Theisen, Felix Wolf November 17, 2014
 Uncovering degraded application performance with LWM 2 Aamer Shah, Chih-Song Kuo, Lucas Theisen, Felix Wolf November 17, 214 Motivation: Performance degradation Internal factors: Inefficient use of hardware
A Framework for Performance Analysis and Tuning in Hadoop Based Clusters
 A Framework for Performance Analysis and Tuning in Hadoop Based Clusters Garvit Bansal Anshul Gupta Utkarsh Pyne LNMIIT, Jaipur, India Email: [garvit.bansal anshul.gupta utkarsh.pyne] @lnmiit.ac.in Manish
So in order to grab all the visitors requests we add to our workbench a non-test-element of the proxy type.
 First in oder to configure our test case, we need to reproduce our typical browsing path containing all the pages visited by the visitors on our systems. So in order to grab all the visitors requests we
MCTS Guide to Microsoft Windows 7. Chapter 10 Performance Tuning
 MCTS Guide to Microsoft Windows 7 Chapter 10 Performance Tuning Objectives Identify several key performance enhancements Describe performance tuning concepts Use Performance Monitor Use Task Manager Understand
Analytics for Performance Optimization of BPMN2.0 Business Processes
 Analytics for Performance Optimization of BPMN2.0 Business Processes Robert M. Shapiro, Global 360, USA Hartmann Genrich, GMD (retired), Germany INTRODUCTION We describe a new approach to process improvement
CMS Manual. Digital Video Network Surveillance System. Unisight Digital Technologies, Inc.
 CMS Manual Digital Video Network Surveillance System Index Overview... 4 Datacenter...4 Run...4 Configuration...5 CMS Settings...9 Functions:...9 Components:...9 Device Manager...17 Functions:...17 Components:...17
Debugging with TotalView
 Tim Cramer 17.03.2015 IT Center der RWTH Aachen University Why to use a Debugger? If your program goes haywire, you may... ( wand (... buy a magic... read the source code again and again and...... enrich
Tools for Performance Debugging HPC Applications. David Skinner [email protected]
 Tools for Performance Debugging HPC Applications David Skinner [email protected] Tools for Performance Debugging Practice Where to find tools Specifics to NERSC and Hopper Principles Topics in performance
Applications. Network Application Performance Analysis. Laboratory. Objective. Overview
 Laboratory 12 Applications Network Application Performance Analysis Objective The objective of this lab is to analyze the performance of an Internet application protocol and its relation to the underlying
<Insert Picture Here> An Experimental Model to Analyze OpenMP Applications for System Utilization
 An Experimental Model to Analyze OpenMP Applications for System Utilization Mark Woodyard Principal Software Engineer 1 The following is an overview of a research project. It is intended
NVIDIA Tools For Profiling And Monitoring. David Goodwin
 NVIDIA Tools For Profiling And Monitoring David Goodwin Outline CUDA Profiling and Monitoring Libraries Tools Technologies Directions CScADS Summer 2012 Workshop on Performance Tools for Extreme Scale
How To Visualize Performance Data In A Computer Program
 Performance Visualization Tools 1 Performance Visualization Tools Lecture Outline : Following Topics will be discussed Characteristics of Performance Visualization technique Commercial and Public Domain
Running applications on the Cray XC30 4/12/2015
 Running applications on the Cray XC30 4/12/2015 1 Running on compute nodes By default, users do not log in and run applications on the compute nodes directly. Instead they launch jobs on compute nodes
Agenda. Enterprise Application Performance Factors. Current form of Enterprise Applications. Factors to Application Performance.
 Agenda Enterprise Performance Factors Overall Enterprise Performance Factors Best Practice for generic Enterprise Best Practice for 3-tiers Enterprise Hardware Load Balancer Basic Unix Tuning Performance
A Brief Survery of Linux Performance Engineering. Philip J. Mucci University of Tennessee, Knoxville [email protected]
 A Brief Survery of Linux Performance Engineering Philip J. Mucci University of Tennessee, Knoxville [email protected] Overview On chip Hardware Performance Counters Linux Performance Counter Infrastructure
MyOra 3.0. User Guide. SQL Tool for Oracle. Jayam Systems, LLC
 MyOra 3.0 SQL Tool for Oracle User Guide Jayam Systems, LLC Contents Features... 4 Connecting to the Database... 5 Login... 5 Login History... 6 Connection Indicator... 6 Closing the Connection... 7 SQL
LS-DYNA Scalability on Cray Supercomputers. Tin-Ting Zhu, Cray Inc. Jason Wang, Livermore Software Technology Corp.
 LS-DYNA Scalability on Cray Supercomputers Tin-Ting Zhu, Cray Inc. Jason Wang, Livermore Software Technology Corp. WP-LS-DYNA-12213 www.cray.com Table of Contents Abstract... 3 Introduction... 3 Scalability
User Reports. Time on System. Session Count. Detailed Reports. Summary Reports. Individual Gantt Charts
 DETAILED REPORT LIST Track which users, when and for how long they used an application on Remote Desktop Services (formerly Terminal Services) and Citrix XenApp (known as Citrix Presentation Server). These
ABAP SQL Monitor Implementation Guide and Best Practices
 ABAP SQL Monitor Implementation Guide and Best Practices TABLE OF CONTENTS ABAP SQL Monitor - What is it and why do I need it?... 3 When is it available and what are the technical requirements?... 5 In
Parallel Scalable Algorithms- Performance Parameters
 www.bsc.es Parallel Scalable Algorithms- Performance Parameters Vassil Alexandrov, ICREA - Barcelona Supercomputing Center, Spain Overview Sources of Overhead in Parallel Programs Performance Metrics for
ANCS+ 8.0 Remote Training: ANCS+ 8.0, Import/Export
 ANCS+ 8.0 Remote Training: ANCS+ 8.0, Import/Export Screen Shot 1. Welcome to ANCS+ 8.0, Import/Export. This course will teach you how to import and export catalog records in ANCS+. A note on conference
Apple Configurator Settings for Deploying ios Devices
 Apple Configurator Settings for Deploying ios Devices Apple Configurator Settings for Deploying ios Devices 1. Preference Settings Preferences in Configurator can be used to manage what happens when supervised
Compute Cluster Server Lab 3: Debugging the parallel MPI programs in Microsoft Visual Studio 2005
 Compute Cluster Server Lab 3: Debugging the parallel MPI programs in Microsoft Visual Studio 2005 Compute Cluster Server Lab 3: Debugging the parallel MPI programs in Microsoft Visual Studio 2005... 1
vrealize Operations Manager User Guide
 vrealize Operations Manager User Guide vrealize Operations Manager 6.0.1 This document supports the version of each product listed and supports all subsequent versions until the document is replaced by
Tool - 1: Health Center
 Tool - 1: Health Center Joseph Amrith Raj http://facebook.com/webspherelibrary 2 Tool - 1: Health Center Table of Contents WebSphere Application Server Troubleshooting... Error! Bookmark not defined. About
Overlapping Data Transfer With Application Execution on Clusters
 Overlapping Data Transfer With Application Execution on Clusters Karen L. Reid and Michael Stumm [email protected] [email protected] Department of Computer Science Department of Electrical and Computer
Tech Tip: Understanding Server Memory Counters
 Tech Tip: Understanding Server Memory Counters Written by Bill Bach, President of Goldstar Software Inc. This tech tip is the second in a series of tips designed to help you understand the way that your
ZOINED RETAIL ANALYTICS. User Guide
 ZOINED RETAIL ANALYTICS User Guide Contents Using the portal New user Profile Email reports Portal use Dashboard Drilling down into the data Filter options Analytics Managing analysis Saving the analysis
A1 Customer Relationship Management (CRM) & Sales Force Management Guide
 & Sales Force Management Guide") A1 Customer Relationship Management (CRM) & Sales Force Management Guide What is CRM? A business that sells a product or service has a need for Customer Relationship Management or CRM. This App was the
A1 Customer Relationship Management (CRM) & Sales Force Management Guide What is CRM? A business that sells a product or service has a need for Customer Relationship Management or CRM. This App was the
DataPA OpenAnalytics End User Training
 DataPA OpenAnalytics End User Training DataPA End User Training Lesson 1 Course Overview DataPA Chapter 1 Course Overview Introduction This course covers the skills required to use DataPA OpenAnalytics
Operations Guide for the HMC and Managed Systems Version 7 Release 3. ESCALA Power6 REFERENCE 86 A1 85FF 00
 Operations Guide for the HMC and Managed Systems Version 7 Release 3 ESCALA Power6 REFERENCE 86 A1 85FF 00 ESCALA Power6 Operations Guide for the HMC and Managed Systems Version 7 Release 3 Hardware April
DROOMS DATA ROOM USER GUIDE. www.drooms.com
 USER GUIDE www.drooms.com USER GUIDE Dear User, Whether simply reviewing documentation, sending queries during the due diligence process or administering a data room yourself, Drooms is the software solution
MPI and Hybrid Programming Models. William Gropp www.cs.illinois.edu/~wgropp
 MPI and Hybrid Programming Models William Gropp www.cs.illinois.edu/~wgropp 2 What is a Hybrid Model? Combination of several parallel programming models in the same program May be mixed in the same source
Main Points. Scheduling policy: what to do next, when there are multiple threads ready to run. Definitions. Uniprocessor policies
 Scheduling Main Points Scheduling policy: what to do next, when there are multiple threads ready to run Or multiple packets to send, or web requests to serve, or Definitions response time, throughput,
Mobile Technique and Features
 Smart evision International, Inc. Mobile Technique and Features Smart evision White Paper Prepared By: Martin Hu Last Update: Oct 16, 2013 2013 1 P a g e Overview Mobile Business intelligence extends and
MAQAO Performance Analysis and Optimization Tool
 MAQAO Performance Analysis and Optimization Tool Andres S. CHARIF-RUBIAL [email protected] Performance Evaluation Team, University of Versailles S-Q-Y http://www.maqao.org VI-HPS 18 th Grenoble 18/22
MarkLogic Server. Monitoring MarkLogic Guide. MarkLogic 8 February, 2015. Copyright 2015 MarkLogic Corporation. All rights reserved.
 Monitoring MarkLogic Guide 1 MarkLogic 8 February, 2015 Last Revised: 8.0-1, February, 2015 Copyright 2015 MarkLogic Corporation. All rights reserved. Table of Contents Table of Contents Monitoring MarkLogic
Symmetric Multiprocessing
 Multicore Computing A multi-core processor is a processing system composed of two or more independent cores. One can describe it as an integrated circuit to which two or more individual processors (called
VMware vrealize Operations for Horizon Administration
 VMware vrealize Operations for Horizon Administration vrealize Operations for Horizon 6.1 This document supports the version of each product listed and supports all subsequent versions until the document
MyOra 3.5. User Guide. SQL Tool for Oracle. Kris Murthy
 MyOra 3.5 SQL Tool for Oracle User Guide Kris Murthy Contents Features... 4 Connecting to the Database... 5 Login... 5 Login History... 6 Connection Indicator... 6 Closing the Connection... 7 SQL Editor...
18-742 Lecture 4. Parallel Programming II. Homework & Reading. Page 1. Projects handout On Friday Form teams, groups of two
 age 1 18-742 Lecture 4 arallel rogramming II Spring 2005 rof. Babak Falsafi http://www.ece.cmu.edu/~ece742 write X Memory send X Memory read X Memory Slides developed in part by rofs. Adve, Falsafi, Hill,
ArcGIS for Server Performance and Scalability: Testing Methodologies. Andrew Sakowicz, [email protected] Frank Pizzi, fpizzi@esri.
 ArcGIS for Server Performance and Scalability: Testing Methodologies Andrew Sakowicz, [email protected] Frank Pizzi, [email protected] Introductions Target audience - GIS, DB, System administrators - Testers
System Copy GT Manual 1.8 Last update: 2015/07/13 Basis Technologies
 System Copy GT Manual 1.8 Last update: 2015/07/13 Basis Technologies Table of Contents Introduction... 1 Prerequisites... 2 Executing System Copy GT... 3 Program Parameters / Selection Screen... 4 Technical
Infor LN Service User Guide for Service Scheduler Workbench
 Infor LN Service User Guide for Service Scheduler Workbench Copyright 2015 Infor Important Notices The material contained in this publication (including any supplementary information) constitutes and contains
Optimizing Application Performance with CUDA Profiling Tools
 Optimizing Application Performance with CUDA Profiling Tools Why Profile? Application Code GPU Compute-Intensive Functions Rest of Sequential CPU Code CPU 100 s of cores 10,000 s of threads Great memory
Introducing the Microsoft IIS deployment guide
 Deployment Guide Deploying Microsoft Internet Information Services with the BIG-IP System Introducing the Microsoft IIS deployment guide F5 s BIG-IP system can increase the existing benefits of deploying
SQL Server 2012 Optimization, Performance Tuning and Troubleshooting
 1 SQL Server 2012 Optimization, Performance Tuning and Troubleshooting 5 Days (SQ-OPT2012-301-EN) Description During this five-day intensive course, students will learn the internal architecture of SQL
NETWORK PRINT MONITOR User Guide
 NETWORK PRINT MONITOR User Guide Legal Notes Unauthorized reproduction of all or part of this guide is prohibited. The information in this guide is subject to change without notice. We cannot be held liable
Default Thresholds. Performance Advisor. Adaikkappan Arumugam, Nagendra Krishnappa
 Default Thresholds Performance Advisor Adaikkappan Arumugam, Nagendra Krishnappa Monitoring performance of storage subsystem and getting alerted at the right time before a complete performance breakdown
Quick Start Guide. www.uptrendsinfra.com
 Quick Start Guide Uptrends Infra is a cloud service that monitors your on-premise hardware and software infrastructure. This Quick Start Guide contains the instructions to get you up to speed with your
FIGURE 33.5. Selecting properties for the event log.
 1358 CHAPTER 33 Logging and Debugging Customizing the Event Log The properties of an event log can be configured. In Event Viewer, the properties of a log are defined by general characteristics: log path,
TRACE PERFORMANCE TESTING APPROACH. Overview. Approach. Flow. Attributes
 TRACE PERFORMANCE TESTING APPROACH Overview Approach Flow Attributes INTRODUCTION Software Testing Testing is not just finding out the defects. Testing is not just seeing the requirements are satisfied.
Chapter 2: Getting Started
 Chapter 2: Getting Started Once Partek Flow is installed, Chapter 2 will take the user to the next stage and describes the user interface and, of note, defines a number of terms required to understand
Energy Dashboards And Report Tool
 SUS T A I N A B L E O N E S T O P S O L U T I O N S F O R A N Y B U I L D I N G I N V I R O N M E N T Johnson Controls is a global diversified technology and industrial leader serving customers in over
The Hadoop Distributed File System
 The Hadoop Distributed File System The Hadoop Distributed File System, Konstantin Shvachko, Hairong Kuang, Sanjay Radia, Robert Chansler, Yahoo, 2010 Agenda Topic 1: Introduction Topic 2: Architecture
QT9 Quality Management Software
 QT9 Supplier Portal Support is Free. Please contact us via the Contact Support help icon on the top of the screen or at our contact information below: QT9 Software Toll Free: (866) 913-5022 Email: [email protected]
Universal Simple Control, USC-1
 Universal Simple Control, USC-1 Data and Event Logging with the USB Flash Drive DATA-PAK The USC-1 universal simple voltage regulator control uses a flash drive to store data. Then a propriety Data and
Bottleneck Detection in Parallel File Systems with Trace-Based Performance Monitoring
 Julian M. Kunkel - Euro-Par 2008 1/33 Bottleneck Detection in Parallel File Systems with Trace-Based Performance Monitoring Julian M. Kunkel Thomas Ludwig Institute for Computer Science Parallel and Distributed
This presentation covers virtual application shared services supplied with IBM Workload Deployer version 3.1.
 This presentation covers virtual application shared services supplied with IBM Workload Deployer version 3.1. WD31_VirtualApplicationSharedServices.ppt Page 1 of 29 This presentation covers the shared
Solving Performance Problems In SQL Server by Michal Tinthofer
 Solving Performance Problems In SQL Server by Michal Tinthofer [email protected] GOPAS: info@gopas,sk www.gopas.sk www.facebook.com/gopassr Agenda Analyze the overall Sql Server state Focus on
Job Scheduling Explained More than you ever want to know about how jobs get scheduled on WestGrid systems...
 Job Scheduling Explained More than you ever want to know about how jobs get scheduled on WestGrid systems... Martin Siegert, SFU Cluster Myths There are so many jobs in the queue - it will take ages until
Database Studio is the new tool to administrate SAP MaxDB database instances as of version 7.5.
 1 2 3 4 Database Studio is the new tool to administrate SAP MaxDB database instances as of version 7.5. It replaces the previous tools Database Manager GUI and SQL Studio from SAP MaxDB version 7.7 onwards
Deep Dive: Maximizing EC2 & EBS Performance
 Deep Dive: Maximizing EC2 & EBS Performance Tom Maddox, Solutions Architect 2015, Amazon Web Services, Inc. or its affiliates. All rights reserved What we ll cover Amazon EBS overview Volumes Snapshots
One of the database administrators
 THE ESSENTIAL GUIDE TO Database Monitoring By Michael Otey SPONSORED BY One of the database administrators (DBAs) most important jobs is to keep the database running smoothly, which includes quickly troubleshooting
PORTAL ADMINISTRATION
 1 Portal Administration User s Guide PORTAL ADMINISTRATION GUIDE Page 1 2 Portal Administration User s Guide Table of Contents Introduction...5 Core Portal Framework Concepts...5 Key Items...5 Layouts...5
sql server best practice
 sql server best practice 1 MB file growth SQL Server comes with a standard configuration which autogrows data files in databases in 1 MB increments. By incrementing in such small chunks, you risk ending
Monitoring Replication
 Monitoring Replication Article 1130112-02 Contents Summary... 3 Monitor Replicator Page... 3 Summary... 3 Status... 3 System Health... 4 Replicator Configuration... 5 Replicator Health... 6 Local Package
VMS A1 Client Software. User Manual (V2.0)
") VMS A1 Client Software User Manual (V2.0) Contents Chapter 1 Overview...4 1.1 Description...4 1.2 Running Environment...4 1.3 Function Modules...5 Chapter 2 Live View...7 2.1 User Registration and Login...7
VMS A1 Client Software User Manual (V2.0) Contents Chapter 1 Overview...4 1.1 Description...4 1.2 Running Environment...4 1.3 Function Modules...5 Chapter 2 Live View...7 2.1 User Registration and Login...7
ScrumDesk Quick Start
 Quick Start 2008 2 What is ScrumDesk ScrumDesk is project management tool supporting Scrum agile project management method. ScrumDesk demo is provided as hosted application where user has ScrumDesk installed
This exhibit describes how to upload project information from Estimator (PC) to Trns.port PES (server). Figure 1 summarizes this process.
 to Trns.port PES (server). Figure 1 summarizes this process.") Facilities Development Manual Chapter 19 Plans, Specifications and Estimates Section 5 Estimates Wisconsin Department of Transportation Exhibit 10.5 Uploading project from Estimator to Trns port PES September
Facilities Development Manual Chapter 19 Plans, Specifications and Estimates Section 5 Estimates Wisconsin Department of Transportation Exhibit 10.5 Uploading project from Estimator to Trns port PES September
Project Management within ManagePro
 Project Management within ManagePro This document describes how to do the following common project management functions with ManagePro: set-up projects, define scope/requirements, assign resources, estimate
Using the Local Document Organizer in ProjectWise
 Using the Local Document Organizer in ProjectWise ProjectWise stores copies of files on your local computer when you access them to provide the best performance over the state-wide network. The Local Document
Database Performance Report Using PivotalVRP
 Database Performance Report Using PivotalVRP Sample Report Date: July 2013 Created by: Shahar Harap Table of Content 1. Executive Summary... 3 2. Overall resource consumption overview... 4 2.1. Peak investigation...
Load Testing Hyperion Applications Using Oracle Load Testing 9.1
 Oracle White Paper Load Testing Hyperion System 9 HFM An Oracle White Paper May 2010 Load Testing Hyperion Applications Using Oracle Load Testing 9.1 Oracle White Paper Load Testing Hyperion System 9 HFM
QAD Business Intelligence Dashboards Demonstration Guide. May 2015 BI 3.11
 QAD Business Intelligence Dashboards Demonstration Guide May 2015 BI 3.11 Overview This demonstration focuses on one aspect of QAD Business Intelligence Business Intelligence Dashboards and shows how this