Stop Investing and Start Trading. How I Trade Technical Strategies Over Fundamental Strategies
|
|
|
- Virgil Boyd
- 8 years ago
- Views:
Transcription
1 Stop Investing and Start Trading How I Trade Technical Strategies Over Fundamental Strategies

2 PREPARATION PRIOR TO OPENING MARKET 1. On Daily Log Sheet record NAV [Net Asset Value] of portfolio. 2. Note exact cash. Note percent cash position relative to whole portfolio. 3. Note percent of positions where price>price at purchase. 4. Review each chart in portfolio.


3 REVIEW EACH CHART 1. Print copy of portfolio and place in log. 2. Check each chart for bracket. a. Is the stop at the desired price? b. Is the target at the desired price? c. Change bracket before market opening. d. Move brackets up as market moves up, if you are long. Opposite if shorting. e. NEVER HAVE A LONG POSITION WITHOUT A STOP EVER!

4 PLACING BRACKET 1. Place stop at 4.5% below purchase price. Place horizontal line on chart. 2. Place target at upper Keltner Line or on the trend line of higher highs, if stock is trending up. 3. NEVER FUDGE THE STOP DOWNWARD.

5 ESTABLISH THE PULSE OF THE MARKET 1. Use the Wilshire 5000 Index. 2. Array Monthly, Weekly, Daily, 60 Minute and 10 Minute Bar Charts. 3. Assign value to each time frame: a. I if uptrend. [Three green bars in a row]. b. II if a top [One red of three bars]. c. III if down trend [Three red bars in a row]. d. IV if flat after down trend. [Red/green mix].

6 PULSE OF MARKET Monthly Bar Chart Sept 4 Read II

7 PULSE OF MARKET Weekly Bar Chart Read II

8 PULSE OF MARKET Daily Bar Chart Read IV

9 PULSE OF MARKET 60 Minute Bar Chart Read II

10 PULSE OF MARKET 10 Minute Bar Chart Read IV


11 COMPARE TIME FRAMES
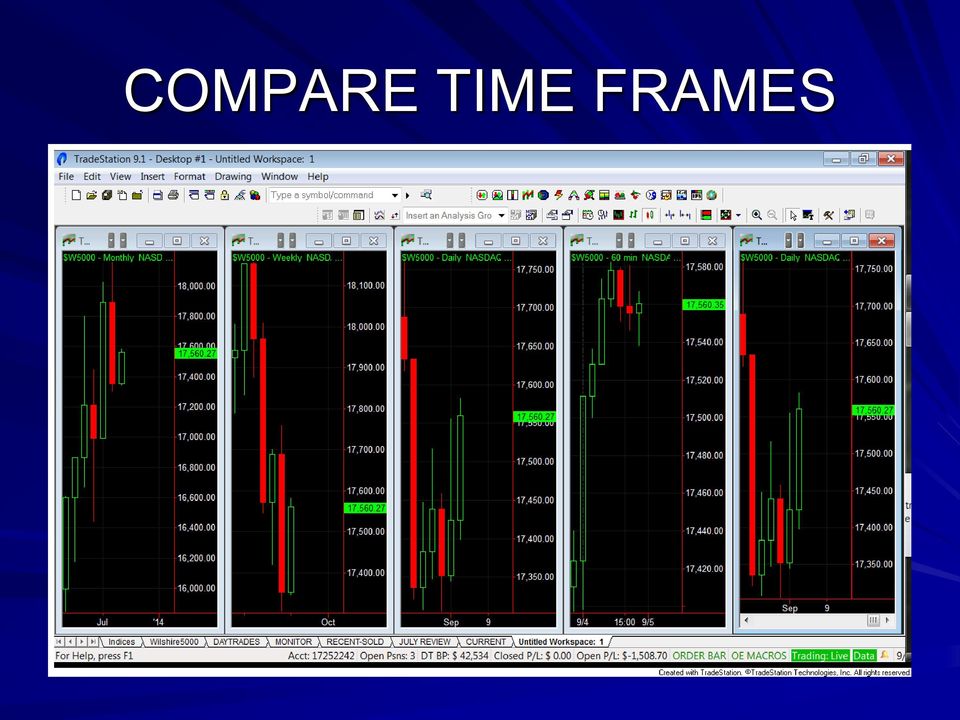
12 RECORD PULSE IN LOG 1. For prospective long term positions, check monthly, weekly, daily chart. 2. For short term or swing trades check, weekly, daily and 60 minute chart. 3. For day trades, check daily, 60 minute and 10 minute chart. 4. At close of trading day or next morning, check your prediction. Keep a record!

13 STANDARDIZE TRADING CHARTS WITH INDICATORS 1. Keltner Channel. 2. MACD. 3. Moving Average Exponential. 4. Parabolic SAR. 5. Stochastic Fast. 6. Set computer so all charts come up with standard appearance.

14 PRIOR TO MARKET OPENING 1. Check Day Trading Charts. 2. Stops under open positions? 3. Select charts for possible trades.

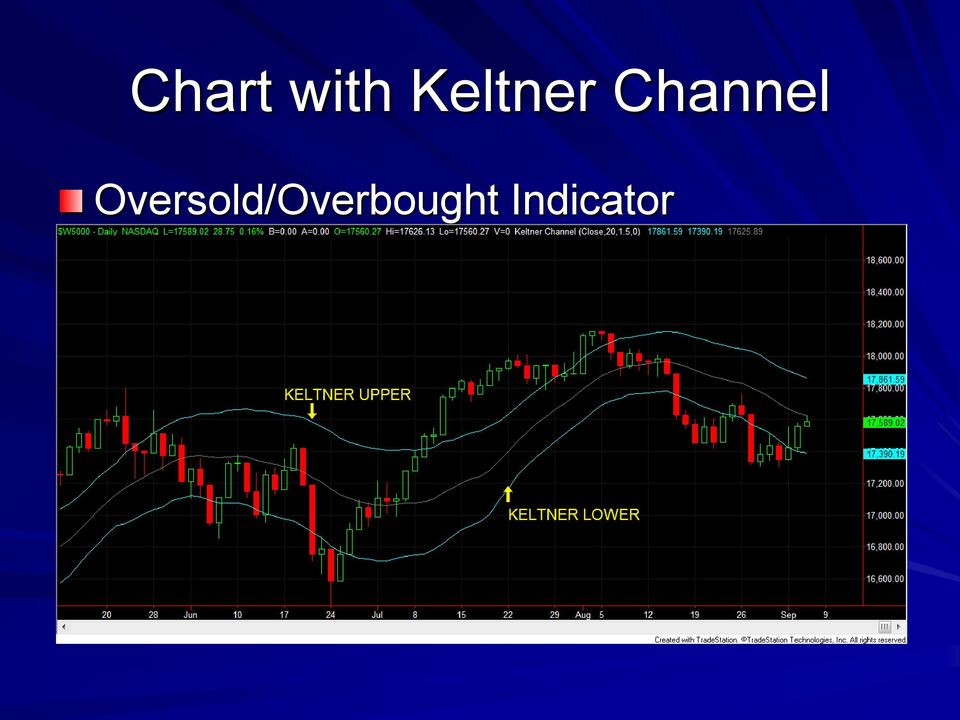
15 KELTNER CHANNEL The Keltner Channel indicator is used to identify overbought / oversold conditions as well as the trend strength of a market. When an asset s price is closer to the upper band than the lower band, the market is considered overbought. Conversely, when an asset s price is closer to the bottom band than the upper band, the market is considered oversold. An advantage of Keltner Channel analysis compared to other indicators used to analyze trend strength is that market lag is not as pronounced, because Keltner Channels are extremely sensitive to fluctuations in volatility. 94% of all prices fall within Keltner Channels.

16 Chart with Keltner Channel Oversold/Overbought Indicator

17 MACD The Moving Average Convergence Divergence indicator calculates 2 exponential moving averages of the lengths specified by the inputs FastLength and SlowLength. The difference between these 2 averages is then plotted as the MACD. This value is also averaged for the number of bars specified by the input MACDLength and then plotted as the MACDAvg. Finally, the difference between the MACD and the MACD average is calculated and plotted as the MACDDiff. As a trend-following indicator, the MACD may be interpreted similarly to other moving averages. When the MACD crosses above the MACD Average, it may be the beginning of an uptrend. Conversely, when the MACD crosses below the MACD Average, it may be the beginning of a downtrend. As an oscillator, the MACD can indicate overbought and oversold conditions.

18 Add MACD Indicator Trend indicator

19 Exponential Moving Average The moving average may be the most widely used indicator. The Mov Avg Exponential indicator calculates and plots an exponentially weighted average of prices, specified by the Price input, from each of the most recent number of bars specified by the Length input. This method of calculating a Moving Average gives greater weight to the market s most recent price and a reduced weighting to older prices. (A simple moving average gives equal weight to all the prices in the series.) A moving average is generally used for trend identification. Attention is given to the direction in which the average is moving and to the relative position of prices and the moving average. Rising moving average values (direction) and prices above the moving average (position) would indicate an uptrend. Declining moving average values and prices below the moving average would indicate a downtrend.
 A moving average is generally used for trend identification.")

20 Add Exponential Moving Ave Trend Indicator

21 Fast Stochastic Indicator The Stochastic Fast indicator calculates the location of a current price in relation to its range over a period of bars. The default settings are to use the most recent 14 bars (input StochLength), the high and low of that period to establish a range (input PriceH and PriceL) and the close as the current price (input PriceC). This calculation is then indexed and plotted as FastK. A smoothed average of FastK, known as FastD, is also plotted. FastK and FastD plot as oscillators with values from 0 to 100. The direction of the Stochastics should confirm price movement. For example, rising Stochastics confirm rising prices. Stochastics can also help identify turning points when there are nonconfirmations or divergences. For example, a new high in price without a new high in Stochastics may indicate a false breakout. Stochastics are also used to identify overbought and oversold conditions when the Stochastics reach extreme highs or lows. Additionally, FastK crossing above the smoother FastD can be a buy signal and vice versa.

22 Add Stochastic Fast Indicator An Oscillator with value from 0-100
23 Parabolic SAR INDICATOR Market Synopsis The Parabolic SAR indicator, based on Welles Wilder s Parabolic Time/Price Strategy, is based on the relationship between a market s price and time. It is used to determine when to stop and reverse (SAR) a position utilizing time/price-based stops. Once a Parabolic SAR is reached, the current position is exited and a new position in the opposite direction is taken. It is primarily used in trending markets and is based on always having a position in the market. The indicator may also be used to determine stop points and estimating when you would reverse a position and take a trade the opposite direction. The indicator derives its name from the fact that when charted, the pattern resembles a parabola or French curve.

24 Add Parabolic SAR Shown here by itself for clarity.
25 PRIOR TO MARKET OPEN 1. Check Charts of Day Trading Open Positions. Be sure stops on ALL. 2. If trading in a margin account, note buying power [BP] available at open. 3. Check ticker for stocks on the move a good source for day traders. 4. Trade these BEFORE OPEN. 5. Have list of all prospective trades ready. 6. Do research and analysis before trading day. Use trading day for implementing plan and monitoring and managing positions.
26 THE MARKET OPENS 1. Monitor the non-day trade portfolio after the first hour of trading and readjust brackets for each chart, if market moving up. 2. Monitor: a. Sector website [ for sector leaders for day, week, month. b. Map of the Market [ for day s activity.
27 WHAT I TRADE 1. The pool is made up of Stocks, ETFs, Bond Funds, ADRs and Currency Funds on US Exchanges only. 2. Pool is maintained under following categories; a. Basic Agriculture. k. Finance. b. Bond Funds. l. Gaming. c. Bulk Shipping. m. Gold. d. Commodities. n. Health. e. Consumer. o. Infrastructure. f..countries. p. Leisure. g. Currency q. Materials. h. Dollar. r. REITS. i. Energy. s. Tech. j. ETFs t. TIPs. u. Yield.
28 SOURCE OF THE POOL 1. Barron s Recommendation. 2. Select leaders from Sector Tracker 3. TradeStation Hot Lists 4. Investors Business Daily [IBD]. a. Stocks on the move. b. Screen of the day. c. Top sector performers. d. CAN SLIM SELECT. e. Tech Leader. f. International.
29 CAN SLIM SELECT The CAN SLIM Select stock list tracks market-leading stocks that in general show strong earnings growth, positive institutional sponsorship, excellent industry strength, and solid sales growth, profit margins and return on equity. Stocks must also meet minimum price and volume levels Read More At Investor's Business Daily: Follow on Twitter InvestorsBusinessDaily on Facebook
30 MY 7 TRADING STRATAGIES Buy the OVERSOLD POINT. 1. On a TREND chart. 2. On SINE pattern chart. 3. On PENNANT pattern chart. 4. On RECTANGLE pattern chart. 5. On DOWN pattern only at end. 6. On DIP pattern special situation. 7. At bottom of market. 8. Weekly chart more important than Daily.

31 TECHNICAL RULES for 1.Trend Strategy Find oversold price on weekly bar chart

32 TECHNICAL RULES for 1.Trend Strategy 2. Confirm oversold price on daily bar chart.
33 2. SINE PATTERN STRATEGY

34 SINE PATERN ALSO A TREND ON WEEKLY CHART Note moving averages.

35 3. PENNANT PATTERN STRATEGY Note how SAR indicator is complementary

36 4. RECTANGLE PATTERN STRATEGY Look for lowest points in rectangle
37 5. DOWN TREND STRATEGY Wait for pulse of the market to turn I

38 WAIT FOR OVERSOLD POINT Four points over 2 ½ years

39 6.Oversold on the DIP Strategy Bad things happen to good companies

40 7. BOTTOM STRATEGY Monthly chart helps define bottom

41 MONITORING BOND MARKET Pimco Corporate Bond Fund as indicator
42 EXAMPLE TRADE ROUTINE KMP [Kinder Morgan Energy Partners] Oversold buy point in RECTANGLE. Confirmatory information. a. IBD RATING. b. Yield confirmed. Use MSN Money site. c. Analysts rating. Place Limit Order. Go to Market order, if it does not fill. Check Matrix for decision. Place bracket immediately.

43 KMP [RECTANGLE STRAGEGY] Note Oversold Point
44 IBD RATING [ 58 out of 100. About KMP: MLP ENGAGED IN THE OWNERSHIP AND MANAGEMENT OF ENERGY PERFORMANCE WITHIN GROUP (KMP) KINDER MORGAN ENERGY LP RANK WITHIN THE OIL&GAS-TRANSPRT/PIPELNE GROUP (59 STOCKS) Composite Rating 58 Rank within Group: 15th 76% EPS Rating 76 Rank within Group: 12th 81% Relative Strength Rating 32 Rank within Group: 52nd 13% SMR Rating A Rank within Group: 4th 94% Acc/Dist. Rating C- Rank within Group: 32nd 47% Read More At Investor's Business Daily: Follow on Twitter InvestorsBusinessDaily on Facebook
45 Yield Confirmed/ Analysts Rating Yield= 6.57% Source: Analyst Rating= Source: ts/analyst-ratings/?symbol=kmp

46 TRADE PLACE LIMIT ORDER PLACE ORDER BELOW MARKET
47 RECORD ON CHART Bracket placed on trade
48 WHEN TO SELL 1. Automatic when price hits TARGET. 2. By choice if Pulse of Market changes sell or move stop up very tight in which case bracket remains in place or market deteriorates and stop out occurs. Use 60 min or 30 min chart for precision. 3. Automatic when price hits STOP.
49 RECORD MONTHLY TRADING RECORD Use EXCEL SPREAD SHEET. RECORD: Date Symbol Purchase price Sale price Number of shares Gain or Loss %Gain or Loss Days Held Strategy Used
50 Monthly Homework Review Pool at start of each month. Place oversold prospects in Month Tab. Use Month Tab to select trades.
51 EDUCATION TRADERS WORLD Two international meetings each year. October in Las Vegas and February in NYC. Faculty of lecturers Book Mart. PLATFORM TUTORIALS Each trading platform has tutorials to allow progressive improvement. Consultants to answer questions such as flash crashes
52 WHERE IS THE FRONTIER? 1. Index Trading 2. Program Trading 3. Advances in Trading Platforms; TradeStation. Charles Schwab. Interactive Traders E-Trade [Think or Swim. Chart services: StockCharts.com and tradingview.com
53 TRADING HISTORY : Large Cap Buy and Hold. Keogh Plan 72-78: Fiduciary Trust NY.[4% per year] : Buy and Hold Tech +NY Bonds : Eggs-in-one-Basket and conversion to Roth IRA Diverse + Preferreds+Bonds with 8 % stops. Partially advised [Lord Abbott]. 2008:Out of Market 6 months. Avoided 25% of crash : Evolution of Present Trading System. 2013: Yield 7%+ with disciplined strategy described.
Chapter 2.3. Technical Analysis: Technical Indicators
 Chapter 2.3 Technical Analysis: Technical Indicators 0 TECHNICAL ANALYSIS: TECHNICAL INDICATORS Charts always have a story to tell. However, from time to time those charts may be speaking a language you
MATHEMATICAL TRADING INDICATORS
 MATHEMATICAL TRADING INDICATORS The mathematical trading methods provide an objective view of price activity. It helps you to build up a view on price direction and timing, reduce fear and avoid overtrading.
Advanced Trading Systems Collection MACD DIVERGENCE TRADING SYSTEM
 MACD DIVERGENCE TRADING SYSTEM 1 This system will cover the MACD divergence. With this trading system you can trade any currency pair (I suggest EUR/USD and GBD/USD when you start), and you will always
Technical Analysis. Technical Analysis. Schools of Thought. Discussion Points. Discussion Points. Schools of thought. Schools of thought
 The Academy of Financial Markets Schools of Thought Random Walk Theory Can t beat market Analysis adds nothing markets adjust quickly (efficient) & all info is already in the share price Price lies in
Chapter 2.3. Technical Indicators
 1 Chapter 2.3 Technical Indicators 0 TECHNICAL ANALYSIS: TECHNICAL INDICATORS Charts always have a story to tell. However, sometimes those charts may be speaking a language you do not understand and you
How I Trade Profitably Every Single Month without Fail
 How I Trade Profitably Every Single Month without Fail First of all, let me take some time to introduce myself to you. I am Kelvin and I am a full time currency trader. I have a passion for trading and
Disclaimer: The authors of the articles in this guide are simply offering their interpretation of the concepts. Information, charts or examples
 Disclaimer: The authors of the articles in this guide are simply offering their interpretation of the concepts. Information, charts or examples contained in this lesson are for illustration and educational
A GUIDE TO WL INDICATORS
 A GUIDE TO WL INDICATORS GETTING TECHNICAL ABOUT TRADING: USING EIGHT COMMON INDICATORS TO MAKE SENSE OF TRADING What s a technical indicator and why should I use them? What s the market going to do next?
Methods to Trade Forex Successfully for Quick Profits
 Methods to Trade Forex Successfully for Quick Profits This article is devoted to the techniques that are used to trade Forex on an intraday basis for quick profits. The aim is to make the trading a successful
ID ING WHEN TO BUY AND SELL USING THE STOCHASTIC OSCILLATOR
 ID ING WHEN TO BUY AND SELL USING THE STOCHASTIC OSCILLATOR By Wayne A. Thorp Stochastics work best with those securities that are currently trading within a particular range and may prove useful in identifying
Trend Determination - a Quick, Accurate, & Effective Methodology
 Trend Determination - a Quick, Accurate, & Effective Methodology By; John Hayden Over the years, friends who are traders have often asked me how I can quickly determine a trend when looking at a chart.
Definitions to Basic Technical Analysis Terms. www.recognia.com
 Definitions to Basic Technical Analysis Terms www.recognia.com A Alert An alert is a notification sent when a significant event occurs in one or more investments of importance to a trader. Recognia sends
My Techniques for making $150 a Day Trading Forex *Note for my more Advanced Strategies check out my site: Click Here
 My Techniques for making $150 a Day Trading Forex *Note for my more Advanced Strategies check out my site: Click Here The Strategy We will be looking at 2 different ways to day trade the Forex Markets.
I Really Trade. Trading Patterns for Stocks & Commodities. Introducing The False Break Buy and Sell Pattern
 2008 Trading Patterns for Stocks & Commodities It doesn t matter if you are a longterm investor, short swing trader or day trader, you are always looking for an advantageous spot to enter your position.
THE MACD: A COMBO OF INDICATORS FOR THE BEST OF BOTH WORLDS
 THE MACD: A COMBO OF INDICATORS FOR THE BEST OF BOTH WORLDS By Wayne A. Thorp Moving averages are trend-following indicators that don t work well in choppy markets. Oscillators tend to be more responsive
8 Day Intensive Course Lesson 5 Stochastics & Bollinger Bands
 8 Day Intensive Course Lesson 5 Stochastics & Bollinger Bands A)Trading with Stochastic Trading With Stochastic What is stochastic? Stochastic is an oscillator that works well in range-bound markets.[/i]
Chapter 1 Introduction Disclaimer: Forex Involves risk. So if you lose money you can't blame us we told you trading involves risk.
 By Casey Stubbs -Winners Edge Trading.com Table of Contents Chapter 1. Introduction Chapter 2.. Trading Plan Chapter 3.. Money Management Chapter 4. Moving Average Strategy Chapter 5. Stochastic Strategy
Day Trade System EZ Trade FOREX
 Day Trade System The EZ Trade FOREX Day Trading System is mainly used with four different currency pairs; the EUR/USD, USD/CHF, GBP/USD and AUD/USD, but some trades are also taken on the USD/JPY. It uses
CYCLE TIMING CAN IMPROVE YOUR TIMING PERFORMANCE by Walter Bressert, CTA
 CYCLE TIMING CAN IMPROVE YOUR TIMING PERFORMANCE by Walter Bressert, CTA The HOLY GRAIL OF TRADING is: Trade with the trend; if up, buy the dips; if down, sell the rallies. With cycles you can identify
Technical Indicators Tutorial - Forex Trading, Currency Forecast, FX Trading Signal, Forex Training Cour...
 Page 1 Technical Indicators Tutorial Technical Analysis Articles Written by TradingEducation.com Technical Indicators Tutorial Price is the primary tool of technical analysis because it reflects every
Take it E.A.S.Y.! Dean Malone 4X Los Angeles Group - HotComm January 2007
 Take it E.A.S.Y.! Dean Malone 4X Los Angeles Group - HotComm January 2007 Dean Malone Partner of Compass Foreign Exchange, LLC. Co-Founder of Forex Signal Service.com. Previous Senior National for 4X Made
Professional Trader Series: Moving Average Formula & Strategy Guide. by John Person
 Professional Trader Series: Moving Average Formula & Strategy Guide by John Person MOVING AVERAGE FORMULAS & STRATEGY GUIDE In an online seminar conducted for the Chicago Board of Trade, I shared how to
The 15 50 Trading System
 Main Premise: This is considered to be one of the most straight forward systems for a live trading style for day- and/or intraday trading. The 50 SMA is one of the most commonly used moving average numbers
Technical Indicators Explained
 Chapter I. Technical Indicators Explained In This Chapter The information in this chapter is provided to help you learn how to use the technical indicators that are available for charting on the AIQ TradingExpert
FOREX analysing made easy
 FOREX analysing made easy UNDERSTANDING TECHNICAL ANALYSIS An educational tool by Blackwell Global Contents Technical Analysis 2 Line Chart 3 Bar Chart 4 Candlestick Chart 5 Support and Resistance 6 Fibonacci
THE CYCLE TRADING PATTERN MANUAL
 TIMING IS EVERYTHING And the use of time cycles can greatly improve the accuracy and success of your trading and/or system. THE CYCLE TRADING PATTERN MANUAL By Walter Bressert There is no magic oscillator
High Probability Trading Triggers for Gold & Silver
 Welcome to a CBOT Online Seminar High Probability Trading Triggers for Gold & Silver Presented by: John Person Sponsored by Interactive Brokers Live Presentation Starts at 3:30 PM Chicago Time NOTE: Futures
Ed Heath s Guerilla Swing Trading Plan (as of 1/22/13)
") Ed Heath s Guerilla Swing Trading Plan (as of 1/22/13) Synopsis: I call my trading style Guerilla Swing Trading. I trade upward momentum stocks that have pulled back for a buying opportunity and my goal
Ed Heath s Guerilla Swing Trading Plan (as of 1/22/13) Synopsis: I call my trading style Guerilla Swing Trading. I trade upward momentum stocks that have pulled back for a buying opportunity and my goal
Leon Wilson Trading Success
 Leon Wilson Trading Success A talk given by Mary de la Lande to the BullCharts User Group Meeting on 13 February 2008 1. Who is Leon Wilson? His Books and where to get them. 2. Book 1: The Business of
This library is included for Platinum Club members, and may be purchased separately for the Gold version of Trade Navigator.
 Planetary 2 Library I C H I M O K U C L O U D L I B R A R Y Introduction: In 1969, Goichi Hosada, a journalist in Tokyo, developed a very versatile indicator that has withstood the test of time. The Ichimoku
TOMORROW'S TRADING TECHNOLOGY. 100% automated Fibonacci support and resistance levels that you can count on every single trading day in an instant.
 TOMORROW'S TRADING TECHNOLOGY 100% automated Fibonacci support and resistance levels that you can count on every single trading day in an instant. ProTrader Table of Contents 1. Areas A. Fibonacci Confluence
atching Currency Moves with The Schaff Trend Cycle Indicator
 JULY/AUGUST 2002. VOLUME 4 CRunning a trend indicator through a cycle oscillator creates an effective entry technique into today s strongly trending currency markets, says Doug Schaff, a 20-year veteran
6.14. Oscillators and Indicators.
 6.14. Oscillators and Indicators. What is Momentum? The word momentum has two meanings to market technicians, one of them is a generic concept about how prices move, and the second one is a specific indicator.
BULLS ON WALL ST. 60 DAY TRADING BOOTCAMP
 BULLS ON WALL ST. 60 DAY TRADING BOOTCAMP Lead Instructor Kunal Desai Assistant Instructors Maribeth Willoughby Dr. Andrew Menaker Course Description This 60 day course teaches a setup based system to
FreeStockCharts.com Workbook
 FreeStockCharts.com Workbook Updated March 2010 FREESTOCKCHARTS.COM WORKBOOK Worden Brothers, Inc. www.worden.com Five Oaks Office Park 4905 Pine Cone Drive Durham, NC 27707 0 FREESTOCKCHARTS.COM WORKBOOK
Commitment of Traders How to Follow the Professionals
 Commitment of Traders How to Follow the Professionals It's not the Holy Grail but the Commitment of Traders report gives an insight into valuations and what levels the Professionals consider over-bought
Thinking Man s Trader
 Thinking Man s Trader Advanced Trader s Package Trading is a three dimensional world and the Advanced Trader s Package covers all three. Dimension three: Market Dynamics, conditions and change of conditions
BROKER SERVICES AND PLATFORM
 BROKER SERVICES AND PLATFORM A broker is an individual who executes buy and sell orders and get commission in the form of SPREAD (I will talk about SPREAD in the subsequent lessons). You trade through
NEDBANK PRIVATE WEALTH STOCKBROKERS Graphical Analysis Manual
 This advanced charting application displays interactive, feature-rich, automatically-updated financial charts; The application also provides you with the ability to perform advanced technical analysis
The Logic Of Pivot Trading
 Stocks & Commodities V. 6: (46-50): The Logic Of Pivot Trading by Jim White This methodology takes advantage of the short-term trends in the market and applies a pivot trading technique to earn superior
ForexIndicator.org. Presents. Written By Kelvin Lee
 ForexIndicator.org Presents Written By Kelvin Lee All rights reserved. No part of this publication may be reproduced, stored in a retrieval system, or transmitted, in any form or by any means, electronic,
Understanding the market
 Understanding the market Technical Analysis Approach: part I Xiaoguang Wang President, Purdue Quantitative Finance Club PhD Candidate, Department of Statistics Purdue University wang913@purdue.edu Outline
Channel Lines. Charts of futures price
 File A2-20 April 2005 www.extension.iastate.edu/agdm Charting Commodity Futures Channel Lines. Charts of futures price movements can guide agricultural producers in timing farm marketings and can be of
TRADING SECRET NO. 3 How to combine two simple tools to capture big trending moves, especially in currencies
 TRADING SECRET NO. 3 How to combine two simple tools to capture big trending moves, especially in currencies 25 Currencies have a reputation for being markets that trend well. And, every business day over
THE A-Z GUIDE TO E-MINI FUTURES TRADING
 THE A-Z GUIDE TO E-MINI FUTURES TRADING 1.800.800.3840 2 PAST PERFORMANCE IS NOT NECESSARILY INDICATIVE OF FUTURE PERFORMANCE. THE RISK OF LOSS IN TRADING FUTURES CONTRACTS OR COMMODITY OPTIONS CAN BE
Chapter 30 1-2-3 S AND BOLLINGER BANDS
 Chapter 30 1-2-3 S AND BOLLINGER BANDS We ve mentioned previously that Bollinger Bands perform a very important function relative to ones ability to read price charts. Bollinger Bands offer a visual presentation
Exit Strategies for Stocks and Futures
 Exit Strategies for Stocks and Futures Presented by Charles LeBeau E-mail clebeau2@cox.net or visit the LeBeau web site at www.traderclub.com Disclaimer Each speaker at the TradeStationWorld Conference
Exit Strategies & Stop Loss Techniques
 Exit Strategies & Stop Loss Techniques Forex exit strategies are a very important part of Forex trading systems. In fact, it could be said, that out of all the components of a trading system, it is the
5min Forex Trade Strategy Imran Sait Version 1.2 updated on 16 th Nov 2007
 5min Forex Trade Strategy Imran Sait Version 1.2 updated on 16 th Nov 2007 ( Works on All Time Frames and for all Pairs - Best used on 5Min/15min/ for short term Trades and 30min/1Hr/4hr/daily for Long
The Building Blocks for Succeeding with Forex Trading
 The Building Blocks for Succeeding with Forex Trading This e-book was created by traders and for traders with the aim of equipping traders with the right skills of earning big returns from trading forex
The Advisors Inner Circle Fund. Westwood LargeCap Value Fund. Summary Prospectus March 1, 2015 Ticker: Institutional Shares WHGLX
 The Advisors Inner Circle Fund Westwood LargeCap Value Fund Summary Prospectus March 1, 2015 Ticker: Institutional Shares WHGLX Before you invest, you may want to review the Fund s complete prospectus,
The 5 Exit Heroes. Exiting Your Forex Trades For Maximum Profits
 The 5 Exit Heroes Exiting Your Forex Trades For Maximum Profits IMPORTANT : As an added bonus for downloading this report, you also received additional free training videos. To access your bonuses, go
How to use Hamzei Analytics CI and DCI Indicators By Fari Hamzei
 How to use Hamzei Analytics CI and DCI Indicators By Fari Hamzei A key element of your success in trading is early detection of the trend before the next big move occurs. Seeing the next trend in prices,
Table of Contents. Preface. Chapter 1: TRADING BASICS. Chapter 2: BASIC TOOLS. Chapter 3: ADX. Chapter 4: ACCUMULATION LINE
 Table of Contents Preface Chapter 1: TRADING BASICS Chapter 2: BASIC TOOLS Chapter 3: ADX Chapter 4: ACCUMULATION LINE Chapter 5: AVERAGE TRUE RANGE Chapter 6: CANDLESTICKS Chapter 7: MACD Chapter 8: MOVING
Neural Network Stock Trading Systems Donn S. Fishbein, MD, PhD Neuroquant.com
 Neural Network Stock Trading Systems Donn S. Fishbein, MD, PhD Neuroquant.com There are at least as many ways to trade stocks and other financial instruments as there are traders. Remarkably, most people
Stochastic Oscillator.
 Stochastic Oscillator. By Jay Lakhani www.4x4u.net George Lane was the originator of the stochastic indicator in the 1960 s; the indicator tracks the market momentum. Lane observed that as prices rise
Chapter 6 - Rahul Mohindar Oscillator System
 Chapter 6 - Rahul Mohindar Oscillator System The Rahul Mohindar Oscillator and its associated tools and indicators were developed by Mr. Rahul Mohindar of VIRATECH (viratechindia.com). In addition to being
Technical analysis. Course 11
 Course 11 Technical analysis Topic 1: Introduction to technical analysis... 3 Topic 2: Chart types... 4 Line charts... 4 Bar chart... 4 Candle stick charts... 5 Topic 3: Trend analysis... 6 Defining an
Mastering the Markets
 www.mastermindtraders.com Presents Mastering the Markets Your Path to Financial Freedom DISCLAIMER Neither MasterMind Traders or any of its personnel are registered broker-dealers or investment advisors.
Trading Equities through CFDs With the Cycle Trends Live Program
 Trading Equities through CFDs With the Cycle Trends Live Program The live Cycle Trends program is especially suited to the trading of CFDs (Contracts for Difference).The reason is that the CFD mimics almost
Day Trading Stock Controller
 Day Trading Stock Controller Disclaimer: Trading stocks, including ETFs, involves substantial risk of loss and is not suitable for all people. You should carefully consider whether trading, especially
Strategies for Trading Inverse Volatility
 Strategies for Trading Inverse Volatility In this paper, I present five different strategies you can use to trade inverse volatility. Why trade inverse volatility you ask? Because since 2011, trading inverse
AN INTRODUCTION TO THE CHART PATTERNS
 AN INTRODUCTION TO THE CHART PATTERNS AN INTRODUCTION TO THE CHART PATTERNS www.dukascopy.com CONTENTS TECHNICAL ANALYSIS AND CHART PATTERNS CHARACTERISTICS OF PATTERNS PATTERNS Channels Rising Wedge Falling
Alerts & Filters in Power E*TRADE Pro Strategy Scanner
 Alerts & Filters in Power E*TRADE Pro Strategy Scanner Power E*TRADE Pro Strategy Scanner provides real-time technical screening and backtesting based on predefined and custom strategies. With custom strategies,
Daytrading Stock Pairs
 TRADING TECHNIQUES Using Volatility And Correlation Daytrading Stock Pairs Tired of trading Level II quotes and one-minute charts? Try a market-neutral strategy. by Mark Conway and Aaron Behle I t can
Trading Power Trends with ADX
 Trading Power Trends with ADX By Dr. Charles B. Schaap, Jr. International Trader s Expo New York City 18 February 2014 Disclaimer The information in this lecture is for educational purposes. No particular
Timing the Trade How to Buy Right before a Huge Price Advance
 Timing the Trade How to Buy Right before a Huge Price Advance By now you should have read my first two ebooks and learned about the life cycle of a market, stock, or ETF, and discovered the best indicators
STOCK TRADING INDICATORS EXPLAINED. How To Make Profit Trading Stocks Using Indicators
 STOCK TRADING INDICATORS EXPLAINED How To Make Profit Trading Stocks Using Indicators Contents What are Indicators?... 4 The ADX Indicator... 5 How to Use ADX Indicator... 5 Technical Indicator ADX...
2:... 12 14 NYSE 2 15 NYSE
 1 Contents Introduction:... 4 Philosophy:... 5 Trading strategies an overview:... 6 Introduction to direct access trading:... 8 The US stock markets:... 9 Bids and offers:... 10 NASDAQ and level 2:...
TECHNICAL ANAYLSIS PROVIDES INPUTS FOR INVESTMENT: EVIDENCE FROM GOLD
 TECHNICAL ANAYLSIS PROVIDES INPUTS FOR INVESTMENT: EVIDENCE FROM GOLD PunjikaRathi 1, Dr. Rajan Yadav 2, 1 Research scholar,delhi School of Management Studies Delhi Technological University, New Delhi
INTRODUCTION - TIPS - STRATEGY
 EBOOK INTRODUCTION - TIPS - STRATEGY Table of Contents 1. What are Binary Options 2. The flow of decisions in a Trade 3. Advantagesw 4. Risk Management 5. What You Need to Succeed 6. Risk Tolerance 7.
Chapter 8. Trading using multiple time-frames
 Chapter 8 Trading using multiple time-frames TRADING USING MULTIPLE TIME- FRAMES Stock markets worldwide function because, at any given time, some traders want to buy whilst others want to sell. A trader
Pivot Trading the FOREX Markets
 Pivot Trading the FOREX Markets A report by Jim White April, 2004 Pivot Research & Trading Co. 3203 Provence Place Thousand Oaks, Ca. 91362 Phone: 805-493-4221 FAX: 805-493-4349 Email: Jwhite43@adelphia.net
Trendline Tips And Tricks
 Tantalizing! Trendline Tips And Tricks How do you capture those medium- to longer-term moves when trying to enter and exit trades quickly? D by Sylvain Vervoort aydreaming about trading? Get in a trade
Indicators. Applications and Pitfalls. Adam Grimes
 Indicators Applications and Pitfalls Adam Grimes CIO, Waverly Advisors, LLC October 6, 2015 Outline A little history lesson What indicators are and what they can do even more important what they can not
CHART TRADING GUIDE 1
 CHART TRADING GUIDE 1 How to understand chart trading This guide is designed to teach you the basics of chart trading- the chart patterns that are covered in this booklet can be used for short and medium
TECHNICAL CHARTS UNDERSTANDING TECHNICAL CHARTS
 TECHNICAL CHARTS UNDERSTANDING TECHNICAL CHARTS Overview is an advanced charting application specifically designed to display interactive, feature rich, auto updated financial charts. The application provides
Equity Basics: Introduction
 Equity Basics: Introduction Over the last few decades, the average person's interest in the equity market has grown exponentially. This demand coupled with advances in trading technology has opened up
The E-Book of Technical Market Indicators 2.0
 The E-Book of Technical Market Indicators 2.0 Complex Technical Analysis Made Simple How to build a rational decision making framework (systematic trading model) based on different kinds of technical market
Commodity Channel Index
 Commodity (CCI) Developed by Donald Lambert, the Commodity (CCI) was designed to identify cyclical turns in commodities but can be applied to shares as well. The Commodity Channel Index uses a typical
Why the E.A.S.Y. Method?
 Why the E.A.S.Y. Method? Mark Douglas, author of Trading in the Zone, states: The best traders have developed an edge and more importantly, they trust their edge. Why the E.A.S.Y. Method? My trading edge
The Jim Berg Entry and Exit System. 1.
 The Jim Berg Entry and Exit System. 1. Note. The description below is given for educational purposes only in order to show how this may be used with AmiBroker charting software. As described here it is
Basic Forex forecast methods: Technical analysis and fundamental analysis
 Forex forecasting Basic Forex forecast methods: Technical analysis and fundamental analysis This article provides insight into the two major methods of analysis used to forecast the behavior of the Forex
Trade Stocks Like A Pro
 Trade Stocks Like A Pro 5 TIPS Plus 3 Picks International Traders Expo New York By Dr. Charles B. Schaap, Jr. 5 Tips Tip #1: Use ADX to Trade Power Trends Tip #2: Use RSI (50/50 Strategy) for Timing the
THE MOST POWERFUL DAY TRADING SETUP PERIOD!
 THE MOST POWERFUL DAY TRADING SETUP PERIOD! In this pdf I will show you how I combine my institutional numbers with my 40-60 number count 9 and 13 setups. Below you will find my concrete rules on when
RSI PRO Forex Trading System
 RSI PRO Forex Trading System Trading Examples Vol. 1 Paul Dean 2010 [Type text] Page 1 WWW. Y O U L E A R N F O R E X. C O M RSI PRO FOREX TRADING SYSTEM Trading Examples The purpose this book is simply
ADX breakout scanning ADX breakouts can signal momentum setups as well as exit conditions for intraday and swing traders. FIGURE 1: AFTER ADX > 40
 TRADING STRATEGIES ADX breakout scanning ADX breakouts can signal momentum setups as well as exit conditions for intraday and swing traders. BY KEN CALHOUN FIGURE 1: AFTER ADX > 40 Spotting volatility
A guide for end-users
 A guide for end-users www.recognia.com Copyright 2013 Recognia Using Technical Insight Event Lookup will allow you to quickly understand the outlook for a particular financial instrument from the perspective
The Magic Momentum Method of Trading the Forex Market
 The Magic Momentum Method of Trading the Forex Market WELCOME! Welcome to one of the easiest methods of trading the Forex market which you can use to trade most currencies, most time frames and which can
SYNERGY Trading Method. CompassFX, 2009 www.compassfx.com Rev. 81009
 SYNERGY Trading Method SYNERGY Method INSTALLATION Basic Synergy is designed to automatically download onto the C: drive of your computer. If your local drive is not the C: drive, please send an email
New York Traders Expo 2012
 New York Traders Expo 2012 with JAMES CHEN, CTA, CMT Director of Technical Research and Education All rights reserved, FXDD Inc. 2010 Today s Topic: High Probability Strategies for Trading Forex www.fxdd.com
Using ADX to Trade Breakouts, Pullbacks, and Reversal Patterns. By Puneet Jain CFTe
 Using ADX to Trade Breakouts, Pullbacks, and Reversal Patterns By Puneet Jain CFTe (with DMI) ADX (Average Directional Index) is an indicator that measures trend strength shows trend direction. ADX tells
FUTURES STRATEGY: Short-term CCI p. 10. ADJUSTING TO stock index futures shift p. 14. STRADDLES, STRANGLES, and volatility p. 16
 May 2009 Volume 3, No. 5 FUTURES STRATEGY: Short-term CCI p. 10 ADJUSTING TO stock index futures shift p. 14 STRADDLES, STRANGLES, and volatility p. 16 FEAR AND LOATHING in the options market p. 20 TRADING
ChartFilter Stock Tools Training Guide
 ChartFilter Stock Tools Training Guide Disclaimer MHP Systems Inc. is not responsible for investments made as a result of using this program. The purchaser of the license for use of this program is responsible
Best Online Trading Platform Saudi Arabia
 Best Online Trading Platform Saudi Arabia 2009 2009 A NEW CHAPTER BEGINS The kingdom of Saudi Arabia is about to witness a major development in the capital market with the launch of a new asset class (Exchange
New Scan Wizard Stock Market Software Finds Trend and Force Breakouts First; Charts, Finds News, Logs Track Record
 NEWS FOR IMMEDIATE RELEASE, Monday, October 2, 2000 Contact: John A. Sarkett, 847.446.2222, jas@option-wizard.com http://option-wizard.com/scanwizard/ New Scan Wizard Stock Market Software Finds Trend
Copyright 2010 by Kelvin Lee
 All rights reserved. No part of this publication may be reproduced, stored in a retrieval system, or transmitted, in any form or by any means, electronic, mechanical, photocopying, recording or otherwise,
The Day Trade Forex System: The ULTIMATE Step-By-Step Guide to Online Currency Trading
 The Day Trade Forex System: The ULTIMATE Step-By-Step Guide to Online Currency Trading How You Can Earn $50 to $500 A Day Currency Trading From The Comfort of Your Own Home! By Erol Bortucene and Cynthia
The Day Trade Forex System: The ULTIMATE Step-By-Step Guide to Online Currency Trading
 The Day Trade Forex System: The ULTIMATE Step-By-Step Guide to Online Currency Trading How You Can Earn $50 to $500 A Day Currency Trading From The Comfort of Your Own Home! 2003 Copyright DayTradeForex.com
Retracements With TMV
 A Series Of Indicators Used As One Trade Breakouts And Retracements With TMV Making good trading decisions involves finding indicators that cut through the market noise. But how do you do it without collapsing