Trading Power Trends with ADX
|
|
|
- Shon Skinner
- 10 years ago
- Views:
Transcription

1 Trading Power Trends with ADX By Dr. Charles B. Schaap, Jr. International Trader s Expo New York City 18 February 2014

2 Disclaimer The information in this lecture is for educational purposes. No particular stocks, futures, mutual funds, or exchange traded funds are being recommended. Consult professional investment advice prior to implementing an investment program. Past results are not necessarily indicative of future results. Do not invest with money you cannot afford to lose. Investing involves potential risks. Trading involves risk, and It should not be assumed that methods taught will not result in losses Charles B. Schaap 2


3 Trader s Expo 2006 Presentation 2014 Charles B. Schaap 3


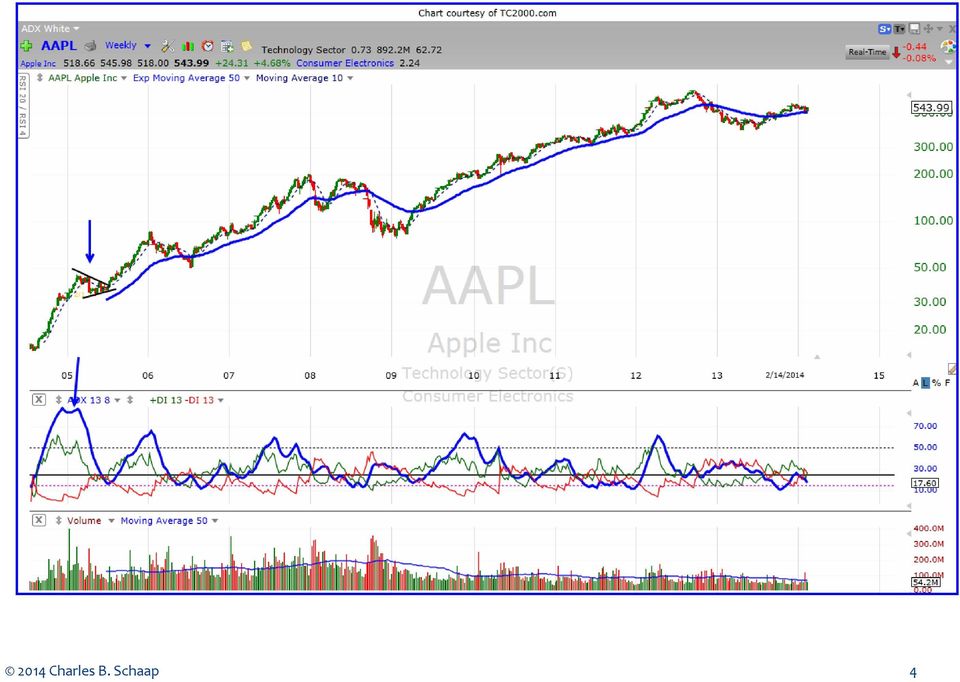
4 2014 Charles B. Schaap 4
5 etraders Expo 2014 Charles B. Schaap 5


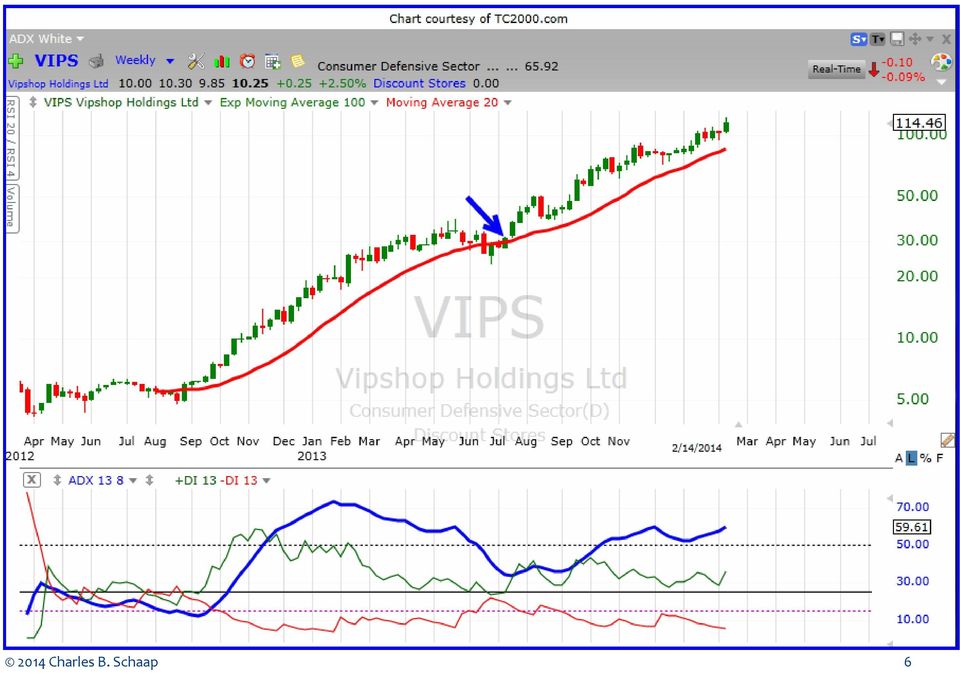
6 2014 Charles B. Schaap 6

7 Power Trend 2014 Charles B. Schaap 7


8 Indicators 2014 Charles B. Schaap 8

9 Power Trend Trading Principles Trends are created and fueled by big institutional investments companies (hedge funds, mutual funds, banks, etc.) BIGs = big institutional guns The 50-week moving average generally reflects long-term, institutional buying activity Use the 50 EMA WEEKLY for Long-term Direction Use the 50 EMA DAILY for entry 2014 Charles B. Schaap 9

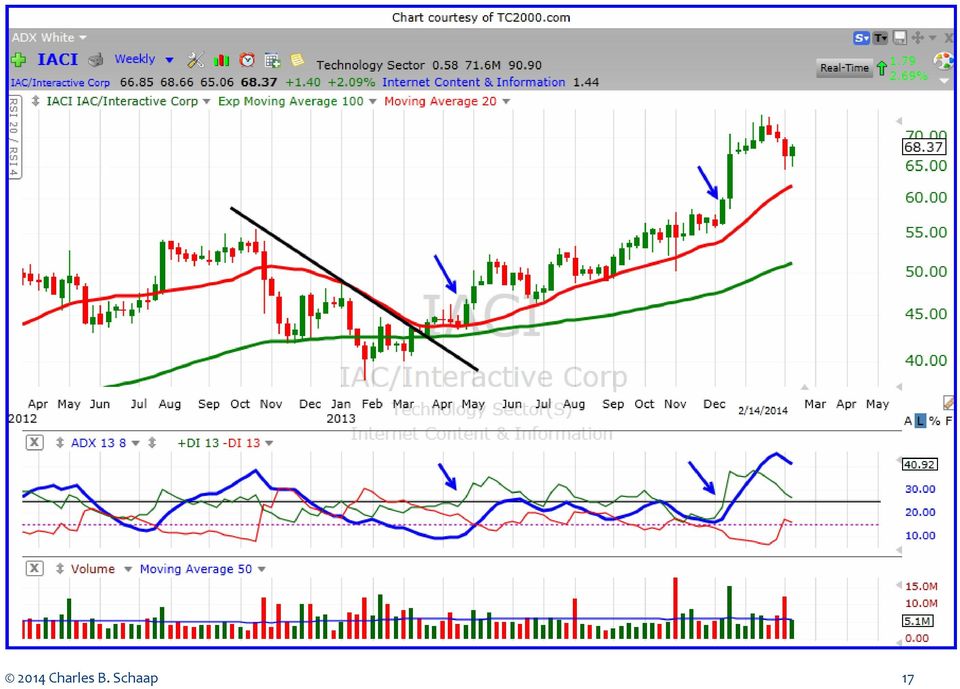
10 Power Trend Trading Principles The goal is to enter as early as possible at the start of the stock s trend Breakout from a bottom formation/trend reversal The FIRST pullback to the daily 50 EMA The best trends begin out of general market bottoms or market corrections The best trends begin out of LOW ADX periods Let profits run until there are signs of trend weakness (ADX peak near 25) 2014 Charles B. Schaap 10
 2014 Charles B.")
11 Power Trend Thinking Follow price. If you can t read price, indicators won t help you. Ignore opinions Ignore upgrades and downgrades Ignore analyst predictions Ignore news hype 2014 Charles B. Schaap 11

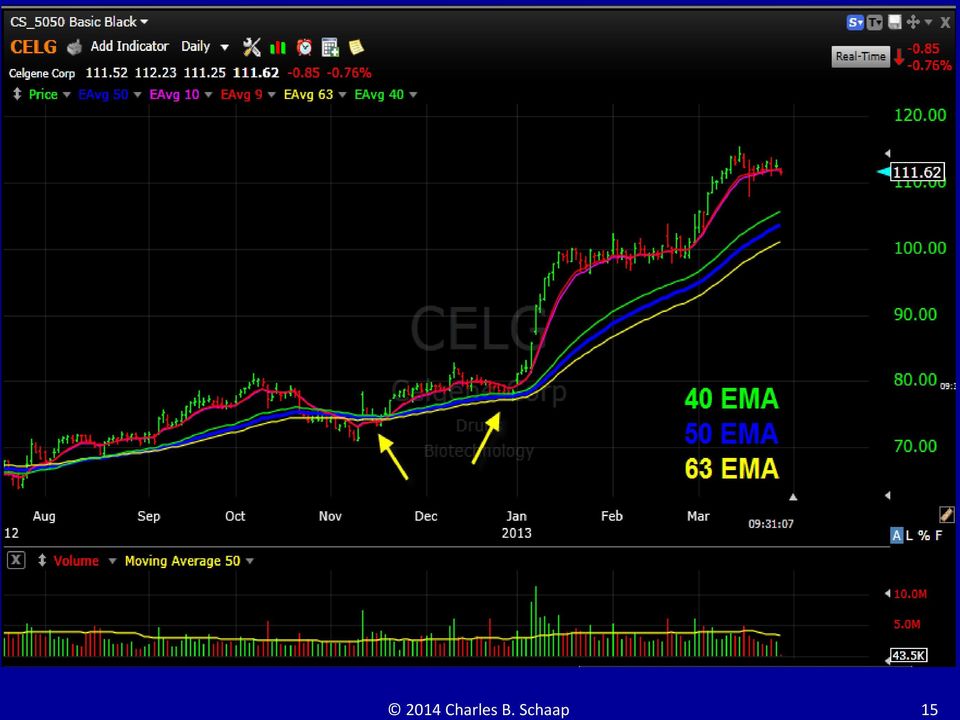
12 Moving Averages Pullbacks to a moving average represent reversion to the mean price Moving averages act as areas of support for countertrend retracements (pullbacks) and consolidations Moving averages correlate to the degree of trend Daily 10 MA or 20 MA: short-term trend Daily 50 MA or 100 MA: Intermediate-term trend Daily 200 MA or 250 MA: Long-term trend 2014 Charles B. Schaap 12


13 2014 Charles B. Schaap 13


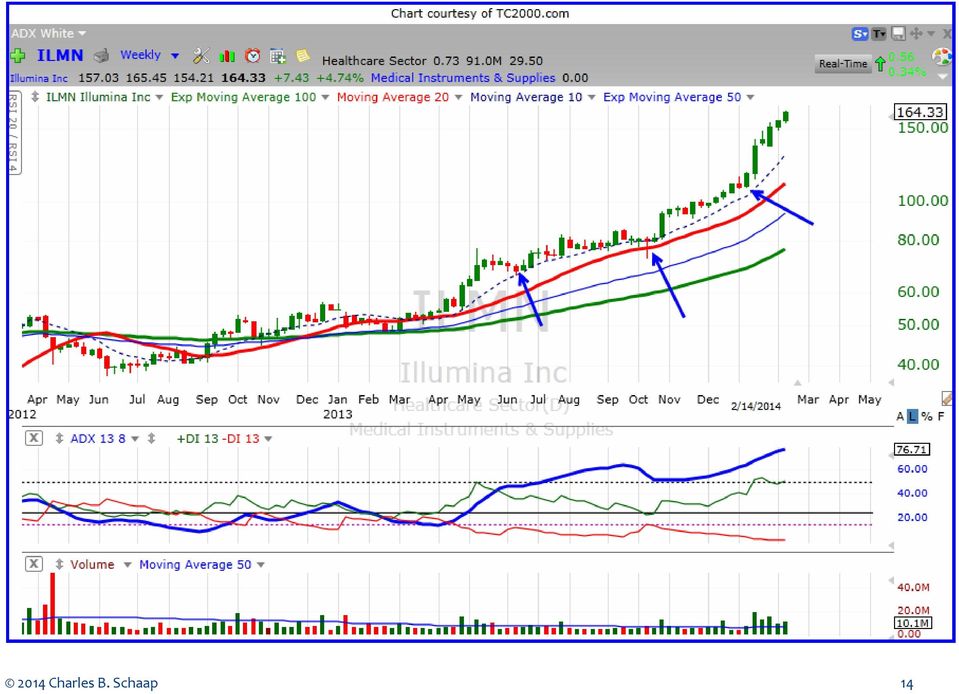
14 2014 Charles B. Schaap 14

15 2014 Charles B. Schaap 15
16 Power Trend Volume High volume is an indication of institutional buying/selling DMI is highly correlated with volume Most Important: Volume greater than the previous day s volume Volume greater than the 50-day volume average Volume increase of 150% above is key for breakouts and gaps Watch for volume strength that correlates to DMI entry signals 2014 Charles B. Schaap 16


17 2014 Charles B. Schaap 17
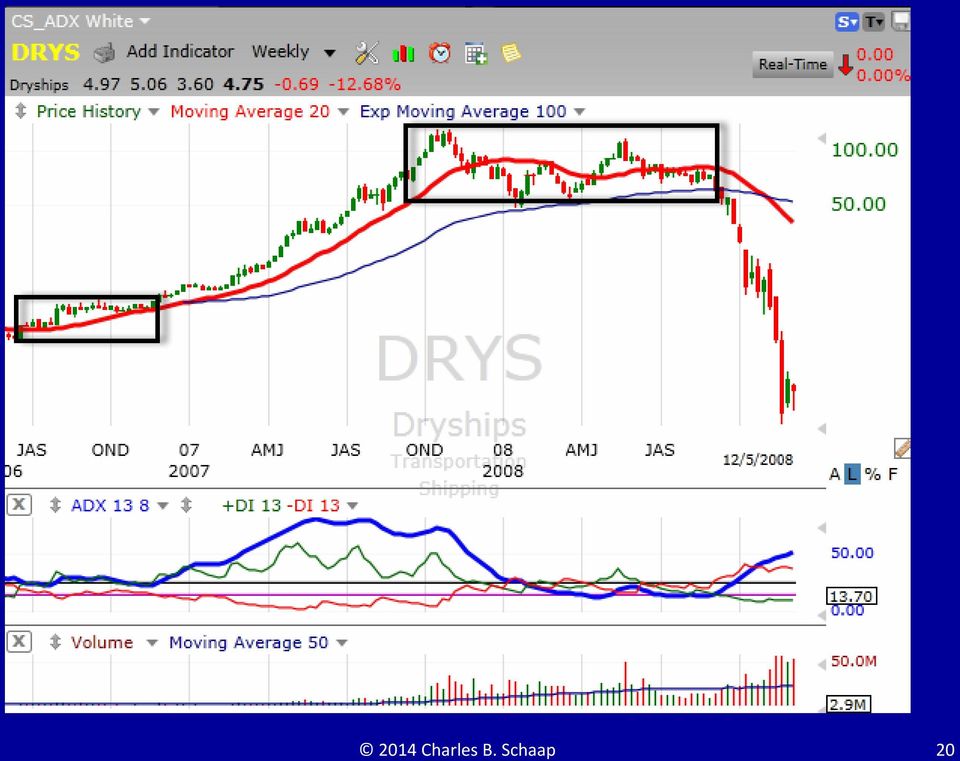
18 Four Stages of the Stock Cycle DISTRIBUTION MARKUP--LONG MARKDOWN--SHORT ACCUMULATION 2014 Charles B. Schaap 18

19 Stock Cycle Lessons Profits (long) are only made in the markup stage Even the strongest performing stocks eventually go through markdown, usually during a general market decline Most of the stocks that undergo markdown, never recover Newer stocks emerge in the next bull economic cycle 2014 Charles B. Schaap 19


20 2014 Charles B. Schaap 20

21 2014 Charles B. Schaap 21

22 2014 Charles B. Schaap 22
23 DMI (Directional Movement Indicator) DMI represents price direction. When +DMI is above DMI, the price direction is up. When DMI is above +DMI, the price direction is down. DMI measures the strength of price swing highs and lows on a scale of DMI is used for trade entry and exit signals. Note: DMI crosses alone are never used for entries or exits Charles B. Schaap 23
24 Directional Movement (DM) DM is the largest part of today s range that is outside of yesterday s range. When the largest part of today s range is above yesterday s range, we get positive DM (+DM). When the largest part of today s range is below yesterday s range, we get negative DM (-DM) Charles B. Schaap 24
25 Directional Movement (DM) Concept +DM +DM NO DM -DM -DM Note: For each bar, only one (the largest) DMI value is used; on an inside day, both values are recorded as Charles B. Schaap 25
26 Correlation of DMI to Price The +DMI moves in the direction of price. When price rises, +DMI rises. When price falls, +DMI falls. The DMI moves counterdirectional to price. When price rises, -DMI falls. When price falls, -DMI rises Charles B. Schaap 26
27
28 DMI Strength (Highs) DMI High < 15 = Very Weak DMI High = Weak DMI High > 25 = Strong 2014 Charles B. Schaap 28
29 Bulls vs Bears The two DMI lines allow the trader to independently gauge the relative strength of the bulls and bears. The +DMI is the strength of the bulls. The DMI is the strength of the bears. Relative DMI strength is important for seeing DMI Dominance, a key directional signal Charles B. Schaap 29

30
31 ADX/DMI Indicator New Concepts in Technical Trading Systems, 1978 (Wilder). Average Directional Movement Index (ADX) was developed by J. Welles Wilder ADX is derived from two related indicators, the Positive Directional Movement Indicator (+DMI) and the Negative Directional Movement Indicator (-DMI). Default periods for ADX and DMI is 14 ADXcellence Power Trend Strategies, 2006 (Schaap) ADXcellence settings: DMI 13, ADX Charles B. Schaap 31
32 ADX and Trend Strength ADX is Nondirectional ADX quantifies trend strength ADX 50 : Very Strong (Power Trend) ADX 25-50: Strong Trend ADX 15-25: Weak or No Trend ADX 15: No trend (Prebreakout) 2014 Charles B. Schaap 32

33 2014 Charles B. Schaap 33

34 2014 Charles B. Schaap 34

35 2014 Charles B. Schaap 35
36 ADX is Nondirectional ADX measures the strength of a trend, but doesn t distinguish between uptrends and downtrends. When there is a strong uptrend, ADX rises. When there is a strong downtrend, ADX rises Charles B. Schaap 36

37 2014 Charles B. Schaap 37
38 ADX Strong ADX waves represent periods of institutional buying ADX measures the difference between the +DMI and the DMI. ADX rises when the DMI lines diverge. ADX falls when the DMI lines converge 2014 Charles B. Schaap 38
39 ADX Wave STRONG Getting Stronger Getting Less Strong 25 WEAK 2014 Charles B. Schaap 39
40 2014 Charles B. Schaap 40
41
42 ADXcellent Benefits ADX distinguishes between trending and nontrending conditions. By quantifying trend strength, ADX allows the trader to choose only the strongest trends to trade Charles B. Schaap 42

43 Trend Momentum 2014 Charles B. Schaap 43

44 2014 Charles B. Schaap 44
45 ADX Power Trend Rule ADX power trends have one or more ADX peaks of 50 or greater and one or more ADX troughs greater than 25.
46 ADXcellence Power Trends Power trends are preceded by a consolidation period (>30 bars) where ADX is below 25. ADX usually hits peaks of 50 and retracement troughs often remain above 25. Price remains above the 20 EMA the majority of the time. Trends tend to look overextended we think it s too late to enter. Power trends allow traders to let profits run Charles B. Schaap 46

47 2014 Charles B. Schaap 47
48
49

50 Strong ADX 2014 Charles B. Schaap 50

51 Weak ADX 2014 Charles B. Schaap 51
52 ADXodus Trade Setup 30 bars of low ADX range consolidation ADX < 25 DMI lines are above ADX, moving sideways LONG: +DMI makes a Crossover High Signal Entry Buy Breakout on resistance line cross Or Enter on 1 st pullback near 20 EMA on pivot low completion 2014 Charles B. Schaap 52

53 2014 Charles B. Schaap 53

54 2014 Charles B. Schaap 54
55 ProSelect Stock Service 2014 Charles B. Schaap 55
56 2014 Charles B. Schaap 56

57 2014 Charles B. Schaap 57

58 2014 Charles B. Schaap 58

59 2014 Charles B. Schaap 59

60 2014 Charles B. Schaap 60

61 2014 Charles B. Schaap 61
62 2014 Charles B. Schaap 62

63 IPO 2011, makes radios, antennas and network mgmt tools Qtrly Sales % chg 85%, 3 Yr Sales growth 34%, Qtry EPS change 140%

64 IPO 2011, Chinese provider of internet security, browsers, online games EPS%Qtrly 158%, 3 Yr Sales Growth rate 127%

65 IPO 2013, internet products and applications, focus android smartphones Qtrly Sales % change 85%, 3 Yr Sales Growth rate 96%
66 Contact Information Dr. Charles B. Schaap Website: TradeLikeAPro.com Charles B. Schaap 66
67 Thanks for Attending! 2014 Charles B. Schaap 67
Trade Stocks Like A Pro
 Trade Stocks Like A Pro 5 TIPS Plus 3 Picks International Traders Expo New York By Dr. Charles B. Schaap, Jr. 5 Tips Tip #1: Use ADX to Trade Power Trends Tip #2: Use RSI (50/50 Strategy) for Timing the
Using ADX to Trade Breakouts, Pullbacks, and Reversal Patterns. By Puneet Jain CFTe
 Using ADX to Trade Breakouts, Pullbacks, and Reversal Patterns By Puneet Jain CFTe (with DMI) ADX (Average Directional Index) is an indicator that measures trend strength shows trend direction. ADX tells
ADX breakout scanning ADX breakouts can signal momentum setups as well as exit conditions for intraday and swing traders. FIGURE 1: AFTER ADX > 40
 TRADING STRATEGIES ADX breakout scanning ADX breakouts can signal momentum setups as well as exit conditions for intraday and swing traders. BY KEN CALHOUN FIGURE 1: AFTER ADX > 40 Spotting volatility
Our top 3 swing trading setups
 Our top 3 swing trading setups Deron Wagner Founder Morpheus Trading Group Overview of core beliefs Swing trading in the near to intermediate-term timeframe is the best fit for overall strategy Trading
STREET SMARTS I. Planetary 2 Library. Introduction: Benefits: L I B R A R I E S
 Planetary 2 Library STREET SMARTS I Introduction: In today s world of computer trading, the small speculator often feels at a disadvantage to traders and corporations that have access to more powerful
Disclaimer: The authors of the articles in this guide are simply offering their interpretation of the concepts. Information, charts or examples
 Disclaimer: The authors of the articles in this guide are simply offering their interpretation of the concepts. Information, charts or examples contained in this lesson are for illustration and educational
Technical Analysis SAmple InveSTIng plans 1
 Technical Analysis Sample Investing Plans 1 Important Information All investing plans and rules are provided for informational purposes only, and should not be considered a recommendation of any security,
THE MACD: A COMBO OF INDICATORS FOR THE BEST OF BOTH WORLDS
 THE MACD: A COMBO OF INDICATORS FOR THE BEST OF BOTH WORLDS By Wayne A. Thorp Moving averages are trend-following indicators that don t work well in choppy markets. Oscillators tend to be more responsive
8 Day Intensive Course Lesson 3
 8 Day Intensive Course Lesson 3 A) What are Fibonacci Retracements? Fibonacci Retracements What are Fibonacci retracements? Levels at which the market is expected to retrace to after a strong trend. Based
Secrets for profiting in bull and bear markets Sam Weinstein
 Secrets for profiting in bull and bear markets Sam Weinstein 1. Check market indicators for overall direction 2. Scan the industry groups to know which one to zero in 3. Cull out the stocks with the most
How I Trade Profitably Every Single Month without Fail
 How I Trade Profitably Every Single Month without Fail First of all, let me take some time to introduce myself to you. I am Kelvin and I am a full time currency trader. I have a passion for trading and
Chapter 2.3. Technical Analysis: Technical Indicators
 Chapter 2.3 Technical Analysis: Technical Indicators 0 TECHNICAL ANALYSIS: TECHNICAL INDICATORS Charts always have a story to tell. However, from time to time those charts may be speaking a language you
Trading Binary Options Strategies and Tactics
 Trading Binary Options Strategies and Tactics Binary options trading is not a gamble or a guessing game. By using both fundamental and technical market analysis, you are able to get a better understanding
Advanced Trading Systems Collection MACD DIVERGENCE TRADING SYSTEM
 MACD DIVERGENCE TRADING SYSTEM 1 This system will cover the MACD divergence. With this trading system you can trade any currency pair (I suggest EUR/USD and GBD/USD when you start), and you will always
CHART TRADING GUIDE 1
 CHART TRADING GUIDE 1 How to understand chart trading This guide is designed to teach you the basics of chart trading- the chart patterns that are covered in this booklet can be used for short and medium
Technical Indicators Explained
 Chapter I. Technical Indicators Explained In This Chapter The information in this chapter is provided to help you learn how to use the technical indicators that are available for charting on the AIQ TradingExpert
Leon Wilson Trading Success
 Leon Wilson Trading Success A talk given by Mary de la Lande to the BullCharts User Group Meeting on 13 February 2008 1. Who is Leon Wilson? His Books and where to get them. 2. Book 1: The Business of
Active Trend Trading System
 Active Trend Trading System Candle Light Trader: Dennis W. Wilborn A Trend Should Be Assumed to Continue in Effect Until Such Time as Its Reversal Has Been Definitely Signaled Edwards & Magee Disclaimer
TRADING GAPS TAIL STRATEGY SPECIAL REPORT #37
 TRADING GAPS TAIL STRATEGY SPECIAL REPORT #37 Welcome to Market Geeks special report. Today I m going to teach you a little bit about gaps, how to identify different gaps and most importantly how to put
New York Traders Expo 2012
 New York Traders Expo 2012 with JAMES CHEN, CTA, CMT Director of Technical Research and Education All rights reserved, FXDD Inc. 2010 Today s Topic: High Probability Strategies for Trading Forex www.fxdd.com
Technical Analysis. Technical Analysis. Schools of Thought. Discussion Points. Discussion Points. Schools of thought. Schools of thought
 The Academy of Financial Markets Schools of Thought Random Walk Theory Can t beat market Analysis adds nothing markets adjust quickly (efficient) & all info is already in the share price Price lies in
Elliott Wave Ultimate Q & A
 Elliott Wave Ultimate Q & A Disclaimer Stocks, Options, Forex and Futures trading has large potential rewards, but also large potential risk. You must be aware of the risks and be willing to accept them
Definitions to Basic Technical Analysis Terms. www.recognia.com
 Definitions to Basic Technical Analysis Terms www.recognia.com A Alert An alert is a notification sent when a significant event occurs in one or more investments of importance to a trader. Recognia sends
Table of Contents. Preface. Chapter 1: TRADING BASICS. Chapter 2: BASIC TOOLS. Chapter 3: ADX. Chapter 4: ACCUMULATION LINE
 Table of Contents Preface Chapter 1: TRADING BASICS Chapter 2: BASIC TOOLS Chapter 3: ADX Chapter 4: ACCUMULATION LINE Chapter 5: AVERAGE TRUE RANGE Chapter 6: CANDLESTICKS Chapter 7: MACD Chapter 8: MOVING
Technical Indicators Tutorial - Forex Trading, Currency Forecast, FX Trading Signal, Forex Training Cour...
 Page 1 Technical Indicators Tutorial Technical Analysis Articles Written by TradingEducation.com Technical Indicators Tutorial Price is the primary tool of technical analysis because it reflects every
Simple & Consistent Fibonacci Method Prepared by: Simone Guy. {Free learning resource: NOT FOR RESALE}
 Simple & Consistent Fibonacci Method Prepared by: Simone Guy {Free learning resource: NOT FOR RESALE} 3/13/2010 Overview This is a mechanical trading method that is based on Support and Resistance. The
Systematic Trading What Does It Mean and What Style Is Right For You?
 ASIA PACIFIC S PREEMINENT TRADING MAGAZINE TM www.tradersjournal.com VOLUME 3 ISSUE 12 Systematic Trading What Does It Mean and What Style Is Right For You? SG$9.80 / A$9.95 / HK$68 / RM$19.80 Gold ETF
Pattern Recognition Software Guide
 Pattern Recognition Software Guide 2010 Important Information This material is for general information only and is not intended to provide trading or investment advice. All analysis and resulting conclusions
The Magic Momentum Method of Trading the Forex Market
 The Magic Momentum Method of Trading the Forex Market WELCOME! Welcome to one of the easiest methods of trading the Forex market which you can use to trade most currencies, most time frames and which can
A.R.T Core Portfolio Trading Plan June 2015
 A.R.T Core Portfolio Trading Plan June 2015 ABSOLUTE RETURN TRADING PTY LTD ACN 603 186 634 Trading ASX Equities Long/Short using CFDS CFDs are a very powerful and effective tool if used correctly. Using
How to put momentum strategies in context to achieve high percentage winning trades. Suzanne Bodlovic [email protected]
 How to put momentum strategies in context to achieve high percentage winning trades Suzanne Bodlovic [email protected] Tonight I will show you how this workspace will change the way you approach the markets
Chapter 2.3. Technical Indicators
 1 Chapter 2.3 Technical Indicators 0 TECHNICAL ANALYSIS: TECHNICAL INDICATORS Charts always have a story to tell. However, sometimes those charts may be speaking a language you do not understand and you
Intra-Day Trading Techniques
 Pristine.com Presents Intra-Day Trading Techniques With Greg Capra Co-Founder of Pristine.com, and Co-Author of the best selling book, Tools and Tactics for the Master Day Trader Copyright 2001, Pristine
Using Order Book Data
 Q3 2007 Using Order Book Data Improve Automated Model Performance by Thom Hartle TradeFlow Charts and Studies - Patent Pending TM Reprinted from the July 2007 issue of Automated Trader Magazine www.automatedtrader.net
[email protected]
 [email protected] 3 Part Now That I Am Bored in Retirement Series Part 1 Basics designed for those new to HGSI or those wanting a refresher of our unique indicator set Part 2 Putting the Tools
TOMORROW'S TRADING TECHNOLOGY. 100% automated Fibonacci support and resistance levels that you can count on every single trading day in an instant.
 TOMORROW'S TRADING TECHNOLOGY 100% automated Fibonacci support and resistance levels that you can count on every single trading day in an instant. ProTrader Table of Contents 1. Areas A. Fibonacci Confluence
Copyright 2010 by Kelvin Lee
 All rights reserved. No part of this publication may be reproduced, stored in a retrieval system, or transmitted, in any form or by any means, electronic, mechanical, photocopying, recording or otherwise,
TECHNICAL OUTLOOK 301110 TRADING LIMIT TEAM DATA USED IN TECH ANALYSIS. SHORT TERM = 2-6 WEEKS, MID-TERM=2-6 MONTHS, L-TERM=6-9 MONTHS DAX 30
 TECHNICAL OUTLOOK 301110 TRADING LIMIT TEAM DATA USED IN TECH ANALYSIS. SHORT TERM = 2-6 WEEKS, MID-TERM=2-6 MONTHS, L-TERM=6-9 MONTHS DAX 30 Data for 30/11/10Monte Carlo (TradingLimit) - - - Non Stop
Advanced Trading Systems Collection 5 MINUTE SCALPING SYSTEM
 5 MINUTE SCALPING SYSTEM 1 This is a fairly simple method to squeeze money out of the market with short terms trades. With this one we trade the five minute charts, and we rarely hold a trade for longer
WELCOME TO Trading Boot Camp Day 2
 Icoachtrader Consulting Service www.icoachtrader.weebly.com WELCOME TO Trading Boot Camp Day 2 David Ha Ngo Trading Coach Phone: 1.650.899.1088 Email: [email protected] The information presented is
LIVE@ W O R K B O O K
 LIVE @ W O R K B O O K SHORT SKIRT TRADING The Most Bang for the Buck in the Least Amount of Time. By Linda Raschke COVERING: INDICES, DAY TRADING AND MONEY MANAGEMENT Linda will teach the "Short Skirt"
W.D. Gann's Techniques of Analysis and Trading
 A Summary of W.D. Gann's Techniques of Analysis and Trading Psychological Framework Master yourself Do not overtrade See if your trade is based on hope or logic and systems developed by you Trading strategies
TECHNICAL ANALYSIS. Handbook. 2003 Bloomberg L.P. All rights reserved.
 TECHNICAL ANALYSIS Handbook 2003 Bloomberg L.P. All rights reserved. There are two principles of analysis used to forecast price movements in the financial markets -- fundamental analysis and technical
Day Trade System EZ Trade FOREX
 Day Trade System The EZ Trade FOREX Day Trading System is mainly used with four different currency pairs; the EUR/USD, USD/CHF, GBP/USD and AUD/USD, but some trades are also taken on the USD/JPY. It uses
Trend Determination - a Quick, Accurate, & Effective Methodology
 Trend Determination - a Quick, Accurate, & Effective Methodology By; John Hayden Over the years, friends who are traders have often asked me how I can quickly determine a trend when looking at a chart.
FOREX analysing made easy
 FOREX analysing made easy UNDERSTANDING TECHNICAL ANALYSIS An educational tool by Blackwell Global Contents Technical Analysis 2 Line Chart 3 Bar Chart 4 Candlestick Chart 5 Support and Resistance 6 Fibonacci
Sunil Mangwani www.fibforex123.com
 The 123 chart pattern. The 123 pattern is a reversal chart pattern which occurs very frequently and has a very high success ratio. 123 s occur at the end of trends and swings, and they are an indication
Retracements With TMV
 A Series Of Indicators Used As One Trade Breakouts And Retracements With TMV Making good trading decisions involves finding indicators that cut through the market noise. But how do you do it without collapsing
Guidelines to use with Fibonacciqueen trade setups!!!
 Guidelines to use with Fibonacciqueen trade setups!!! Updated January 2014 As far as the price analysis that I run every day in the markets, there are three different types of Fibonacci price relationships
One of the primary challenges traders deal with is
 TRADING Strategies Momentum trading: Using pre-market trading and range breakouts Focusing on days the market breaks out of the prior day s range and moves in the same direction as the pre-market trend
Trading With The Cup-With-Handle
 Stocks & Commodities V13 (292-297): Trading with the -with- by Gregory Kuhn TRADING TECHNIQUES Trading With The -With- Here are some more nuances for trading stocks based on the charting pattern called
Forex Volatility Patterns
 Spotting Early Breakouts Forex Volatility Patterns BRUCE WALDMAN Want to catch 40 to 00 pips in each trade? Here s how you can find those entry and exit signals to make your forex trading a success. C
Trading with ATR Price Projections.
 By Nitin Suvarna Trading with ATR Price Projections. J. Welles Wilder developed "Average True Range" (ATR) as a tool for a more precise calculation of price activity and volatility. True Range measure
TRADING SECRET NO. 3 How to combine two simple tools to capture big trending moves, especially in currencies
 TRADING SECRET NO. 3 How to combine two simple tools to capture big trending moves, especially in currencies 25 Currencies have a reputation for being markets that trend well. And, every business day over
GMMA 2.0 User Guide. August 2010 Edition PF-30-01-02
 GMMA 2.0 User Guide GMMA 2.0 User Guide August 2010 Edition PF-30-01-02 Support Worldwide Technical Support and Product Information www.nirvanasystems.com Nirvana Systems Corporate Headquarters 7000 N.
Retracement Or Reversal. Kennsei Trading, Inc. Chief Trader Dinger [email protected] www.hotstocksforincome.com
 Retracement Or Reversal Kennsei Trading, Inc. Chief Trader Dinger [email protected] www.hotstocksforincome.com Retracement Or Reversal Most of us have wondered, at some point, whether a decline
Contrarian investing and why it works
 Contrarian investing and why it works Definition Contrarian a trader whose reasons for making trade decisions are based on logic and analysis and not on emotional reaction. What is a contrarian? A Contrarian
[email protected]
 [email protected] Disclaimer This session is for educational purposes only. Any recommendations are in the spirit of education and not investment advice I am a doctor not a broker. Most physicians lose
Chart Patterns Trader. Trader SUPPLEMENT. Understanding and Trading Classic Chart Patterns. By: Kevin Matras Zacks Investment Research, Inc
 Chart Patterns Trader Trader SUPPLEMENT Understanding and Trading Classic Chart Patterns By: Kevin Matras Zacks Investment Research, Inc Table of Contents Introduction.........................................................................
TECHNICAL ANALYSIS GLOSSARY
 TECHNICAL ANALYSIS GLOSSARY A ABC: Elliott Wave terminology for a three-wave countertrend price movement. Wave A is the first price wave against the trend of the market. Wave B is a corrective wave to
THE LAW OF CHARTS WITH INFORMATION NOT SHOWN IN OUR PREVIOUS COURSE MANUALS
 THE LAW OF CHARTS WITH INFORMATION NOT SHOWN IN OUR PREVIOUS COURSE MANUALS 1-2-3 HIGHS AND LOWS A typical 1-2-3 high is formed at the end of an uptrending market. Typically, prices will make a final high
Exit Strategies for Stocks and Futures
 Exit Strategies for Stocks and Futures Presented by Charles LeBeau E-mail [email protected] or visit the LeBeau web site at www.traderclub.com Disclaimer Each speaker at the TradeStationWorld Conference
BROKER SERVICES AND PLATFORM
 BROKER SERVICES AND PLATFORM A broker is an individual who executes buy and sell orders and get commission in the form of SPREAD (I will talk about SPREAD in the subsequent lessons). You trade through
THE CYCLE TRADING PATTERN MANUAL
 TIMING IS EVERYTHING And the use of time cycles can greatly improve the accuracy and success of your trading and/or system. THE CYCLE TRADING PATTERN MANUAL By Walter Bressert There is no magic oscillator
Professional Trader Series: Moving Average Formula & Strategy Guide. by John Person
 Professional Trader Series: Moving Average Formula & Strategy Guide by John Person MOVING AVERAGE FORMULAS & STRATEGY GUIDE In an online seminar conducted for the Chicago Board of Trade, I shared how to
Take it E.A.S.Y.! Dean Malone 4X Los Angeles Group - HotComm January 2007
 Take it E.A.S.Y.! Dean Malone 4X Los Angeles Group - HotComm January 2007 Dean Malone Partner of Compass Foreign Exchange, LLC. Co-Founder of Forex Signal Service.com. Previous Senior National for 4X Made
BULLS ON WALL ST. 60 DAY TRADING BOOTCAMP
 BULLS ON WALL ST. 60 DAY TRADING BOOTCAMP Lead Instructor Kunal Desai Assistant Instructors Maribeth Willoughby Dr. Andrew Menaker Course Description This 60 day course teaches a setup based system to
The Building Blocks for Succeeding with Forex Trading
 The Building Blocks for Succeeding with Forex Trading This e-book was created by traders and for traders with the aim of equipping traders with the right skills of earning big returns from trading forex
Intraday Report for Wednesday, July 08, 2015 S&P 500 ETF: SPY. Corey Rosenbloom, CMT Afraid to Trade
 1 Daily "Idealized Trades" Report S&P 500 ETF: SPY 1 2 SPY 1-min 2 3 Real-World Lessons from Today s Trading Day Hey traders! First, please pardon the look and urgency of getting this report out I m away
Thinking Man s Trader
 Thinking Man s Trader Advanced Trader s Package Trading is a three dimensional world and the Advanced Trader s Package covers all three. Dimension three: Market Dynamics, conditions and change of conditions
6.14. Oscillators and Indicators.
 6.14. Oscillators and Indicators. What is Momentum? The word momentum has two meanings to market technicians, one of them is a generic concept about how prices move, and the second one is a specific indicator.
Chapter 2.4. Multiple Time Frames
 Chapter 2.4 Multiple Time Frames 0 Contents TRADING USING MULTIPLE TIME FRAMES Traders of virtually every monetary size and temperament trade the Forex market. At any given time, short-term scalpers and
atching Currency Moves with The Schaff Trend Cycle Indicator
 JULY/AUGUST 2002. VOLUME 4 CRunning a trend indicator through a cycle oscillator creates an effective entry technique into today s strongly trending currency markets, says Doug Schaff, a 20-year veteran
Ideas for improving your trading in 2010. Trader_Dante
 Ideas for improving your trading in 2010 Trader_Dante Copyright Trader_Dante 2010 Page 1 of 18 Disclaimer All reasonable steps and due diligence have been taking in preparing this document. However, it
Heikin-Ashi-two-Bar-Strategy Guide to Strategic and Tactical Forex Trading Pull the Trigger and Hit your Targets
 Heikin-Ashi-two-Bar-Strategy Guide to Strategic and Tactical Forex Trading Pull the Trigger and Hit your Targets Currency: EUR/JPY, GBP/JPY Time frame: 5 min Indicators: BB 14, 2, ADX 14, SSD 5, 3, 3,
IS SWING TRADING THE PERFECT TIMEFRAME?
 IS SWING TRADING THE PERFECT TIMEFRAME? Brian Shannon www.alphatrends.net Do you categorize yourself as a long term investor, a day trader or maybe something in between? If you are like many people, you
My Daily Trading Preparation. Establishing Risk Parameters and Positions
 My Daily Trading Preparation Establishing Risk Parameters and Positions My Trading Goals My goals have to be consistent with my trading plan each day. For stocks, I am primarily a long-only trader (and
Elliott-Wave Fibonacci Spread Trading
 Elliott-Wave Fibonacci Spread Trading Presented by Ryan Sanden The inevitable disclaimer: Nothing presented constitutes a recommendation to buy or sell any security. While the methods described are believed
THE A-Z GUIDE TO E-MINI FUTURES TRADING
 THE A-Z GUIDE TO E-MINI FUTURES TRADING 1.800.800.3840 2 PAST PERFORMANCE IS NOT NECESSARILY INDICATIVE OF FUTURE PERFORMANCE. THE RISK OF LOSS IN TRADING FUTURES CONTRACTS OR COMMODITY OPTIONS CAN BE
Chapter 6 - Rahul Mohindar Oscillator System
 Chapter 6 - Rahul Mohindar Oscillator System The Rahul Mohindar Oscillator and its associated tools and indicators were developed by Mr. Rahul Mohindar of VIRATECH (viratechindia.com). In addition to being
CURRENCY TRADING Using Swing Breakouts in Forex Trading
 CURRENCY TRADING Using Swing Breakouts in Forex Trading 28 MAY 2009 Doug Schaff discusses the use of intermediate swing highs and swing lows to develop a shortterm approach to trading the currency markets.
5min Forex Trade Strategy Imran Sait Version 1.2 updated on 16 th Nov 2007
 5min Forex Trade Strategy Imran Sait Version 1.2 updated on 16 th Nov 2007 ( Works on All Time Frames and for all Pairs - Best used on 5Min/15min/ for short term Trades and 30min/1Hr/4hr/daily for Long
Swing Trading Tactics
 Pristine.com Presents Swing Trading Tactics With Oliver L. Velez Founder of Pristine.com, and Author of the best selling book, Tools and Tactics for the Master Day Trader Copyright 2001, Pristine Capital
Entering Late In Trends
 Highlights from Videos 40A & 40B of the Brooks Trading Course Entering Late In Trends BrooksTradingCourse.com Al Brooks Tuesday 3 rd November, 2015 BrooksTradingCourse.com BrooksPriceAction.com Main Points
James Dicks. 6 Ways to Trade the Dollar. McGraw-Hill
 2008 AGI-Information Management Consultants May be used for personal purporses only or by libraries associated to dandelon.com network. FOREX MADE EASY 6 Ways to Trade the Dollar James Dicks McGraw-Hill
Intra-Day Trading Techniques. Pristine.com Presents. Greg Capra. book, Tools and Tactics for the Master Day Trader
 Pristine.com Presents Intra-Day Trading Techniques With Greg Capra Co-Founder of Pristine.com, and Co-Author of the best selling book, Tools and Tactics for the Master Day Trader Copyright 2001, Pristine
The Crown pattern BY DENNIS BOLZE FIGURE 1 FROM HEAD-AND-SHOULDERS TO BULL CROWN
 & UTURS The rown pattern H e r e s a way to use some specific calculations to improve the odds of trading a variation of a classic chart pattern on an intraday basis. Y NNIS OLZ IGUR 1 ROM H-N-SHOULRS
Class 2: Buying Stock & Intro to Charting. Buying Stock
 Class 2: Buying Stock & Intro to Charting Today s Class Buying Stock Intro to Charting Real World Analysis Buying Stock What Is a Stock? Share of ownership in a company Publicly traded Holds monetary value
Daytrading Cup Breakouts
 A Strategic Approach Daytrading Cup Breakouts inga poslitur Here s how you can daytrade momentum trades. ntering and exiting intraday trades using E precision technical trading signals has been popular
FOREIGN EXCHANGE CYCLES:
 January 1999 FOREIGN EXCHANGE CYCLES: Get Ready to Sell the Upcoming Cycle Top in the Dollar versus the Deutschemark Trade Sell the Dollar-Mark on a break below last week's low of 1.6625 and look for 5
WHY TECHNICAL ANALYSIS? WHAT IS THE NEED FOR IT?
 WHY TECHNICAL ANALYSIS? WHAT IS THE NEED FOR IT? The Architecture of Technical Trading Mohamad Shaker Karachi Stock Exchange Do you sit here while trading? Making money? losing money? What do you do when
Presents. The Trading Information Revealed Here is not the Same as the WizardTrader.com Methods -- But Together They Pack a Powerful Punch
 Presents Killer Patterns Now You Can Have These Trading Gems -- Free! The Trading Information Revealed Here is not the Same as the WizardTrader.com Methods -- But Together They Pack a Powerful Punch 1
NEXGEN DEMO TRADING & EDUCATIONAL PLAN SIMPLIFIED
 NEXGEN DEMO TRADING & EDUCATIONAL PLAN SIMPLIFIED Please watch the intro Video so you understand Nexgen's expectations for your demo time and what you should expect from us during your demo. CLICK TO WATCH
Technical Analysis. Chart Formations. Brought to you by: FX-ebooks.com. Forex ebooks Library
 Technical Analysis Chart Formations Brought to you by: FX-ebooks.com Forex ebooks Library 1 Forex Mentor by Peter Bain The new Leading Professional Currency Trading System shows you how to trade currencies
Dow Theory. The Key To Understanding Stock Market Movement
 Dow Theory The Key To Understanding Stock Market Movement Christopher M. Quigley B.Sc.(Maj. Accounting), M.I.I. Grad., M.A. The Dow theory has been around for almost 100 years. Developed by Charles Dow
Alerts & Filters in Power E*TRADE Pro Strategy Scanner
 Alerts & Filters in Power E*TRADE Pro Strategy Scanner Power E*TRADE Pro Strategy Scanner provides real-time technical screening and backtesting based on predefined and custom strategies. With custom strategies,
By Wayne McDonell [email protected] Forex Trading Expo Las Vegas September 12 & 13 2008
 STRATEGIC & tactical forex TRADING: By Wayne McDonell [email protected] Risk Warning This is an educational presentation. There are no trade recommendations. Trading and Investing is risky business.
Investing in the Bottoming Process Mike Swanson. We're prepared to do more - The Bernanke. Stock Market Barometer
 Stock Market Barometer The Most Influential Financial Newsletter Read By Over 500 Hedge Fund Managers and Thousands of Elite Investors ~ August 5, 2012 Investing in the Bottoming Process Mike Swanson Quote
CHART PATTERNS. www.tff-onlinetrading.com
 CHART PATTERNS Technical analysis, as you have seen in our Trading Academy videos so far, is not just about charts. It does, however, rely heavily on them and often uses chart patterns to assist in making