Why the E.A.S.Y. Method?
|
|
|
- Valentine Byrd
- 9 years ago
- Views:
Transcription
1 Why the E.A.S.Y. Method? Mark Douglas, author of Trading in the Zone, states: The best traders have developed an edge and more importantly, they trust their edge.

2 Why the E.A.S.Y. Method? My trading edge rules: 1. A high probability of success. 2. Enter and exit trades without conflict or stress. 3. Trade decisions dictated by price action, not by my preconceived beliefs and opinions.

3 Developing the E.A.S.Y. Method 1. Does it really work at the moment of decision? 2. Does is have a high degree of probability and predictability? 3. Is it simple to use and follow, especially at times of critical trading decisions? 4. Does it yield more winners than losers?

4 What is E.A.S.Y.? E = Effective Provides me an effective edge in my trading.

5 What is E.A.S.Y.? E = Effective A = Accurate Delivers a high degree of probability and predictability.

6 What is E.A.S.Y.? E = Effective A = Accurate S = Simple Keeps my analysis simple in order to get a quick snapshot of the market, and make trading decisions with less stress and anxiety.

7 What is E.A.S.Y.? E = Effective A = Accurate S = Simple Y = Yield Yields a higher ratio of winning trades versus losing traders. It s a numbers game!

8 E.A.S.Y. Market Conditions 1. Price action 2. Momentum 3. Strength

9 E.A.S.Y. Chart Setup Average Price Bars Price Action Channel Traders Dynamic Index

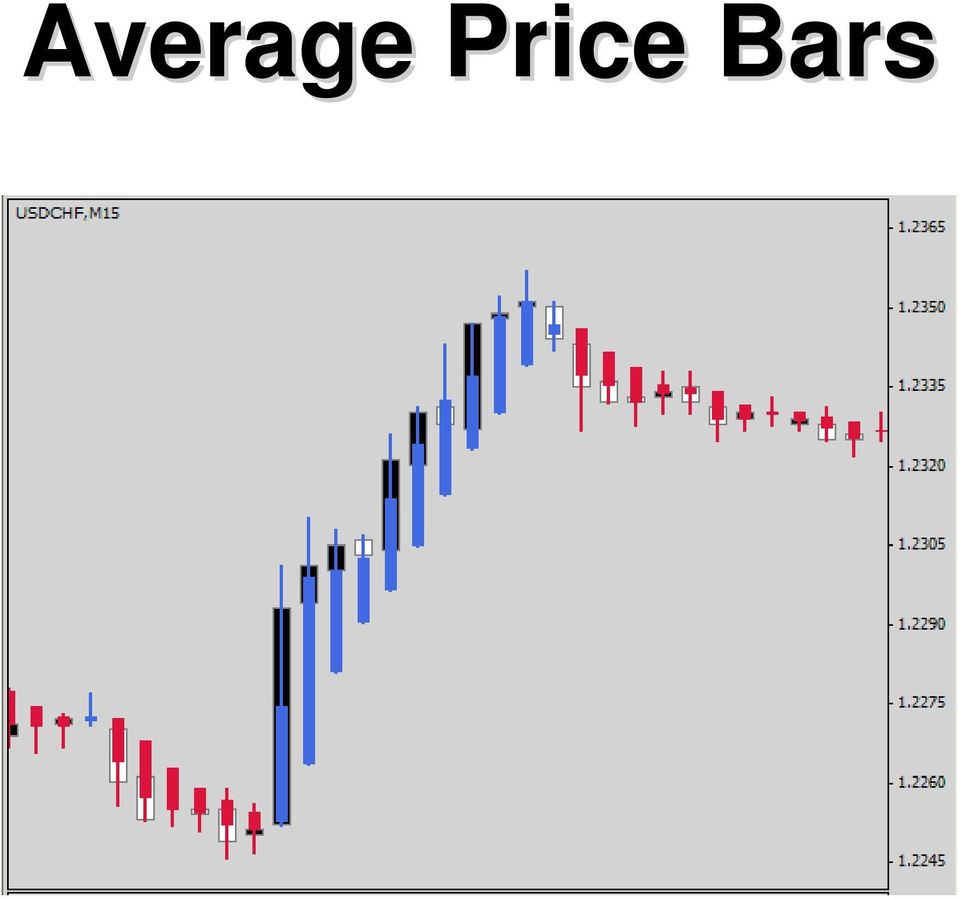
10 Average Price Bars

11 Average Price Bars Provide a better depiction of current market trend at a glance. Reveal periods of consolidation. Show market strength. Eliminate fluctuations of nominal price action. Removes the noise of price distortion of the underlying trend.

12 Average Price Bars Using the Heiken Ashi method Heiken means Average Ashi means Bar Heiken Ashi averaging technique haclose = (Open + High + Low + Close) / 4 haopen = (haopen(previous bar) + haclose(previous bar))/2 hahigh = Maximum(High, haopen) halow = Minimum(Low,haOpen)
)/2 hahigh = Maximum(High, haopen) halow =")
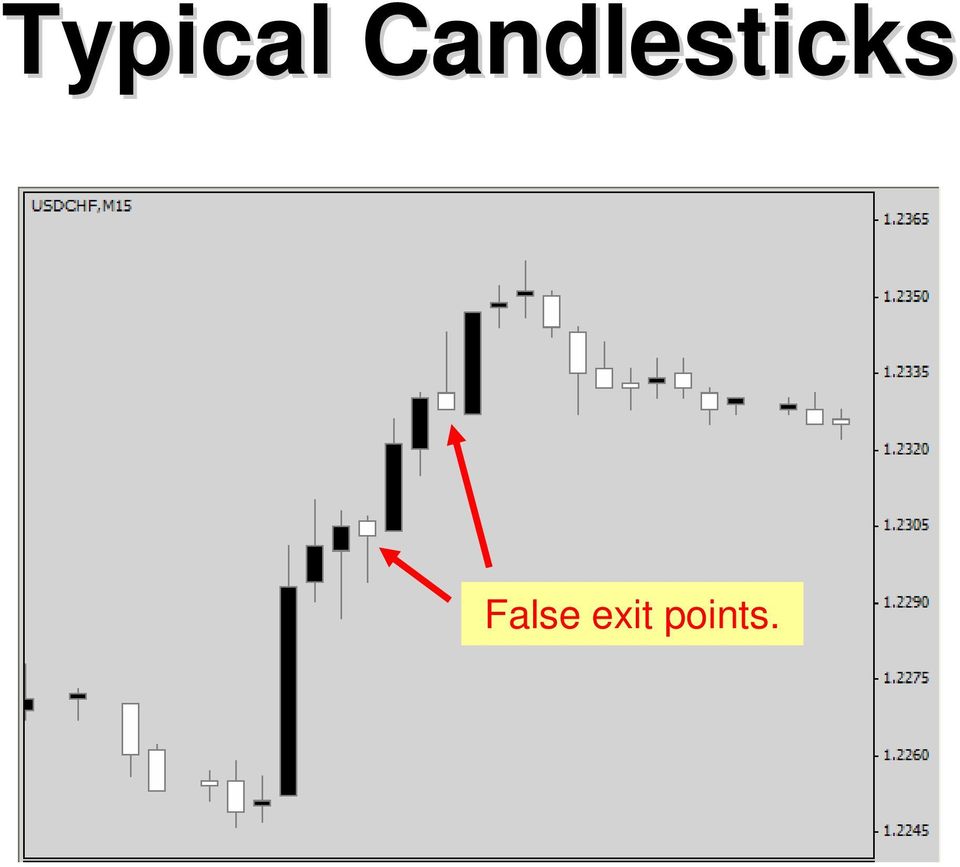
13 Typical Candlesticks
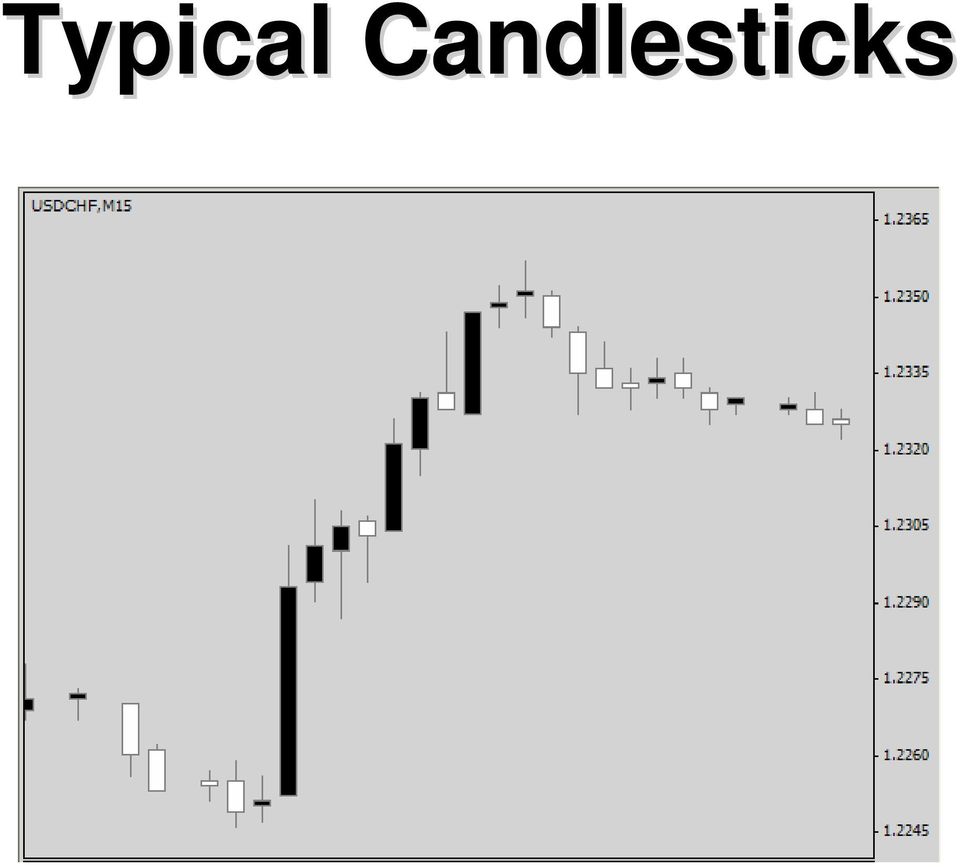
14 Typical Candlesticks False exit points.
15 Average Price Bars
16 Average Price Bars

17 Average Price Bars Positive bars mean BUY Negative bars mean SELL

18 Average Price Bars Positive bar with long upper wick means Strong BUY Negative bar with long lower wick means Strong SELL

19 Average Price Bars A positive bar with lower wick means Weak BUY A negative bar with upper wick means Weak SELL

20 Average Price Bars A very short bar means Change of Trend Shorter bar than previous bar is an indication of Change

21 Price Action Channel
22 Traditional Price Channel Two principal formats: 1. A pair of trend lines above and below price representing Support and Resistance levels. 2. An envelope of bands around price with set deviation limits such as Bollinger Bands, Keltner or Donchian Channels.
23 Traditional Price Channel Used to determine upper and lower boundaries and signal potential reversal or breakout. Traditional price channels can cause reactive trading!
24 Price Action Channel NOT a traditional price channel. Does not set outside of price in wait for the market. It resides inside price movement. Used by institutional traders and sophisticated trading programs. Promotes responsive trading!
25 Price Action Channel Provides overall trend direction. Reveals periods of consolidation. Used primarily as an Entry target. BUY Trend Average Price Bars tend to run on top of channel. SELL Trend Average Price Bars tend to run on bottom of channel.
26 Price Action Channel Use Smoothed Moving Average Top of Channel = 5 period, High Bottom of Channel = 5 period, Low
27 Price Action Channel Good BUY (Long) Trend Positive bars riding the top of the Price Action Channel Nice upward trend of the Price Action Channel.
28 Price Action Channel Good SELL (Short) Trend Nice downward trend of the Price Action Channel. Negative bars riding the bottom of the Price Action Channel
29 Price Action Channel Range-Bound, No Trend Price Action Channel is flat with no clear direction.
30 Traders Dynamic Index
31 Traders Dynamic Index A hybrid indicator developed to indicate market conditions related to trend direction, momentum, and market volatility. An all-in-one indicator!
32 Traders Dynamic Index Step 1: RSI Price Line Rules: Trade Long when RSI PL is above 50. Trade Short when RSI PL is below 50. Consider exit when RSI PL is > 68 or < 32.
33 Traders Dynamic Index RSI Price Line compared to Price Action
34 Traders Dynamic Index Step 2: Trade Signal Line Rules: Trade Long when RSI PL > TSL. Trade Short when RSI PL < TSL. Exit trade when RSI PL & TSL crossover.
35 Traders Dynamic Index Step 2: RSI PL & TSL Combined
36 Traders Dynamic Index Step 3: Market Base Line Rules: Market Base Line acts as Overall Trend. Trade Long when RSI PL is > MBL. Trade Short when RSI PL is < MBL.
37 Traders Dynamic Index Market Base Line compared to Price Action
38 Traders Dynamic Index Market Base Line forecasts Market Reversals
39 Traders Dynamic Index Step 4: Volatility Bands Rules: Add to a Long trade when RSI PL is > VB. Add to a Short trade when RSI PL is < VB. Consider exit when RSI PL crosses back over VB.
40 Traders Dynamic Index Volatility Bands compared to Daily Price Action
41 Traders Dynamic Index Volatility Bands compared to Intraday Price Action
42 Traders Dynamic Index Adjusting RSI MA & Volatility Band for Global Perspective RSI PL & TSL combined with Volatility Band
43 E.A.S.Y. Method Putting it all together! Average Price Bars - Heiken Ashi indicator Price Action Channel - 2 Smoothed Moving Averages - 5 period, High - 5 period, Low Traders Dynamic Index - RSI = 13 period, Close - Volatility Band = 34 period, Close - RSI Price Line = 2 period, Close, SMA - Trade Signal Line = 7 period, Close, SMA
44 E.A.S.Y. Method Entry Rules
45 E.A.S.Y. Method All systems GO! Average Price Bars (APB) Look for Positive or Negative bars trending. Monitor the current haclose. BUY signal Positive bar making long upper wick. SELL signal Negative bar making long lower wick. Long entry haclose > PAC High Moving Average Short entry haclose < PAC Low Moving Average
46 E.A.S.Y. Method All systems GO! Price Action Channel (PAC) Monitor the direction of the Channel. Buy signal Channel trending up. Sell signal Channel trending down. Monitor the High & Low Channel values in relation to the current haclose. Long entry haclose > PAC High & PAC uptrend Short entry haclose < PAC Low & PAC downtrend
47 E.A.S.Y. Method All systems GO! Traders Dynamic Index (TDI) Long entry = RSI PL > 50, TSL, and MBL. Consider adding to Long trade if RSI PL > the upper Volatility Band and > 50, but < 68. Avoid entering a Long trade when RSI PL > the upper Volatility Band, > 50, and > 68.
48 E.A.S.Y. Method All systems GO! Traders Dynamic Index (TDI) Short entry = RSI PL < 50, TSL, and MBL. Consider adding to Short trade if RSI PL < the lower Volatility Band and < 50, but > 68. Avoid entering a Short trade when RSI PL < the lower Volatility Band, < 50, and < 68.
49 E.A.S.Y. Method Entry Setups Long Entry: (All conditions are satisfied.) 1. APB haclose > PAC High Moving Average. 2. PAC trending up. 3. TDI = RSI PL > 50, TSL, and MBL. Short Entry: (All conditions are satisfied.) 1. APB haclose < PAC Low Moving Average. 2. PAC trending down. 3. TDI = RSI PL < 50, TSL, and MBL.
50 E.A.S.Y. Method Exit Rules
51 E.A.S.Y. Method Time to Exit the money train! APB Long exit Positive bar is much shorter than the previous bar or changes to a negative bar at close. PAC Long exit APB closes inside the channel. TDI Long exit = 1. RSI PL crosses back below the TSL to the downside. 2. RSI PL > RSI PL crosses back below the upper Volatility Band to the upside.
52 E.A.S.Y. Method Time to Exit the money train! APB Short exit Negative bar is much shorter than the previous bar or changes to a positive bar at close. PAC Short exit APB closes inside the channel. TDI Short exit 1. RSI PL crosses back over the TSL to the upside. 2. RSI PL < RSI PL crosses back up over the lower Volatility Band.
Take it E.A.S.Y.! Dean Malone 4X Los Angeles Group - HotComm January 2007
 Take it E.A.S.Y.! Dean Malone 4X Los Angeles Group - HotComm January 2007 Dean Malone Partner of Compass Foreign Exchange, LLC. Co-Founder of Forex Signal Service.com. Previous Senior National for 4X Made
SYNERGY Trading Method. CompassFX, 2009 www.compassfx.com Rev. 81009
 SYNERGY Trading Method SYNERGY Method INSTALLATION Basic Synergy is designed to automatically download onto the C: drive of your computer. If your local drive is not the C: drive, please send an email
8 Day Intensive Course Lesson 5 Stochastics & Bollinger Bands
 8 Day Intensive Course Lesson 5 Stochastics & Bollinger Bands A)Trading with Stochastic Trading With Stochastic What is stochastic? Stochastic is an oscillator that works well in range-bound markets.[/i]
Disclaimer: The authors of the articles in this guide are simply offering their interpretation of the concepts. Information, charts or examples
 Disclaimer: The authors of the articles in this guide are simply offering their interpretation of the concepts. Information, charts or examples contained in this lesson are for illustration and educational
Stochastic Oscillator.
 Stochastic Oscillator. By Jay Lakhani www.4x4u.net George Lane was the originator of the stochastic indicator in the 1960 s; the indicator tracks the market momentum. Lane observed that as prices rise
CHART TRADING GUIDE 1
 CHART TRADING GUIDE 1 How to understand chart trading This guide is designed to teach you the basics of chart trading- the chart patterns that are covered in this booklet can be used for short and medium
A GUIDE TO WL INDICATORS
 A GUIDE TO WL INDICATORS GETTING TECHNICAL ABOUT TRADING: USING EIGHT COMMON INDICATORS TO MAKE SENSE OF TRADING What s a technical indicator and why should I use them? What s the market going to do next?
Chapter 2.3. Technical Analysis: Technical Indicators
 Chapter 2.3 Technical Analysis: Technical Indicators 0 TECHNICAL ANALYSIS: TECHNICAL INDICATORS Charts always have a story to tell. However, from time to time those charts may be speaking a language you
How I Trade Profitably Every Single Month without Fail
 How I Trade Profitably Every Single Month without Fail First of all, let me take some time to introduce myself to you. I am Kelvin and I am a full time currency trader. I have a passion for trading and
MATHEMATICAL TRADING INDICATORS
 MATHEMATICAL TRADING INDICATORS The mathematical trading methods provide an objective view of price activity. It helps you to build up a view on price direction and timing, reduce fear and avoid overtrading.
8 Day Intensive Course Lesson 3
 8 Day Intensive Course Lesson 3 A) What are Fibonacci Retracements? Fibonacci Retracements What are Fibonacci retracements? Levels at which the market is expected to retrace to after a strong trend. Based
A Powerful Day Trading Strategy For Futures And Forex Markets Markus Heitkoetter
 A Powerful Day Trading Strategy For Futures And Forex Markets Markus Heitkoetter Agenda How To Configure Your Charts The Three (3) Best Indicators The Best Timeframe A Powerful Day Trading Strategy When
Heikin-Ashi-two-Bar-Strategy Guide to Strategic and Tactical Forex Trading Pull the Trigger and Hit your Targets
 Heikin-Ashi-two-Bar-Strategy Guide to Strategic and Tactical Forex Trading Pull the Trigger and Hit your Targets Currency: EUR/JPY, GBP/JPY Time frame: 5 min Indicators: BB 14, 2, ADX 14, SSD 5, 3, 3,
Technical Analysis. Technical Analysis. Schools of Thought. Discussion Points. Discussion Points. Schools of thought. Schools of thought
 The Academy of Financial Markets Schools of Thought Random Walk Theory Can t beat market Analysis adds nothing markets adjust quickly (efficient) & all info is already in the share price Price lies in
Chapter 2.3. Technical Indicators
 1 Chapter 2.3 Technical Indicators 0 TECHNICAL ANALYSIS: TECHNICAL INDICATORS Charts always have a story to tell. However, sometimes those charts may be speaking a language you do not understand and you
THE CYCLE TRADING PATTERN MANUAL
 TIMING IS EVERYTHING And the use of time cycles can greatly improve the accuracy and success of your trading and/or system. THE CYCLE TRADING PATTERN MANUAL By Walter Bressert There is no magic oscillator
TOMORROW'S TRADING TECHNOLOGY. 100% automated Fibonacci support and resistance levels that you can count on every single trading day in an instant.
 TOMORROW'S TRADING TECHNOLOGY 100% automated Fibonacci support and resistance levels that you can count on every single trading day in an instant. ProTrader Table of Contents 1. Areas A. Fibonacci Confluence
A Practical Guide to Technical Indicators; (Part 1) Moving Averages
 Moving Averages") A Practical Guide to Technical Indicators; (Part 1) Moving Averages By S.A Ghafari Over the past decades, attempts have been made by traders and researchers aiming to find a reliable method to predict
A Practical Guide to Technical Indicators; (Part 1) Moving Averages By S.A Ghafari Over the past decades, attempts have been made by traders and researchers aiming to find a reliable method to predict
New York Traders Expo 2012
 New York Traders Expo 2012 with JAMES CHEN, CTA, CMT Director of Technical Research and Education All rights reserved, FXDD Inc. 2010 Today s Topic: High Probability Strategies for Trading Forex www.fxdd.com
Chapter 1 Introduction Disclaimer: Forex Involves risk. So if you lose money you can't blame us we told you trading involves risk.
 By Casey Stubbs -Winners Edge Trading.com Table of Contents Chapter 1. Introduction Chapter 2.. Trading Plan Chapter 3.. Money Management Chapter 4. Moving Average Strategy Chapter 5. Stochastic Strategy
JUST SIT BACK AND LET THE GIRTH MODEL MAKE MONEY FOR YOU. Elham Negahdary
 Electronic Proceedings of Undergraduate Mathematics Day 4 2010 No. 2, 1 6; http://academic.udayton.edu/epumd/ JUST SIT BACK AND LET THE GIRTH MODEL MAKE MONEY FOR YOU Elham Negahdary Department of Mathematics,
The 15 50 Trading System
 Main Premise: This is considered to be one of the most straight forward systems for a live trading style for day- and/or intraday trading. The 50 SMA is one of the most commonly used moving average numbers
Alerts & Filters in Power E*TRADE Pro Strategy Scanner
 Alerts & Filters in Power E*TRADE Pro Strategy Scanner Power E*TRADE Pro Strategy Scanner provides real-time technical screening and backtesting based on predefined and custom strategies. With custom strategies,
Leon Wilson Trading Success
 Leon Wilson Trading Success A talk given by Mary de la Lande to the BullCharts User Group Meeting on 13 February 2008 1. Who is Leon Wilson? His Books and where to get them. 2. Book 1: The Business of
Forex Volatility Patterns
 Spotting Early Breakouts Forex Volatility Patterns BRUCE WALDMAN Want to catch 40 to 00 pips in each trade? Here s how you can find those entry and exit signals to make your forex trading a success. C
Charting Glossary Version 1 September 2008
 Charting Glossary Version 1 September 2008 i Contents 1 Price...1 2 Charts...1 2.1 Line, Step, Scatter, Mountain charts... 1 2.2 Bar Charts (Open/High/Low/Close charts)... 1 2.3 Candle charts... 2 2.4
The Magic Momentum Method of Trading the Forex Market
 The Magic Momentum Method of Trading the Forex Market WELCOME! Welcome to one of the easiest methods of trading the Forex market which you can use to trade most currencies, most time frames and which can
My Techniques for making $150 a Day Trading Forex *Note for my more Advanced Strategies check out my site: Click Here
 My Techniques for making $150 a Day Trading Forex *Note for my more Advanced Strategies check out my site: Click Here The Strategy We will be looking at 2 different ways to day trade the Forex Markets.
Advanced Trading Systems Collection FOREX TREND BREAK OUT SYSTEM
 FOREX TREND BREAK OUT SYSTEM 1 If you are a part time trader, this is one system that is for you. Imagine being able to take 20 minutes each day to trade. A little time at night to plan your trades and
Technical Indicators Tutorial - Forex Trading, Currency Forecast, FX Trading Signal, Forex Training Cour...
 Page 1 Technical Indicators Tutorial Technical Analysis Articles Written by TradingEducation.com Technical Indicators Tutorial Price is the primary tool of technical analysis because it reflects every
Chapter 30 1-2-3 S AND BOLLINGER BANDS
 Chapter 30 1-2-3 S AND BOLLINGER BANDS We ve mentioned previously that Bollinger Bands perform a very important function relative to ones ability to read price charts. Bollinger Bands offer a visual presentation
CHART PATTERNS. www.tff-onlinetrading.com
 CHART PATTERNS Technical analysis, as you have seen in our Trading Academy videos so far, is not just about charts. It does, however, rely heavily on them and often uses chart patterns to assist in making
Timing the Trade How to Buy Right before a Huge Price Advance
 Timing the Trade How to Buy Right before a Huge Price Advance By now you should have read my first two ebooks and learned about the life cycle of a market, stock, or ETF, and discovered the best indicators
PCRF. If the TDI is already Green over Red and we have a bullish pullback candles this is high probability... an example below:
 PCRF A pullback candle reversal formation is just my terminology for a formation that makes a candle in the direction of the trend, followed by a longer candle that, in this case, set a lower low and then
ADX breakout scanning ADX breakouts can signal momentum setups as well as exit conditions for intraday and swing traders. FIGURE 1: AFTER ADX > 40
 TRADING STRATEGIES ADX breakout scanning ADX breakouts can signal momentum setups as well as exit conditions for intraday and swing traders. BY KEN CALHOUN FIGURE 1: AFTER ADX > 40 Spotting volatility
Methods to Trade Forex Successfully for Quick Profits
 Methods to Trade Forex Successfully for Quick Profits This article is devoted to the techniques that are used to trade Forex on an intraday basis for quick profits. The aim is to make the trading a successful
The Moving Average. 2004 W. R. Booker II. All rights reserved forever and ever. And ever.
 The Moving Average By Rob Booker 2004 W. R. Booker II. All rights reserved forever and ever. And ever. The information contained in this ebook is designed to teach you methods of watching forex quotes
Using Implied Volatility And Volume
 BASIC TECHNIQUES Forecasting Trends With Indexes Using Implied Volatility And Volume Construct a trend-following system that adjusts to current market conditions. T raditionally, technicians have relied
Professional Trader Series: Moving Average Formula & Strategy Guide. by John Person
 Professional Trader Series: Moving Average Formula & Strategy Guide by John Person MOVING AVERAGE FORMULAS & STRATEGY GUIDE In an online seminar conducted for the Chicago Board of Trade, I shared how to
CHAPTER 8. REVERSAL TRADING STRATEGIES
 CHAPTER 8. REVERSAL TRADING STRATEGIES Today you will Learn Reversal trading strategies are great or mid-day and afternoon trades, especially on days when momentum is a big slower. Why Is This Important?
5min Forex Trade Strategy Imran Sait Version 1.2 updated on 16 th Nov 2007
 5min Forex Trade Strategy Imran Sait Version 1.2 updated on 16 th Nov 2007 ( Works on All Time Frames and for all Pairs - Best used on 5Min/15min/ for short term Trades and 30min/1Hr/4hr/daily for Long
FOREX analysing made easy
 FOREX analysing made easy UNDERSTANDING TECHNICAL ANALYSIS An educational tool by Blackwell Global Contents Technical Analysis 2 Line Chart 3 Bar Chart 4 Candlestick Chart 5 Support and Resistance 6 Fibonacci
6. Get Top Trading Signals with the RSI
 INTERMEDIATE 6. Get Top Trading Signals with the RSI The Relative Strength Index, or RSI, is one of the most popular momentum indicators in technical analysis. The RSI is an oscillator that moves between
Copyright 2010 by Kelvin Lee
 All rights reserved. No part of this publication may be reproduced, stored in a retrieval system, or transmitted, in any form or by any means, electronic, mechanical, photocopying, recording or otherwise,
Understanding the market
 Understanding the market Technical Analysis Approach: part I Xiaoguang Wang President, Purdue Quantitative Finance Club PhD Candidate, Department of Statistics Purdue University [email protected] Outline
FX Trading Guide: 4 Simple Ways to Spot a Trend JON MCFARLANE AND VERNON LEES
 FX Trading Guide: 4 Simple Ways to Spot a Trend JON MCFARLANE AND VERNON LEES 0 BetOnMarkets 2011 Foreword We wrote this guide to give people wanting to trade Financial Fixed Odds some simple tools and
Using Formations To Identify Profit Opportunities
 Using Formations To Identify Profit Opportunities Using Formations To Identify Profit Opportunities The concepts and strategies discussed may not be suitable for all investors. It is important that investors
Price Action Trading Course BrooksTradingCourse.com
 Al Brooks Price Action Trading Course Excerpt from Module 11 Market Cycle Market is in never ending cycle Trend Breakout Channel Trading range Trend (breakout in either direction) Breakout, channel, trading
GO Markets Trading Tools
 GO Markets Trading Tools Expert Advisors One of the most popular features of MetaTrader4 and the reason it is the world leader in Forex trading is because of the ability to use Expert Advisors. EAs are
Trading Medium-Term Divergences
 TRADING SYSTEMS Spotting Trend Reversals Trading Medium-Term Divergences Detect medium-term divergences by using the zero-lagging exponential moving average, support and resistance lines, and trendlines.
A Primer On Technical Analysis. Written by. Available at
 A Primer On Technical Analysis Written by Available at Page 1 of 23 Overview Technical Analysis (Versus Fundamental Analysis) Technical analysis is a method of forecasting price movements by looking at
Trading with the Intraday Multi-View Indicator Suite
 Trading with the Intraday Multi-View Indicator Suite PowerZone Trading, LLC indicators can provide detailed information about the conditions of the intraday market that may be used to spot unique trading
Day Trade System EZ Trade FOREX
 Day Trade System The EZ Trade FOREX Day Trading System is mainly used with four different currency pairs; the EUR/USD, USD/CHF, GBP/USD and AUD/USD, but some trades are also taken on the USD/JPY. It uses
MAGIC BREAKOUT Forex Trading Strategy
 Tim Trush & Julie Lavrin Introducing MAGIC BREAKOUT Forex Trading Strategy Your guide to financial freedom. Tim Trush, Julie Lavrin, T&J Profit Club, 2007 2015, All rights reserved www.magicbreakout.com
CYCLE TIMING CAN IMPROVE YOUR TIMING PERFORMANCE by Walter Bressert, CTA
 CYCLE TIMING CAN IMPROVE YOUR TIMING PERFORMANCE by Walter Bressert, CTA The HOLY GRAIL OF TRADING is: Trade with the trend; if up, buy the dips; if down, sell the rallies. With cycles you can identify
THE LAW OF CHARTS WITH INFORMATION NOT SHOWN IN OUR PREVIOUS COURSE MANUALS
 THE LAW OF CHARTS WITH INFORMATION NOT SHOWN IN OUR PREVIOUS COURSE MANUALS 1-2-3 HIGHS AND LOWS A typical 1-2-3 high is formed at the end of an uptrending market. Typically, prices will make a final high
Trading with ATR Price Projections.
 By Nitin Suvarna Trading with ATR Price Projections. J. Welles Wilder developed "Average True Range" (ATR) as a tool for a more precise calculation of price activity and volatility. True Range measure
Technical analysis. Course 11
 Course 11 Technical analysis Topic 1: Introduction to technical analysis... 3 Topic 2: Chart types... 4 Line charts... 4 Bar chart... 4 Candle stick charts... 5 Topic 3: Trend analysis... 6 Defining an
Moving Average Method Part 2 by www.surefire-trading.com. Ty Young
 Moving Average Method Part 2 by www.surefire-trading.com Ty Young Hi everyone, this is Ty Young with Surefire-Trading.com. In our last lesson, MA Method Part 1, we demonstrated how Moving Averages could
Metatrader 4 Edition. Version 1.XX
 Dynamic Sync Trading System Metatrader 4 Edition Version 1.XX Free Forex Studio http://www.f-fx.com http://www.forexsync.com 1 Contents I. Welcome...3 II. III. General Setup Procedures...4 System Overview...5
Technical Indicators Explained
 Chapter I. Technical Indicators Explained In This Chapter The information in this chapter is provided to help you learn how to use the technical indicators that are available for charting on the AIQ TradingExpert
Ed Heath s Guerilla Swing Trading Plan (as of 1/22/13)
") Ed Heath s Guerilla Swing Trading Plan (as of 1/22/13) Synopsis: I call my trading style Guerilla Swing Trading. I trade upward momentum stocks that have pulled back for a buying opportunity and my goal
Ed Heath s Guerilla Swing Trading Plan (as of 1/22/13) Synopsis: I call my trading style Guerilla Swing Trading. I trade upward momentum stocks that have pulled back for a buying opportunity and my goal
Using Order Book Data
 Q3 2007 Using Order Book Data Improve Automated Model Performance by Thom Hartle TradeFlow Charts and Studies - Patent Pending TM Reprinted from the July 2007 issue of Automated Trader Magazine www.automatedtrader.net
Sunil Mangwani www.fibforex123.com
 The 123 chart pattern. The 123 pattern is a reversal chart pattern which occurs very frequently and has a very high success ratio. 123 s occur at the end of trends and swings, and they are an indication
First you have to choose your daytrades from the stocks with the highest intraday ranges
 Smash & Grab vs. The Swing Trade... We e Need Them Both th The Smash and Grab Trade - These are extremely wide range stocks that can give 5-15 points in one trading session First you have to choose your
Trade Stocks Like A Pro
 Trade Stocks Like A Pro 5 TIPS Plus 3 Picks International Traders Expo New York By Dr. Charles B. Schaap, Jr. 5 Tips Tip #1: Use ADX to Trade Power Trends Tip #2: Use RSI (50/50 Strategy) for Timing the
Class 2: Buying Stock & Intro to Charting. Buying Stock
 Class 2: Buying Stock & Intro to Charting Today s Class Buying Stock Intro to Charting Real World Analysis Buying Stock What Is a Stock? Share of ownership in a company Publicly traded Holds monetary value
The Ultimate Fibonacci Guide By Fawad Razaqzada, technical analyst at FOREX.com
 The Ultimate Fibonacci Guide By Fawad Razaqzada, technical analyst at FOREX.com Who is Fibonacci? Leonardo Bonacci also known as Leonardo Fibonacci was an Italian mathematician in the 12 th century. He
Thinking Man s Trader
 Thinking Man s Trader Advanced Trader s Package Trading is a three dimensional world and the Advanced Trader s Package covers all three. Dimension three: Market Dynamics, conditions and change of conditions
Technical Analysis SAmple InveSTIng plans 1
 Technical Analysis Sample Investing Plans 1 Important Information All investing plans and rules are provided for informational purposes only, and should not be considered a recommendation of any security,
BINARY OPTIONS MENTOR USER MANUAL
 BINARY OPTIONS MENTOR USER MANUAL Version 1.4 Introduction : Welcome to Binary Options Mentor!! We provide you herewith a system of alerts with arrows for binary options. This system works for all timeframes
ChartFilter Stock Tools Training Guide
 ChartFilter Stock Tools Training Guide Disclaimer MHP Systems Inc. is not responsible for investments made as a result of using this program. The purchaser of the license for use of this program is responsible
Guidelines to use with Fibonacciqueen trade setups!!!
 Guidelines to use with Fibonacciqueen trade setups!!! Updated January 2014 As far as the price analysis that I run every day in the markets, there are three different types of Fibonacci price relationships
Stock Breakout Profits Strategy
 Stock Breakout Profits Strategy Introduction Welcome and thank you for downloading the Stock Breakout Profits system. The Stock Breakout Profits is a complete trading strategy for trading not only the
Chapter 2.4. Multiple Time Frames
 Chapter 2.4 Multiple Time Frames 0 Contents TRADING USING MULTIPLE TIME FRAMES Traders of virtually every monetary size and temperament trade the Forex market. At any given time, short-term scalpers and
Trading with the High Performance Intraday Analysis Indicator Suite
 Trading with the High Performance Intraday Analysis Indicator Suite PowerZone Trading indicators can provide detailed information about the conditions of the intraday market that may be used to spot unique
FUTURES STRATEGY: Short-term CCI p. 10. ADJUSTING TO stock index futures shift p. 14. STRADDLES, STRANGLES, and volatility p. 16
 May 2009 Volume 3, No. 5 FUTURES STRATEGY: Short-term CCI p. 10 ADJUSTING TO stock index futures shift p. 14 STRADDLES, STRANGLES, and volatility p. 16 FEAR AND LOATHING in the options market p. 20 TRADING
ForexIndicator.org. Presents. Written By Kelvin Lee
 ForexIndicator.org Presents Written By Kelvin Lee All rights reserved. No part of this publication may be reproduced, stored in a retrieval system, or transmitted, in any form or by any means, electronic,
Using Bollinger Bands. by John Bollinger
 Article Text Copyright (c) Technical Analysis Inc. 1 Stocks & Commodities V. 10:2 (47-51): Using Bollinger Bands by John Bollinger Using Bollinger Bands by John Bollinger Trading bands, which are lines
The information contained herein is derived from sources we believe to be reliable, but of which we have not independently verified. Forexyard.
 STRATEGIES FOR FOREX MARKET PREDICTIONS IN 2011 By: Russel Glaser, Chief Market Analyst: FOREXYARD Date: February 2011 In this Issue: 1. Incorporating Long Term Charts for Market Predictions 2. What is
STOCK TRADING INDICATORS EXPLAINED. How To Make Profit Trading Stocks Using Indicators
 STOCK TRADING INDICATORS EXPLAINED How To Make Profit Trading Stocks Using Indicators Contents What are Indicators?... 4 The ADX Indicator... 5 How to Use ADX Indicator... 5 Technical Indicator ADX...
CONTROLLING. Your TRADES, MONEY& EMOTIONS. By Chris Vermeulen
 CONTROLLING Your TRADES, MONEY& EMOTIONS By Chris Vermeulen INTRODUCTION In this condensed guide I have put together some key points which I think should be read a few times in order for these critical
Action Forex Company Limited 2012
 1 TABLE OF CONTENTS TABLE OF CONTENTS... 2 INTRODUCTION... 3 CHAPTER 1 - USE OF CANDLESTICK CHARTS... 4 1.1 MORE BULLISH PATTERNS... 5 Piercing Line... 5 Three White Soldiers... 6 Rising Three Methods...
Table of Contents. Preface. Chapter 1: TRADING BASICS. Chapter 2: BASIC TOOLS. Chapter 3: ADX. Chapter 4: ACCUMULATION LINE
 Table of Contents Preface Chapter 1: TRADING BASICS Chapter 2: BASIC TOOLS Chapter 3: ADX Chapter 4: ACCUMULATION LINE Chapter 5: AVERAGE TRUE RANGE Chapter 6: CANDLESTICKS Chapter 7: MACD Chapter 8: MOVING
TRADING EDUCATORS WELCOMES YOU TO OUR TRADERS UNIVERSITY
 TRADING EDUCATORS WELCOMES YOU TO OUR TRADERS UNIVERSITY PREREQUISITE FOR THIS MATERIAL The prerequisite for this material is having studied The Law of Charts. Study it thoroughly. You must know about
The Best-Kept Secret of Forex
 The Best-Kept Secret of Forex Many traders go through trading system after trading system, only to find that most of them don t work. The truth of the matter is that there are many effective trading systems
GMMA 2.0 User Guide. August 2010 Edition PF-30-01-02
 GMMA 2.0 User Guide GMMA 2.0 User Guide August 2010 Edition PF-30-01-02 Support Worldwide Technical Support and Product Information www.nirvanasystems.com Nirvana Systems Corporate Headquarters 7000 N.
NEST STARTER PACK. Omnesys Technologies. Nest Starter Pack. February, 2012. https://plus.omnesysindia.com Page 1 of 36
 Omnesys Technologies Nest Starter Pack February, 2012 https://plus.omnesysindia.com Page 1 of 36 Document Information DOCUMENT CONTROL INFORMATION DOCUMENT Nest Starter Pack User Manual VERSION 1.1 VERSION
Active Trend Trading System
 Active Trend Trading System Candle Light Trader: Dennis W. Wilborn A Trend Should Be Assumed to Continue in Effect Until Such Time as Its Reversal Has Been Definitely Signaled Edwards & Magee Disclaimer
Chapter 3.4. Forex Options
 Chapter 3.4 Forex Options 0 Contents FOREX OPTIONS Forex options are the next frontier in forex trading. Forex options give you just what their name suggests: options in your forex trading. If you have
I found a gorgeous swing on a 240-minute bar chart of the euro FX against the US dollar FX chart. Let's take a look at it:
 Tips for Traders 4/13/2009 10:38:00 AM The Right Way to Use Lines in Trading I have been working with lines as my main trading tool for more than 38 years now. Lines are simple, lines A trader e-mailed
Definitions to Basic Technical Analysis Terms. www.recognia.com
 Definitions to Basic Technical Analysis Terms www.recognia.com A Alert An alert is a notification sent when a significant event occurs in one or more investments of importance to a trader. Recognia sends
James Dicks. 6 Ways to Trade the Dollar. McGraw-Hill
 2008 AGI-Information Management Consultants May be used for personal purporses only or by libraries associated to dandelon.com network. FOREX MADE EASY 6 Ways to Trade the Dollar James Dicks McGraw-Hill
The Building Blocks for Succeeding with Forex Trading
 The Building Blocks for Succeeding with Forex Trading This e-book was created by traders and for traders with the aim of equipping traders with the right skills of earning big returns from trading forex
I Really Trade. Trading Patterns for Stocks & Commodities. Introducing The False Break Buy and Sell Pattern
 2008 Trading Patterns for Stocks & Commodities It doesn t matter if you are a longterm investor, short swing trader or day trader, you are always looking for an advantageous spot to enter your position.
Trading Power Trends with ADX
 Trading Power Trends with ADX By Dr. Charles B. Schaap, Jr. International Trader s Expo New York City 18 February 2014 Disclaimer The information in this lecture is for educational purposes. No particular
PART 1 CROSSING EMA. I will pause between the two parts for questions, but if I am not clear enough at any stage please feel free to interrupt.
 PART 1 CROSSING EMA Good evening everybody, I d like to start by introducing myself. My name is Andrew Gebhardt and I am part of Finex LLP, a small Investment Manager which amongst other endeavours also
THE A-Z GUIDE TO E-MINI FUTURES TRADING
 THE A-Z GUIDE TO E-MINI FUTURES TRADING 1.800.800.3840 2 PAST PERFORMANCE IS NOT NECESSARILY INDICATIVE OF FUTURE PERFORMANCE. THE RISK OF LOSS IN TRADING FUTURES CONTRACTS OR COMMODITY OPTIONS CAN BE
EUR/USD Trading Strategy
 EUR/USD Trading Strategy TRADING SIGNALS TRADING EDUCATION TRADING STRATEGIES Kathy Lien & Boris Schlossberg www.bkforex.com TRADING SIGNALS & TRADING EDUCATION Risk Disclosure BKForex LLC is a registered
Emini Trading Strategy
 Emini Trading Strategy The following comments are meant as a starting point for developing an emini trading strategy. I m sure things will be added over time. But this is what I have so far. I begin with