Web History Visualisation for Forensic Investigations. Sarah Lowman
|
|
|
- Philippa Reynolds
- 7 years ago
- Views:
Transcription
1 Web History Visualisation for Forensic Investigations Sarah Lowman


2 Outline Background Visualisation Webscavator Testing Conclusions 2
3 The Problem + Proposed Solution Related Work Background 3 3
4 Web History Analysis Web history analysis is a common and important part of a digital investigation. Critical evidence can be found in the suspect s browser history, including websites visited, searches conducted and web-based . Web history may also provide an alibi, a general user profile or behavioural patterns. Neil Entwhistle was convicted of murdering his wife and baby daughter based on web evidence: 4
5 Current Process Convert Internet history to spreadsheet format. Use an Internet history analysis tool such as Net Analysis or Web Historian. 5

6 6
7 Problems 1. The files are very big. 2. Each entry is a piece of text that needs to be read. 3. Correlations, patterns and anomalies are difficult to spot between lines of text. 4. Is it difficult to ask questions about the data. Columns can be sorted and searched only. 5. The data is difficult to present to those who are not technically minded. 6. Analysis requires high levels of concentration, patience and is error prone. 7
8 Proposed Solution Build a tool that takes in web history and produces visualisations of the data 8
9 Hypothesis Visualisations will improve: 1. The accuracy of investigators 2. The speed at which they can answer questions 3. The mood of the investigators 9
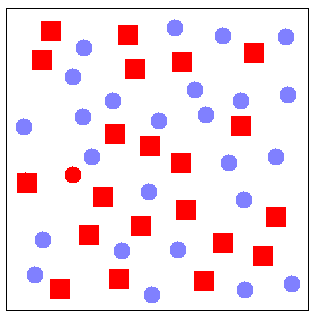
10 Related Work Forensic Timelines: CyberForensic TimeLab (CFTL), a timeline-based forensic tool which finds and plots all forensic data based on timestamps [Olsson & Boldt, 2009]. Visualisation for file attributes: Coloured square blocks to represent files in a directory, with the intensity of the colour indicating an attribute such as file type or size [Teerlink & Erbacher, 2006]. Word clouds to focus on the words found in file contents [Stamps et Al, 2009]. 10
11 Visualisation Background Examples Visualisations 11 11
12 Visualisation One Picture is Worth Ten Thousand Words Chinese proverb Un bon croquis vaut mieux qu'un long discours ( A good sketch is better than a long speech ) Napoleon Bonaparte 12
13 Visualisations Visualisations can act as a temporary storage area for human cognitive processes Reduce the amount of information that must be held in working memory. Allow the brain to hold and process more information simultaneously. The human visual system is able to perceive graphical information such as pictures, videos and charts in parallel, but text only sequentially [Hendee & Wells, 1997]. Next couple of slides show examples of how the human visual system work Preattentive Processing Theory Gestalt Theory 13
14 14 14
15 15 15
16 16 16
17 17 17
18 18 18
19 Good Visualisations Information retrieval goals [Marchionini, 1997]: To find a narrow subset of items that match a particular query To develop an understanding of patterns within a set of data Visual information seeking mantra [Shneiderman, 1996]: 1. Overview 2. Zoom 3. Filter 4. Details-on-demand 5. Relate 6. History 7. Extract 19
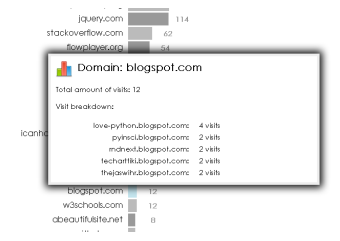
20 The Design Screenshots Webscavator 20 20
21 Webscavator Design Webscavator is a web application written in a mixture of Python and JavaScript. Can make use of AJAX and JavaScript graphics libraries. Autopsy (a web-based graphical interface for SleuthKit) is run in a similar way. By default, Webscavator will listen on a local port so that no other networked devices can gain access. For storing data, it uses SQLite, a lightweight open-source RDBMS. 21
22 Webscavator For input, Webscavator accepts CSV and XML files from programs such as Net Analysis and Web Historian Webscavator has five tabs, each showing a different visualisation. Filters can be applied to some of the tabs. Filters allow the user to highlight or remove web history entries from the visualisations by matching various attributes. Narrow down results Highlight particular features of interest Reduce clutter due to irrelevant entries 22
23 Heat Maps In a heat-map, different values are represented as different colours usually a range. Condense large amounts of information into a small space to bring out patterns. Webscavator's heat-map can highlight patterns in web browser usage times. 23

24 24 24
25 Timeline Main visualisation The timeline has the day along the x-axis and the time along the y-axis. Each point on the graph is a web history entry. Hovering over a particular point will display a popup Clicking on a point will display more detailed information underneath the timeline. Double-clicking on part of the graph causes it to zoom centred on that part. The units of the y-axis are scaled automatically depending on zoom level. By clicking and dragging, the graph can be panned. 25

26 26 26
27 Bar Chart Shows the top domain names that appear in the web history. The chart can be configured to show the top 50, top 100 or all visited domain names. The total number of visits to a domain is appended to that domain's bar. A bar chart provides a quick visual indication of general browsing habits, and may help to determine useful filters to apply to other visualisations such as the timeline 27
28 28 28
29 Word Cloud A word cloud displays a set of words with the font size of each varying depending on how important the word is. large words attract more attention than smaller words Webscavator s word cloud shows all the words entered into search engines in the web history. The more a search words occurs, the larger it is displayed. When words in the word cloud are clicked, a pop-up is displayed showing a list of the full searches the word appeared in, which allows searches for the word to be viewed in context 29
30 30 30
31 Tree Map + Pie Chart Tree maps show hierarchical relationships between objects Tree views are a common way of displaying files in file manager applications Webscavator s tree map shows all the local files that have accesses recorded in the web history. These only appear in Internet Explorer's index.dat files The indentation of folders gives context showing where files are in relation to each other Under each drive is a pie chart showing the breakdown of the different file types accessed. 31
32 32 32
33 The Participants and Test Setup Results User Testing 33 33
34 Testing Setup Three participants all forensics investigators Two scenarios One based on industry forensics (employee surfing) One for police forensics (jewellery store robbery) Each scenario had a set of questions to answer Each participant used Net Analysis and Webscavator Used different datasets so the answers were not the same Random whether Net Analysis/Webscavator was used first Rated on: Number of correct answers Speed at which the questions were answered The participants confidence in their answer 34
35 Results Scenario A Scenario B Net Analysis Webscavator Net Analysis Webscavator User 1 Correct answer 67% 100% 33% 100% Confidence 37% 77% 64% 78% Time 18:54 17:01 17:57 09:50 User 2 Correct answer 67% 83% 78% 78% Confidence 73% 83% 82% 78% Time 19:35 10:13 17:12 08:17 User 3 Correct answer 83% 83% 78% 100% Confidence 57% 63% 78% 78% Time 14:16 8:42 15:25 07:47 35

36 Results 36
37 Further Work Conclusions Conclusions 37 37
38 Further Work Allow filters to be viewed, edited and deleted. Add reporting. Currently Webscavator is just a visualisation tool, however to be used in practice it needs to be able to generate reports and images. More integrated visualisations. Following on from usability questionnaire results, more could be done to integrate the different visualisations. Fuzzy and periodic searching. Match values that are homophones and spelt incorrectly Matches values that are at regular intervals apart remove tickers, RSS feeds. 38
39 Conclusions Investigators face several problems when using the non-visual tools that are currently used to analyse web history data: Information overload Difficulty spotting correlations and patterns Difficulty in obtaining a summary overview of data Visualisation is particularly apt for solving these User testing results showed that Webscavator's visualisations perform well when compared to Net Analysis. Average speed and confidence increased, errors decreased and investigators enjoyed using the Webscavator more These results show that visualisations should be taken seriously by the producers of forensic software. 39
40 References Olsson, J., & Boldt, M. (2009). Computer forensic timeline visualization tool. Digital Investigation, Volume 6, pp. S78-S87. Teerlink, S., & Erbacher, R. (2006). Improving the Computer Forensic Analysis Process through Visualization. Communications of the ACM, Volume 49. Issue 2, pp Stamps, A. S., Franck, J., Carver, J., Jankun-Kelly, T., Wilson, D., & Swan, J. E. (2009). A Visual Analytic Framework for Exploring Relationships in Textual Contents of Digital Forensics Evidence. Proceedings of Workshop on Visualization for Cyber Security, pp. 39. Hendee,W. R., &Wells, P. N. (1997). The perception of visual information. Springer. Marchionini, G. (1997). Information Seeking In Electronic Environments. Cambridge University Press: Issue 9 of Cambridge series on human-computer interaction. Shneiderman, B. (1996). The Eyes Have It: A Task by Data Type Taxonomy for Information Visualizations. IEEE Symposium on Visual Languages, pp Wilkinson, L., & Friendly, M. (2009). The history of the cluster heat map. The American Statistician. 40
41 Questions
Web History Visualisation for Forensic Investigations
 Web History Visualisation for Forensic Investigations Sarah Lowman 1 and Ian Ferguson 2 1 sarah@lowmanio.co.uk 2 University of Abertay I.Ferguson@abertay.ac.uk Abstract. Current tools for analysing web
VISUALIZATION. Improving the Computer Forensic Analysis Process through
 By SHELDON TEERLINK and ROBERT F. ERBACHER Improving the Computer Forensic Analysis Process through VISUALIZATION The ability to display mountains of data in a graphical manner significantly enhances the
TIBCO Spotfire Business Author Essentials Quick Reference Guide. Table of contents:
 Table of contents: Access Data for Analysis Data file types Format assumptions Data from Excel Information links Add multiple data tables Create & Interpret Visualizations Table Pie Chart Cross Table Treemap
MicroStrategy Desktop
 MicroStrategy Desktop Quick Start Guide MicroStrategy Desktop is designed to enable business professionals like you to explore data, simply and without needing direct support from IT. 1 Import data from
The Eyes Have It: A Task by Data Type Taxonomy for Information Visualizations. Ben Shneiderman, 1996
 The Eyes Have It: A Task by Data Type Taxonomy for Information Visualizations Ben Shneiderman, 1996 Background the growth of computing + graphic user interface 1987 scientific visualization 1989 information
Interactive Information Visualization of Trend Information
 Interactive Information Visualization of Trend Information Yasufumi Takama Takashi Yamada Tokyo Metropolitan University 6-6 Asahigaoka, Hino, Tokyo 191-0065, Japan ytakama@sd.tmu.ac.jp Abstract This paper
MicroStrategy Analytics Express User Guide
 MicroStrategy Analytics Express User Guide Analyzing Data with MicroStrategy Analytics Express Version: 4.0 Document Number: 09770040 CONTENTS 1. Getting Started with MicroStrategy Analytics Express Introduction...
vrealize Operations Manager User Guide
 vrealize Operations Manager User Guide vrealize Operations Manager 6.0.1 This document supports the version of each product listed and supports all subsequent versions until the document is replaced by
Understanding Data: A Comparison of Information Visualization Tools and Techniques
 Understanding Data: A Comparison of Information Visualization Tools and Techniques Prashanth Vajjhala Abstract - This paper seeks to evaluate data analysis from an information visualization point of view.
UFORIA - A FLEXIBLE VISUALISATION PLATFORM FOR DIGITAL FORENSICS AND E-DISCOVERY
 UFORIA - A FLEXIBLE VISUALISATION PLATFORM FOR DIGITAL FORENSICS AND E-DISCOVERY Arnim Eijkhoudt & Sijmen Vos Amsterdam University of Applied Sciences Amsterdam, The Netherlands a.eijkhoudt@hva.nl, sijmenvos@gmail.com
JustClust User Manual
 JustClust User Manual Contents 1. Installing JustClust 2. Running JustClust 3. Basic Usage of JustClust 3.1. Creating a Network 3.2. Clustering a Network 3.3. Applying a Layout 3.4. Saving and Loading
DiskPulse DISK CHANGE MONITOR
 DiskPulse DISK CHANGE MONITOR User Manual Version 7.9 Oct 2015 www.diskpulse.com info@flexense.com 1 1 DiskPulse Overview...3 2 DiskPulse Product Versions...5 3 Using Desktop Product Version...6 3.1 Product
OECD.Stat Web Browser User Guide
 OECD.Stat Web Browser User Guide May 2013 May 2013 1 p.10 Search by keyword across themes and datasets p.31 View and save combined queries p.11 Customise dimensions: select variables, change table layout;
QAD Business Intelligence Dashboards Demonstration Guide. May 2015 BI 3.11
 QAD Business Intelligence Dashboards Demonstration Guide May 2015 BI 3.11 Overview This demonstration focuses on one aspect of QAD Business Intelligence Business Intelligence Dashboards and shows how this
Sisense. Product Highlights. www.sisense.com
 Sisense Product Highlights Introduction Sisense is a business intelligence solution that simplifies analytics for complex data by offering an end-to-end platform that lets users easily prepare and analyze
Market Pricing Override
 Market Pricing Override MARKET PRICING OVERRIDE Market Pricing: Copy Override Market price overrides can be copied from one match year to another Market Price Override can be accessed from the Job Matches
The Reporting Console
 Chapter 1 The Reporting Console This chapter provides a tour of the WebTrends Reporting Console and describes how you can use it to view WebTrends reports. It also provides information about how to customize
IBM Information Server
 IBM Information Server Version 8 Release 1 IBM Information Server Administration Guide SC18-9929-01 IBM Information Server Version 8 Release 1 IBM Information Server Administration Guide SC18-9929-01
Snagit 10. Getting Started Guide. March 2010. 2010 TechSmith Corporation. All rights reserved.
 Snagit 10 Getting Started Guide March 2010 2010 TechSmith Corporation. All rights reserved. Introduction If you have just a few minutes or want to know just the basics, this is the place to start. This
Visualizing the Top 400 Universities
 Int'l Conf. e-learning, e-bus., EIS, and e-gov. EEE'15 81 Visualizing the Top 400 Universities Salwa Aljehane 1, Reem Alshahrani 1, and Maha Thafar 1 saljehan@kent.edu, ralshahr@kent.edu, mthafar@kent.edu
Business Insight Report Authoring Getting Started Guide
 Business Insight Report Authoring Getting Started Guide Version: 6.6 Written by: Product Documentation, R&D Date: February 2011 ImageNow and CaptureNow are registered trademarks of Perceptive Software,
Novell ZENworks Asset Management 7.5
 Novell ZENworks Asset Management 7.5 w w w. n o v e l l. c o m October 2006 USING THE WEB CONSOLE Table Of Contents Getting Started with ZENworks Asset Management Web Console... 1 How to Get Started...
Public Online Data - The Importance of Colorful Query Trainers
 BROWSING LARGE ONLINE DATA WITH QUERY PREVIEWS Egemen Tanin * egemen@cs.umd.edu Catherine Plaisant plaisant@cs.umd.edu Ben Shneiderman * ben@cs.umd.edu Human-Computer Interaction Laboratory and Department
Web Analytics. FAQs MONITOR, ANALYZE, TRACK. Page 1
 Web Analytics FAQs MONITOR, ANALYZE, TRACK Page 1 Web Analytics FAQs Monitor, Analyze, Track This document contains a list of frequently asked questions on the following areas of the Web Analytics system:
Scientific Graphing in Excel 2010
 Scientific Graphing in Excel 2010 When you start Excel, you will see the screen below. Various parts of the display are labelled in red, with arrows, to define the terms used in the remainder of this overview.
Technical Specification. Solutions created by knowledge and needs
 Technical Specification Solutions created by knowledge and needs The industrial control and alarm management system that integrates video, voice and data Technical overview Process Architechture OPC-OCI
Instagram Post Data Analysis
 Instagram Post Data Analysis Yanling He Xin Yang Xiaoyi Zhang Abstract Because of the spread of the Internet, social platforms become big data pools. From there we can learn about the trends, culture and
<Insert Picture Here> Web 2.0 Data Visualization with JSF. Juan Camilo Ruiz Senior Product Manager Oracle Development Tools
 Web 2.0 Data Visualization with JSF Juan Camilo Ruiz Senior Product Manager Oracle Development Tools 1 The preceding is intended to outline our general product direction. It is intended
Interactive Timeline Viewer (ItLv): A Tool to Visualize Variants Among Documents
: A Tool to Visualize Variants Among Documents") Interactive Timeline Viewer (ItLv): A Tool to Visualize Variants Among Documents Carlos Monroy, Rajiv Kochumman, Richard Furuta, and Eduardo Urbina TEES Center for the Study of Digital Libraries Texas
Interactive Timeline Viewer (ItLv): A Tool to Visualize Variants Among Documents Carlos Monroy, Rajiv Kochumman, Richard Furuta, and Eduardo Urbina TEES Center for the Study of Digital Libraries Texas
How To Create A Visualisation For Forensic Investigations
 WEB HISTORY VISUALISATION FOR FORENSIC INVESTIGATIONS SARAH LOWMAN This dissertation was submitted in part fulfilment of requirements for the degree of MSc Forensic Informatics DEPT. OF COMPUTER AND INFORMATION
SAS Visual Analytics dashboard for pollution analysis
 SAS Visual Analytics dashboard for pollution analysis Viraj Kumbhakarna VP Sr. Analytical Data Consultant MUFG Union Bank N.A., San Francisco, CA Baskar Anjappan, VP SAS Developer MUFG Union Bank N.A.,
ALIBI Witness and ALIBI Witness HD Apps for Android - Quick Start Guide
 ALIBI Witness and ALIBI Witness HD Apps for Android - Quick Start Guide Version 4.0.3 ALIBI Witness and ALIBI Witness HD are free applications (Apps) for the and Android OS (V2.3.3 or later) smartphone
Using SPSS, Chapter 2: Descriptive Statistics
 1 Using SPSS, Chapter 2: Descriptive Statistics Chapters 2.1 & 2.2 Descriptive Statistics 2 Mean, Standard Deviation, Variance, Range, Minimum, Maximum 2 Mean, Median, Mode, Standard Deviation, Variance,
FileNet System Manager Dashboard Help
 FileNet System Manager Dashboard Help Release 3.5.0 June 2005 FileNet is a registered trademark of FileNet Corporation. All other products and brand names are trademarks or registered trademarks of their
Monitoring Replication
 Monitoring Replication Article 1130112-02 Contents Summary... 3 Monitor Replicator Page... 3 Summary... 3 Status... 3 System Health... 4 Replicator Configuration... 5 Replicator Health... 6 Local Package
Microsoft Access 2007 - Creating Filters and Tables
 Platform: Windows PC Ref no: USER 165 Date: November 2007 Version: 1 Authors: Derek Sheward, Claire Napier Creating Filters in Microsoft Access 2007 This is the third document in series of five about Microsoft
LICENSE4J FLOATING LICENSE SERVER USER GUIDE
 LICENSE4J FLOATING LICENSE SERVER USER GUIDE VERSION 4.5.5 LICENSE4J www.license4j.com Table of Contents Getting Started... 2 Floating License Usage... 2 Installation... 4 Windows Installation... 4 Linux
Viewing and Troubleshooting Perfmon Logs
 CHAPTER 7 To view perfmon logs, you can download the logs or view them locally. This chapter contains information on the following topics: Viewing Perfmon Log Files, page 7-1 Working with Troubleshooting
WEKA Explorer User Guide for Version 3-4-3
 WEKA Explorer User Guide for Version 3-4-3 Richard Kirkby Eibe Frank November 9, 2004 c 2002, 2004 University of Waikato Contents 1 Launching WEKA 2 2 The WEKA Explorer 2 Section Tabs................................
An introduction to the features of. Google Analytics
 Cubik OneStopCMS An introduction to the features of Google Analytics Author: Cubik Helpdesk Email: help@cubik.co.uk Date: 27 January 2011 Version: 1.5 Cubik, Glenewes House, Gate Way Drive, Yeadon, Leeds,
Webmail Instruction Guide
 Webmail Instruction Guide This document is setup to guide your through the use of the many features of our Webmail system. You may either visit www.safeaccess.com or webmail.safeaccess.com to login with
Cloud Signature Creator: An Application to Establish Cloud-Computing Application Artifacts
 University of Rhode Island DigitalCommons@URI Open Access Master's Theses 2015 Cloud Signature Creator: An Application to Establish Cloud-Computing Application Artifacts Gerald W. Gent University of Rhode
Infoview XIR3. User Guide. 1 of 20
 Infoview XIR3 User Guide 1 of 20 1. WHAT IS INFOVIEW?...3 2. LOGGING IN TO INFOVIEW...4 3. NAVIGATING THE INFOVIEW ENVIRONMENT...5 3.1. Home Page... 5 3.2. The Header Panel... 5 3.3. Workspace Panel...
How is it helping? PragmatiQa XOData : Overview with an Example. P a g e 1 12. Doc Version : 1.3
 XOData is a light-weight, practical, easily accessible and generic OData API visualizer / data explorer that is useful to developers as well as business users, business-process-experts, Architects etc.
Subscribe to RSS in Outlook 2007. Find RSS Feeds. Exchange Outlook 2007 How To s / RSS Feeds 1of 7
 Exchange Outlook 007 How To s / RSS Feeds of 7 RSS (Really Simple Syndication) is a method of publishing and distributing content on the Web. When you subscribe to an RSS feed also known as a news feed
Creating a Poster Presentation using PowerPoint
 Creating a Poster Presentation using PowerPoint Course Description: This course is designed to assist you in creating eye-catching effective posters for presentation of research findings at scientific
SuperViz: An Interactive Visualization of Super-Peer P2P Network
 SuperViz: An Interactive Visualization of Super-Peer P2P Network Anthony (Peiqun) Yu pqyu@cs.ubc.ca Abstract: The Efficient Clustered Super-Peer P2P network is a novel P2P architecture, which overcomes
Pcounter Administrator Reports Generator User Manual
 Pcounter Administrator Reports Generator User Manual For Pcounter for Windows version 2.50 upwards Contents 1. Introduction to the Reports Generator 2. Common Controls 2.1 Navigation Bar 2.2 Control Buttons
TOP-DOWN DATA ANALYSIS WITH TREEMAPS
 TOP-DOWN DATA ANALYSIS WITH TREEMAPS Martijn Tennekes, Edwin de Jonge Statistics Netherlands (CBS), P.0.Box 4481, 6401 CZ Heerlen, The Netherlands m.tennekes@cbs.nl, e.dejonge@cbs.nl Keywords: Abstract:
Dime.Scheduler for Dynamics NAV
 Dime.Scheduler for Dynamics NAV Dime.Scheduler is a visual resource planning tool with a rich, interactive web client that is fully drag & drop enabled and that has the familiar Office 2010-like user interface
The Role of Reactive Typography in the Design of Flexible Hypertext Documents
 The Role of Reactive Typography in the Design of Flexible Hypertext Documents Rameshsharma Ramloll Collaborative Systems Engineering Group Computing Department Lancaster University Email: ramloll@comp.lancs.ac.uk
Ofgem Carbon Savings Community Obligation (CSCO) Eligibility System
 Eligibility System") Ofgem Carbon Savings Community Obligation (CSCO) Eligibility System User Guide 2015 Page 1 Table of Contents Carbon Savings Community Obligation... 3 Carbon Savings Community Obligation (CSCO) System...
Ofgem Carbon Savings Community Obligation (CSCO) Eligibility System User Guide 2015 Page 1 Table of Contents Carbon Savings Community Obligation... 3 Carbon Savings Community Obligation (CSCO) System...
User Guide. Analytics Desktop Document Number: 09619414
 User Guide Analytics Desktop Document Number: 09619414 CONTENTS Guide Overview Description of this guide... ix What s new in this guide...x 1. Getting Started with Analytics Desktop Introduction... 1
Model 288B Charge Plate Graphing Software Operators Guide
 Monroe Electronics, Inc. Model 288B Charge Plate Graphing Software Operators Guide P/N 0340175 288BGraph (80207) Software V2.01 100 Housel Ave PO Box 535 Lyndonville NY 14098 1-800-821-6001 585-765-2254
Pure1 Manage User Guide
 User Guide 11/2015 Contents Overview... 2 Pure1 Manage Navigation... 3 Pure1 Manage - Arrays Page... 5 Card View... 5 Expanded Card View... 7 List View... 10 Pure1 Manage Replication Page... 11 Pure1
Dynamic Visualization and Time
 Dynamic Visualization and Time Markku Reunanen, marq@iki.fi Introduction Edward Tufte (1997, 23) asked five questions on a visualization in his book Visual Explanations: How many? How often? Where? How
P6 Analytics Reference Manual
 P6 Analytics Reference Manual Release 3.2 October 2013 Contents Getting Started... 7 About P6 Analytics... 7 Prerequisites to Use Analytics... 8 About Analyses... 9 About... 9 About Dashboards... 10 Logging
Reporting Services. White Paper. Published: August 2007 Updated: July 2008
 Reporting Services White Paper Published: August 2007 Updated: July 2008 Summary: Microsoft SQL Server 2008 Reporting Services provides a complete server-based platform that is designed to support a wide
Intermediate PowerPoint
 Intermediate PowerPoint Charts and Templates By: Jim Waddell Last modified: January 2002 Topics to be covered: Creating Charts 2 Creating the chart. 2 Line Charts and Scatter Plots 4 Making a Line Chart.
WhatsVirtual for WhatsUp Gold v16.0 User Guide
 WhatsVirtual for WhatsUp Gold v16.0 User Guide Contents Welcome Welcome to WhatsVirtual... 1 Using WhatsVirtual Discovering virtual devices... 2 Viewing discovery output... 4 Manage and monitor virtual
Call Logging Quick Reference User Guide
 Call Logging provides companywide call records, comparison and analytical tools for tracking and improving the efficiency and effectiveness of business communications. An intuitive, feature rich interface
Creating Basic Custom Monitoring Dashboards Antonio Mangiacotti, Stefania Oliverio & Randy Allen
 Creating Basic Custom Monitoring Dashboards by Antonio Mangiacotti, Stefania Oliverio & Randy Allen v1.1 Introduction With the release of IBM Tivoli Monitoring 6.3 and IBM Dashboard Application Services
TEXT-FILLED STACKED AREA GRAPHS Martin Kraus
 Martin Kraus Text can add a significant amount of detail and value to an information visualization. In particular, it can integrate more of the data that a visualization is based on, and it can also integrate
An automated timeline reconstruction approach for digital forensic investigations Christopher Hargreaves and Jonathan Patterson, DFRWS 2012
 An automated timeline reconstruction approach for digital forensic investigations Christopher Hargreaves and Jonathan Patterson, DFRWS 2012 Original presentation at DFRWS: http://www.dfrws.org/2012/proceedings/dfrws2012-p8.pdf
SAS/GRAPH Network Visualization Workshop 2.1
 SAS/GRAPH Network Visualization Workshop 2.1 User s Guide SAS Documentation The correct bibliographic citation for this manual is as follows: SAS Institute Inc 2009. SAS/GRAPH : Network Visualization Workshop
MyOra 3.0. User Guide. SQL Tool for Oracle. Jayam Systems, LLC
 MyOra 3.0 SQL Tool for Oracle User Guide Jayam Systems, LLC Contents Features... 4 Connecting to the Database... 5 Login... 5 Login History... 6 Connection Indicator... 6 Closing the Connection... 7 SQL
DataPA OpenAnalytics End User Training
 DataPA OpenAnalytics End User Training DataPA End User Training Lesson 1 Course Overview DataPA Chapter 1 Course Overview Introduction This course covers the skills required to use DataPA OpenAnalytics
City of St. Petersburg, Florida Fiscal & Budget Transparency Tool User Guide. Last Updated: March 2015
 City of St. Petersburg, Florida Fiscal & Budget Transparency Tool User Guide Last Updated: March 2015 St. Petersburg s Fiscal and Budget Transparency Tool allows you to explore budget and historical finances
Thomson Reuters Eikon Quick Start Guide
 Thomson Reuters Eikon Quick Start Guide Thomson Reuters Eikon is a great tool to retrieve market data, news, and economic information pertaining to a wealth of countries and nations. The software is very
System Monitoring and Reporting
 This chapter contains the following sections: Dashboard, page 1 Summary, page 2 Inventory Management, page 3 Resource Pools, page 4 Clusters, page 4 Images, page 4 Host Nodes, page 6 Virtual Machines (VMs),
Microsoft Project 2007 Level 1: Creating Project Tasks
 Microsoft Project 2007 Level 1: Creating Project Tasks By Robin Peers Robin Peers, 2008 ABOUT THIS CLASS Regardless of job title, most of us have needed to act as a project manager, at one time or another.
Analysis and Comparison of Data Visualization using two Popular Tools: Many Eyes and Swivel.
 Analysis and Comparison of Data Visualization using two Popular Tools: Many Eyes and Swivel. Radmila Berger, Iosif Berger, Irina Ilyaguyeva, Vera Gabidova Abstract We analyze and compare visualization
NV301 Umoja Advanced BI Navigation. Umoja Advanced BI Navigation Version 5 1
 NV301 Umoja Advanced BI Navigation Umoja Advanced BI Navigation Version 5 Last Copyright Modified: United 08-August-13 Nations 1 Agenda Course Introduction Module 1: Analysis Workspaces Module 2: Define
The portal is organized into two basic views, one for public interaction on the Internet, and another that is password protected for Subscribers.
 Help Pages - Threat Intelligence Portal Overview - The portal is a web-based means of supporting both the production and dissemination of Threat Intelligence. Powered by the improved TRITON database and
ServerView Inventory Manager
 User Guide - English FUJITSU Software ServerView Suite ServerView Inventory Manager ServerView Operations Manager V6.21 Edition October 2013 Comments Suggestions Corrections The User Documentation Department
COMP 150-04 Visualization. Lecture 11 Interacting with Visualizations
 COMP 150-04 Visualization Lecture 11 Interacting with Visualizations Assignment 5: Maps Due Wednesday, March 17th Design a thematic map visualization Option 1: Choropleth Map Implementation in Processing
TIBCO Spotfire Server Deployment and Administration
 TIBCO Spotfire Server Deployment and Administration Software Release 6.0 November 2013 Two-Second Advantage 2 Important Information SOME TIBCO SOFTWARE EMBEDS OR BUNDLES OTHER TIBCO SOFTWARE. USE OF SUCH
Getting Started with ConceptDraw PROJECT v7 for Windows
 Getting Started with ConceptDraw PROJECT v7 for Windows CS Odessa corp. Contents GETTING STARTED WITH CONCEPTDRAW PROJECT...3 CREATING PROJECTS...5 ASSIGNING RESOURCES...7 SETTING THE CALENDAR...9 MANAGING
Introduction... 1 Welcome Screen... 2 Map View... 3. Generating a map... 3. Map View... 4. Basic Map Features... 4
 Quick Start Guide Contents Introduction... 1 Welcome Screen... 2 Map View... 3 Generating a map... 3 Map View... 4 Basic Map Features... 4 Adding a Secondary Indicator... 5 Adding a Secondary Indicator...
Quick Reference Guide
 Quick Reference Guide TERMINOLOGY 2 ICONS 3 SCREENS 4 SETTINGS 4 EMPLOYEE TIMELINE 4 CLIENT / PLACE TIMELINE 4 AVAILABILITY 4 SCHEDULING CENTRE 4 FEW CLICK SCHEDULING 4 MANAGE LEAVE 5 CLIENTS / PLACES
Getting Started with GRUFF
 Getting Started with GRUFF Introduction Most articles in this book focus on interesting applications of Linked Open Data (LOD). But this chapter describes some simple steps on how to use a triple store,
Dedoose Distinguishing features and functions
 Dedoose Distinguishing features and functions This document is intended to be read in conjunction with the Choosing a CAQDAS Package Working Paper which provides a more general commentary of common CAQDAS
A Guide for Energy Efficiency Program Sponsors Leveraging ENERGY STAR Product Finder Advanced View Last Updated June 18, 2014
 A Guide for Energy Efficiency Program Sponsors Leveraging ENERGY STAR Product Finder Advanced View Last Updated June 18, 2014 Introduction It is now easier than ever to customize ENERGY STAR-certified
Creating an Excel XY (Scatter) Plot
 Plot") Creating an Excel XY (Scatter) Plot EXCEL REVIEW 21-22 1 What is an XY or Scatter Plot? An XY or scatter plot either shows the relationships among the numeric values in several data series or plots two
Creating an Excel XY (Scatter) Plot EXCEL REVIEW 21-22 1 What is an XY or Scatter Plot? An XY or scatter plot either shows the relationships among the numeric values in several data series or plots two
SAS BI Dashboard 4.4. User's Guide Second Edition. SAS Documentation
 SAS BI Dashboard 4.4 User's Guide Second Edition SAS Documentation The correct bibliographic citation for this manual is as follows: SAS Institute Inc. 2013. SAS BI Dashboard 4.4: User's Guide, Second
Getting Started with ConceptDraw PROJECT v7 for OS X
 Getting Started with ConceptDraw PROJECT v7 for OS X CS Odessa corp. Contents GETTING STARTED WITH CONCEPTDRAW PROJECT...3 CREATING PROJECTS...5 ASSIGNING RESOURCES...7 SETTING THE CALENDAR...9 ADDING
Chapter 3. Application Software. Chapter 3 Objectives. Application Software
 Chapter 3 Objectives Chapter 3 Application Software Identify the categories of application software Explain ways software is distributed Explain how to work with application software Identify the key features
The Essential Guide to User Interface Design An Introduction to GUI Design Principles and Techniques
 The Essential Guide to User Interface Design An Introduction to GUI Design Principles and Techniques Third Edition Wilbert O. Galitz l 1 807 : WILEYp Wiley Publishing, Inc. Contents About the Author Preface
How To Visualize Performance Data In A Computer Program
 Performance Visualization Tools 1 Performance Visualization Tools Lecture Outline : Following Topics will be discussed Characteristics of Performance Visualization technique Commercial and Public Domain
Web Analytics. User Guide. July 2012. Welcome to AT&T Website Solutions SM
 July 2012 Web Analytics User Guide Welcome to AT&T Website Solutions SM We are focused on providing you the very best web hosting service including all the tools necessary to establish and maintain a successful
Designing a Graphical User Interface
 Designing a Graphical User Interface 1 Designing a Graphical User Interface James Hunter Michigan State University ECE 480 Design Team 6 5 April 2013 Summary The purpose of this application note is to
Acolyst VENELegal Matter Management Application
 Acolyst VENELegal Matter Management Application Acolyst VENELegal Matter Management application is for legal corporate and government professionals needing a tool to allow for collaboration, managing matter
Colligo Email Manager 5.1. User Guide
 5.1 User Guide Contents Enterprise Email Management for SharePoint 2010 1 Benefits 1 Key Features 1 Platforms Supported 1 Installing and Activating Colligo Email Manager 2 Managing SharePoint Sites 5 Adding
Custom Reporting System User Guide
 Citibank Custom Reporting System User Guide April 2012 Version 8.1.1 Transaction Services Citibank Custom Reporting System User Guide Table of Contents Table of Contents User Guide Overview...2 Subscribe
Hamline University Administrative Computing Page 1
 User Guide Banner Handout: BUSINESS OBJECTS ENTERPRISE (InfoView) Document: boxi31sp3-infoview.docx Created: 5/11/2011 1:24 PM by Chris Berry; Last Modified: 8/31/2011 1:53 PM Purpose:... 2 Introduction:...
Finance Reporting. Millennium FAST. User Guide Version 4.0. Memorial University of Newfoundland. September 2013
 Millennium FAST Finance Reporting Memorial University of Newfoundland September 2013 User Guide Version 4.0 FAST Finance User Guide Page i Contents Introducing FAST Finance Reporting 4.0... 2 What is FAST
Extend Table Lens for High-Dimensional Data Visualization and Classification Mining
 Extend Table Lens for High-Dimensional Data Visualization and Classification Mining CPSC 533c, Information Visualization Course Project, Term 2 2003 Fengdong Du fdu@cs.ubc.ca University of British Columbia
Stored Documents and the FileCabinet
 Stored Documents and the FileCabinet Introduction The stored document features have been greatly enhanced to allow easier storage and retrieval of a clinic s electronic documents. Individual or multiple
Executive Dashboard. User Guide
 Executive Dashboard User Guide 2 Contents Executive Dashboard Overview 3 Naming conventions 3 Getting started 4 Welcome to Socialbakers Executive Dashboard! 4 Comparison View 5 Setting up a comparison
Using the SAS Enterprise Guide (Version 4.2)
") 2011-2012 Using the SAS Enterprise Guide (Version 4.2) Table of Contents Overview of the User Interface... 1 Navigating the Initial Contents of the Workspace... 3 Useful Pull-Down Menus... 3 Working with
2011-2012 Using the SAS Enterprise Guide (Version 4.2) Table of Contents Overview of the User Interface... 1 Navigating the Initial Contents of the Workspace... 3 Useful Pull-Down Menus... 3 Working with