Landscape and Fragmentation Analysis. Patch Analyst Patch Analyst (Grid)
|
|
|
- Mervyn Andrews
- 7 years ago
- Views:
Transcription
1 Landscape and Fragmentation Analysis Patch Analyst Patch Analyst (Grid)

2 Crash Course in. Landscape Ecology Study of landscape patterns Interaction among patches within a landscape Dynamics and change in landscape patterns over time Flows of energy, nutrients, t and species among landscape elements REM429

3 Landscape - a mosaic of patches

4 Patches can represent.. Cover types Habitat types Structural stages of cover types Urban development Physiographic features etc

5 Landsat 5 imagery, July 1992 Hurry Back Creek Current Creek 116 W Long, 43 N Lat Elevation m Precip mm Smith Creek 130,000 ha Red Canyon Creek

6 Succession in a Western Juniper Community Grassland after fire Mountain big sagebrush steppe Stand initiation juniper (Phase 1) Open young juniper (Phase 2) Young multistory juniper (Phase 3) Mature juniper woodland
 Young multistory juniper (Phase 3) Mature")
7 From Air Photo to GIS Vegetation Layer

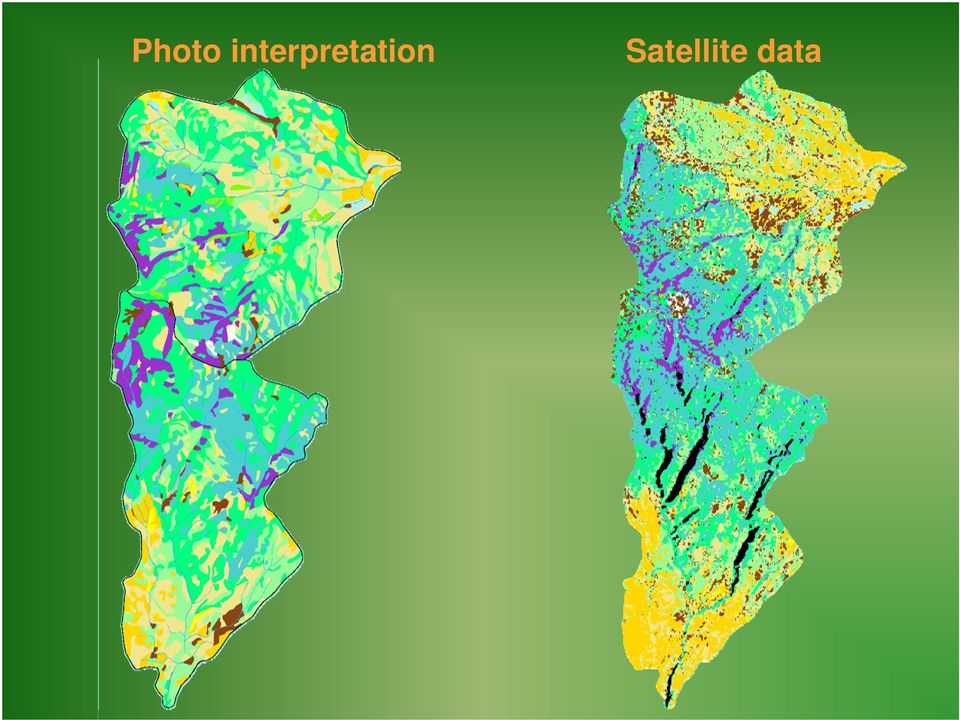
8 From Satellite Image to GIS Vegetation Layer

9 Photo interpretation Satellite data
10 Landscape Characteristics Patch size and Edge density Patch richness Shape Patch diversity Patch evenness Spatial distribution ib ti / Interspersion Nearest neighbor / Proximity Core area metrics

11 Landscape and Fragmentation Fragstats GUI interface Analysis Software Works with many input formats including ArcGIS Grids (rasters) Landscape, Class and Patch analyses Allows the user to select output metrics Moving window analysis Batch processing l

12 Landscape Metrics Nearest neighbor? Shannon s Diversity Index Interspersion Juxtaposition

13 Patch Size MPS = 8.5 ha MedPS = 4.0 ha PSSD = 13.1 ha MPS = 30.3 ha MedPS = 4.0 ha PSSD = 74.7 ha

14 Edge Density TE = 104 km ED = m/m 2 TE = 56 km ED = m/ m 2

15 Patch Richness PR = 12 PR = 5

16 Patch Shape MSI = 1.93 AWMSI = 1.74 MPAR = 4419 m/ha MSI = 1.26 AWMSI = MPAR = 1147 m/ha M Sh I d i 1 h ll t h i l Mean Shape Index is 1 when all patches are circular and increases as the patches become more irregular.

17 Patch Shape by class MSI MPAR m/ha slivers

18 Patch Diversity and Evenness SDI = 2.16 SDI = 1.66 SEI = 0.94 SEI = 0.94 PR = 12 PR = 5 Diversity varies with Patch Richness while Evenness is independent of Patch Richness.

19 Patch Diversity and Evenness SDI = 2.33 SDI = 2.00 SEI = 0.94 SEI = 0.81 PR = 12 PR = 12 Shannon s Diversity it and Evenness Index both reflect the relative distribution in area between patch types. Spatial distribution is not accounted for.

20 Patch Isolation / Fragmentation MNN = 96.3 MNN = 71.4 MPI = 86.0 MPI = 49.5 Mean Nearest Neighbor Index is the average of the shortest distances between patches of the same type within the landscape.

21 Interspersion Juxtaposition Index IJI = IJI = 69.1 IJI t h dj IJI h 100 IJI measures patch adjacency. IJI approaches 100 when all patch types are equally adjacent to each other.
22 Landscape Levels Landscape metrics are computed for the entire landscape. Class metrics are computed by landscape class (e.g. cover types or habitat types) Patch metrics are computed for each patch. A limited number of metrics are available. ailable
23 Patch Analyst Statistics Summary Shape Metrics Mean Shape Index Area Metrics Area Weighted Mean Shape Index Class Area Mean Perimeter-Area Ratio Total Landscape Area Mean Patch Fractal Dimension Area Weighted Mean Patch Fractal Dimension Patch Density & Size Metrics No. of Patches Mean Patch Size Median Patch Size Patch Size Coefficient of Variation Diversity & Interspersion Metrics Patch Size Standard Deviation Mean Nearest Neighbor Distance Mean Proximity Index Edge Metrics Interspersion Juxtaposition Index Total Edge Shannon s Diversity it Index Mean Patch Edge Shannon s Evenness Index Contrasted Weighted Edge
24 Fragstats User Interface
25 Connectivity Rules 4-cell rule 8-cell rule
26 Moving Window Analysis
27 Moving Window Analysis A circular or square moving window moves across the input grid and selected metrics are calculated for the center cell of the window
28 Shrub cover
29 Landscape scale habitat characteristics Do animals use areas of high or low shrub cover? Does the amount of edge between low and high cover areas affect habitat selection? Are areas within home ranges homogeneous or heterogeneous with respect to shrub cover? Does patch size matter? etc..
30
31 Total edge within a 100 m radius circular moving window
32
33 Batch Processing Possible!! Batch File.--If Batch mode is selected, then FRAGSTATS will run the batch file specified in the Input File text box and produce output for all of the landscapes designated in the batch file. See Step 4 on Working with Batch Files for details on building a suitable batch file. If Batch mode is selected, then the Input Data Type (see below) and Grid Attributes (see below) will become inactive (grayed out in the interface) because these parameters will be specified uniquely for each input landscape in the batch file.
34 Further reading. Cushman S.A., K. McGarigal, M.C. Neel, Parsimony in landscape metrics: Strength, universality, and consistency, Ecological Indicators 8: De Beer Y. and R.J. van Aarde, Do landscape heterogeneity and water distribution explain aspects of elephant home range in southern Africa s arid savannas?, Journal of Arid Environments Grainger1 M., R. van Aarde1, and I. Whyte, Landscape heterogeneity and the use of space by elephants in the Kruger National Park, South Africa, African Journal of Ecology Herrera, L.P. P. Laterra, N.O. Maceira, K. D. Zelaya, and G.A. Martı nez, Fragmentation Status of Tall-Tussock Grassland Relicts in the Flooding Pampa, Argentina, Rangeland Ecology and Management. Kong F. and N.Nakagoshi, Spatial-temporal gradient analysis of urban green spaces in Jinan, China, Landscape and Urban Planning. Arjan J. H. Meddens, Andrew T. Hudak, Jeffrey S. Evans, William A. Gould and Grizelle Gonza lez, Characterizing Forest Fragments in Boreal, Temperate, and Tropical Ecosystem, Ambio.
Objectives. Raster Data Discrete Classes. Spatial Information in Natural Resources FANR 3800. Review the raster data model
 Spatial Information in Natural Resources FANR 3800 Raster Analysis Objectives Review the raster data model Understand how raster analysis fundamentally differs from vector analysis Become familiar with
ANALYSIS 3 - RASTER What kinds of analysis can we do with GIS?
 ANALYSIS 3 - RASTER What kinds of analysis can we do with GIS? 1. Measurements 2. Layer statistics 3. Queries 4. Buffering (vector); Proximity (raster) 5. Filtering (raster) 6. Map overlay (layer on layer
Raster Operations. Local, Neighborhood, and Zonal Approaches. Rebecca McLain Geography 575 Fall 2009. Raster Operations Overview
 Raster Operations Local, Neighborhood, and Zonal Approaches Rebecca McLain Geography 575 Fall 2009 Raster Operations Overview Local: Operations performed on a cell by cell basis Neighborhood: Operations
Understanding Raster Data
 Introduction The following document is intended to provide a basic understanding of raster data. Raster data layers (commonly referred to as grids) are the essential data layers used in all tools developed
What is FRAGSTATS? Scale Considerations Computer Requirements
 FRAGSTATS SPATIAL PATTERN ANALYSIS PROGRAM DOCUMENT WAS WRITTEN BY DR KEVIN MCGARIGAL AND CAN BE FOUND AT http://www.umass.edu/landeco/research/fragstats/fragstats.html What is FRAGSTATS? FRAGSTATS is
Dimensions of landscape diversity: ecological indicators for landscape protection planning
 Dimensions of landscape diversity: ecological indicators for landscape protection planning The European Land Use Institute Sheraton Four Point Hotel Dresden, May 17-20, 2011 Session Science and Practice
Supporting Online Material for Achard (RE 1070656) scheduled for 8/9/02 issue of Science
 scheduled for 8/9/02 issue of Science") Supporting Online Material for Achard (RE 1070656) scheduled for 8/9/02 issue of Science Materials and Methods Overview Forest cover change is calculated using a sample of 102 observations distributed
Supporting Online Material for Achard (RE 1070656) scheduled for 8/9/02 issue of Science Materials and Methods Overview Forest cover change is calculated using a sample of 102 observations distributed
Mapping Land Cover Patterns of Gunma Prefecture, Japan, by Using Remote Sensing ABSTRACT
 1 Mapping Land Cover Patterns of Gunma Prefecture, Japan, by Using Remote Sensing Zhaohui Deng, Yohei Sato, Hua Jia Department of Biological and Environmental Engineering, Graduate School of Agricultural
Introduction to Landscape Ecology
 Instructor: K. McGarigal Introduction to Landscape Ecology Assigned Reading: Turner et al. 2001 (Chapter 1) Objective: Describe the focus of the science of landscape ecology, including its historical context
Monitoring for Conservation Planning and Management. Environmental Evaluators Forum EPA Headquarters, USA June 14 15, 2007
 Monitoring for Conservation Planning and Management Environmental Evaluators Forum EPA Headquarters, USA June 14 15, 2007 Key Types of Decisions Prioritization (where Status to allocate scarce conservation
Forest structure optimization using evolutionary programming and landscape ecology metrics
 European Journal of Operational Research 164 (2005) 423 439 O.R. Applications Forest structure optimization using evolutionary programming and landscape ecology metrics Henry David Venema a, *, Paul H.
The Wildland-Urban Interface in the United States
 The Wildland-Urban Interface in the United States Susan I. Stewart Northern Research Station, USDA Forest Service, Evanston, IL (sistewart@fs.fed.us) Volker C. Radeloff Department of Forestry, University
Nevada Pinyon-Juniper Partnership Proposed Demonstration Area A Brief Introduction. Presented by Jeremy Drew Project Manager Resource Concepts, Inc.
 Nevada Pinyon-Juniper Partnership Proposed Demonstration Area A Brief Introduction Presented by Jeremy Drew Project Manager Resource Concepts, Inc. What I ll Discuss: Purpose of a Demonstration Area Priorities
Chapter 3 Communities, Biomes, and Ecosystems
 Communities, Biomes, and Ecosystems Section 1: Community Ecology Section 2: Terrestrial Biomes Section 3: Aquatic Ecosystems Click on a lesson name to select. 3.1 Community Ecology Communities A biological
JACIE Science Applications of High Resolution Imagery at the USGS EROS Data Center
 JACIE Science Applications of High Resolution Imagery at the USGS EROS Data Center November 8-10, 2004 U.S. Department of the Interior U.S. Geological Survey Michael Coan, SAIC USGS EROS Data Center coan@usgs.gov
Geography 3251: Mountain Geography Assignment III: Natural hazards A Case Study of the 1980s Mt. St. Helens Eruption
 Name: Geography 3251: Mountain Geography Assignment III: Natural hazards A Case Study of the 1980s Mt. St. Helens Eruption Learning Objectives: Assigned: May 30, 2012 Due: June 1, 2012 @ 9 AM 1. Learn
Your Defensible Space Slideshow
 Your Defensible Space Slideshow Red = Trees to Remove Your Defensible Space Slideshow This slideshow was created to highlight actions you can take to dramatically improve the chances of your home surviving
2.3 Spatial Resolution, Pixel Size, and Scale
 Section 2.3 Spatial Resolution, Pixel Size, and Scale Page 39 2.3 Spatial Resolution, Pixel Size, and Scale For some remote sensing instruments, the distance between the target being imaged and the platform,
National Inventory of Landscapes in Sweden
 Key messages Approaching the landscape perspective in monitoring experiences in the Swedish NILS program Johan Svensson, Future Forest Monitoring, 091112 Landscape level approaches are necessary to deal
WHAT IS GIS - AN INRODUCTION
 WHAT IS GIS - AN INRODUCTION GIS DEFINITION GIS is an acronym for: Geographic Information Systems Geographic This term is used because GIS tend to deal primarily with geographic or spatial features. Information
Analysis of Factors Influencing Urban Growth Patterns on Small Towns
 Analysis of Factors Influencing Urban Growth Patterns on Small Towns GARCÍA, A. M, SANTÉ, I, MIRANDA, D., CRECENTE, R. Agroforestry Engineering Department Santiago de Compostela University Escuela Politécnica
EcoInformatics International Inc.
 1 von 10 03.08.2010 14:25 EcoInformatics International Inc. Home Services - solutions Projects Concepts Tools Links Contact EXPLORING BEAVER HABITAT AND DISTRIBUTION WITH GOOGLE EARTH: THE LONGEST BEAVER
A perspective on (loss of) white rhino & savanna functioning; is Science informing African savanna conservation?
 white rhino & savanna functioning; is Science informing African savanna conservation?") Photo by Jan Graf A perspective on (loss of) white rhino & savanna functioning; is Science informing African savanna conservation? Joris Cromsigt Dept. for Wildlife, Fish & Environmental sciences Swedish
Photo by Jan Graf A perspective on (loss of) white rhino & savanna functioning; is Science informing African savanna conservation? Joris Cromsigt Dept. for Wildlife, Fish & Environmental sciences Swedish
Patterns in the species/environment relationship depend on both scale and choice of response variables
 OIKOS 105: 117/124, 2004 Patterns in the species/environment relationship depend on both scale and choice of response variables Samuel A. Cushman and Kevin McGarigal Cushman, S. A. and McGarigal, K. 2004.
Tutorial 8 Raster Data Analysis
 Objectives Tutorial 8 Raster Data Analysis This tutorial is designed to introduce you to a basic set of raster-based analyses including: 1. Displaying Digital Elevation Model (DEM) 2. Slope calculations
Communities, Biomes, and Ecosystems
 Communities, Biomes, and Ecosystems Before You Read Before you read the chapter, respond to these statements. 1. Write an A if you agree with the statement. 2. Write a D if you disagree with the statement.
defined largely by regional variations in climate
 1 Physical Environment: Climate and Biomes EVPP 110 Lecture Instructor: Dr. Largen Fall 2003 2 Climate and Biomes Ecosystem concept physical and biological components of environment are considered as single,
Burrowing Owl Distribution Modeling
 Burrowing Owl Distribution Modeling Scientific Name: Athene cunicularia Distribution Status: Migratory Summer Breeder State Rank: S3B Global Rank: G4 Inductive Modeling Model Created By: Joy Ritter Model
CAPS Landscape Metrics November 2011
 CAPS Landscape Metrics November 2011 This appendix describes the landscape metrics available in CAPS. These metrics are weighted and combined separately for each community, using the community model listed
THE ECOSYSTEM - Biomes
 Biomes The Ecosystem - Biomes Side 2 THE ECOSYSTEM - Biomes By the end of this topic you should be able to:- SYLLABUS STATEMENT ASSESSMENT STATEMENT CHECK NOTES 2.4 BIOMES 2.4.1 Define the term biome.
COASTAL MONITORING & OBSERVATIONS LESSON PLAN Do You Have Change?
 Coastal Change Analysis Lesson Plan COASTAL MONITORING & OBSERVATIONS LESSON PLAN Do You Have Change? NOS Topic Coastal Monitoring and Observations Theme Coastal Change Analysis Links to Overview Essays
Past and Current Research on Natural Resource Issues in the Blue Mountains
 Past and Current Research on Natural Resource Issues in the Blue Mountains Recreation, Hunting, Access Livestock Production (and Wild Ungulate Ecology) Restoration Timber Harvest, Production Biodiversity,
FOR375 EXAM #2 STUDY SESSION SPRING 2016. Lecture 14 Exam #2 Study Session
 FOR375 EXAM #2 STUDY SESSION SPRING 2016 Lecture 14 Exam #2 Study Session INTRODUCTION TO REMOTE SENSING TYPES OF REMOTE SENSING Ground based platforms Airborne based platforms Space based platforms TYPES
What is Landscape Ecology?
 Introduction to Landscape Ecology By Kevin McGarigal Disclaimer: Some of the material in this document was borrowed from Turner et al. (2001) and Dean Urban s Landscape Ecology course notes, Duke University.
Appendix C. Municipal Planning and Site Restoration Considerations
 Appendix C Municipal Planning and Site Restoration Considerations 67 68 Appendix C - Municipal Planning and Site Restoration Considerations This appendix contains best practice standards for site planning
The Use of Geographic Information Systems in Risk Assessment
 The Use of Geographic Information Systems in Risk Assessment With Specific Focus on the RiVAMP Methodology Presented by Nadine Brown August 27, 2012 Climate Studies Group Mona Climate Change Workshop Presentation
Project Title: Project PI(s) (who is doing the work; contact Project Coordinator (contact information): information):
 (who is doing the work; contact Project Coordinator (contact information): information):") Project Title: Great Northern Landscape Conservation Cooperative Geospatial Data Portal Extension: Implementing a GNLCC Spatial Toolkit and Phenology Server Project PI(s) (who is doing the work; contact
Project Title: Great Northern Landscape Conservation Cooperative Geospatial Data Portal Extension: Implementing a GNLCC Spatial Toolkit and Phenology Server Project PI(s) (who is doing the work; contact
Koala Coast. Koala Population Report 2010. Tomorrow s Queensland: strong, green, smart, healthy and fair
 Koala Coast Koala Population Report 2010 Tomorrow s Queensland: strong, green, smart, healthy and fair This report has been developed to ensure that the community is kept informed on the status of the
A quick overview of geographic information systems (GIS) Uwe Deichmann, DECRG <udeichmann@worldbank.org>
 Uwe Deichmann, DECRG <udeichmann@worldbank.org>") A quick overview of geographic information systems (GIS) Uwe Deichmann, DECRG Why is GIS important? A very large share of all types of information has a spatial component ( 80
A quick overview of geographic information systems (GIS) Uwe Deichmann, DECRG Why is GIS important? A very large share of all types of information has a spatial component ( 80
Jose Valdez Doctoral Candidate Geomatics Program Department of Forest Sciences Colorado State University
 A N E F F I C I E N T A L G O R I T H M F O R R E C O N S T R U C T I N G A N I S O T R O P I C S P R E A D C O S T S U R F A C E S A F T E R M I N I M A L C H A N G E T O U N I T C O S T S T R U C T U
Biodiversity assessment at multiple scales: Linking remotely sensed data with field information
 Proc. Natl. Acad. Sci. USA Vol. 96, pp. 9154 9158, August 1999 Ecology Biodiversity assessment at multiple scales: Linking remotely sensed data with field information HARINI NAGENDRA* AND MADHAV GADGIL*
4.2 Buena Vista Creek Watershed
 Buena Vista Creek Watershed 4.2 Buena Vista Creek Watershed Watershed Overview The Buena Vista Creek Watershed is the fourth-largest system within the Carlsbad Hydrologic Unit. The watershed extends approximately
Landforms form an integral part
 Landform classification using GIS by Karsten Drescher, Terralogix Consulting, and Willem de Frey, Ekoinfo Refining existing landform classifications using ESRI s model builder. Landforms form an integral
Introduction to Imagery and Raster Data in ArcGIS
 Esri International User Conference San Diego, California Technical Workshops July 25, 2012 Introduction to Imagery and Raster Data in ArcGIS Simon Woo slides Cody Benkelman - demos Overview of Presentation
State of Green Infrastructure in the Gauteng City-Region
 State of Green Infrastructure in the Gauteng City-Region Valuing Natural Capital Dialogue City of Johannesburg 26 th February 2014 Kerry Bobbins Researcher GCRO kerry.bobbins@gcro.ac.za Overview Structure
Chapter 14. Forest Fragmentation In The Rocky Mountains
 Chapter 14 Forest Fragmentation In The Rocky Mountains Rebecca Reed 1*, Jane Beiswenger 2, and Julia Johnson-Barnard 3* 1 Department of Botany, 2 Department of Zoology and Physiology, and 3 Department
INCORPORATING ECOLOGICAL DYNAMICS INTO RANGELAND TREATMENT AND RESTORATION DECISIONS
 INCORPORATING ECOLOGICAL DYNAMICS INTO RANGELAND TREATMENT AND RESTORATION DECISIONS Kimberly Rollins, Environment Canada Visi ng Scholar (2014-15) Professor, University of Nevada Department of Economics
Richmond City s Green Infrastructure Assessment
 Richmond City s Green Infrastructure Assessment Presented by Karen Firehock, Director The Green Infrastructure Center Inc. www.gicinc.org Mike Mather, City Arborist City of Richmond Winter Symposium --
CRMS Website Training
 CRMS Website Training March 2013 http://www.lacoast.gov/crms Coastwide Reference Monitoring System - Wetlands CWPPRA Restoration Projects Congressionally funded in 1990 Multiple restoration techniques
ERP: Willamette-Ecosystem Services Project
 ERP: Willamette-Ecosystem Services Project Presented by Iris Goodman to NAS Sustainability R&D Forum October 17-18, 2007 Conserving ecosystem services through proactive decision-making making Linking Human
Raster Data Structures
 Raster Data Structures Tessellation of Geographical Space Geographical space can be tessellated into sets of connected discrete units, which completely cover a flat surface. The units can be in any reasonable
Restoring Burned Area Fire Regimes at Zion National Park
 Restoring Burned Area Fire Regimes at Zion National Park Kelly Fuhrmann, Zion National Park, State Route 9, Springdale, UT 84767; kelly_ fuhrmann@nps.gov Introduction The Kolob Fire is the largest wildfire
REVIEW UNIT 10: ECOLOGY SAMPLE QUESTIONS
 Period Date REVIEW UNIT 10: ECOLOGY SAMPLE QUESTIONS A. Sample Multiple Choice Questions Complete the multiple choice questions to review this unit. 1. All of the following are density-dependent factors
The Urban Heat Island in Phoenix: Impacts on Neighborhoods
 The Urban Heat Island in Phoenix: Impacts on Neighborhoods Sharon L. Harlan Arizona State University April 25, 2012 Prepared for Mitigating the Urban Island Planning in the West Webinar hosted by Western
EXPLORING THE SPATIAL ASSOCIATION BETWEEN MEASURES FROM SATELLITE IMAGERY AND PATTERNS OF URBAN VULNERABILITY TO EARTHQUAKE HAZARDS
 EXPLORING THE SPATIAL ASSOCIATION BETWEEN MEASURES FROM SATELLITE IMAGERY AND PATTERNS OF URBAN VULNERABILITY TO EARTHQUAKE HAZARDS a, b T. Rashed * and J. Weeks a University of Redlands, MS-GIS Faculty,
Nature Values Screening Using Object-Based Image Analysis of Very High Resolution Remote Sensing Data
 Nature Values Screening Using Object-Based Image Analysis of Very High Resolution Remote Sensing Data Aleksi Räsänen*, Anssi Lensu, Markku Kuitunen Environmental Science and Technology Dept. of Biological
Using Remote Sensing Imagery to Evaluate Post-Wildfire Damage in Southern California
 Graham Emde GEOG 3230 Advanced Remote Sensing February 22, 2013 Lab #1 Using Remote Sensing Imagery to Evaluate Post-Wildfire Damage in Southern California Introduction Wildfires are a common disturbance
National Hazard and Risk Model (No-HARM) Wildfire
 Wildfire") National Hazard and Risk Model (No-HARM) Wildfire A Briefing Paper Anchor Point Group LLC 2131 Upland Ave. Boulder, CO 80304 (303) 665-3473 www.anchorpointgroup.com Summary The potential for wildfire-caused
National Hazard and Risk Model (No-HARM) Wildfire A Briefing Paper Anchor Point Group LLC 2131 Upland Ave. Boulder, CO 80304 (303) 665-3473 www.anchorpointgroup.com Summary The potential for wildfire-caused
Department of Forest and
 Colorado State University 1 Department of Forest and Rangeland Stewardship Office in Forestry Building, Room 123 (970) 491-6911 warnercnr.colostate.edu/frs-home (http://warnercnr.colostate.edu/ frws-home)
TOWARDS A GLOBAL STRATEGY FOR THE ENVIRONMENTAL SUSTAINABILITY OF THE PROVINCE OF CUENCA (SPAIN)
") Boletín de la Towards Asociación a global de Geógrafos strategy for Españoles the environmental N.º 59-2012, sustainability págs. 435-440 of the province of Cuenca (Spain) I.S.S.N.: 0212-9426 TOWARDS A
Boletín de la Towards Asociación a global de Geógrafos strategy for Españoles the environmental N.º 59-2012, sustainability págs. 435-440 of the province of Cuenca (Spain) I.S.S.N.: 0212-9426 TOWARDS A
Data source, type, and file naming convention
 Exercise 1: Basic visualization of LiDAR Digital Elevation Models using ArcGIS Introduction This exercise covers activities associated with basic visualization of LiDAR Digital Elevation Models using ArcGIS.
The relationship between forest biodiversity, ecosystem resilience, and carbon storage
 The relationship between forest biodiversity, ecosystem resilience, and carbon storage Ian Thompson, Canadian Forest Service Brendan Mackey, Australian National University Alex Mosseler, Canadian Forest
UPPER COLUMBIA BASIN NETWORK VEGETATION CLASSIFICATION AND MAPPING PROGRAM
 UPPER COLUMBIA BASIN NETWORK VEGETATION CLASSIFICATION AND MAPPING PROGRAM The Upper Columbia Basin Network (UCBN) includes nine parks with significant natural resources in the states of Idaho, Montana,
WHAT S NEW IN VERSION 4... 3
 FRAGSTATS HELP 1 April 015 Kevin McGarigal, Sole proprietor, LandEco Consulting Professor, Department of Environmental Conservation University of Massachusetts, Amherst mcgarigalk@eco.umass.edu Table of
GIS Lesson 6 MAPS WITH RASTER IMAGES III: SATELLITE IMAGERY TEACHER INFORMATION
 GIS Lesson 6 MAPS WITH RASTER IMAGES III: SATELLITE IMAGERY TEACHER INFORMATION Lesson Summary: During this lesson students use GIS to load and view truecolor and enhanced satellite images of Alaska. Based
Land Cover Mapping of the Comoros Islands: Methods and Results. February 2014. ECDD, BCSF & Durrell Lead author: Katie Green
 Land Cover Mapping of the Comoros Islands: Methods and Results February 2014 ECDD, BCSF & Durrell Lead author: Katie Green About the ECDD project The ECDD project was run by Bristol Conservation & Science
Impact of water harvesting dam on the Wadi s morphology using digital elevation model Study case: Wadi Al-kanger, Sudan
 Impact of water harvesting dam on the Wadi s morphology using digital elevation model Study case: Wadi Al-kanger, Sudan H. S. M. Hilmi 1, M.Y. Mohamed 2, E. S. Ganawa 3 1 Faculty of agriculture, Alzaiem
San Francisco Bay Margin Conservation Decision Support System (DSS)
") San Francisco Bay Margin Conservation Decision Support System (DSS) Presented by Brian Fulfrost1, MS David Thomson2, MS 1 Brian Fulfrost and Associates 2 San Francisco Bay Bird Observatory Transitional
San Francisco Bay Margin Conservation Decision Support System (DSS) Presented by Brian Fulfrost1, MS David Thomson2, MS 1 Brian Fulfrost and Associates 2 San Francisco Bay Bird Observatory Transitional
.FOR. Forest inventory and monitoring quality
 .FOR Forest inventory and monitoring quality FOR : the asset to manage your forest patrimony 2 1..FOR Presentation.FOR is an association of Belgian companies, created in 2010 and supported by a university
Revising the Nantahala and Pisgah Land Management Plan Preliminary Need to Change the Existing Land Management Plan
 Revising the Nantahala and Pisgah Land Management Plan Preliminary Need to Change the Existing Land Management Plan Throughout the Plan 1. There is a fundamental need for the revised plan to address how
DEVELOPMENT OF SETTLEMENT FRAGMENTATION INDICES FOR ENERGY INFRASTRUCTURE COST ASSESSMENT IN AUSTRIA
 DEVELOPMENT OF SETTLEMENT FRAGMENTATION INDICES FOR ENERGY INFRASTRUCTURE COST ASSESSMENT IN AUSTRIA Thomas Blaschke a, Gerald Griesebner a, Manfred Mittlböck b a ZGIS, Department of Geography und Geoinformatics,
A GIS helps you answer questions and solve problems by looking at your data in a way that is quickly understood and easily shared.
 A Geographic Information System (GIS) integrates hardware, software, and data for capturing, managing, analyzing, and displaying all forms of geographically referenced information. GIS allows us to view,
Do termites enhance the invasion of southern African savannas by alien plants?
 Do termites enhance the invasion of southern African savannas by alien plants? Mhosisi Masocha; Andrew. K. Skidmore; Herbert H.T. Prins; Milena Holmgren; & Jan de Leeuw 1 A plant community becomes more
Effects of Land Cover, Flow, and Restoration on Stream Water Quality in the Portland, OR and Vancouver, WA Metro Area
 Effects of Land Cover, Flow, and Restoration on Stream Water Quality in the Portland, OR and Vancouver, WA Metro Area Heejun Chang 1, Alan Yeakley 2 Noelwah Netusil 3, Paul Thiers 4, Gretchen Rollwagon-Bollens
UTM: Universal Transverse Mercator Coordinate System
 Practical Cartographer s Reference #01 UTM: Universal Transverse Mercator Coordinate System 180 174w 168w 162w 156w 150w 144w 138w 132w 126w 120w 114w 108w 102w 96w 90w 84w 78w 72w 66w 60w 54w 48w 42w
Biology Keystone (PA Core) Quiz Ecology - (BIO.B.4.1.1 ) Ecological Organization, (BIO.B.4.1.2 ) Ecosystem Characteristics, (BIO.B.4.2.
 Quiz Ecology - (BIO.B.4.1.1 ) Ecological Organization, (BIO.B.4.1.2 ) Ecosystem Characteristics, (BIO.B.4.2.") Biology Keystone (PA Core) Quiz Ecology - (BIO.B.4.1.1 ) Ecological Organization, (BIO.B.4.1.2 ) Ecosystem Characteristics, (BIO.B.4.2.1 ) Energy Flow 1) Student Name: Teacher Name: Jared George Date:
Biology Keystone (PA Core) Quiz Ecology - (BIO.B.4.1.1 ) Ecological Organization, (BIO.B.4.1.2 ) Ecosystem Characteristics, (BIO.B.4.2.1 ) Energy Flow 1) Student Name: Teacher Name: Jared George Date:
University of Arkansas Libraries ArcGIS Desktop Tutorial. Section 2: Manipulating Display Parameters in ArcMap. Symbolizing Features and Rasters:
 : Manipulating Display Parameters in ArcMap Symbolizing Features and Rasters: Data sets that are added to ArcMap a default symbology. The user can change the default symbology for their features (point,
DATA VISUALIZATION GABRIEL PARODI STUDY MATERIAL: PRINCIPLES OF GEOGRAPHIC INFORMATION SYSTEMS AN INTRODUCTORY TEXTBOOK CHAPTER 7
 DATA VISUALIZATION GABRIEL PARODI STUDY MATERIAL: PRINCIPLES OF GEOGRAPHIC INFORMATION SYSTEMS AN INTRODUCTORY TEXTBOOK CHAPTER 7 Contents GIS and maps The visualization process Visualization and strategies
 European Forest Data Centre Biosoil/Biodiversity Forest Type Map 2006 P. Kempeneers, JRC T. Durant F. Sedano, JRC L. Seebach, JRC J. San-Miguel-Ayanz, JRC EC -, IES Land Management and Natural Hazard Unit
Overview. 1. Types of land dynamics 2. Methods for analyzing multi-temporal remote sensing data:
 Vorlesung Allgemeine Fernerkundung, Prof. Dr. C. Schmullius Change detection and time series analysis Lecture by Martin Herold Wageningen University Geoinformatik & Fernerkundung, Friedrich-Schiller-Universität
Lesson 15 - Fill Cells Plugin
 15.1 Lesson 15 - Fill Cells Plugin This lesson presents the functionalities of the Fill Cells plugin. Fill Cells plugin allows the calculation of attribute values of tables associated with cell type layers.
Pipeline Routing using GIS and Remote Sensing Tobenna Opara Ocean Engineering Department University of Rhode Island Tobennaopara@my.uri.
 Pipeline Routing using GIS and Remote Sensing Tobenna Opara Ocean Engineering Department University of Rhode Island Tobennaopara@my.uri.edu Pipelines are utilized by the oil and gas industry to transport
Federal Research and Development in Nevada
 Chapter 29 Federal Research and Development in Nevada Approximately $380 million of federal R&D funds are spent each year in Nevada. Nevada ranks 27th among the 50 states, District of Columbia, and Puerto
Overview and Example Application of the Landscape Treatment Designer
 United States Department of Agriculture Forest Service Pacific Northwest Research Station General Technical Report PNW-GTR-859 TU DE PA RT RE February 2012 MENT OF AGRI C U L Overview and Example Application
RESULTS. that remain following use of the 3x3 and 5x5 homogeneity filters is also reported.
 RESULTS Land Cover and Accuracy for Each Landsat Scene All 14 scenes were successfully classified. The following section displays the results of the land cover classification, the homogenous filtering,
Restoration of Fire-adapted Ecosystems in the Central and Southern Appalachians
 Restoration of Fire-adapted Ecosystems in the Central and Southern Appalachians Marek Smith The Nature Conservancy 12181-A Courthouse Hill Road Warm Springs, VA 24484 marek_smith@tnc.org Sam Lindblom The
A KNOWLEDGE-BASED APPROACH FOR REDUCING CLOUD AND SHADOW ABSTRACT
 A KNOWLEDGE-BASED APPROACH FOR REDUCING CLOUD AND SHADOW Mingjun Song, Graduate Research Assistant Daniel L. Civco, Director Laboratory for Earth Resources Information Systems Department of Natural Resources
Since early 1994, The Northern Sacramento Valley Sustainable Landscapes
 Using Population Distribution Forecasts and GIS Technology to Assess Potential Hardwood Loss in the Northern Sacramento Valley 1 Charles W. Nelson 2 Mark Radabaugh 3 Abstract: Since its inception, The
Mosaicking and Subsetting Images
 Mosaicking and Subsetting Images Using SAGA GIS Tutorial ID: IGET_RS_005 This tutorial has been developed by BVIEER as part of the IGET web portal intended to provide easy access to geospatial education.
AN INVESTIGATION OF THE GROWTH TYPES OF VEGETATION IN THE BÜKK MOUNTAINS BY THE COMPARISON OF DIGITAL SURFACE MODELS Z. ZBORAY AND E.
 ACTA CLIMATOLOGICA ET CHOROLOGICA Universitatis Szegediensis, Tom. 38-39, 2005, 163-169. AN INVESTIGATION OF THE GROWTH TYPES OF VEGETATION IN THE BÜKK MOUNTAINS BY THE COMPARISON OF DIGITAL SURFACE MODELS
Planning Tools related to water in Promotional Complex Forest Western Sudety Mountains
 Planning Tools related to water in Promotional Complex Forest Western Sudety Mountains Radomir Balazy Forest Research Institute R.Balazy@ibles.waw.pl Content 1. Introduction 2. Technologies of data collection
Partitioning the Conterminous United States into Mapping Zones for Landsat TM Land Cover Mapping
 Partitioning the Conterminous United States into Mapping Zones for Landsat TM Land Cover Mapping Collin Homer Raytheon, EROS Data Center, Sioux Falls, South Dakota 605-594-2714 homer@usgs.gov Alisa Gallant
ANALYSIS OF FOREST CHANGE IN FIRE DAMAGE AREA USING SATELLITE IMAGES
 ANALYSIS OF FOREST CHANGE IN FIRE DAMAGE AREA USING SATELLITE IMAGES Joon Mook Kang, Professor Joon Kyu Park, Ph.D Min Gyu Kim, Ph.D._Candidate Dept of Civil Engineering, Chungnam National University 220
Background research on the topic of urban forestry is intended to
 overview urban forestry Urban Forestry Background research on the topic of urban forestry is intended to help guide the task of integrating trees and urban forestry goals and aspirations into the Portland
MONITORING TOOLS AND METHODS. Michelle Buzalsky Rangeland Management Technician Shoshone National Forest
 MONITORING TOOLS AND METHODS Michelle Buzalsky Rangeland Management Technician Shoshone National Forest MONITORING TOOLS Tools for Monitoring Transect Stakes (PVC pipe, Rebar) 100 Tape Two Carpenter Rules
Assessing risks to ecosystems - a new global standard
 Assessing risks to ecosystems - a new global standard IUCN Ecosystem Red List Working Group David Keith et al. Major scientific challenges I. What is an ecosystem? II. When is an ecosystem extinct? disappearance
What is GIS? Geographic Information Systems. Introduction to ArcGIS. GIS Maps Contain Layers. What Can You Do With GIS? Layers Can Contain Features
 What is GIS? Geographic Information Systems Introduction to ArcGIS A database system in which the organizing principle is explicitly SPATIAL For CPSC 178 Visualization: Data, Pixels, and Ideas. What Can
THE DETAILS OF REAL-TIME REPORT CARDING THROUGH LOUISIANA S COASTWIDE REFERENCE MONITORING SYSTEM
 THE DETAILS OF REAL-TIME REPORT CARDING THROUGH LOUISIANA S COASTWIDE REFERENCE MONITORING SYSTEM Sarai Piazza, Marc Comeaux, Craig Conzelmann, & Dona Weifenbach CEER July 30, 2014 CRMS - Coastal Wetlands
SESSION 8: GEOGRAPHIC INFORMATION SYSTEMS AND MAP PROJECTIONS
 SESSION 8: GEOGRAPHIC INFORMATION SYSTEMS AND MAP PROJECTIONS KEY CONCEPTS: In this session we will look at: Geographic information systems and Map projections. Content that needs to be covered for examination
A Report on the City of Philadelphia s Existing and Possible Tree Canopy
 A Report on the City of Philadelphia s Existing and Possible Tree Canopy Why is Tree Canopy Important? Tree canopy (TC) is the layer of leaves, branches, and stems of trees that cover the ground when viewed