D-Facts. Vitamin D Competitive Evaluation
|
|
|
- Bennett Joseph Burke
- 9 years ago
- Views:
Transcription
1 D-Facts Vitamin D Competitive Evaluation

2 Abstract 101 patient samples collected across sites in Germany were used to compare the performance of the Siemens ADVIA Centaur Vitamin D Total (VitD), Abbott ARCHITECT 25-OH Vitamin D and the Roche Elecsys Vitamin D total assays to the DiaSorin LIAISON 25 OH Vitamin D TOTAL Assay and an LC-MS/ MS reference method. The DiaSorin assay correlates well with LC-MS/MS and demonstrates highly accurate results with a superior lower detection level when compared to other automated methods. Both Siemens and Abbott assays demonstrated poor sensitivity and clear positive bias for doses <10ng/mL against LC-MS/MS; in this study the Siemens assay showed a negative dose bias across the measuring range when compared against LC-MS/MS. The Roche assay exhibits poor correlation across the measuring range when compared with LC-MS/MS. The DiaSorin assay remains the most accurate and sensitive method for the measurement of total Vitamin D. Introduction In 2011 several manufacturers introduced new automated methods for the detection of 25-hydroxyvitamin D in patient samples for the assessment of Vitamin D sufficiency. Despite claims of high sensitivity and accuracy of these assays by the manufacturers, variable performance has been observed in practice. A study was designed to compare the accuracy, precision and sensitivity of the new assays of Siemens (ADVIA Centaur Vitamin D Total (Vit D)), Abbott (ARCHITECT 25- OH Vitamin D) and Roche (Elecsys Vitamin D total) to the DiaSorin (LIAISON 25 OH Vitamin D TOTAL Assay) assay. All immunoassay methods were also compared to an LC-MS/MS reference method.

3 Materials & Methods A total of 101 patient samples were selected from various sites across Germany in order to obtain a panel which spanned the range of the immunoassays. A total of 40 samples with sufficient volume were selected for subsequent LC-MS/MS analysis and when measured by LC-MS/MS, the doses ranged from 12 to 139 ng/ml. In addition to the samples detailed above, a further panel of samples, selected to contain low 25 OH Vitamin D concentrations, was evaluated on both the LC-MS/MS method and each of the four immunoassays in order to evaluate and compare the detection limits of the immunoassays. Following collection, the samples were stored at -20 C until analysis on each of the automated instruments and LC-MS/MS. All four immunoassay methods were performed according to the instructions for use provided by each manufacturer. LC-MS/MS assay results were used as an independent reference. Analysis In order to best analyze the data, both Linear Regression and Bland-Altman Bias plots were employed. The Linear Regression analysis allows the direct comparison of one methodology to another; whereas the Bland-Altman bias plots highlights the accuracy of one method to the selected reference.

4 Summary of Results Figure 1. Linear Regression of results from the four automated assays against LC-MS/MS. Figure 2. Linear Regression of results from the automated assays of Siemens, Abbott and Roche against the DiaSorin assay.

5 Figure 3. Bland-Altman bias plots of results from the four automated immunoassays against the LC-MS/MS reference. The other immunoassays, on each respective plot, are shown with DiaSorin in order to compare the detection limits of each.

6 Discussion Figure 1 indicates a clear negative bias of the Siemens assay when compared with LC-MS/MS (also Fig. 5b & f). The DiaSorin assay indicates a good correlation to LC-MS/MS with R2 0.89; correlation to LC-MS/MS is lower for Siemens, Abbott and Roche assays R2 = 0.85 / 0.87 / 0.70 respectively. There is little scatter in the data seen with the DiaSorin assay i.e. the variation of the results across the assay range is evenly spread with the tightest SD range (Fig. 5e) as compared with the other methods (Fig. 5f, 5g and 5h). Performance of the other assays indicates more variation with the Siemens (Fig. 5f) and Abbott (Fig. 5g) assays; although most variation is seen with the Roche assay (Fig. 5h). This increased level of variation could cause inaccuracies in reported patient data leading to difficulty in patient management. Figure 2 indicates that a high level of correlation is seen between the DiaSorin and the Abbott assays (Fig. 4b). However, reduced correlation is observed with both the Siemens and Roche assays, relative to the DiaSorin assay (Fig. 4a & 4c). There is an increased negative bias seen using the Siemens assay (Fig. 4a & 4d) with positive biases seen for both the Abbott (Fig. 4b & 4e) and Roche (Fig. 4c & 4f) assays. Figure 3 allows a more accurate assessment of the sensitivity of the assays and accuracy at low Vitamin D levels. The DiaSorin assay shows good agreement to the LC-MS/MS values with little variation in the data. A clear positive bias, and therefore inaccurate results are observed for both the Siemens (Fig. 3a) and Abbott (Fig. 3b) assays at low Vitamin D concentrations, whereas the Roche assay (Fig. 3c) indicates more variation at higher Vitamin D levels. What is clear from the data is that the DiaSorin assay shows a superior level of detection when compared with the assays of Siemens and Abbott. These methods did not report any values below 7ng/mL even though samples read as low as 1.2 ng/ml by LC-MS/MS. This lower detection level achieved by the DiaSorin assay and the low variation seen at these points allows more accurate measurement of severe deficiency in patients (defined as <5ng/mL 1 ). In countries whereby Vitamin D measurement and supplementation guidelines are present, such as GRIO in France, there is a requirement for a reliable test method for detection of levels <10ng/mL. As the DiaSorin assay shows improved accuracy over the Siemens and Abbott assays at this level, it should be considered as a better candidate assay for use in such cases.
 assays; although most variation is seen with the Roche assay (Fig. 5h).")
7 Conclusion The DiaSorin assay shows higher accuracy, sensitivity and a better correlation with LC-MS/MS when compared with assays for Siemens, Abbott and Roche. The Siemens assay shows a clear negative bias, and the Roche assay displays considerable variation across the assay range. Whereas similar accuracy is seen with both the Roche and DiaSorin assays at low 25 OH Vitamin D levels, Figure 3 also highlights that the DiaSorin assay accurately detects much lower levels of 25 OH Vitamin D than either the Siemens or Abbott assays. The DiaSorin assay correlates well with LC-MS/MS and demonstrates highly accurate results with a superior lower detection level when compared with other automated methods. Reference 1 Ebeling P. Megadose therapy for Vitamin D deficiency. Med J Aust 2005; 180(1): 4-5

8 Supporting Data Figure 4. Linear Regression (a c) and Bland-Altman bias plots (d f) of results from three automated assays against the DiaSorin assay.

9
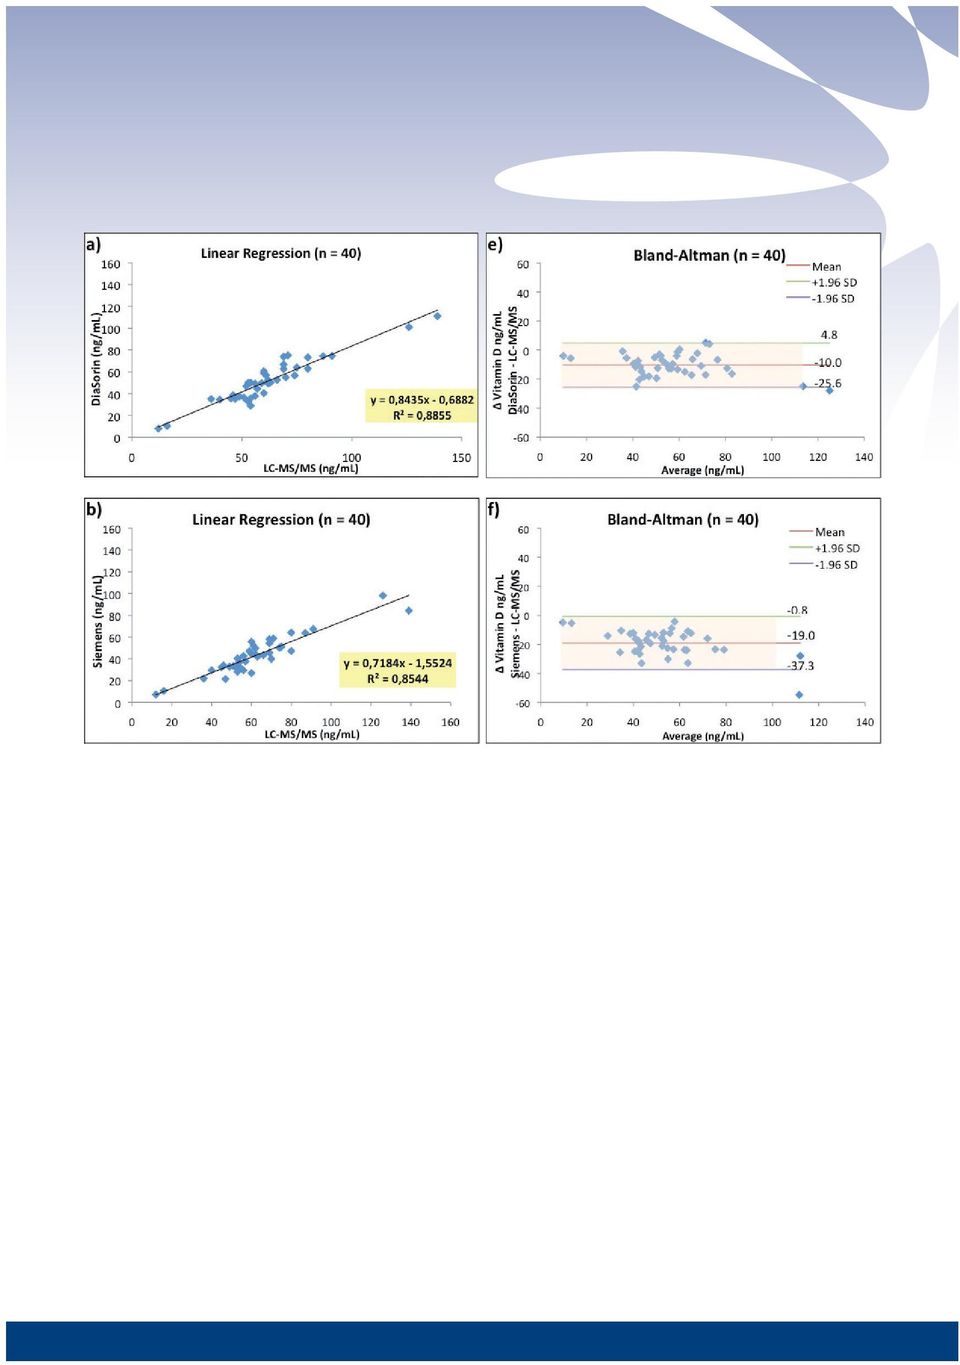
10 Figure 5. Linear Regression (a d) and Bland-Altman bias plots (e h) of results from the four automated assays against LC-MS/MS.

11

12 DiaSorin S.p.A. Via Crescentino Saluggia (VC) Italy Tel Fax: M

25-hydroxyvitamin D: from bone and mineral to general health marker
 DIABETES 25 OH Vitamin D TOTAL Assay 25-hydroxyvitamin D: from bone and mineral to general health marker FOR OUTSIDE THE US AND CANADA ONLY Vitamin D Receptors Brain Heart Breast Colon Pancreas Prostate
Borrelia burgdorferi IgG, IgM Fully automated chemiluminescence assays for quantitative determination of Borrelia antibodies in serum and CSF
 Borrelia burgdorferi IgG, IgM Fully automated chemiluminescence assays for quantitative determination of Borrelia antibodies in serum and FOR OUTSIDE THE US AND CANADA ONLY Borrelia burgdorferi IgG, IgM
Hepatitis and Retrovirus. LIAISON XL Accurate detection of HIV infection. HIV Ab/Ag FOR OUTSIDE THE US AND CANADA ONLY
 Hepatitis and Retrovirus LIAISON XL Accurate detection of HIV infection HIV Ab/Ag FOR OUTSIDE THE US AND CANADA ONLY LIAISON XL HIV Ab/Ag is Your solution LIAISON XL murex HIV Ab/Ag main features The LIAISON
LIAISON XL HBsAg Quant
 Hepatitis and Retrovirus LIAISON XL HBsAg Quant Reliable detection of HBsAg mutants and genotypes for accurate differential diagnosis of the stage of infection FOR OUTSIDE THE US AND CANADA ONLY LIAISON
LIAISON XL HCV Ab Accurate diagnosis of the early stage of HCV infection
 Hepatitis and Retrovirus LIAISON XL HCV Ab Accurate diagnosis of the early stage of HCV infection FOR OUTSIDE THE US AND CANADA ONLY LIAISON XL HCV Ab is Your solution LIAISON XL murex HCV Ab main features
INNOVATION TO MEET YOUR NEEDS
 INNOVATION TO MEET YOUR NEEDS 100% High Throughput The throughput is optimized splitting the pipetting phases of Reagents and Samples into different cycles. The innovative technical solutions adopted by
TRI-LEVEL CARDIAC CONTROL (CRD CONTROL 1, 2, 3)
") TRI-LEVEL CARDIAC CONTROL (CRD CONTROL 1, 2, 3) CAT NO. CQ3259 LOT NOS. 3190CK, 3191CK, 3192CK SIZE: 3 x 2ml EXPIRY: 2015-02 INTENDED USE This product is intended for in vitro diagnostic use in the quality
TRI-LEVEL CARDIAC CONTROL (CRD CONTROL 1, 2, 3) CAT NO. CQ3259 LOT NOS. 3190CK, 3191CK, 3192CK SIZE: 3 x 2ml EXPIRY: 2015-02 INTENDED USE This product is intended for in vitro diagnostic use in the quality
IMMUNOASSAY CONTROL - LEVEL 1 (IA CONTROL 1)
") 0843 IMMUNOASSAY CONTROL - LEVEL 1 (IA CONTROL 1) Cat. No. IA2638 / IA2633 Lot No. 978EC Size: 10 x 5 ml / 12 x 5 ml Expiry: 2013-10 INTENDED USE This product is intended for in vitro diagnostic use in
0843 IMMUNOASSAY CONTROL - LEVEL 1 (IA CONTROL 1) Cat. No. IA2638 / IA2633 Lot No. 978EC Size: 10 x 5 ml / 12 x 5 ml Expiry: 2013-10 INTENDED USE This product is intended for in vitro diagnostic use in
Introduction. Methods. Sample Processing
 PO-CON1656 High-sensitivity, high-throughput quantitation of catecholamines and metanephrine in plasma by automated WCX-SP coupled to LC/MS/MS for clinical research ASMS 2016 MP-080 Ichiro HIRANO 1, Atsuhiko
The Problem of the Use of different Units for the same Analyte
 The Problem of the Use of different Units for the same Analyte EQALM Symposium 2009 Ulla Tiikkainen ulla.tiikkainen @labquality.fi Comparability of results Measurement traceability to the reference material
IMMUNOASSAY PREMIUM PLUS LEVEL 3 (IA PREMIUM PLUS 3)
") 0843 IMMUNOASSAY PREMIUM PLUS LEVEL 3 (IA PREMIUM PLUS 3) Cat. No.: IA3111 / IA3112 Lot No.: 1130EC Size.: 12 x 5ml / 12 x 5ml Expiry.: 2014-10 INTENDED USE This product is intended for in vitro diagnostic
0843 IMMUNOASSAY PREMIUM PLUS LEVEL 3 (IA PREMIUM PLUS 3) Cat. No.: IA3111 / IA3112 Lot No.: 1130EC Size.: 12 x 5ml / 12 x 5ml Expiry.: 2014-10 INTENDED USE This product is intended for in vitro diagnostic
Jennifer L. Simeone and Paul D. Rainville Waters Corporation, Milford, MA, USA A P P L I C AT ION B E N E F I T S INT RO DU C T ION
 A Validated Liquid-Liquid Extraction Method with Direct Injection of Hexane for Clopidogrel in Human Plasma Using UltraPerformance Convergence Chromatography (UPC 2 ) and Xevo TQ-S Jennifer L. Simeone
Fast and Accurate Analysis of Vitamin D Metabolites Using Novel Chromatographic Selectivity and Sample Preparation
 Fast and Accurate Analysis of Vitamin D Metabolites Using Novel Chromatographic Selectivity and Sample Preparation Craig Aurand 1, David Bell 1, Anders Fridstrom 2, and Klaus Buckendahl 2 1 Supelco, Div.
1) Write the following as an algebraic expression using x as the variable: Triple a number subtracted from the number
 Write the following as an algebraic expression using x as the variable: Triple a number subtracted from the number") 1) Write the following as an algebraic expression using x as the variable: Triple a number subtracted from the number A. 3(x - x) B. x 3 x C. 3x - x D. x - 3x 2) Write the following as an algebraic expression
1) Write the following as an algebraic expression using x as the variable: Triple a number subtracted from the number A. 3(x - x) B. x 3 x C. 3x - x D. x - 3x 2) Write the following as an algebraic expression
Vitamin D toxicity? A case study
 Vitamin D toxicity? A case study Vichet Khieng, BMLSc, Medical Laboratory Scientist; Catherine Stevens, NZCS, Senior Medical Laboratory Scientist Department of Biochemistry, Southern Community Laboratories,
Analytical Test Method Validation Report Template
 Analytical Test Method Validation Report Template 1. Purpose The purpose of this Validation Summary Report is to summarize the finding of the validation of test method Determination of, following Validation
Accuracy Test Omnitest 3 Blood Glucose Monitoring System. B. Braun Diabetes Care
 Accuracy Test Omnitest Blood Glucose Monitoring System B. Braun Diabetes Care Accuracy Test Omnitest blood glucose monitoring system according to ISO 97 The accuracy study of Omnitest blood glucose monitoring
THE PREVALENCE OF SUBOPTIMAL VITAMIN D STATUS IN A RANDOMLY SELECTED COHORT OF COLORADO FIREFIGHTERS
 THE PREVALENCE OF SUBOPTIMAL VITAMIN D STATUS IN A RANDOMLY SELECTED COHORT OF COLORADO FIREFIGHTERS Gerard Guillory, M.D. and Michael Mutzel, M.Sc. Abstract: Vitamin D insufficiency has been associated
2. Filling Data Gaps, Data validation & Descriptive Statistics
 2. Filling Data Gaps, Data validation & Descriptive Statistics Dr. Prasad Modak Background Data collected from field may suffer from these problems Data may contain gaps ( = no readings during this period)
ICH Topic Q 2 (R1) Validation of Analytical Procedures: Text and Methodology. Step 5
 Validation of Analytical Procedures: Text and Methodology. Step 5") European Medicines Agency June 1995 CPMP/ICH/381/95 ICH Topic Q 2 (R1) Validation of Analytical Procedures: Text and Methodology Step 5 NOTE FOR GUIDANCE ON VALIDATION OF ANALYTICAL PROCEDURES: TEXT AND
European Medicines Agency June 1995 CPMP/ICH/381/95 ICH Topic Q 2 (R1) Validation of Analytical Procedures: Text and Methodology Step 5 NOTE FOR GUIDANCE ON VALIDATION OF ANALYTICAL PROCEDURES: TEXT AND
Gage Studies for Continuous Data
 1 Gage Studies for Continuous Data Objectives Determine the adequacy of measurement systems. Calculate statistics to assess the linearity and bias of a measurement system. 1-1 Contents Contents Examples
ENHANCING INTELLIGENCE SUCCESS: DATA CHARACTERIZATION Francine Forney, Senior Management Consultant, Fuel Consulting, LLC May 2013
 ENHANCING INTELLIGENCE SUCCESS: DATA CHARACTERIZATION, Fuel Consulting, LLC May 2013 DATA AND ANALYSIS INTERACTION Understanding the content, accuracy, source, and completeness of data is critical to the
Point-of-care (POC) versus central laboratory instrumentation for monitoring oral anticoagulation
 versus central laboratory instrumentation for monitoring oral anticoagulation") Point-of-care (POC) versus central laboratory instrumentation for monitoring oral anticoagulation David M Dorfman a, Ellen M Goonan a, M Kay Boutilier a, Petr Jarolim a, Milenko Tanasijevic a and Samuel
Point-of-care (POC) versus central laboratory instrumentation for monitoring oral anticoagulation David M Dorfman a, Ellen M Goonan a, M Kay Boutilier a, Petr Jarolim a, Milenko Tanasijevic a and Samuel
Linear Regression. Chapter 5. Prediction via Regression Line Number of new birds and Percent returning. Least Squares
 Linear Regression Chapter 5 Regression Objective: To quantify the linear relationship between an explanatory variable (x) and response variable (y). We can then predict the average response for all subjects
Chapter 10. Key Ideas Correlation, Correlation Coefficient (r),
,") Chapter 0 Key Ideas Correlation, Correlation Coefficient (r), Section 0-: Overview We have already explored the basics of describing single variable data sets. However, when two quantitative variables
Chapter 0 Key Ideas Correlation, Correlation Coefficient (r), Section 0-: Overview We have already explored the basics of describing single variable data sets. However, when two quantitative variables
2) The three categories of forecasting models are time series, quantitative, and qualitative. 2)
 The three categories of forecasting models are time series, quantitative, and qualitative. 2)") Exam Name TRUE/FALSE. Write 'T' if the statement is true and 'F' if the statement is false. 1) Regression is always a superior forecasting method to exponential smoothing, so regression should be used
Exam Name TRUE/FALSE. Write 'T' if the statement is true and 'F' if the statement is false. 1) Regression is always a superior forecasting method to exponential smoothing, so regression should be used
The impact of window size on AMV
 The impact of window size on AMV E. H. Sohn 1 and R. Borde 2 KMA 1 and EUMETSAT 2 Abstract Target size determination is subjective not only for tracking the vector but also AMV results. Smaller target
2. Simple Linear Regression
 Research methods - II 3 2. Simple Linear Regression Simple linear regression is a technique in parametric statistics that is commonly used for analyzing mean response of a variable Y which changes according
Table. Analytical characteristics of commercial cardiac troponin I and T assays declared by the manufacturer.
 Table. Analytical characteristics of commercial cardiac troponin I and T assays declared by the manufacturer. Commercially available assays - Company/ platform(s)/ assay LoB a LoD b 99 th % %CV at 99 th
Financial Risk Management Exam Sample Questions/Answers
 Financial Risk Management Exam Sample Questions/Answers Prepared by Daniel HERLEMONT 1 2 3 4 5 6 Chapter 3 Fundamentals of Statistics FRM-99, Question 4 Random walk assumes that returns from one time period
The correlation coefficient
 The correlation coefficient Clinical Biostatistics The correlation coefficient Martin Bland Correlation coefficients are used to measure the of the relationship or association between two quantitative
College Readiness LINKING STUDY
 College Readiness LINKING STUDY A Study of the Alignment of the RIT Scales of NWEA s MAP Assessments with the College Readiness Benchmarks of EXPLORE, PLAN, and ACT December 2011 (updated January 17, 2012)
Facebook Friend Suggestion Eytan Daniyalzade and Tim Lipus
 Facebook Friend Suggestion Eytan Daniyalzade and Tim Lipus 1. Introduction Facebook is a social networking website with an open platform that enables developers to extract and utilize user information
ACCURACY IMPROVEMENT IN RAPID PROTOTYPING MACHINE (FDM-1650)
") ACCURACY IMPROVEMENT IN RAPID PROTOTYPING MACHINE (1650) A. Gregorian*, B. Elliott*, R. Navarro*, F. Ochoa*, H. Singh*, E. Monge* J. Foyos*, R. Noorani*, B. Fritz 1, and S. Jayanthi 2. *NSF Research Experiences
ACCURACY IMPROVEMENT IN RAPID PROTOTYPING MACHINE (1650) A. Gregorian*, B. Elliott*, R. Navarro*, F. Ochoa*, H. Singh*, E. Monge* J. Foyos*, R. Noorani*, B. Fritz 1, and S. Jayanthi 2. *NSF Research Experiences
USING CLSI GUIDELINES TO PERFORM METHOD EVALUATION STUDIES IN YOUR LABORATORY
 USING CLSI GUIDELINES TO PERFORM METHOD EVALUATION STUDIES IN YOUR LABORATORY Breakout Session 3B Tuesday, May 1 8:30 10 am James Blackwood, MS, CLSI David D. Koch, PhD, FACB, DABCC, Pathology & Laboratory
Lin s Concordance Correlation Coefficient
 NSS Statistical Software NSS.com hapter 30 Lin s oncordance orrelation oefficient Introduction This procedure calculates Lin s concordance correlation coefficient ( ) from a set of bivariate data. The
Method Validation/Verification. CAP/CLIA regulated methods at Texas Department of State Health Services Laboratory
 Method Validation/Verification CAP/CLIA regulated methods at Texas Department of State Health Services Laboratory References Westgard J. O.: Basic Method Validation, Westgard Quality Corporation Sarewitz
Pressure in Fluids. Introduction
 Pressure in Fluids Introduction In this laboratory we begin to study another important physical quantity associated with fluids: pressure. For the time being we will concentrate on static pressure: pressure
Homework 8 Solutions
 Math 17, Section 2 Spring 2011 Homework 8 Solutions Assignment Chapter 7: 7.36, 7.40 Chapter 8: 8.14, 8.16, 8.28, 8.36 (a-d), 8.38, 8.62 Chapter 9: 9.4, 9.14 Chapter 7 7.36] a) A scatterplot is given below.
Assessing Measurement System Variation
 Assessing Measurement System Variation Example 1: Fuel Injector Nozzle Diameters Problem A manufacturer of fuel injector nozzles installs a new digital measuring system. Investigators want to determine
Unit 9 Describing Relationships in Scatter Plots and Line Graphs
 Unit 9 Describing Relationships in Scatter Plots and Line Graphs Objectives: To construct and interpret a scatter plot or line graph for two quantitative variables To recognize linear relationships, non-linear
A study to Evaluate PPI s effect on vitamin D levels. Rani Hanna M.D., M.S. PGY-3 Joseph Grisanti, MD
 A study to Evaluate PPI s effect on vitamin D levels Rani Hanna M.D., M.S. PGY-3 Joseph Grisanti, MD The sunshine vitamin Existed over 500 million years. Prehormone, not only a vitamin. Two major sources:
White Paper. Comparison between subjective listening quality and P.862 PESQ score. Prepared by: A.W. Rix Psytechnics Limited
 Comparison between subjective listening quality and P.862 PESQ score White Paper Prepared by: A.W. Rix Psytechnics Limited 23 Museum Street Ipswich, Suffolk United Kingdom IP1 1HN t: +44 (0) 1473 261 800
The Correlation Coefficient
 The Correlation Coefficient Lelys Bravo de Guenni April 22nd, 2015 Outline The Correlation coefficient Positive Correlation Negative Correlation Properties of the Correlation Coefficient Non-linear association
Global Clinical Laboratory Testing Market Report: 2012 Edition
 Brochure More information from http://www.researchandmarkets.com/reports/2165640/ Global Clinical Laboratory Testing Market Report: 2012 Edition Description: Clinical laboratory testing market is one of
4. Multiple Regression in Practice
 30 Multiple Regression in Practice 4. Multiple Regression in Practice The preceding chapters have helped define the broad principles on which regression analysis is based. What features one should look
WEB APPENDIX. Calculating Beta Coefficients. b Beta Rise Run Y 7.1 1 8.92 X 10.0 0.0 16.0 10.0 1.6
 WEB APPENDIX 8A Calculating Beta Coefficients The CAPM is an ex ante model, which means that all of the variables represent before-thefact, expected values. In particular, the beta coefficient used in
Performance evaluation and quality assurance of Varian enhanced dynamic wedges
 JOURNAL OF APPLIED CLINICAL MEDICAL PHYSICS, VOLUME 7, NUMBER 1, WINTER 2006 Performance evaluation and quality assurance of Varian enhanced dynamic wedges Parham Alaei and Patrick D. Higgins Department
Test Bias. As we have seen, psychological tests can be well-conceived and well-constructed, but
 Test Bias As we have seen, psychological tests can be well-conceived and well-constructed, but none are perfect. The reliability of test scores can be compromised by random measurement error (unsystematic
Measurement Systems Correlation MSC for Suppliers
 Measurement Systems Correlation MSC for Suppliers Copyright 2003-2007 Raytheon Company. All rights reserved. R6σ is a Raytheon trademark registered in the United States and Europe. Raytheon Six Sigma is
Univariate Regression
 Univariate Regression Correlation and Regression The regression line summarizes the linear relationship between 2 variables Correlation coefficient, r, measures strength of relationship: the closer r is
Homework 11. Part 1. Name: Score: / null
 Name: Score: / Homework 11 Part 1 null 1 For which of the following correlations would the data points be clustered most closely around a straight line? A. r = 0.50 B. r = -0.80 C. r = 0.10 D. There is
In this chapter, you will learn to use cost-volume-profit analysis.
 2.0 Chapter Introduction In this chapter, you will learn to use cost-volume-profit analysis. Assumptions. When you acquire supplies or services, you normally expect to pay a smaller price per unit as the
Lean Six Sigma Analyze Phase Introduction. TECH 50800 QUALITY and PRODUCTIVITY in INDUSTRY and TECHNOLOGY
 TECH 50800 QUALITY and PRODUCTIVITY in INDUSTRY and TECHNOLOGY Before we begin: Turn on the sound on your computer. There is audio to accompany this presentation. Audio will accompany most of the online
Urine Specimen Dilution: Assessment and Policy Recommendations
 Urine Specimen Dilution: Assessment and Policy Recommendations Dr. Leo Kadehjian uly 21, 2003 The following comments and recommendations are for informational use only. Consultation with program counsel
DESCRIPTIVE STATISTICS. The purpose of statistics is to condense raw data to make it easier to answer specific questions; test hypotheses.
 DESCRIPTIVE STATISTICS The purpose of statistics is to condense raw data to make it easier to answer specific questions; test hypotheses. DESCRIPTIVE VS. INFERENTIAL STATISTICS Descriptive To organize,
Simple linear regression
 Simple linear regression Introduction Simple linear regression is a statistical method for obtaining a formula to predict values of one variable from another where there is a causal relationship between
ncounter Leukemia Fusion Gene Expression Assay Molecules That Count Product Highlights ncounter Leukemia Fusion Gene Expression Assay Overview
 ncounter Leukemia Fusion Gene Expression Assay Product Highlights Simultaneous detection and quantification of 25 fusion gene isoforms and 23 additional mrnas related to leukemia Compatible with a variety
A Short Tour of the Predictive Modeling Process
 Chapter 2 A Short Tour of the Predictive Modeling Process Before diving in to the formal components of model building, we present a simple example that illustrates the broad concepts of model building.
Guidance for Industry and FDA Staff Tonometers - Premarket Notification [510(k)] Submissions
![Guidance for Industry and FDA Staff Tonometers - Premarket Notification [510(k)] Submissions](/thumbs/39/18581577.jpg "Guidance for Industry and FDA Staff Tonometers - Premarket Notification [510(k)] Submissions") Guidance for Industry and FDA Staff Tonometers - Premarket Notification [510(k)] Submissions Document issued on: March 27, 2006 For questions regarding this document, contact Everette Beers, Ph.D. at 240-276-4200
Guidance for Industry and FDA Staff Tonometers - Premarket Notification [510(k)] Submissions Document issued on: March 27, 2006 For questions regarding this document, contact Everette Beers, Ph.D. at 240-276-4200
A practical and novel standard addition strategy to screen. pharmacodynamic components in traditional Chinese medicine using
 Electronic Supplementary Material (ESI) for RSC Advances. This journal is The Royal Society of Chemistry 2015 A practical and novel standard addition strategy to screen pharmacodynamic components in traditional
Introduction to Accuracy and Repeatability in Linear Motion Systems
 Introduction to accuracy and repeatability in linear motion systems By Gary Rosengren, Director of Engineering Tolomatic, Inc. About the Author Gary Rosengren is Director of Engineering at Tolomatic and
Course Objective This course is designed to give you a basic understanding of how to run regressions in SPSS.
 SPSS Regressions Social Science Research Lab American University, Washington, D.C. Web. www.american.edu/provost/ctrl/pclabs.cfm Tel. x3862 Email. [email protected] Course Objective This course is designed
Calcium. Table 1: Difference between method means in percent
 Calcium Measurement of total calcium is widely used for both the diagnosis and the monitoring of a range of conditions related to the bones, heart, nerves, and kidneys. Total calcium measurements include
Financial Risk Management Exam Sample Questions
 Financial Risk Management Exam Sample Questions Prepared by Daniel HERLEMONT 1 PART I - QUANTITATIVE ANALYSIS 3 Chapter 1 - Bunds Fundamentals 3 Chapter 2 - Fundamentals of Probability 7 Chapter 3 Fundamentals
Fast, Reproducible LC-MS/MS Analysis of Dextromethorphan and Dextrorphan
 Fast, Reproducible LC-MS/MS Analysis of and Kimberly Phipps, Thermo Fisher Scientific, Runcorn, Cheshire, UK Application Note 685 Key Words Accucore C18, dextromethorphan, dextrorphan, SOLA CX Abstract
Validation and Calibration. Definitions and Terminology
 Validation and Calibration Definitions and Terminology ACCEPTANCE CRITERIA: The specifications and acceptance/rejection criteria, such as acceptable quality level and unacceptable quality level, with an
Hedge Effectiveness Testing
 Hedge Effectiveness Testing Using Regression Analysis Ira G. Kawaller, Ph.D. Kawaller & Company, LLC Reva B. Steinberg BDO Seidman LLP When companies use derivative instruments to hedge economic exposures,
An Application of the High-Low Spread Estimator to Intraday Data
 An Application of the High-Low Spread Estimator to Intraday Data Shane A. Corwin and Paul Schultz February 2009 Corwin and Schultz (2009) derive an estimator for the bid-ask spread based on daily high
Session 7 Bivariate Data and Analysis
 Session 7 Bivariate Data and Analysis Key Terms for This Session Previously Introduced mean standard deviation New in This Session association bivariate analysis contingency table co-variation least squares
Biochemistry Validation Form
 Biochemistry Validation Form Method: Piccolo Xpress Chemistry 13 panel Manufacturer: Abaxis Cat no: 400-0029 CE marked: Yes: x No: Location of bench book: X:\Bio\Patricia\Piccollo Xpress evaluation (August
Canonical Correlation Analysis
 Canonical Correlation Analysis LEARNING OBJECTIVES Upon completing this chapter, you should be able to do the following: State the similarities and differences between multiple regression, factor analysis,
A new ranking of the world s most innovative countries: Notes on methodology. An Economist Intelligence Unit report Sponsored by Cisco
 A new ranking of the world s An Economist Intelligence Unit report Sponsored by Cisco Economist Intelligence Unit Limited 2009 A new ranking of the world s Preface In April 2009, the Economist Intelligence
LC-MS/MS Method for the Determination of Docetaxel in Human Serum for Clinical Research
 LC-MS/MS Method for the Determination of Docetaxel in Human Serum for Clinical Research J. Jones, J. Denbigh, Thermo Fisher Scientific, Runcorn, Cheshire, UK Application Note 20581 Key Words SPE, SOLA,
The Combination Forecasting Model of Auto Sales Based on Seasonal Index and RBF Neural Network
 , pp.67-76 http://dx.doi.org/10.14257/ijdta.2016.9.1.06 The Combination Forecasting Model of Auto Sales Based on Seasonal Index and RBF Neural Network Lihua Yang and Baolin Li* School of Economics and
Fairfield Public Schools
 Mathematics Fairfield Public Schools AP Statistics AP Statistics BOE Approved 04/08/2014 1 AP STATISTICS Critical Areas of Focus AP Statistics is a rigorous course that offers advanced students an opportunity
Selective Testosterone Analysis in Human Serum by LC-FAIMS-MS/MS
 Application Note: 446 Selective Testosterone Analysis in Human Serum by LC-FAIMS-MS/MS Jonathan McNally and Michael Belford, Thermo Fisher Scientific, San Jose, CA James Kapron, Thermo Fisher Scientific,
Lecture 11: Chapter 5, Section 3 Relationships between Two Quantitative Variables; Correlation
 Lecture 11: Chapter 5, Section 3 Relationships between Two Quantitative Variables; Correlation Display and Summarize Correlation for Direction and Strength Properties of Correlation Regression Line Cengage
for patient monitoring
 Thermo Scientific Indiko Reagents for Immunosuppressant Drug Testing Complete solutions for patient monitoring The cost-effective Thermo Scientific Indiko benchtop analyzer and bar-coded reagent is designed
Judit Oldekamp, Cornelia Eichner 2009 Elecsys Testosterone II
 Judit Oldekamp, Cornelia Eichner 2009 Elecsys Testosterone II Technical Performance of Elecsys Testosterone II Testosterone Background I Current immunoassays for testosterone seem to over-estimate testosterone
Scatter Plots with Error Bars
 Chapter 165 Scatter Plots with Error Bars Introduction The procedure extends the capability of the basic scatter plot by allowing you to plot the variability in Y and X corresponding to each point. Each
A comparison of blood glucose meters in Australia
 Diabetes Research and Clinical Practice 71 (2006) 113 118 www.elsevier.com/locate/diabres A comparison of blood glucose meters in Australia Matthew Cohen *, Erin Boyle, Carol Delaney, Jonathan Shaw International
Georgia Department of Education Common Core Georgia Performance Standards Framework Teacher Edition Coordinate Algebra Unit 4
 Equal Salaries for Equal Work? Mathematical Goals Represent data on a scatter plot Describe how two variables are related Informally assess the fit of a function by plotting and analyzing residuals Fit
Obtaining insurance coverage for human growth hormone treatment for Idiopathic Short Stature In 2003, the Food and Drug Administration (FDA) approved
 approved") Obtaining insurance coverage for human growth hormone treatment for Idiopathic Short Stature In 2003, the Food and Drug Administration (FDA) approved the use of growth hormone (GH) for the long-term treatment
Obtaining insurance coverage for human growth hormone treatment for Idiopathic Short Stature In 2003, the Food and Drug Administration (FDA) approved the use of growth hormone (GH) for the long-term treatment
Answer: C. The strength of a correlation does not change if units change by a linear transformation such as: Fahrenheit = 32 + (5/9) * Centigrade
 * Centigrade") Statistics Quiz Correlation and Regression -- ANSWERS 1. Temperature and air pollution are known to be correlated. We collect data from two laboratories, in Boston and Montreal. Boston makes their measurements
Statistics Quiz Correlation and Regression -- ANSWERS 1. Temperature and air pollution are known to be correlated. We collect data from two laboratories, in Boston and Montreal. Boston makes their measurements
Exponential Growth and Modeling
 Exponential Growth and Modeling Is it Really a Small World After All? I. ASSESSSMENT TASK OVERVIEW & PURPOSE: Students will apply their knowledge of functions and regressions to compare the U.S. population
DELAYED MODE QUALITY CONTROL OF ARGO SALINITY DATA IN THE MEDITERRANEAN AND BLACK SEA FLOAT WMO 6900818. G. Notarstefano and P.-M.
 DELAYED MODE QUALITY CONTROL OF ARGO SALINITY DATA IN THE MEDITERRANEAN AND BLACK SEA FLOAT WMO 6900818 G. Notarstefano and P.-M. Poulain Produced by the Mediterranean Argo Regional Centre (MedArgo), OGS,
How to Verify Performance Specifications
 How to Verify Performance Specifications VERIFICATION OF PERFORMANCE SPECIFICATIONS In 2003, the Centers for Medicare and Medicaid Services (CMS) updated the CLIA 88 regulations. As a result of the updated
Descriptive Statistics
 Descriptive Statistics Descriptive statistics consist of methods for organizing and summarizing data. It includes the construction of graphs, charts and tables, as well various descriptive measures such
430 Statistics and Financial Mathematics for Business
 Prescription: 430 Statistics and Financial Mathematics for Business Elective prescription Level 4 Credit 20 Version 2 Aim Students will be able to summarise, analyse, interpret and present data, make predictions
Standard Deviation Estimator
 CSS.com Chapter 905 Standard Deviation Estimator Introduction Even though it is not of primary interest, an estimate of the standard deviation (SD) is needed when calculating the power or sample size of
Charts, Tables, and Graphs
 Charts, Tables, and Graphs The Mathematics sections of the SAT also include some questions about charts, tables, and graphs. You should know how to (1) read and understand information that is given; (2)
GUIDELINES FOR THE VALIDATION OF ANALYTICAL METHODS FOR ACTIVE CONSTITUENT, AGRICULTURAL AND VETERINARY CHEMICAL PRODUCTS.
 GUIDELINES FOR THE VALIDATION OF ANALYTICAL METHODS FOR ACTIVE CONSTITUENT, AGRICULTURAL AND VETERINARY CHEMICAL PRODUCTS October 2004 APVMA PO Box E240 KINGSTON 2604 AUSTRALIA http://www.apvma.gov.au
AN2604 Application note
 AN2604 Application note STM32F101xx and STM32F103xx RTC calibration Introduction The real-time clock (RTC) precision is a requirement in most embedded applications, but due to external environment temperature
How Can We Get the Best Medication History?
 How Can We Get the Best Medication History? Stephen Shalansky, Pharm.D., FCSHP Pharmacy Department, St. Paul s Hospital Faculty of Pharmaceutical Sciences, UBC How Are We Doing Now? Completeness of Medication
Correlation and Regression
 Correlation and Regression Scatterplots Correlation Explanatory and response variables Simple linear regression General Principles of Data Analysis First plot the data, then add numerical summaries Look