I d ( r; MPK f, τ) Y < C d +I d +G
|
|
|
- Alison Dorsey
- 9 years ago
- Views:
Transcription
1 1. Use the IS-LM model to determine the effects of each of the following on the general equilibrium values of the real wage, employment, output, the real interest rate, consumption, investment, and the price level. a. A reduction in the effective tax rate on capital that increases desired investment. Answer: I d ( r; MPK f, τ) If τ, then the investment schedule shifts to the right. Adjustment story: at r o the level of desired savings is less than the level of desired investment. That is equivalent to saying the following Y < C d +I d +G i.e., the Goods Market is not in equilibrium at r o. Explain adjustment in the goods market in terms of movements along desired savings and desired investment. (Note that we are assuming that prices of the goods are not changing) at r o : Y < c d + I d + G consumers save less and firms invest more when the interst rate it low 1

2 r eliminates the excess demand for goods over the supply by c d & I d until Y = c d + I d + G adjustment along the savings schedule: r S d = Y C d G adjustment along the investment schedule: r ( r + d)p k = uc I t = K K t + dk t Now we can write out the IS function explicitly IS e f r, Y; y f, W, G, T, MPK, τ If τ then the IS curve shifts up, i.e., to the right. Note that when we consider changes in r and Y, then we are contemplating movements along the IS curve! When an exogenous variable changes, we are considering what happens to the equilibrium interest rate for a given level of output, Y. Asset Market Equilibrium: Recall our money demand function In equilibrium ( ) M d = PL Y, r + π e M s = M d ( ) ( ) M s = PL Y, r + π e Ms P = L Y, r + πe 2

3 Now we can graph this relationship Money supply changes: P shifts the money supply curve to the left Adjustment Story: at r 1 the quantity of money demanded exceeds the quantity of money supplied. As money holders sell some of their nonmonetary assets so they can hold more money in their portfolios, the price of nonmonetary assets is driven down. This raises the real interest rate on nonmonetary assets. As r rises the quantity of money demanded falls (movement along a negatively sloped money demand curve), until equilibrium is reached. Show with the money demand equation. 3

4 4
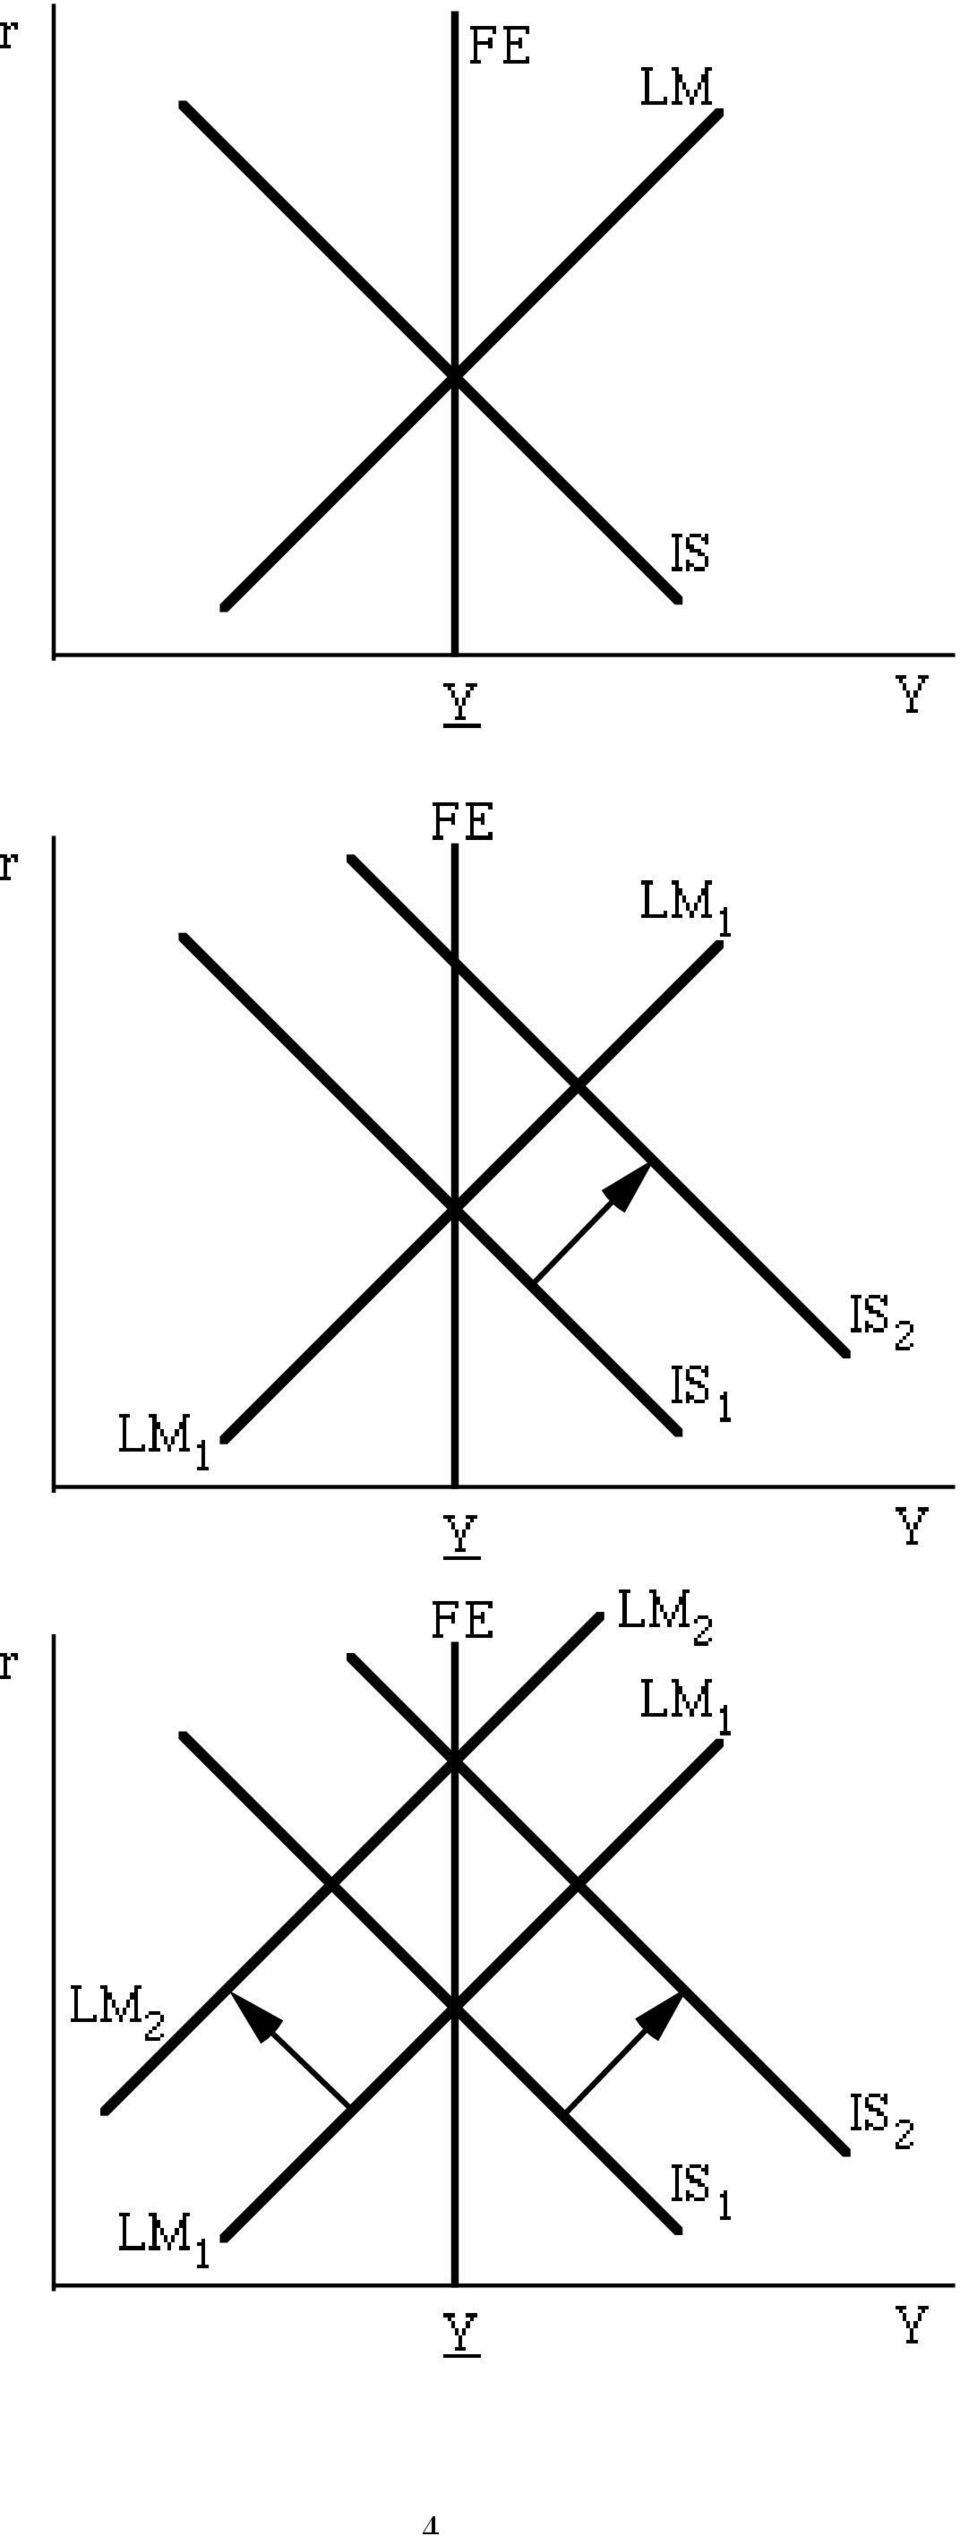
5 b. The expected rate of inflation rises. Answer: If πe then real money demand falls, i.e., shifts back. Adjustment Story: at the old interest rate, the supply of money exceeds the quantity of money demanded. Agents purchase nonmonetary assets, driving their prices up and their real returns (the real interest rate paid on the asset) down. As the real interest rate falls, individuals find the nonmonetary asset less and less attractive relative to money. Eventually the interest rate will fall so low that the excess supply of money and the excess demand for nonmonetary assets are zero. r M d = P L( Y, r + π e ) movement along new money demand schedule. We can write the LM function 1 as follows LM r, Y; πe, P, M s, i m, W, risk of nonmonetary assets, risk of money, efficiency of payments technologies, liquidity of alternative assets 1 This is by no means an exhaustive listing. Note again that when we write the LM function we usually suppress a number of the variables. 5

6 If π e, then the LM curve shifts out, i.e., shifts to the right But is that the end of the story? Are we in long run equilibrium at point 2? r FE LM 1 LM Y IS Y Point 2 is not a long run equilibrium. What will bring our economy into long run equilibrium? Money supply changes: P shifts the money supply curve to the left Adjustment Story: at r 1 the quantity of money demanded exceeds the quantity of money supplied. As money holders sell some of their nonmonetary assets so they can hold more money in their portfolios, the price of nonmonetary assets is driven down. This raises the real interest rate on nonmonetary assets. As r rises the quantity of money demanded falls (movement along a negatively sloped money demand curve), until equilibrium is reached. Show with the money demand equation. 6

7 Putting it together we have the following r FE LM 1 = LM 3 LM 2 IS Y Summary of Changes: The rise in expected inflation shifts the LM curve down. The price level rises, shifting the LM curve up to restore equilibrium. Since the real interest rate is unchanged, consumption and investment are unchanged. Thus, there is no change in the real wage, employment, output, the real interest rate, consumption, or investment; and there is a rise in the price level. c. An influx of working-age immigrants increases labor supply (ignore any other possible effects of increased population). Answer: The increase in labor supply is shown above. The real wage declines and the level of employment rises 7

8 Increase in labor supply: N Y = AF K, N Full Employment Output Changes: Y is precisely how we derived the IS schedule. Thus IS does not change and the shift in the FE line is along a stable IS curve. An increase in labor supply, increases the full employment level of output. Does the IS curve shift? NO. This is a movement along the IS curve. What happens to national savings when Y changes? S(Y 1 ) S(Y2 ) r 1 r 2 I IS ANS: Y 1 Y 2 Y S d = Y - C d - G 8

9 How do we explain the movement along the IS curve? At point A: Initial general equilibrium point. After the influx of working-age immigrants, this is the short run equilibrium, where IS and LM intersect. Here the goods market is in equilibrium since aggregate quantities of goods supplied equal the quantities demanded. Recall that firms always produce more output as aggregate quantities of goods demanded rises. But notice that the firms, though, they are meeting this demand, they are producing less output than the new full-employment level of output. The full employment level of output rose when FE shifted to the right. The full-employment level of output is determined by firms labor and capital hiring decisions. But, at point A, firms are producing less than their profit maximizing levels of output. So at point A Y > C d +I d +G Thus point A cannot be a long run equilibrium. But how will this adjust? Recall, that we have taken prices to be fixed. But now that will no longer be the case. Firms will lower their prices since they want to produce more. Price level falls: Ms P = L ( e Y, r + π ) real money supply shifts to the right along a stable money demand function 9

10 Y C d S d = Y C d G savings shifts rightward 10

11 After the adjustment The rise in employment causes an increase in output, shifting the FE line to the right. To restore equilibrium, the price level must decline, shifting the LM curve down. Since output increases and the real interest rate declines, consumption and investment increase. In summary, real wage, the real interest rate, and the price level decline; and employment, output, consumption, and investment rise. d. The introduction of automatic teller machines reduces the demand for money. Answer: The reduction in the demand for money gives results identical to those in part (b). 11

12 2. Use the IS-LM model to analyze the general equilibrium effects of a permanent increase in the price of oil (a permanent adverse supply shock) on current output, employment, real wage, national saving, consumption, investment, the real interest rate, and the price level. Assume that, besides reducing the current productivity of capital and labor, the permanent supply shock lowers both the expected future MPK and households expected future incomes. Show that, if real interest rate rises at all, it will rise less than in the case of a temporary supply shock that has an equal effect on current output. Answer: The increase in the price of oil reduces the marginal product of labor, causing the labor demand curve to shift to the left. Consider the following Cobb- Douglas Production function. Y= AK γ N 1-γ ( ) where γ 0, 1 [ ] Y N = ( 1 γ)a K N If A Y N = ( 1 γ ) A K N γ γ 12

13 Decrease in the quantity of labor supplied: N Y =AF K, N Full Employment Output Changes: Consider a temporary adverse supply shock first 13

14 A temporary adverse supply shock, reduces the full employment level of output. Does the IS curve shift? NO. This is a movement along the IS curve. What happens to national savings when Y changes? ANS: Y S d = Y C d G Y is precisely how we derived the IS schedule. Thus IS does not change and the shift in the FE line is along a stable IS curve. At point A: Initial general equilibrium point. After the adverse supply shock, this is the short run equilibrium, where IS and LM intersect. Here the goods market is in equilibrium since aggregate quantities of goods supplied equal the quantities demanded. Recall that firms always produce more output as aggregate quantities of goods demanded rises. But notice that the firms, though, they are meeting this demand, they are producing more output than the new full-employment level of output. The full employment level of output fell when FE shifted to the left. The fullemployment level of output is determined by firms labor and capital hiring decisions. But, at point A, firms are producing more than their profit maximizing levels of output. So at point A Y < C d +I d +G Thus point A cannot be a long run equilibrium. But how will this adjust? Recall, that we have taken prices to be fixed. But now that will no longer be the case. Firms will raise their prices since the aggregate quantity of goods demanded exceeds what firms want to produce. Price level rises: P Ms = L Y, r + πe real money supply shifts to the left along a stable money demand function 14

15 How do we explain the movement along the IS curve? Y C d S d = Y C d G savings shifts leftward 15

16 After the adjustment When the shock is temporary there is no impact on future output or the future marginal product of capital, so the IS curve does not shift. In that case the price level increases to restore equilibrium. In that case, the real interest rate unambiguously increases. KEY POINT: Under a permanent shock, the IS curve shifts down, so the rise in the real interest rate is less than in the case of a temporary shock, and the real interest rate can even decline. We have provided the answer to the case of a temporary supply shock. 16

17 Now consider the case of a permanent supply shock. The adverse supply shock results in a shift to the left of the full-employment line, as both employment and productivity decline. Because the shock is permanent, it reduces future output and reduces the future marginal product of capital, both of which result in a downward shift of the IS curve. The new equilibrium is located at the intersection of the new IS curve and the new FE line. If, as we have drawn the figure, this intersection lies above and to the left of the original LM curve, the price level will increase and shift the LM curve upward to pass through the new equilibrium point. The result is an increase in the price level, but an ambiguous effect on the real interest rate. Since output is lower, consumption is lower. Since the effect on the real interest rate is ambiguous, the effect on saving and investment are ambiguous as well, though the fall in the future marginal product of capital would tend to reduce investment. 17

18 3. Suppose that the price level is fixed in the short run so that the economy doesn t reach general equilibrium immediately after a change in the economy. For each of the following changes, what are the short-run effects on the real interest rate and output? Assume that, when the economy is in disequilibrium, only the labor market is out of equilibrium; assume also that for a short period firms are willing to produce enough output to meet the aggregate demand for output. a. A decrease in the expected rate of inflation. Answer: If πe then real money demand rises, i.e., shifts rightward. Adjustment Story: at the old interest rate, the quantity of money demanded exceeds the supply of money. Agents sell nonmonetary assets, driving their prices down and their real returns (the real interest rate paid on the asset) up. As the real interest rate rises, individuals find money less and less attractive relative to the nonmonetary asset. Eventually the interest rate will rise so high that the excess supply of money and the excess demand for nonmonetary assets are zero. r M d = P L( Y, r + π e ) movement along new money demand schedule. Where the LM function is LM r, Y; πe, P, M s, i m, W, risk of nonmonetary assets, risk of money, efficiency of payments technologies, liquidity of alternative assets 18

19 b. An increase in consumer optimism that increases desired consumption at each level of income and the real interest rate. Answer: The increase in desired consumption shifts the IS curve up, as shown below. This causes the real interest and output to rise. c. An increase in government purchases. Answer: The increase in government purchases shifts the IS curve up, with the same result as in part (b). 19

20 d. An increase in lump-sum taxes, with no change in government purchases (consider both the case in which Ricardian equivalence holds and the case in which it doesn t). Answer: If Ricardian equivalence holds, the increase in taxes has no effect. If Ricardian equivalence doesn t hold, the increase in taxes reduces consumption spending and the IS curve shifts down. Both the real interest rate and output decline. e. A scientific breakthrough increases the expected future MPK. Answer: An increase in the expected future marginal productivity of capital shifts the IS curve up, with the same result as in part (b). 20

Chapter 9. The IS-LM/AD-AS Model: A General Framework for Macroeconomic Analysis. 2008 Pearson Addison-Wesley. All rights reserved
 Chapter 9 The IS-LM/AD-AS Model: A General Framework for Macroeconomic Analysis Chapter Outline The FE Line: Equilibrium in the Labor Market The IS Curve: Equilibrium in the Goods Market The LM Curve:
Agenda. The IS-LM/AD-AS Model: A General Framework for Macroeconomic Analysis, Part 3. Disequilibrium in the AD-AS model
 Agenda The IS-LM/AD-AS Model: A General Framework for Macroeconomic Analysis, art 3 rice Adjustment and the Attainment of General Equilibrium 13-1 13-2 General equilibrium in the AD-AS model Disequilibrium
Agenda. Productivity, Output, and Employment, Part 1. The Production Function. The Production Function. The Production Function. The Demand for Labor
 Agenda Productivity, Output, and Employment, Part 1 3-1 3-2 A production function shows how businesses transform factors of production into output of goods and services through the applications of technology.
ECON 3312 Macroeconomics Exam 3 Fall 2014. Name MULTIPLE CHOICE. Choose the one alternative that best completes the statement or answers the question.
 ECON 3312 Macroeconomics Exam 3 Fall 2014 Name MULTIPLE CHOICE. Choose the one alternative that best completes the statement or answers the question. 1) Everything else held constant, an increase in net
Econ 303: Intermediate Macroeconomics I Dr. Sauer Sample Questions for Exam #3
 Econ 303: Intermediate Macroeconomics I Dr. Sauer Sample Questions for Exam #3 1. When firms experience unplanned inventory accumulation, they typically: A) build new plants. B) lay off workers and reduce
CH 10 - REVIEW QUESTIONS
 CH 10 - REVIEW QUESTIONS 1. The short-run aggregate supply curve is horizontal at: A) a level of output determined by aggregate demand. B) the natural level of output. C) the level of output at which the
For a closed economy, the national income identity is written as Y = F (K; L)
") A CLOSED ECONOMY IN THE LONG (MEDIUM) RUN For a closed economy, the national income identity is written as Y = C(Y T ) + I(r) + G the left hand side of the equation is the total supply of goods and services
A CLOSED ECONOMY IN THE LONG (MEDIUM) RUN For a closed economy, the national income identity is written as Y = C(Y T ) + I(r) + G the left hand side of the equation is the total supply of goods and services
BADM 527, Fall 2013. Midterm Exam 2. Multiple Choice: 3 points each. Answer the questions on the separate bubble sheet. NAME
 BADM 527, Fall 2013 Name: Midterm Exam 2 November 7, 2013 Multiple Choice: 3 points each. Answer the questions on the separate bubble sheet. NAME 1. According to classical theory, national income (Real
CHAPTER 7: AGGREGATE DEMAND AND AGGREGATE SUPPLY
 CHAPTER 7: AGGREGATE DEMAND AND AGGREGATE SUPPLY Learning goals of this chapter: What forces bring persistent and rapid expansion of real GDP? What causes inflation? Why do we have business cycles? How
Problem Set #4: Aggregate Supply and Aggregate Demand Econ 100B: Intermediate Macroeconomics
 roblem Set #4: Aggregate Supply and Aggregate Demand Econ 100B: Intermediate Macroeconomics 1) Explain the differences between demand-pull inflation and cost-push inflation. Demand-pull inflation results
7 AGGREGATE SUPPLY AND AGGREGATE DEMAND* Chapter. Key Concepts
 Chapter 7 AGGREGATE SUPPLY AND AGGREGATE DEMAND* Key Concepts Aggregate Supply The aggregate production function shows that the quantity of real GDP (Y ) supplied depends on the quantity of labor (L ),
Use the following to answer question 9: Exhibit: Keynesian Cross
 1. Leading economic indicators are: A) the most popular economic statistics. B) data that are used to construct the consumer price index and the unemployment rate. C) variables that tend to fluctuate in
Econ 102 Aggregate Supply and Demand
 Econ 102 ggregate Supply and Demand 1. s on previous homework assignments, turn in a news article together with your summary and explanation of why it is relevant to this week s topic, ggregate Supply
Pre-Test Chapter 15 ed17
 Pre-Test Chapter 15 ed17 Multiple Choice Questions 1. The extended AD-AS model: A. distinguishes between short-run and long-run aggregate demand. B. explains inflation but not recession. C. includes G
Answers to Text Questions and Problems in Chapter 11
 Answers to Text Questions and Problems in Chapter 11 Answers to Review Questions 1. The aggregate demand curve relates aggregate demand (equal to short-run equilibrium output) to inflation. As inflation
Chapter 4 Consumption, Saving, and Investment
 Chapter 4 Consumption, Saving, and Investment Multiple Choice Questions 1. Desired national saving equals (a) Y C d G. (b) C d + I d + G. (c) I d + G. (d) Y I d G. 2. With no inflation and a nominal interest
Pre-Test Chapter 10 ed17
 Pre-Test Chapter 10 ed17 Multiple Choice Questions 1. Refer to the above diagrams. Assuming a constant price level, an increase in aggregate expenditures from AE 1 to AE 2 would: A. move the economy from
2. With an MPS of.4, the MPC will be: A) 1.0 minus.4. B).4 minus 1.0. C) the reciprocal of the MPS. D).4. Answer: A
 1.0 minus.4. B).4 minus 1.0. C) the reciprocal of the MPS. D).4. Answer: A") 1. If Carol's disposable income increases from $1,200 to $1,700 and her level of saving increases from minus $100 to a plus $100, her marginal propensity to: A) save is three-fifths. B) consume is one-half.
1. If Carol's disposable income increases from $1,200 to $1,700 and her level of saving increases from minus $100 to a plus $100, her marginal propensity to: A) save is three-fifths. B) consume is one-half.
Chapter Outline. Chapter 11. Real-Wage Rigidity. Real-Wage Rigidity
 Chapter 11 Keynesianism: The Macroeconomics of Wage and Price Rigidity Chapter Outline Real-Wage Rigidity Price Stickiness Monetary and Fiscal Policy in the Keynesian 2008 Pearson Addison-Wesley. All rights
Chapter 6 Economic Growth
 Chapter 6 Economic Growth 1 The Basics of Economic Growth 1) The best definition for economic growth is A) a sustained expansion of production possibilities measured as the increase in real GDP over a
Study Questions for Chapter 9 (Answer Sheet)
") DEREE COLLEGE DEPARTMENT OF ECONOMICS EC 1101 PRINCIPLES OF ECONOMICS II FALL SEMESTER 2002 M-W-F 13:00-13:50 Dr. Andreas Kontoleon Office hours: Contact: [email protected] Wednesdays 15:00-17:00 Study
DEREE COLLEGE DEPARTMENT OF ECONOMICS EC 1101 PRINCIPLES OF ECONOMICS II FALL SEMESTER 2002 M-W-F 13:00-13:50 Dr. Andreas Kontoleon Office hours: Contact: [email protected] Wednesdays 15:00-17:00 Study
Aggregate Demand and Aggregate Supply Ing. Mansoor Maitah Ph.D. et Ph.D.
 Aggregate Demand and Aggregate Supply Ing. Mansoor Maitah Ph.D. et Ph.D. Aggregate Demand and Aggregate Supply Economic fluctuations, also called business cycles, are movements of GDP away from potential
Econ 202 Final Exam. Table 3-1 Labor Hours Needed to Make 1 Pound of: Meat Potatoes Farmer 8 2 Rancher 4 5
 Econ 202 Final Exam 1. If inflation expectations rise, the short-run Phillips curve shifts a. right, so that at any inflation rate unemployment is higher. b. left, so that at any inflation rate unemployment
A decline in the stock market, which makes consumers poorer, would cause the aggregate demand curve to shift to the left.
 Economics 304 Final Exam Fall 2000 PART I: TRUE/FALSE. Write 'T' if the statement is true and 'F' if the statement is false. (1.5 pts. each) A decline in the stock market, which makes consumers poorer,
Practice Problems on the Capital Market
 Practice Problems on the Capital Market 1- Define marginal product of capital (i.e., MPK). How can the MPK be shown graphically? The marginal product of capital (MPK) is the output produced per unit of
1. a. Interest-bearing checking accounts make holding money more attractive. This increases the demand for money.
 Macroeconomics ECON 2204 Prof. Murphy Problem Set 4 Answers Chapter 10 #1, 2, and 3 (on pages 308-309) 1. a. Interest-bearing checking accounts make holding money more attractive. This increases the demand
FISCAL POLICY* Chapter. Key Concepts
 Chapter 11 FISCAL POLICY* Key Concepts The Federal Budget The federal budget is an annual statement of the government s expenditures and tax revenues. Using the federal budget to achieve macroeconomic
In this chapter we learn the potential causes of fluctuations in national income. We focus on demand shocks other than supply shocks.
 Chapter 11: Applying IS-LM Model In this chapter we learn the potential causes of fluctuations in national income. We focus on demand shocks other than supply shocks. We also learn how the IS-LM model
Business Conditions Analysis Prof. Yamin Ahmad ECON 736
 Business Conditions Analysis Prof. Yamin Ahmad ECON 736 Sample Final Exam Name Id # Instructions: There are two parts to this midterm. Part A consists of multiple choice questions. Please mark the answers
MONEY, INTEREST, REAL GDP, AND THE PRICE LEVEL*
 Chapter 11 MONEY, INTEREST, REAL GDP, AND THE PRICE LEVEL* The Demand for Topic: Influences on Holding 1) The quantity of money that people choose to hold depends on which of the following? I. The price
Agenda. Business Cycles. What Is a Business Cycle? What Is a Business Cycle? What is a Business Cycle? Business Cycle Facts.
 Agenda What is a Business Cycle? Business Cycles.. 11-1 11-2 Business cycles are the short-run fluctuations in aggregate economic activity around its long-run growth path. Y Time 11-3 11-4 1 Components
Chapter 13. Aggregate Demand and Aggregate Supply Analysis
 Chapter 13. Aggregate Demand and Aggregate Supply Analysis Instructor: JINKOOK LEE Department of Economics / Texas A&M University ECON 203 502 Principles of Macroeconomics In the short run, real GDP and
Chapter 3 Productivity, Output, and Employment
 Chapter 3 Productivity, Output, and Employment Multiple Choice Questions 1. A mathematical expression relating the amount of output produced to quantities of capital and labor utilized is the (a) real
LECTURE NOTES ON MACROECONOMIC PRINCIPLES
 LECTURE NOTES ON MACROECONOMIC PRINCIPLES Peter Ireland Department of Economics Boston College [email protected] http://www2.bc.edu/peter-ireland/ec132.html Copyright (c) 2013 by Peter Ireland. Redistribution
Chapter 11. Keynesianism: The Macroeconomics of Wage and Price Rigidity. 2008 Pearson Addison-Wesley. All rights reserved
 Chapter 11 Keynesianism: The Macroeconomics of Wage and Price Rigidity Chapter Outline Real-Wage Rigidity Price Stickiness Monetary and Fiscal Policy in the Keynesian Model The Keynesian Theory of Business
1. Explain what causes the liquidity preference money (LM) curve to shift and why.
 curve to shift and why.") Chapter 22. IS-LM in Action C H A P T E R O B J E C T I V E S By the end of this chapter, students should be able to: 1. Explain what causes the liquidity preference money (LM) curve to shift and why.
Chapter 22. IS-LM in Action C H A P T E R O B J E C T I V E S By the end of this chapter, students should be able to: 1. Explain what causes the liquidity preference money (LM) curve to shift and why.
Pre-Test Chapter 25 ed17
 Pre-Test Chapter 25 ed17 Multiple Choice Questions 1. Refer to the above graph. An increase in the quantity of labor demanded (as distinct from an increase in demand) is shown by the: A. shift from labor
10/7/2013. Chapter 9: Introduction to Economic Fluctuations. Facts about the business cycle. Unemployment. Okun s Law Y Y
 Facts about the business cycle Chapter 9: GD growth averages 3 3.5 percent per year over the long run with large fluctuations in the short run. Consumption and investment fluctuate with GD, but consumption
Answer: C Learning Objective: Money supply Level of Learning: Knowledge Type: Word Problem Source: Unique
 1.The aggregate demand curve shows the relationship between inflation and: A) the nominal interest rate. D) the exchange rate. B) the real interest rate. E) short-run equilibrium output. C) the unemployment
Ch.6 Aggregate Supply, Wages, Prices, and Unemployment
 1 Econ 302 Intermediate Macroeconomics Chul-Woo Kwon Ch.6 Aggregate Supply, Wages, rices, and Unemployment I. Introduction A. The dynamic changes of and the price adjustment B. Link between the price change
Extra Problems #3. ECON 410.502 Macroeconomic Theory Spring 2010 Instructor: Guangyi Ma. Notice:
 ECON 410.502 Macroeconomic Theory Spring 2010 Instructor: Guangyi Ma Extra Problems #3 Notice: (1) There are 25 multiple-choice problems covering Chapter 6, 9, 10, 11. These problems are not homework and
CHAPTER 9 Building the Aggregate Expenditures Model
 CHAPTER 9 Building the Aggregate Expenditures Model Topic Question numbers 1. Consumption function/apc/mpc 1-42 2. Saving function/aps/mps 43-56 3. Shifts in consumption and saving functions 57-72 4 Graphs/tables:
I. Introduction to Aggregate Demand/Aggregate Supply Model
 University of California-Davis Economics 1B-Intro to Macro Handout 8 TA: Jason Lee Email: [email protected] I. Introduction to Aggregate Demand/Aggregate Supply Model In this chapter we develop a model
Practiced Questions. Chapter 20
 Practiced Questions Chapter 20 1. The model of aggregate demand and aggregate supply a. is different from the model of supply and demand for a particular market, in that we cannot focus on the substitution
13 EXPENDITURE MULTIPLIERS: THE KEYNESIAN MODEL* Chapter. Key Concepts
 Chapter 3 EXPENDITURE MULTIPLIERS: THE KEYNESIAN MODEL* Key Concepts Fixed Prices and Expenditure Plans In the very short run, firms do not change their prices and they sell the amount that is demanded.
Macroeconomics, 6e (Abel et al.) Chapter 4 Consumption, Saving, and Investment. 4.1 Consumption and Saving
 Chapter 4 Consumption, Saving, and Investment. 4.1 Consumption and Saving") Macroeconomics, 6e (Abel et al.) Chapter 4 Consumption, Saving, and Investment 4.1 Consumption and Saving 1) Desired national saving equals A) Y - C d - G. B) C d + I d + G. C) I d + G. D) Y - I d - G.
Macroeconomics, 6e (Abel et al.) Chapter 4 Consumption, Saving, and Investment 4.1 Consumption and Saving 1) Desired national saving equals A) Y - C d - G. B) C d + I d + G. C) I d + G. D) Y - I d - G.
Chapter 22 The Cost of Production Extra Multiple Choice Questions for Review
 Chapter 22 The Cost of Production Extra Multiple Choice Questions for Review 1. Implicit costs are: A) equal to total fixed costs. B) comprised entirely of variable costs. C) "payments" for self-employed
The IS-LM Model Ing. Mansoor Maitah Ph.D.
 The IS-LM Model Ing. Mansoor Maitah Ph.D. Constructing the Keynesian Cross Equilibrium is at the point where Y = C + I + G. If firms were producing at Y 1 then Y > E Because actual expenditure exceeds
Microeconomics Instructor Miller Practice Problems Labor Market
 Microeconomics Instructor Miller Practice Problems Labor Market 1. What is a factor market? A) It is a market where financial instruments are traded. B) It is a market where stocks and bonds are traded.
MULTIPLE CHOICE. Choose the one alternative that best completes the statement or answers the question.
 Chapter 11 Perfect Competition - Sample Questions MULTIPLE CHOICE. Choose the one alternative that best completes the statement or answers the question. 1) Perfect competition is an industry with A) a
ANSWERS TO END-OF-CHAPTER QUESTIONS
 ANSWERS TO END-OF-CHAPTER QUESTIONS 9-1 Explain what relationships are shown by (a) the consumption schedule, (b) the saving schedule, (c) the investment-demand curve, and (d) the investment schedule.
Long run v.s. short run. Introduction. Aggregate Demand and Aggregate Supply. In this chapter, look for the answers to these questions:
 33 Aggregate Demand and Aggregate Supply R I N C I L E S O F ECONOMICS FOURTH EDITION N. GREGOR MANKIW Long run v.s. short run Long run growth: what determines long-run output (and the related employment
Lecture 9: Keynesian Models
 Lecture 9: Keynesian Models Professor Eric Sims University of Notre Dame Fall 2009 Sims (Notre Dame) Keynesian Fall 2009 1 / 23 Keynesian Models The de ning features of RBC models are: Markets clear Money
MULTIPLE CHOICE. Choose the one alternative that best completes the statement or answers the question.
 Econ 111 Summer 2007 Final Exam Name MULTIPLE CHOICE. Choose the one alternative that best completes the statement or answers the question. 1) The classical dichotomy allows us to explore economic growth
Practice Problems on Current Account
 Practice Problems on Current Account 1- List de categories of credit items and debit items that appear in a country s current account. What is the current account balance? What is the relationship between
Problem Set 5. a) In what sense is money neutral? Why is monetary policy useful if money is neutral?
 In what sense is money neutral? Why is monetary policy useful if money is neutral?") 1 Problem Set 5 Question 2 a) In what sense is money neutral? Why is monetary policy useful if money is neutral? In Problem Set 4, Question 2-Part (e), we already analysed the effect of an expansionary
1 Problem Set 5 Question 2 a) In what sense is money neutral? Why is monetary policy useful if money is neutral? In Problem Set 4, Question 2-Part (e), we already analysed the effect of an expansionary
The Aggregate Demand- Aggregate Supply (AD-AS) Model
 Model") The AD-AS Model The Aggregate Demand- Aggregate Supply (AD-AS) Model Chapter 9 The AD-AS Model addresses two deficiencies of the AE Model: No explicit modeling of aggregate supply. Fixed price level. 2
The AD-AS Model The Aggregate Demand- Aggregate Supply (AD-AS) Model Chapter 9 The AD-AS Model addresses two deficiencies of the AE Model: No explicit modeling of aggregate supply. Fixed price level. 2
Keynesian Macroeconomic Theory
 2 Keynesian Macroeconomic Theory 2.1. The Keynesian Consumption Function 2.2. The Complete Keynesian Model 2.3. The Keynesian-Cross Model 2.4. The IS-LM Model 2.5. The Keynesian AD-AS Model 2.6. Conclusion
Effects of Inflation Unanticipated Inflation in the Labor Market
 Effects of Inflation Unanticipated Inflation in the Labor Market Unanticipated inflation has two main consequences in the labor market: Redistribution of income Departure from full employment Effects of
Econ 202 Final Exam. Douglas, Spring 2006 PLEDGE: I have neither given nor received unauthorized help on this exam.
 , Spring 2006 PLEDGE: I have neither given nor received unauthorized help on this exam. SIGNED: PRINT NAME: Econ 202 Final Exam 1. When the government spends more, the initial effect is that a. aggregate
INTRODUCTION AGGREGATE DEMAND MACRO EQUILIBRIUM MACRO EQUILIBRIUM THE DESIRED ADJUSTMENT THE DESIRED ADJUSTMENT
 Chapter 9 AGGREGATE DEMAND INTRODUCTION The Great Depression was a springboard for the Keynesian approach to economic policy. Keynes asked: What are the components of aggregate demand? What determines
Agenda. The IS LM Model, Part 2. The Demand for Money. The Demand for Money. The Demand for Money. Asset Market Equilibrium.
 Agenda The IS LM Model, Part 2 Asset Market Equilibrium The LM Curve 13-1 13-2 The demand for money is the quantity of money people want to hold in their portfolios. The demand for money depends on expected
THE OPEN AGGREGATE DEMAND AGGREGATE SUPPLY MODEL.
 THE OPEN AGGREGATE DEMAND AGGREGATE SUPPLY MODEL. Introduction. This model represents the workings of the economy as the interaction between two curves: - The AD curve, showing the relationship between
8. Average product reaches a maximum when labor equals A) 100 B) 200 C) 300 D) 400
 100 B) 200 C) 300 D) 400") Ch. 6 1. The production function represents A) the quantity of inputs necessary to produce a given level of output. B) the various recipes for producing a given level of output. C) the minimum amounts
Ch. 6 1. The production function represents A) the quantity of inputs necessary to produce a given level of output. B) the various recipes for producing a given level of output. C) the minimum amounts
MULTIPLE CHOICE. Choose the one alternative that best completes the statement or answers the question.
 Suvey of Macroeconomics, MBA 641 Fall 2006, Final Exam Name MULTIPLE CHOICE. Choose the one alternative that best completes the statement or answers the question. 1) Modern macroeconomics emerged from
Chapter 04 Firm Production, Cost, and Revenue
 Chapter 04 Firm Production, Cost, and Revenue Multiple Choice Questions 1. A key assumption about the way firms behave is that they a. Minimize costs B. Maximize profit c. Maximize market share d. Maximize
Demand, Supply, and Market Equilibrium
 3 Demand, Supply, and Market Equilibrium The price of vanilla is bouncing. A kilogram (2.2 pounds) of vanilla beans sold for $50 in 2000, but by 2003 the price had risen to $500 per kilogram. The price
Government Budget and Fiscal Policy CHAPTER
 Government Budget and Fiscal Policy 11 CHAPTER The National Budget The national budget is the annual statement of the government s expenditures and tax revenues. Fiscal policy is the use of the federal
4. Answer c. The index of nominal wages for 1996 is the nominal wage in 1996 expressed as a percentage of the nominal wage in the base year.
 Answers To Chapter 2 Review Questions 1. Answer a. To be classified as in the labor force, an individual must be employed, actively seeking work, or waiting to be recalled from a layoff. However, those
MULTIPLE CHOICE. Choose the one alternative that best completes the statement or answers the question.
 MULTIPLE CHOICE. Choose the one alternative that best completes the statement or answers the question. 1) Firms that survive in the long run are usually those that A) remain small. B) strive for the largest
1) Explain why each of the following statements is true. Discuss the impact of monetary and fiscal policy in each of these special cases:
 Explain why each of the following statements is true. Discuss the impact of monetary and fiscal policy in each of these special cases:") 1) Explain why each of the following statements is true. Discuss the impact of monetary and fiscal policy in each of these special cases: a) If investment does not depend on the interest rate, the IS curve
1) Explain why each of the following statements is true. Discuss the impact of monetary and fiscal policy in each of these special cases: a) If investment does not depend on the interest rate, the IS curve
The Short-Run Macro Model. The Short-Run Macro Model. The Short-Run Macro Model
 The Short-Run Macro Model In the short run, spending depends on income, and income depends on spending. The Short-Run Macro Model Short-Run Macro Model A macroeconomic model that explains how changes in
Introduction to Macroeconomics 1012 Final Exam Spring 2013 Instructor: Elsie Sawatzky
 Introduction to Macroeconomics 1012 Final Exam Spring 2013 Instructor: Elsie Sawatzky Name Time: 2 hours Marks: 80 Multiple choice questions 1 mark each and a choice of 2 out of 3 short answer question
12.1 Introduction. 12.2 The MP Curve: Monetary Policy and the Interest Rates 1/24/2013. Monetary Policy and the Phillips Curve
 Chapter 12 Monetary Policy and the Phillips Curve By Charles I. Jones Media Slides Created By Dave Brown Penn State University The short-run model summary: Through the MP curve the nominal interest rate
POTENTIAL OUTPUT and LONG RUN AGGREGATE SUPPLY
 POTENTIAL OUTPUT and LONG RUN AGGREGATE SUPPLY Aggregate Supply represents the ability of an economy to produce goods and services. In the Long-run this ability to produce is based on the level of production
Employment and Pricing of Inputs
 Employment and Pricing of Inputs Previously we studied the factors that determine the output and price of goods. In chapters 16 and 17, we will focus on the factors that determine the employment level
Chapter 16 Output and the Exchange Rate in the Short Run
 Chapter 16 Output and the Exchange Rate in the Short Run Prepared by Iordanis Petsas To Accompany International Economics: Theory and Policy, Sixth Edition by Paul R. Krugman and Maurice Obstfeld Chapter
Demand, Supply and Elasticity
 Demand, Supply and Elasticity CHAPTER 2 OUTLINE 2.1 Demand and Supply Definitions, Determinants and Disturbances 2.2 The Market Mechanism 2.3 Changes in Market Equilibrium 2.4 Elasticities of Supply and
FISCAL POLICY* Chapter. Key Concepts
 Chapter 15 FISCAL POLICY* Key Concepts The Federal Budget The federal budget is an annual statement of the government s expenditures and tax revenues. Using the federal budget to achieve macroeconomic
chapter: Aggregate Demand and Aggregate Supply Krugman/Wells 2009 Worth Publishers 1 of 58
 chapter: 12 >> Aggregate Demand and Aggregate Supply Krugman/Wells 2009 Worth Publishers 1 of 58 WHAT YOU WILL LEARN IN THIS CHAPTER How the aggregate demand curve illustrates the relationship between
Chapter 12: Aggregate Supply and Phillips Curve
 Chapter 12: Aggregate Supply and Phillips Curve In this chapter we explain the position and slope of the short run aggregate supply (SRAS) curve. SRAS curve can also be relabeled as Phillips curve. A basic
7 AGGREGATE SUPPLY AND AGGREGATE DEMAND* * Chapter Key Ideas. Outline
 C h a p t e r 7 AGGREGATE SUPPLY AND AGGREGATE DEMAND* * Chapter Key Ideas Outline Production and Prices A. What forces bring persistent and rapid expansion of real GDP? B. What leads to inflation? C.
17. Suppose demand is given by Q d = 400 15P + I, where Q d is quantity demanded, P is. I = 100, equilibrium quantity is A) 15 B) 20 C) 25 D) 30
 15 B) 20 C) 25 D) 30") Ch. 2 1. A relationship that shows the quantity of goods that consumers are willing to buy at different prices is the A) elasticity B) market demand curve C) market supply curve D) market equilibrium 2.
Ch. 2 1. A relationship that shows the quantity of goods that consumers are willing to buy at different prices is the A) elasticity B) market demand curve C) market supply curve D) market equilibrium 2.
Homework #5: Answers. b. How can land rents as well as total wages be shown in such a diagram?
 Homework #5: Answers Text questions, hapter 6, problems 1-4. Note that in all of these questions, the convention in the text, whereby production of food uses land and labor, and clothing uses capital and
Aggregate Demand, Aggregate Supply, and the Self-Correcting Economy
 Aggregate Demand, Aggregate Supply, and the Self-Correcting Economy The Role of Aggregate Demand & Supply Endogenizing the Price Level Inflation Deflation Price Stability The Aggregate Demand Curve Relates
Chapters 7 and 8 Solow Growth Model Basics
 Chapters 7 and 8 Solow Growth Model Basics The Solow growth model breaks the growth of economies down into basics. It starts with our production function Y = F (K, L) and puts in per-worker terms. Y L
SHORT-RUN FLUCTUATIONS. David Romer. University of California, Berkeley. First version: August 1999 This revision: January 2012
 SHORT-RUN FLUCTUATIONS David Romer University of California, Berkeley First version: August 1999 This revision: January 2012 Copyright 2012 by David Romer CONTENTS Preface vi I The IS-MP Model 1 I-1 Monetary
GDP: The market value of final goods and services, newly produced WITHIN a nation during a fixed period.
 GDP: The market value of final goods and services, newly produced WITHIN a nation during a fixed period. Value added: Value of output (market value) purchased inputs (e.g. intermediate goods) GDP is a
Problem Set #5-Key. Economics 305-Intermediate Microeconomic Theory
 Problem Set #5-Key Sonoma State University Economics 305-Intermediate Microeconomic Theory Dr Cuellar (1) Suppose that you are paying your for your own education and that your college tuition is $200 per
The Circular Flow of Income and Expenditure
 The Circular Flow of Income and Expenditure Imports HOUSEHOLDS Savings Taxation Govt Exp OTHER ECONOMIES GOVERNMENT FINANCIAL INSTITUTIONS Factor Incomes Taxation Govt Exp Consumer Exp Exports FIRMS Capital
Refer to Figure 17-1
 Chapter 17 1. Inflation can be measured by the a. change in the consumer price index. b. percentage change in the consumer price index. c. percentage change in the price of a specific commodity. d. change
Supply and Demand in the Market for Money: The Liquidity Preference Framework
 APPENDIX 3 TO CHAPTER 4 Supply and Demand in the arket for oney: The Liquidity Preference Framework Whereas the loanable funds framework determines the equilibrium interest rate using the supply of and
Chapter 12 Unemployment and Inflation
 Chapter 12 Unemployment and Inflation Multiple Choice Questions 1. The origin of the idea of a trade-off between inflation and unemployment was a 1958 article by (a) A.W. Phillips. (b) Edmund Phelps. (c)
Pre Test Chapter 3. 8.. DVD players and DVDs are: A. complementary goods. B. substitute goods. C. independent goods. D. inferior goods.
 1. Graphically, the market demand curve is: A. steeper than any individual demand curve that is part of it. B. greater than the sum of the individual demand curves. C. the horizontal sum of individual
Aggregate Supply and Aggregate Demand
 26 Aggregate Supply and Aggregate Demand Learning Objectives Explain what determines aggregate supply Explain what determines aggregate demand Explain what determines real GDP and the price level and how
MONEY, INTEREST, REAL GDP, AND THE PRICE LEVEL*
 Chapter 11 MONEY, INTEREST, REAL GDP, AND THE PRICE LEVEL* Key Concepts The Demand for Money Four factors influence the demand for money: The price level An increase in the price level increases the nominal
Consumption, Saving, and Investment, Part 1
 Agenda Consumption, Saving, and, Part 1 Determinants of National Saving 5-1 5-2 Consumption and saving decisions : Desired consumption is the consumption amount desired by households Desired national saving
Monopoly and Monopsony Labor Market Behavior
 Monopoly and Monopsony abor Market Behavior 1 Introduction For the purposes of this handout, let s assume that firms operate in just two markets: the market for their product where they are a seller) and
Assignment #3. ECON 410.502 Macroeconomic Theory Spring 2010 Instructor: Guangyi Ma. Notice:
 ECON 410.502 Macroeconomic Theory Spring 2010 Instructor: Guangyi Ma Assignment #3 Notice: (1) There are 25 multiple-choice problems and 2 analytic (short-answer) problems. This assignment is due on March
The level of price and inflation Real GDP: the values of goods and services measured using a constant set of prices
 Chapter 2: Key Macroeconomics Variables ECON2 (Spring 20) 2 & 4.3.20 (Tutorial ) National income accounting Gross domestic product (GDP): The market value of all final goods and services produced within