AP STATISTICS 2010 SCORING GUIDELINES
|
|
|
- Janice Bishop
- 9 years ago
- Views:
Transcription
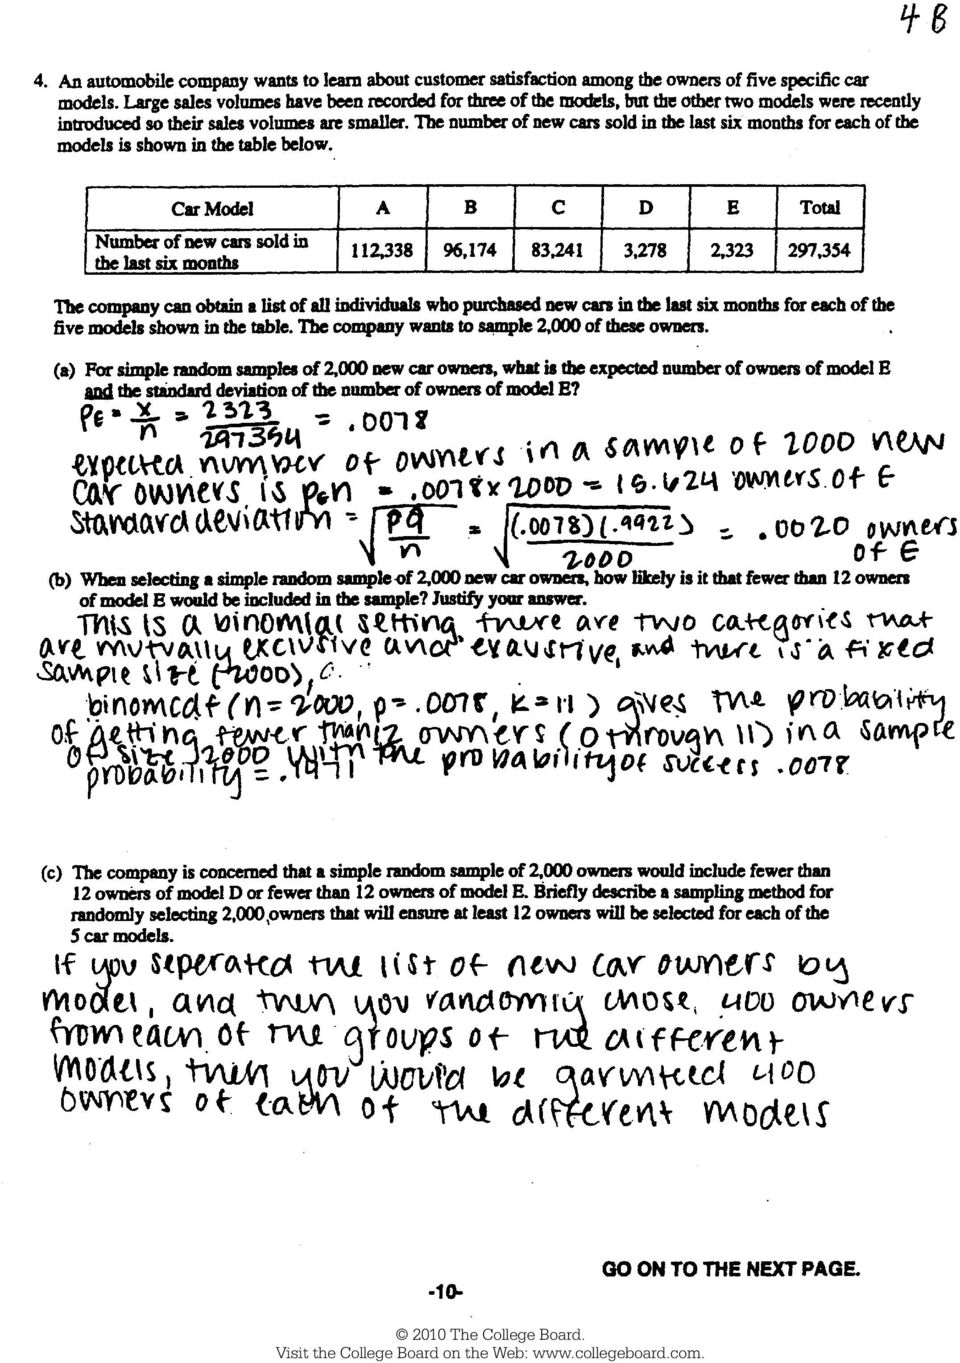
1 2010 SCORING GUIDELINES Question 4 Intent of Question The primary goals of this question were to (1) assess students ability to calculate an expected value and a standard deviation; (2) recognize the applicability of a binomial distribution and perform a relevant binomial probability calculation (or recognize the applicability of a normal approximation and use it to perform a relevant probability calculation); (3) suggest an appropriate sampling method to achieve a given goal. Solution Part (a): Because the population size is so large compared with the sample size ( 297, times the 2,000 sample size), far greater than the usual standard of 10 or 20 times larger, we can use the binomial probability distribution even though this is technically sampling without replacement. The parameters of this binomial distribution are the sample size, n, which has a value of n = 2,000, and the proportion 2,323 of new car buyers who bought model E, p, which has a value of p = The expected 297,354 value of the number of model E buyers in a simple random sample of 2,000 is therefore = 2, n p (1 p ) = 2, , so the n p The variance is ( ) standard deviation is Part (b): For the reason given in part (a), the binomial distribution with n = 2,000 and p can be used here. The probability that the sample would contain fewer than 12 owners of model E is calculated 11 2,000 x 2,000 x from the binomial distribution to be ( ) ( ) This probability is x= 0 x small enough that the result (fewer than 12 owners of model E in the sample) is not likely, but this probability is also not small enough to consider the result very unlikely. This binomial probability can also be evaluated using a normal approximation. This is reasonable because n p = ( 2,000) ( ) = 15.6 is larger than 10 and n( 1 p ) = ( 2,000) ( ) = 1,984.4 is much larger than 10. Using the mean and standard deviation from part (a) gives PX ( 11) P Z< = PZ ( < 0.92) = Part (c): Stratified random sampling addresses the concern about the number of owners for models D and E. By stratifying on car model and then taking a simple random sample of at least 12 owners from the population of owners for each model, the company can ensure that at least 12 owners are included in the sample for each model while maintaining a total sample size of 2,000. For example, the company could select simple random samples of sizes 755, 647, 560, 22 and 16 for models A, B, C, D and E, respectively, to make the sample size approximately proportional to the size of the owner population for each model.
, far greater than the usual standard of 10 or 20 times larger, we can use the binomial probability distribution even though this is technically sampling without")
2 2010 SCORING GUIDELINES Question 4 (continued) Scoring Parts (a), (b) and (c) are each scored as essentially correct (E), partially correct (P) or incorrect (I). Part (a) is scored as follows: Essentially correct (E) if the response correctly addresses the following two components: Calculation of the expected number of owners, showing a proper method for the calculation and providing the correct numerical value Calculation of the standard deviation for the number of owners, indicating recognition of the appropriate binomial distribution and providing the calculation and the correct numerical value Partially correct (P) if the response contains only one of the two components listed above OR displays correct formulas for both the expected value and the standard deviation of a binomial distribution but fails to show both of the correct numerical values. Incorrect (I) if the response provides only numerical values without showing how they were calculated. Part (b) is scored as follows: Essentially correct (E) if the student does any of the following: Recognizes the applicability of the binomial distribution, identifies the correct parameters, sets up the relevant probability calculation, and completes the calculation correctly Uses a normal probability approximation, identifying the relevant mean and standard deviation, and shows a correct calculation of the probability Provides an argument based on an appropriate z-score, or the number of standard deviations away from the mean, with a reasonable conclusion about likeliness Partially correct (P) if the student does any of the following: Recognizes the applicability of the binomial distribution and identifies the correct parameters BUT sets up an incorrect cumulative binomial probability calculation Recognizes the applicability of the binomial distribution and shows the calculation correctly BUT does not identify the correct parameters in either part (a) or part (b) Recognizes the applicability of the normal approximation and identifies the correct parameters BUT incorrectly calculates the z-score or probability Incorrect (I) otherwise. Notes If the parameter values were properly identified in part (a), they do not have to be identified in part (b). If the response shows a correct calculation of the probability, no comment about likeliness is necessary. But such a comment is necessary if the response contains only a z-score without a probability or discusses standard deviations from the mean. With the normal calculation, it is acceptable for the response to show the probability that the normal value is below 11 or 11.5 or 12.
 if the response contains only one of the two components listed above OR displays correct formulas for both the expected value and the")
3 2010 SCORING GUIDELINES Question 4 (continued) Part (c) is scored as follows: Essentially correct (E) if the response describes an appropriate sampling method (e.g., stratified random sampling) that ensures all of the following: Total sample size of 2,000 At least 12 owners for each of the five car models Random selection of owners Partially correct (P) if the response mentions stratified random sampling but gives a weak description, or no description, of how to implement the procedure OR describes another appropriate sampling method but includes only two of the three components listed above. Incorrect (I) otherwise. 4 Complete Response All three parts essentially correct 3 Substantial Response 2 Developing Response Two parts essentially correct and one part partially correct OR OR Two parts essentially correct and one part incorrect One part essentially correct and one or two parts partially correct Three parts partially correct 1 Minimal Response OR One part essentially correct and two parts incorrect Two parts partially correct and one part incorrect

4

5
6
7 2010 SCORING COMMENTARY Question 4 Overview The primary goals of this question were to (1) assess students ability to calculate an expected value and a standard deviation; (2) recognize the applicability of a binomial distribution and perform a relevant binomial probability calculation (or recognize the applicability of a normal approximation and use it to perform a relevant probability calculation); (3) suggest an appropriate sampling method to achieve a given goal. Sample: 4A Score: 4 This is an essentially complete response that clearly demonstrates an understanding of the calculation of an expected value and a standard deviation, the use of z-scores and the calculation of a related probability, and the concept of stratified random sampling. The response to part (a) provides correct formulas and correct numerical values for the expected value and the standard deviation of the number of owners of car model E who would be included in a simple random sample of 2,000 owners from the population of 297,354 new car owners. In part (b) the normal approximation to the binomial distribution is used to obtain the probability of observing fewer than 12 owners of car model E in a simple random sample of 2,000 new car owners. A correct formula is given for the z-score, and it is correctly evaluated. This response uses both a sketch and standard probability notation to clearly indicate that the probability of fewer than 12 owners should be calculated, and the probability is correctly evaluated. The response to part (c) adequately describes an appropriate stratified random sampling procedure. It indicates that a separate sample will be randomly selected from the population of owners for each of the five car models, and it specifies a set of sample sizes that all exceed 12 and yield a total sample size of 2,000. The communication in this part of the response could have been improved by clearly indentifying the strata and indicating what should be sampled from each stratum for example, randomly selecting 756 car owners from the population of new car owners who purchased car model A in the past six months. A statement justifying the use of the normal approximation to the binomial distribution would have strengthened the communication in part (b). Although communication weaknesses were a concern, all three parts were scored as essentially correct, and the response earned a score of 4. Sample: 4B Score: 3 This is a substantial response that is very well written. A correct procedure for computing the expected value is described in part (a), and the correct numerical value is calculated. This response presents the formula for a standard deviation of a sample proportion instead of the standard deviation of the number of owners of car model E who would be included in a simple random sample of 2,000 owners. This was a common mistake. The response to part (a) was scored as partially correct. Using the binomial distribution with parameters n = 2,000 and p = , the probability of obtaining fewer than 12 owners of car model E in a random sample of 2,000 owners is correctly calculated in part (b). This response shows additional understanding by providing some justification for using the binomial distribution, although it does not address the issue of sampling without replacement. The response to part (c) describes an appropriate stratified random sampling procedure. Car owners are grouped with respect to the car model they own, and a random sample of 400 owners is selected from the car owners in each group. This ensures that the sample will include exactly 2,000 new car owners with 400 owners for each of the five car models. Parts (b) and (c) were both scored as essentially correct. With one part partially correct and two parts essentially correct, the response earned a score of 3.

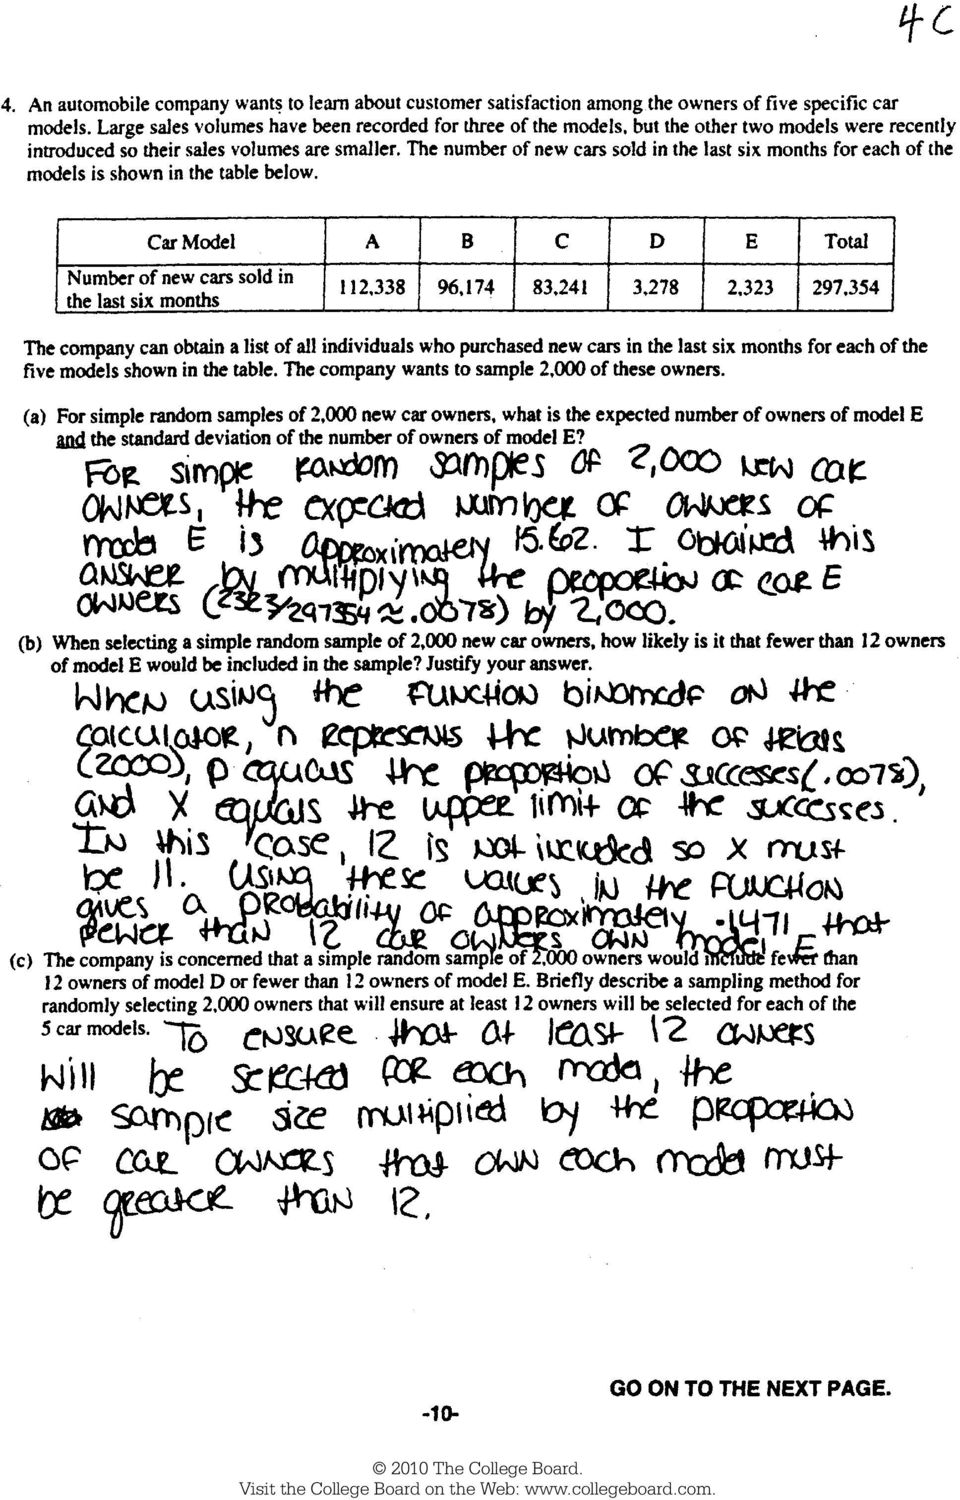
8 2010 SCORING COMMENTARY Question 4 (continued) Sample: 4C Score: 2 This is an example of a developing response that clearly demonstrates understanding of the calculation of an expected value and the calculation of a related probability. The response to part (a) provides a good description of a method for calculating the expected number of owners of car model E who would be included in a simple random sample of 2,000 owners from the population of 297,354 new car owners, and it also provides the correct numerical value. Because it fails to address the standard deviation, it was scored as partially correct. The response to part (b) is very well expressed. It identifies the sample size and the relevant population proportion and clearly describes the use of the binomial distribution to compute the probability of obtaining fewer than 12 owners of car model E in a random sample of 2,000 owners. The correct value of the probability is obtained, and this part was scored as essentially correct. The response to part (c) was scored as incorrect. It says something about multiplying the total sample size by the proportion of car owners that own each model, but it does not link those values to sample sizes used in taking random samples from the populations of owners for the five car models. This response neither adequately describes a sampling procedure for obtaining at least 12 owners for each car model, nor does it address random selection. Because one part was scored as essentially correct, one part was scored as partially correct and one part was scored as incorrect, this response earned a score of 2.

Statistics 2014 Scoring Guidelines
 AP Statistics 2014 Scoring Guidelines College Board, Advanced Placement Program, AP, AP Central, and the acorn logo are registered trademarks of the College Board. AP Central is the official online home
Normal distribution. ) 2 /2σ. 2π σ
 2 /2σ. 2π σ") Normal distribution The normal distribution is the most widely known and used of all distributions. Because the normal distribution approximates many natural phenomena so well, it has developed into a
Normal distribution The normal distribution is the most widely known and used of all distributions. Because the normal distribution approximates many natural phenomena so well, it has developed into a
Introduction to the Practice of Statistics Fifth Edition Moore, McCabe
 Introduction to the Practice of Statistics Fifth Edition Moore, McCabe Section 5.1 Homework Answers 5.7 In the proofreading setting if Exercise 5.3, what is the smallest number of misses m with P(X m)
The Binomial Probability Distribution
 The Binomial Probability Distribution MATH 130, Elements of Statistics I J. Robert Buchanan Department of Mathematics Fall 2015 Objectives After this lesson we will be able to: determine whether a probability
Binomial Distribution Problems. Binomial Distribution SOLUTIONS. Poisson Distribution Problems
 1 Binomial Distribution Problems (1) A company owns 400 laptops. Each laptop has an 8% probability of not working. You randomly select 20 laptops for your salespeople. (a) What is the likelihood that 5
Normal Distribution as an Approximation to the Binomial Distribution
 Chapter 1 Student Lecture Notes 1-1 Normal Distribution as an Approximation to the Binomial Distribution : Goals ONE TWO THREE 2 Review Binomial Probability Distribution applies to a discrete random variable
Stat 515 Midterm Examination II April 6, 2010 (9:30 a.m. - 10:45 a.m.)
") Name: Stat 515 Midterm Examination II April 6, 2010 (9:30 a.m. - 10:45 a.m.) The total score is 100 points. Instructions: There are six questions. Each one is worth 20 points. TA will grade the best five
Name: Stat 515 Midterm Examination II April 6, 2010 (9:30 a.m. - 10:45 a.m.) The total score is 100 points. Instructions: There are six questions. Each one is worth 20 points. TA will grade the best five
Normal and Binomial. Distributions
 Normal and Binomial Distributions Library, Teaching and Learning 14 By now, you know about averages means in particular and are familiar with words like data, standard deviation, variance, probability,
M 1313 Review Test 4 1
 M 1313 Review Test 4 1 Review for test 4: 1. Let E and F be two events of an experiment, P (E) =. 3 and P (F) =. 2, and P (E F) =.35. Find the following probabilities: a. P(E F) b. P(E c F) c. P (E F)
AP Statistics Solutions to Packet 2
 AP Statistics Solutions to Packet 2 The Normal Distributions Density Curves and the Normal Distribution Standard Normal Calculations HW #9 1, 2, 4, 6-8 2.1 DENSITY CURVES (a) Sketch a density curve that
5/31/2013. 6.1 Normal Distributions. Normal Distributions. Chapter 6. Distribution. The Normal Distribution. Outline. Objectives.
 The Normal Distribution C H 6A P T E R The Normal Distribution Outline 6 1 6 2 Applications of the Normal Distribution 6 3 The Central Limit Theorem 6 4 The Normal Approximation to the Binomial Distribution
Section 6.1 Discrete Random variables Probability Distribution
 Section 6.1 Discrete Random variables Probability Distribution Definitions a) Random variable is a variable whose values are determined by chance. b) Discrete Probability distribution consists of the values
Introduction to Hypothesis Testing. Hypothesis Testing. Step 1: State the Hypotheses
 Introduction to Hypothesis Testing 1 Hypothesis Testing A hypothesis test is a statistical procedure that uses sample data to evaluate a hypothesis about a population Hypothesis is stated in terms of the
6 3 The Standard Normal Distribution
 290 Chapter 6 The Normal Distribution Figure 6 5 Areas Under a Normal Distribution Curve 34.13% 34.13% 2.28% 13.59% 13.59% 2.28% 3 2 1 + 1 + 2 + 3 About 68% About 95% About 99.7% 6 3 The Distribution Since
The normal approximation to the binomial
 The normal approximation to the binomial The binomial probability function is not useful for calculating probabilities when the number of trials n is large, as it involves multiplying a potentially very
Chapter 15 Binomial Distribution Properties
 Chapter 15 Binomial Distribution Properties Two possible outcomes (success and failure) A fixed number of experiments (trials) The probability of success, denoted by p, is the same on every trial The trials
6.2 Normal distribution. Standard Normal Distribution:
 6.2 Normal distribution Slide Heights of Adult Men and Women Slide 2 Area= Mean = µ Standard Deviation = σ Donation: X ~ N(µ,σ 2 ) Standard Normal Distribution: Slide 3 Slide 4 a normal probability distribution
z-scores AND THE NORMAL CURVE MODEL
 z-scores AND THE NORMAL CURVE MODEL 1 Understanding z-scores 2 z-scores A z-score is a location on the distribution. A z- score also automatically communicates the raw score s distance from the mean A
EXAM #1 (Example) Instructor: Ela Jackiewicz. Relax and good luck!
 Instructor: Ela Jackiewicz. Relax and good luck!") STP 231 EXAM #1 (Example) Instructor: Ela Jackiewicz Honor Statement: I have neither given nor received information regarding this exam, and I will not do so until all exams have been graded and returned.
STP 231 EXAM #1 (Example) Instructor: Ela Jackiewicz Honor Statement: I have neither given nor received information regarding this exam, and I will not do so until all exams have been graded and returned.
MULTIPLE CHOICE. Choose the one alternative that best completes the statement or answers the question.
 STATISTICS/GRACEY PRACTICE TEST/EXAM 2 MULTIPLE CHOICE. Choose the one alternative that best completes the statement or answers the question. Identify the given random variable as being discrete or continuous.
Chapter 5: Normal Probability Distributions - Solutions
 Chapter 5: Normal Probability Distributions - Solutions Note: All areas and z-scores are approximate. Your answers may vary slightly. 5.2 Normal Distributions: Finding Probabilities If you are given that
table to see that the probability is 0.8413. (b) What is the probability that x is between 16 and 60? The z-scores for 16 and 60 are: 60 38 = 1.
 What is the probability that x is between 16 and 60? The z-scores for 16 and 60 are: 60 38 = 1.") Review Problems for Exam 3 Math 1040 1 1. Find the probability that a standard normal random variable is less than 2.37. Looking up 2.37 on the normal table, we see that the probability is 0.9911. 2. Find
Review Problems for Exam 3 Math 1040 1 1. Find the probability that a standard normal random variable is less than 2.37. Looking up 2.37 on the normal table, we see that the probability is 0.9911. 2. Find
MAT 155. Key Concept. September 22, 2010. 155S5.3_3 Binomial Probability Distributions. Chapter 5 Probability Distributions
 MAT 155 Dr. Claude Moore Cape Fear Community College Chapter 5 Probability Distributions 5 1 Review and Preview 5 2 Random Variables 5 3 Binomial Probability Distributions 5 4 Mean, Variance, and Standard
Calculating P-Values. Parkland College. Isela Guerra Parkland College. Recommended Citation
 Parkland College A with Honors Projects Honors Program 2014 Calculating P-Values Isela Guerra Parkland College Recommended Citation Guerra, Isela, "Calculating P-Values" (2014). A with Honors Projects.
STAT 200 QUIZ 2 Solutions Section 6380 Fall 2013
 STAT 200 QUIZ 2 Solutions Section 6380 Fall 2013 The quiz covers Chapters 4, 5 and 6. 1. (8 points) If the IQ scores are normally distributed with a mean of 100 and a standard deviation of 15. (a) (3 pts)
Chapter 4. Probability and Probability Distributions
 Chapter 4. robability and robability Distributions Importance of Knowing robability To know whether a sample is not identical to the population from which it was selected, it is necessary to assess the
Pr(X = x) = f(x) = λe λx
 = f(x) = λe λx") Old Business - variance/std. dev. of binomial distribution - mid-term (day, policies) - class strategies (problems, etc.) - exponential distributions New Business - Central Limit Theorem, standard error
Old Business - variance/std. dev. of binomial distribution - mid-term (day, policies) - class strategies (problems, etc.) - exponential distributions New Business - Central Limit Theorem, standard error
Chapter 8 Hypothesis Testing Chapter 8 Hypothesis Testing 8-1 Overview 8-2 Basics of Hypothesis Testing
 Chapter 8 Hypothesis Testing 1 Chapter 8 Hypothesis Testing 8-1 Overview 8-2 Basics of Hypothesis Testing 8-3 Testing a Claim About a Proportion 8-5 Testing a Claim About a Mean: s Not Known 8-6 Testing
Student Performance Q&A:
 Student Performance Q&A: 2008 AP Calculus AB and Calculus BC Free-Response Questions The following comments on the 2008 free-response questions for AP Calculus AB and Calculus BC were written by the Chief
Review. March 21, 2011. 155S7.1 2_3 Estimating a Population Proportion. Chapter 7 Estimates and Sample Sizes. Test 2 (Chapters 4, 5, & 6) Results
 Results") MAT 155 Statistical Analysis Dr. Claude Moore Cape Fear Community College Chapter 7 Estimates and Sample Sizes 7 1 Review and Preview 7 2 Estimating a Population Proportion 7 3 Estimating a Population
MAT 155 Statistical Analysis Dr. Claude Moore Cape Fear Community College Chapter 7 Estimates and Sample Sizes 7 1 Review and Preview 7 2 Estimating a Population Proportion 7 3 Estimating a Population
Section 5-3 Binomial Probability Distributions
 Section 5-3 Binomial Probability Distributions Key Concept This section presents a basic definition of a binomial distribution along with notation, and methods for finding probability values. Binomial
Sample Questions for Mastery #5
 Name: Class: Date: Sample Questions for Mastery #5 Multiple Choice Identify the choice that best completes the statement or answers the question.. For which of the following binomial experiments could
An Introduction to Basic Statistics and Probability
 An Introduction to Basic Statistics and Probability Shenek Heyward NCSU An Introduction to Basic Statistics and Probability p. 1/4 Outline Basic probability concepts Conditional probability Discrete Random
4. Continuous Random Variables, the Pareto and Normal Distributions
 4. Continuous Random Variables, the Pareto and Normal Distributions A continuous random variable X can take any value in a given range (e.g. height, weight, age). The distribution of a continuous random
Mind on Statistics. Chapter 8
 Mind on Statistics Chapter 8 Sections 8.1-8.2 Questions 1 to 4: For each situation, decide if the random variable described is a discrete random variable or a continuous random variable. 1. Random variable
Question: What is the probability that a five-card poker hand contains a flush, that is, five cards of the same suit?
 ECS20 Discrete Mathematics Quarter: Spring 2007 Instructor: John Steinberger Assistant: Sophie Engle (prepared by Sophie Engle) Homework 8 Hints Due Wednesday June 6 th 2007 Section 6.1 #16 What is the
CHAPTER 6: Continuous Uniform Distribution: 6.1. Definition: The density function of the continuous random variable X on the interval [A, B] is.
![CHAPTER 6: Continuous Uniform Distribution: 6.1. Definition: The density function of the continuous random variable X on the interval [A, B] is.](/thumbs/40/21160284.jpg "CHAPTER 6: Continuous Uniform Distribution: 6.1. Definition: The density function of the continuous random variable X on the interval [A, B] is.") Some Continuous Probability Distributions CHAPTER 6: Continuous Uniform Distribution: 6. Definition: The density function of the continuous random variable X on the interval [A, B] is B A A x B f(x; A,
Some Continuous Probability Distributions CHAPTER 6: Continuous Uniform Distribution: 6. Definition: The density function of the continuous random variable X on the interval [A, B] is B A A x B f(x; A,
6.4 Normal Distribution
 Contents 6.4 Normal Distribution....................... 381 6.4.1 Characteristics of the Normal Distribution....... 381 6.4.2 The Standardized Normal Distribution......... 385 6.4.3 Meaning of Areas under
Probability Distributions
 Learning Objectives Probability Distributions Section 1: How Can We Summarize Possible Outcomes and Their Probabilities? 1. Random variable 2. Probability distributions for discrete random variables 3.
Binomial Random Variables
 Binomial Random Variables Dr Tom Ilvento Department of Food and Resource Economics Overview A special case of a Discrete Random Variable is the Binomial This happens when the result of the eperiment is
Important Probability Distributions OPRE 6301
 Important Probability Distributions OPRE 6301 Important Distributions... Certain probability distributions occur with such regularity in real-life applications that they have been given their own names.
5) The table below describes the smoking habits of a group of asthma sufferers. two way table ( ( cell cell ) (cell cell) (cell cell) )
 The table below describes the smoking habits of a group of asthma sufferers. two way table ( ( cell cell ) (cell cell) (cell cell) )") MULTIPLE CHOICE. Choose the one alternative that best completes the statement or answers the question. Determine which score corresponds to the higher relative position. 1) Which score has a better relative
MULTIPLE CHOICE. Choose the one alternative that best completes the statement or answers the question. Determine which score corresponds to the higher relative position. 1) Which score has a better relative
X: 0 1 2 3 4 5 6 7 8 9 Probability: 0.061 0.154 0.228 0.229 0.173 0.094 0.041 0.015 0.004 0.001
 Tuesday, January 17: 6.1 Discrete Random Variables Read 341 344 What is a random variable? Give some examples. What is a probability distribution? What is a discrete random variable? Give some examples.
MULTIPLE CHOICE. Choose the one alternative that best completes the statement or answers the question. A) 0.4987 B) 0.9987 C) 0.0010 D) 0.
 0.4987 B) 0.9987 C) 0.0010 D) 0.") Ch. 5 Normal Probability Distributions 5.1 Introduction to Normal Distributions and the Standard Normal Distribution 1 Find Areas Under the Standard Normal Curve 1) Find the area under the standard normal
Ch. 5 Normal Probability Distributions 5.1 Introduction to Normal Distributions and the Standard Normal Distribution 1 Find Areas Under the Standard Normal Curve 1) Find the area under the standard normal
GCSE MATHEMATICS. 43602H Unit 2: Number and Algebra (Higher) Report on the Examination. Specification 4360 November 2014. Version: 1.
 Report on the Examination. Specification 4360 November 2014. Version: 1.") GCSE MATHEMATICS 43602H Unit 2: Number and Algebra (Higher) Report on the Examination Specification 4360 November 2014 Version: 1.0 Further copies of this Report are available from aqa.org.uk Copyright
GCSE MATHEMATICS 43602H Unit 2: Number and Algebra (Higher) Report on the Examination Specification 4360 November 2014 Version: 1.0 Further copies of this Report are available from aqa.org.uk Copyright
39.2. The Normal Approximation to the Binomial Distribution. Introduction. Prerequisites. Learning Outcomes
 The Normal Approximation to the Binomial Distribution 39.2 Introduction We have already seen that the Poisson distribution can be used to approximate the binomial distribution for large values of n and
COWLEY COUNTY COMMUNITY COLLEGE REVIEW GUIDE Compass Algebra Level 2
 COWLEY COUNTY COMMUNITY COLLEGE REVIEW GUIDE Compass Algebra Level This study guide is for students trying to test into College Algebra. There are three levels of math study guides. 1. If x and y 1, what
HYPOTHESIS TESTING: POWER OF THE TEST
 HYPOTHESIS TESTING: POWER OF THE TEST The first 6 steps of the 9-step test of hypothesis are called "the test". These steps are not dependent on the observed data values. When planning a research project,
Lecture 5 : The Poisson Distribution
 Lecture 5 : The Poisson Distribution Jonathan Marchini November 10, 2008 1 Introduction Many experimental situations occur in which we observe the counts of events within a set unit of time, area, volume,
Opgaven Onderzoeksmethoden, Onderdeel Statistiek
 Opgaven Onderzoeksmethoden, Onderdeel Statistiek 1. What is the measurement scale of the following variables? a Shoe size b Religion c Car brand d Score in a tennis game e Number of work hours per week
Notes on Continuous Random Variables
 Notes on Continuous Random Variables Continuous random variables are random quantities that are measured on a continuous scale. They can usually take on any value over some interval, which distinguishes
WISE Sampling Distribution of the Mean Tutorial
 Name Date Class WISE Sampling Distribution of the Mean Tutorial Exercise 1: How accurate is a sample mean? Overview A friend of yours developed a scale to measure Life Satisfaction. For the population
Key Concept. Density Curve
 MAT 155 Statistical Analysis Dr. Claude Moore Cape Fear Community College Chapter 6 Normal Probability Distributions 6 1 Review and Preview 6 2 The Standard Normal Distribution 6 3 Applications of Normal
3.4. The Binomial Probability Distribution. Copyright Cengage Learning. All rights reserved.
 3.4 The Binomial Probability Distribution Copyright Cengage Learning. All rights reserved. The Binomial Probability Distribution There are many experiments that conform either exactly or approximately
WISE Power Tutorial All Exercises
 ame Date Class WISE Power Tutorial All Exercises Power: The B.E.A.. Mnemonic Four interrelated features of power can be summarized using BEA B Beta Error (Power = 1 Beta Error): Beta error (or Type II
The Normal Distribution. Alan T. Arnholt Department of Mathematical Sciences Appalachian State University
 The Normal Distribution Alan T. Arnholt Department of Mathematical Sciences Appalachian State University [email protected] Spring 2006 R Notes 1 Copyright c 2006 Alan T. Arnholt 2 Continuous Random
Lesson 20. Probability and Cumulative Distribution Functions
 Lesson 20 Probability and Cumulative Distribution Functions Recall If p(x) is a density function for some characteristic of a population, then Recall If p(x) is a density function for some characteristic
AP CHEMISTRY 2013 SCORING GUIDELINES
 AP CHEMISTRY 2013 SCORING GUIDELINES Question 4 (15 points) For each of the following three reactions, write a balanced equation for the reaction in part (i) and answer the question about the reaction
Mathematics and Statistics: Apply probability methods in solving problems (91267)
") NCEA Level 2 Mathematics (91267) 2013 page 1 of 5 Assessment Schedule 2013 Mathematics and Statistics: Apply probability methods in solving problems (91267) Evidence Statement with Merit Apply probability
NCEA Level 2 Mathematics (91267) 2013 page 1 of 5 Assessment Schedule 2013 Mathematics and Statistics: Apply probability methods in solving problems (91267) Evidence Statement with Merit Apply probability
Unit 1 Number Sense. In this unit, students will study repeating decimals, percents, fractions, decimals, and proportions.
 Unit 1 Number Sense In this unit, students will study repeating decimals, percents, fractions, decimals, and proportions. BLM Three Types of Percent Problems (p L-34) is a summary BLM for the material
DETERMINE whether the conditions for a binomial setting are met. COMPUTE and INTERPRET probabilities involving binomial random variables
 1 Section 7.B Learning Objectives After this section, you should be able to DETERMINE whether the conditions for a binomial setting are met COMPUTE and INTERPRET probabilities involving binomial random
Review #2. Statistics
 Review #2 Statistics Find the mean of the given probability distribution. 1) x P(x) 0 0.19 1 0.37 2 0.16 3 0.26 4 0.02 A) 1.64 B) 1.45 C) 1.55 D) 1.74 2) The number of golf balls ordered by customers of
AP CHEMISTRY 2009 SCORING GUIDELINES (Form B)
") AP CHEMISTRY 2009 SCORING GUIDELINES (Form B) Question 3 (10 points) 2 H 2 O 2 (aq) 2 H 2 O(l) + O 2 (g) The mass of an aqueous solution of H 2 O 2 is 6.951 g. The H 2 O 2 in the solution decomposes completely
AP CHEMISTRY 2009 SCORING GUIDELINES (Form B) Question 3 (10 points) 2 H 2 O 2 (aq) 2 H 2 O(l) + O 2 (g) The mass of an aqueous solution of H 2 O 2 is 6.951 g. The H 2 O 2 in the solution decomposes completely
8. THE NORMAL DISTRIBUTION
 8. THE NORMAL DISTRIBUTION The normal distribution with mean μ and variance σ 2 has the following density function: The normal distribution is sometimes called a Gaussian Distribution, after its inventor,
Def: The standard normal distribution is a normal probability distribution that has a mean of 0 and a standard deviation of 1.
 Lecture 6: Chapter 6: Normal Probability Distributions A normal distribution is a continuous probability distribution for a random variable x. The graph of a normal distribution is called the normal curve.
BINOMIAL OPTIONS PRICING MODEL. Mark Ioffe. Abstract
 BINOMIAL OPTIONS PRICING MODEL Mark Ioffe Abstract Binomial option pricing model is a widespread numerical method of calculating price of American options. In terms of applied mathematics this is simple
IEOR 6711: Stochastic Models I Fall 2012, Professor Whitt, Tuesday, September 11 Normal Approximations and the Central Limit Theorem
 IEOR 6711: Stochastic Models I Fall 2012, Professor Whitt, Tuesday, September 11 Normal Approximations and the Central Limit Theorem Time on my hands: Coin tosses. Problem Formulation: Suppose that I have
Statistiek I. Proportions aka Sign Tests. John Nerbonne. CLCG, Rijksuniversiteit Groningen. http://www.let.rug.nl/nerbonne/teach/statistiek-i/
 Statistiek I Proportions aka Sign Tests John Nerbonne CLCG, Rijksuniversiteit Groningen http://www.let.rug.nl/nerbonne/teach/statistiek-i/ John Nerbonne 1/34 Proportions aka Sign Test The relative frequency
Friedman's Two-way Analysis of Variance by Ranks -- Analysis of k-within-group Data with a Quantitative Response Variable
 Friedman's Two-way Analysis of Variance by Ranks -- Analysis of k-within-group Data with a Quantitative Response Variable Application: This statistic has two applications that can appear very different,
TEACHER NOTES MATH NSPIRED
 Math Objectives Students will understand that normal distributions can be used to approximate binomial distributions whenever both np and n(1 p) are sufficiently large. Students will understand that when
The Normal Distribution
 Chapter 6 The Normal Distribution 6.1 The Normal Distribution 1 6.1.1 Student Learning Objectives By the end of this chapter, the student should be able to: Recognize the normal probability distribution
Week 3&4: Z tables and the Sampling Distribution of X
 Week 3&4: Z tables and the Sampling Distribution of X 2 / 36 The Standard Normal Distribution, or Z Distribution, is the distribution of a random variable, Z N(0, 1 2 ). The distribution of any other normal
Chapter 5 - Practice Problems 1
 Chapter 5 - Practice Problems 1 Identify the given random variable as being discrete or continuous. 1) The number of oil spills occurring off the Alaskan coast 1) A) Continuous B) Discrete 2) The ph level
AP CALCULUS AB 2009 SCORING GUIDELINES
 AP CALCULUS AB 2009 SCORING GUIDELINES Question 3 Mighty Cable Company manufactures cable that sells for $120 per meter. For a cable of fixed length, the cost of producing a portion of the cable varies
Characteristics of Binomial Distributions
 Lesson2 Characteristics of Binomial Distributions In the last lesson, you constructed several binomial distributions, observed their shapes, and estimated their means and standard deviations. In Investigation
Random variables, probability distributions, binomial random variable
 Week 4 lecture notes. WEEK 4 page 1 Random variables, probability distributions, binomial random variable Eample 1 : Consider the eperiment of flipping a fair coin three times. The number of tails that
You flip a fair coin four times, what is the probability that you obtain three heads.
 Handout 4: Binomial Distribution Reading Assignment: Chapter 5 In the previous handout, we looked at continuous random variables and calculating probabilities and percentiles for those type of variables.
Designing and Using Weighted Rubrics
 Designing and Using Weighted Rubrics The following pages demonstrate one effective way for history teachers to integrate the new assessment model required by the Ontario Ministry of Education into their
Introduction to Hypothesis Testing
 I. Terms, Concepts. Introduction to Hypothesis Testing A. In general, we do not know the true value of population parameters - they must be estimated. However, we do have hypotheses about what the true
STATISTICS 8: CHAPTERS 7 TO 10, SAMPLE MULTIPLE CHOICE QUESTIONS
 STATISTICS 8: CHAPTERS 7 TO 10, SAMPLE MULTIPLE CHOICE QUESTIONS 1. If two events (both with probability greater than 0) are mutually exclusive, then: A. They also must be independent. B. They also could
Friday 24 May 2013 Morning
 Friday 24 May 2013 Morning AS GCE MATHEMATICS 4732/01 Probability & Statistics 1 QUESTION PAPER * 4 7 1 5 5 2 0 6 1 3 * Candidates answer on the Printed Answer Book. OCR supplied materials: Printed Answer
WHERE DOES THE 10% CONDITION COME FROM?
 1 WHERE DOES THE 10% CONDITION COME FROM? The text has mentioned The 10% Condition (at least) twice so far: p. 407 Bernoulli trials must be independent. If that assumption is violated, it is still okay
Sampling. COUN 695 Experimental Design
 Sampling COUN 695 Experimental Design Principles of Sampling Procedures are different for quantitative and qualitative research Sampling in quantitative research focuses on representativeness Sampling
AP CALCULUS AB 2007 SCORING GUIDELINES (Form B)
") AP CALCULUS AB 2007 SCORING GUIDELINES (Form B) Question 4 Let f be a function defined on the closed interval 5 x 5 with f ( 1) = 3. The graph of f, the derivative of f, consists of two semicircles and
AP CALCULUS AB 2007 SCORING GUIDELINES (Form B) Question 4 Let f be a function defined on the closed interval 5 x 5 with f ( 1) = 3. The graph of f, the derivative of f, consists of two semicircles and
Name: Math 29 Probability. Practice Second Midterm Exam 1. 1. Show all work. You may receive partial credit for partially completed problems.
 Name: Math 29 Probability Practice Second Midterm Exam 1 Instructions: 1. Show all work. You may receive partial credit for partially completed problems. 2. You may use calculators and a one-sided sheet
Name: (b) Find the minimum sample size you should use in order for your estimate to be within 0.03 of p when the confidence level is 95%.
 Find the minimum sample size you should use in order for your estimate to be within 0.03 of p when the confidence level is 95%.") Chapter 7-8 Exam Name: Answer the questions in the spaces provided. If you run out of room, show your work on a separate paper clearly numbered and attached to this exam. Please indicate which program
Chapter 7-8 Exam Name: Answer the questions in the spaces provided. If you run out of room, show your work on a separate paper clearly numbered and attached to this exam. Please indicate which program
STT315 Chapter 4 Random Variables & Probability Distributions KM. Chapter 4.5, 6, 8 Probability Distributions for Continuous Random Variables
 Chapter 4.5, 6, 8 Probability Distributions for Continuous Random Variables Discrete vs. continuous random variables Examples of continuous distributions o Uniform o Exponential o Normal Recall: A random
EXAMINATIONS OF THE HONG KONG STATISTICAL SOCIETY
 EXAMINATIONS OF THE HONG KONG STATISTICAL SOCIETY HIGHER CERTIFICATE IN STATISTICS, 2015 MODULE 1 : Data collection and interpretation Time allowed: One and a half hours Candidates should answer THREE
Hypothesis Testing: Two Means, Paired Data, Two Proportions
 Chapter 10 Hypothesis Testing: Two Means, Paired Data, Two Proportions 10.1 Hypothesis Testing: Two Population Means and Two Population Proportions 1 10.1.1 Student Learning Objectives By the end of this
1 Error in Euler s Method
 1 Error in Euler s Method Experience with Euler s 1 method raises some interesting questions about numerical approximations for the solutions of differential equations. 1. What determines the amount of
Stats on the TI 83 and TI 84 Calculator
 Stats on the TI 83 and TI 84 Calculator Entering the sample values STAT button Left bracket { Right bracket } Store (STO) List L1 Comma Enter Example: Sample data are {5, 10, 15, 20} 1. Press 2 ND and