Overview How BC teacher salaries rank among the provinces and territories in 2011
|
|
|
- Sherman Eaton
- 9 years ago
- Views:
Transcription
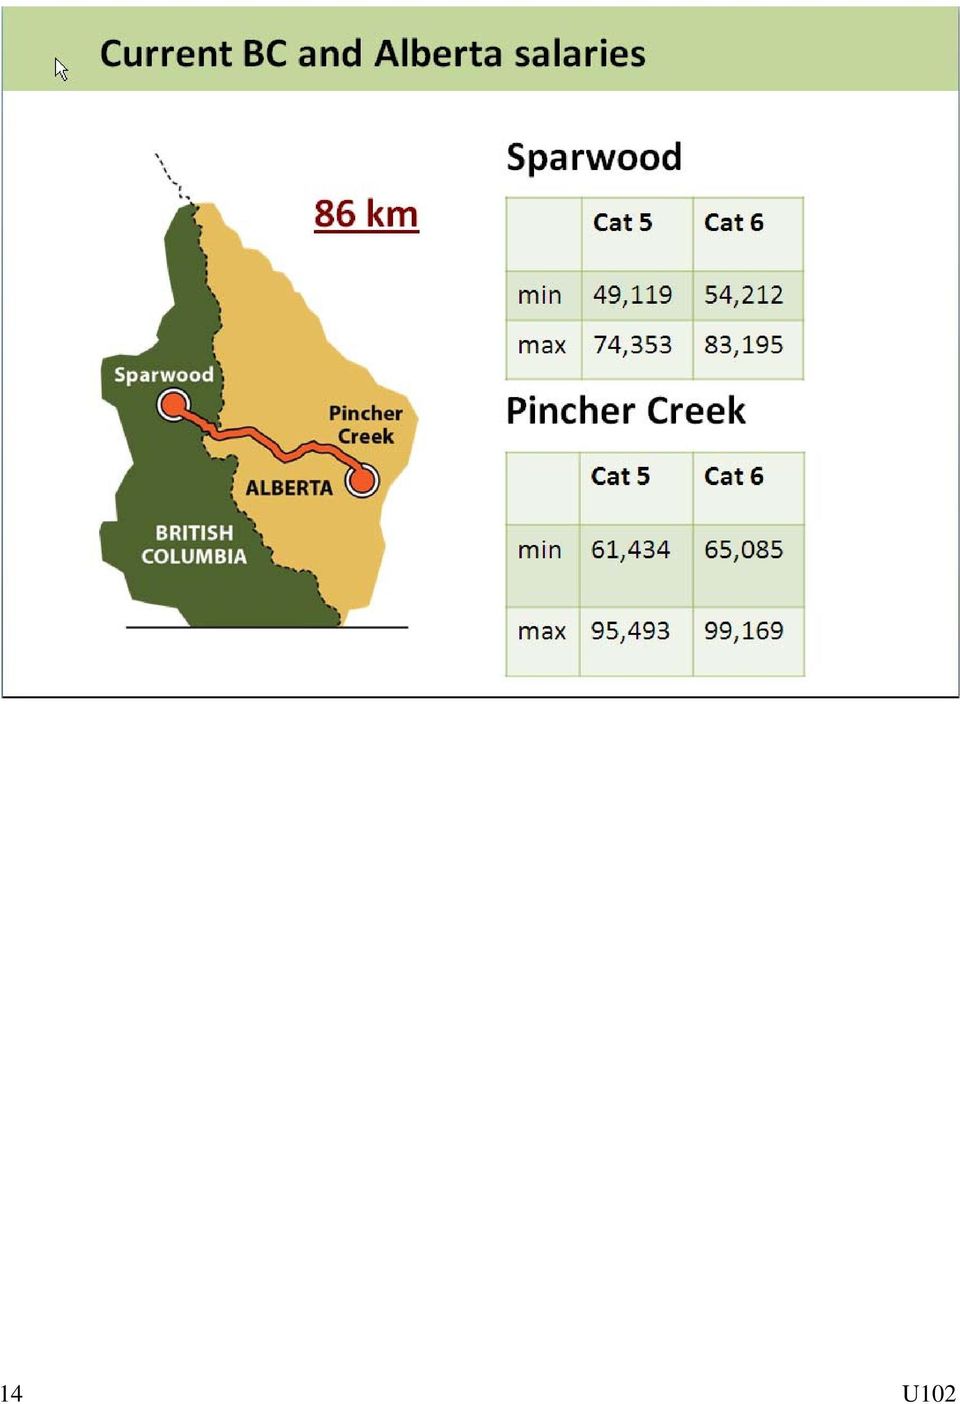
1 13 BARGAINING PROPOSAL BRITISH COLUMBIA TEACHERS FEDERATION Document Number: U102 Date: Time: Overview How BC teacher salaries rank among the provinces and territories in 2011 Minimum The minimum salary for a BC teacher with qualifications ranks 11th in Canada, including the provinces and territories. Based on provinces only, the rank shifts to 8th among the ten provinces. Maximum The maximum salary for a BC teacher with qualifications ranks 9th in Canada, including the provinces and territories. Based on provinces only, the rank shifts to 6th among the ten provinces. Category 6 Minimum The minimum salary for a BC teacher with Category 6 qualifications ranks 12th in Canada, including the provinces and territories. Based on provinces only, the rank shifts to 9th among the ten provinces. Maximum The maximum salary for a BC teacher with Category 6 qualifications ranks 11th in Canada, including the provinces and territories. Based on provinces only, the rank shifts to 8th among the ten provinces. Summary table: Ranking of BC teacher salaries The following table shows how BC teacher salaries rank compared to the other provinces and territories, and also the ranking on provinces only. The rankings are based on the average salary for the representative school districts listed in the salary comparison tables (pages 2 and 3). For the detailed tables on which these rankings are based, see pages 4 and 5. Provinces and territories (out of 13) Provinces only (out of 10) Cat 5 minimum 11th 8th Cat 5 maximum 9th 6th Cat 6 minimum 12th 9th Cat 6 maximum 11th 8th U102 1

2 2011* Canadian teacher salary rankings: Provinces and territories Equivalents to BC s minimum Equivalents to BC s maximum Prov. City/Province/Territory 2011* Cat 5 Min Prov. City/Province/Territory 2011* Cat 5 Max NT NWTTA $ 76,079 NT NWTTA $111,929 NU Nunavut $ 70,460 NT Yellowknife Catholic $106,800 NT Yellowknife Catholic $ 68,817 NT Yellowknife School District #1 $103,365 NT Yellowknife School District #1 $ 67,626 NU Nunavut $101,334 YT Yukon $ 65,869 AB Edmonton SD 7 $ 95,354 AB Edmonton SD 7 $ 61,489 AB Lethbridge SD 51 $ 95,161 AB Lethbridge SD 51 $ 61,472 YT Yukon $ 95,153 AB Calgary SD 19 $ 61,038 AB Calgary SD 19 $ 95,073 ON Ottawa Carleton Secondary $ 53,551 ON Toronto Secondary $ 89,614 SK Saskatchewan $ 53,327 ON Eastern OECTA $ 88,933 MB Winnipeg $ 52,814 ON Ottawa Carleton Secondary $ 88,816 MB Brandon $ 52,678 ON Elementary Teachers of Toronto (ETFO) $ 87,882 ON Ottawa Carleton Elementary (ETFO) $ 52,432 ON Near North Elementary (ETFO) $ 87,589 ON Near North Elementary (ETFO) $ 52,050 ON Ottawa Carleton Elementary (ETFO) $ 86,717 ON Toronto Secondary $ 51,738 SK Saskatchewan $ 81,945 ON Eastern OECTA $ 51,338 MB Brandon $ 80,709 NL Newfoundland and Labrador $ 51,166 MB Winnipeg $ 80,309 ON Elementary Teachers of Toronto (ETFO) $ 50,739 NB New Brunswick $ 75,241 NB New Brunswick $ 48,793 BC Prince George (July 1, 2010 June 30, 2011) $ 74,353 BC Victoria (July 1, 2010 June 30, 2011) $ 48,626 BC Vancouver (July 1, 2010 June 30, 2011) $ 74,353 BC Vancouver (July 1, 2010 June 30, 2011) $ 48,083 BC Victoria (July 1, 2010 June 30, 2011) $ 74,353 NS Nova Scotia $ 48,020 QC Quebec $ 71,946 PEI PEI $ 47,135 NS Nova Scotia $ 68,536 BC Prince George (July 1, 2010 June 30, 2011) $ 45,909 PEI PEI $ 68,117 QC Quebec $ 40,067 NL Newfoundland and Labrador $ 67,001 * Unless otherwise specified. This table was prepared by BCTF Research. Selection of equivalent categories for BC s and Category 6 was done by comparing definitions and requirements for each category, by province, or territory. 2 U102

3 2011* Canadian teacher salary rankings: Provinces and territories Equivalents to BC s Category 6 minimum Equivalents to BC s Category 6 maximum Prov. City/Province/Territory 2011* Cat 6 Min Prov. City/Province/Territory 2011* Cat 6 Max NT NWTTA $ 79,307 NT NWTTA $ 116,678 NU Nunavut $ 73,451 NT Yellowknife Catholic $ 114,705 NT Yellowknife Catholic $ 72,863 NT Yellowknife School District #1 $ 111,642 NT Yellowknife School District #1 $ 72,016 NU Nunavut $ 104,952 YT Yukon $ 68,112 AB Edmonton SD 7 $ 99,119 NL Newfoundland and Labrador $ 65,996 AB Lethbridge SD 51 $ 98,955 AB Lethbridge SD 51 $ 65,270 AB Calgary SD 19 $ 98,938 AB Edmonton SD 7 $ 65,256 YT Yukon $ 97,845 AB Calgary SD 19 $ 64,905 ON Toronto Secondary $ 94,707 NS Nova Scotia $ 62,946 ON Ottawa Carleton Secondary $ 94,649 MB Winnipeg $ 59,191 ON Eastern OECTA $ 94,614 MB Brandon $ 59,086 ON Elementary Teachers of Toronto (ETFO) $ 92,878 SK Saskatchewan $ 56,815 ON Ottawa Carleton Elementary (ETFO) $ 92,821 ON Toronto Secondary $ 55,404 ON Near North Elementary (ETFO) $ 92,811 ON Ottawa Carleton Secondary $ 55,377 MB Winnipeg $ 89,675 ON Near North Elementary (ETFO) $ 54,428 MB Brandon $ 89,083 ON Elementary Teachers of Toronto (ETFO) $ 54,333 NL Newfoundland and Labrador $ 87,792 ON Eastern OECTA $ 54,309 SK Saskatchewan $ 86,614 ON Ottawa Carleton Elementary (ETFO) $ 54,217 NS Nova Scotia $ 85,699 BC Victoria (July 1, 2010 June 30, 2011) $ 53,676 NB New Brunswick $ 81,851 NB New Brunswick $ 53,195 BC Victoria (July 1, 2010 June 30, 2011) $ 81,707 BC Vancouver (July 1, 2010 June 30, 2011)) $ 52,823 BC Prince George (July 1, 2010 June 30, 2011) $ 81,488 PEI PEI $ 52,793 BC Vancouver (July 1, 2010 June 30, 2011) $ 81,488 BC Prince George (July 1, 2010 June 30, 2011) $ 50,588 PEI PEI $ 76,289 QC Quebec $ 43,463 QC Quebec $ 71,946 * Unless otherwise specified. This table was prepared by BCTF Research. Selection of equivalent categories for BC s and Category 6 was done by comparing definitions and requirements for each category, by province, or territory. U102 3

4 How BC teacher salaries rank among the provinces and territories The following tables show how BC salaries rank compared to the other provinces and territories, and also the ranking on provinces only; an average is used here for those provinces/territories with more than one collective agreement (based on the examples in earlier tables in this report). The minimum salary for a BC teacher with qualifications ranks 11th in Canada, including the provinces and territories. Based on provinces only, the rank shifts to 8th among the ten provinces. The maximum salary for a BC teacher with qualifications ranks 9th in Canada, including the provinces and territories. Based on provinces only, the rank shifts to 6th among the ten provinces. BC s ranking, based on 2011 minimum salary Prov. Province/Territory 2011 Cat 5 Min Ranking Ranking, provinces only NT* Northwest Territory $ 70,841 1 NU Nunavut $ 70,460 2 YT Yukon $ 65,869 3 AB* Alberta $ 61, SK Saskatchewan $ 53, MB* Manitoba $ 52, ON* Ontario $ 51, NL Newfoundland and Labrador $ 51, NB New Brunswick $ 48, NS Nova Scotia $ 48, BC* British Columbia (July 1, 2010 June 30, 2011) $ 47, PEI PEI $ 47, QC Quebec $ 40, This table was prepared by BCTF Research. BC s ranking, based on 2011 maximum salary Prov. Province/Territory 2011 Cat 5 Max Ranking Ranking, provinces only NT* Northwest Territory $107,365 1 NU Nunavut $101,334 2 AB* Alberta $ 95, YT Yukon $ 95,153 4 ON* Ontario $ 88, SK Saskatchewan $ 81, MB* Manitoba $ 80, NB New Brunswick $ 75, BC* British Columbia (July 1, 2010 June 30, 2011) $ 74, QC Quebec $ 71, NS Nova Scotia $ 68, PEI PEI $ 68, NL Newfoundland and Labrador $ 67, This table was prepared by BCTF Research. * Average salary based on the sample of districts included in the salary comparison tables in the earlier section of this report. 4 U102

5 Category 6 The minimum salary for a BC teacher with Category 6 qualifications ranks 12th in Canada, including the provinces and territories. Based on provinces only, the rank shifts to 9th among the ten provinces. The maximum salary for a BC teacher with Category 6 qualifications ranks 11th in Canada, including the provinces and territories. Based on provinces only, the rank shifts to 8th among the ten provinces BC s ranking, based on 2011 Category 6 minimum salary Prov. Province/Territory 2011 Cat 6 Min Ranking Ranking, provinces only NT* Northwest Territory $ 74,729 1 NU Nunavut $ 73,451 2 YT Yukon $ 68,112 3 NL Newfoundland and Labrador $ 65, AB* Alberta $ 65, NS Nova Scotia $ 62, MB* Manitoba $ 59, SK Saskatchewan $ 56, ON* Ontario $ 54, NB New Brunswick $ 53, PEI PEI $ 52, BC* British Columbia (July 1, 2010 June 30, 2011) $ 52, QC Quebec $ 43, This table was prepared by BCTF Research. BC s ranking, based on 2011 Category 6 maximum salary Prov. Province/Territory 2011 Cat 6 Max Ranking Ranking, provinces only NT* Northwest Territory $114,342 1 NU Nunavut $104,952 2 AB* Alberta $ 99, YT Yukon $ 97,845 4 ON* Ontario $ 93, MB* Manitoba $ 89, NL Newfoundland and Labrador $ 87, SK Saskatchewan $ 86, NS Nova Scotia $ 85, NB New Brunswick $ 81, BC* British Columbia (July 1, 2010 June 30, 2011) $ 81, PEI PEI $ 76, QC Quebec $ 71, This table was prepared by BCTF Research. * Average salary based on the sample of districts included in the salary comparison tables in the earlier section of this report. U102 5

6 Overview of teacher salary differences Teacher salary differences as of September 2010 In , a Vancouver teacher at maximum salary (Cat. 5) earns: o $10,969 less than an elementary teacher in Toronto, o $11,876 less than a secondary teacher in Ottawa, and o $16,860 less than a teacher in Edmonton. In , a Prince George teacher at maximum salary (Cat. 5) earns: o $10,685 less than an elementary teacher in Near North, o $1,325 more than a teacher in New Brunswick, and o $16, 675 less than a teacher in Lethbridge. Teacher salary differences as of September 2011 If BC teachers do not receive a salary increase for , a Vancouver teacher at maximum salary (Cat. 5) will earn: o $13,529 less than an elementary teacher in Toronto, o $14,463 less than a secondary teacher in Ottawa, and o $21,001 less than a teacher in Edmonton. If BC teachers do not receive a salary increase for , a Prince George teacher at maximum salary (Cat. 5) will earn: o $13,236 less than an elementary teacher in Near North, o $ 888 less than a teacher in New Brunswick, and o $20, 808 less than a teacher in Lethbridge. What if BC teachers receive no salary increase for ? By September 2011, the earnings gap between an Edmonton teacher and a Vancouver teacher with 10 years teaching experience at will widen from $16,860 to $21,001. By September 2011, the earnings gap between a Lethbridge teacher and a Prince George teacher with 10 years teaching experience at will widen from $16,675 to $20,808. Teacher salary comparison tables Urban: Vancouver, Ottawa, Toronto, and Edmonton (see pp. 7 8) September 2010 September 2011 Non-Urban: Prince George, Near North, New Brunswick, and Lethbridge (see pp. 9 10) September 2010 September U102
 earns: o $10,685 less than an elementary teacher in Near North, o $1,325 more than a teacher in New Brunswick, and o $16, 675 less than a teacher in Lethbridge.")
7 Urban teacher salary comparisons September 2010 This comparison shows the salary difference between Vancouver (BC) and Toronto (ON), Ottawa (ON), and Edmonton (AB), for current salary levels in Category A3 Category A3 Step Vancouver (Sept 2010: 2%) Toronto* (Sept 2010: 3%) Vancouver compared to Toronto Ottawa* (Sept 2010: 3%) Vancouver compared to Ottawa Edmonton** (Sept 2010: 2.92%) Vancouver compared to Edmonton 0 $48,083 $49,261 -$1,178 $51,991 -$3,908 $58,819 -$10,736 1 $50,494 $52,569 -$2,075 $55,413 -$4,919 $61,991 -$11,497 2 $52,904 $56,066 -$3,162 $58,839 -$5,935 $65,165 -$12,261 3 $55,315 $59,559 -$4,244 $62,262 -$6,947 $68,337 -$13,022 4 $57,725 $63,243 -$5,518 $65,684 -$7,959 $71,510 -$13,785 5 $60,135 $66,919 -$6,784 $69,107 -$8,972 $74,682 -$14,547 6 $62,546 $70,599 -$8,053 $72,532 -$9,986 $77,854 -$15,308 7 $64,956 $74,279 -$9,323 $75,954 -$10,998 $81,026 -$16,070 8 $67,367 $77,957 -$10,590 $79,377 -$12,010 $84,198 -$16,831 9 $69,777 $81,640 -$11,863 $82,800 -$13,023 $87,371 -$17, $74,353 $85,322 -$10,969 $86,229 -$11,876 $91,213 -$16,860 Difference between step 0 and step 10 $26,270 $36,061 $34,238 $32,394 Notes: Selection of equivalent categories for BC s and 6 was done by comparing definitions and requirements for each category, by province or territory. The categories chosen as the most suitable matches are based on information on teacher certification qualifications available online for each province or territory. For further information, contact [email protected] in BCTF Research. increase percentages calculated by BCTF Research comparing figures in salary grids for each collective agreement. * Toronto and Ottawa: 2010 salary figures from relevant collective agreements for Toronto Elementary and Ottawa- Carleton Secondary. ** Edmonton: 2010 salary figures from collective agreement. Sources: Collective Agreement between Toronto District School Board and ETFO ( ): Collective Agreement between Ottawa-Carleton School Board and OSSTF ( ): Collective Agreement between Board of Trustees of Edmonton School District No 7 and the ATA ( ): dmonton%20school%20district%20no%207%20(2007%20-%202012).aspx U102 7

8 Step Urban teacher salary comparisons September 2011 This comparison shows the salary difference between Vancouver (BC) and Toronto (ON), Ottawa (ON), and Edmonton (AB) if salary levels for BC public school teachers remain unchanged in Vancouver (Sept 2011: Category A3 Toronto* (Sept 2011: Vancouver compared to Toronto Category A3 Ottawa* (Sept 2011: Vancouver compared to Ottawa Edmonton** (Sept 2011: Vancouver compared to Edmonton 0%) 3%) 3%) 4.54%) 0 $48,083 $50,739 -$2,656 $53,551 -$5,468 $61,489 -$13,406 1 $50,494 $54,146 -$3,652 $57,075 -$6,581 $64,805 -$14,311 2 $52,904 $57,748 -$4,844 $60,604 -$7,700 $68,123 -$15,219 3 $55,315 $61,346 -$6,031 $64,130 -$8,815 $71,439 -$16,124 4 $57,725 $65,140 -$7,415 $67,655 -$9,930 $74,757 -$17,032 5 $60,135 $68,927 -$8,792 $71,180 -$11,045 $78,073 -$17,938 6 $62,546 $72,717 -$10,171 $74,708 -$12,162 $81,389 -$18,843 7 $64,956 $76,507 -$11,551 $78,233 -$13,277 $84,705 -$19,749 8 $67,367 $80,296 -$12,929 $81,758 -$14,391 $88,021 -$20,654 9 $69,777 $84,089 -$14,312 $85,284 -$15,507 $91,338 -$21, $74,353 $87,882 -$13,529 $88,816 -$14,463 $95,354 -$21,001 Difference between step 0 and step 10 $26,270 $37,143 $35,265 $33,865 Notes: Selection of equivalent categories for BC s and 6 was done by comparing definitions and requirements for each category, by province or territory. The categories chosen as the most suitable matches are based on information on teacher certification qualifications available online for each province or territory. For further information, contact [email protected] in BCTF Research. increase percentages calculated by BCTF Research comparing figures in salary grids for each collective agreement. * Toronto and Ottawa: 2011 salary figures from relevant collective agreements for Toronto Elementary and Ottawa- Carleton Secondary. **Edmonton: 2011 salary figures for Edmonton from collective agreement. Sources: Collective Agreement between Toronto District School Board and ETFO ( ): Collective Agreement between Ottawa-Carleton School Board and OSSTF ( ): Collective Agreement between Board of Trustees of Edmonton School District No 7 and the ATA ( ): dmonton%20school%20district%20no%207%20(2007%20-%202012).aspx 8 U102
 3%) 3%) 4.")
9 Non-urban teacher salary comparisons September 2010 This comparison shows the salary differences between Prince George (BC) and Near North (ON), New Brunswick, and Lethbridge (AB) at current salary levels for Category A3 Category CV Step New Prince Prince Near Prince Lethbridge Prince Brunswick George George North** George **** George *** compared (Sept (Sept 2010: compared to (Sept 2010: compared to (Sept 2010: to New 2010: 2%) 3%) Near North 2.92%) Lethbridge 4%) Brunswick 0 $45,909 $50,534 -$4,625 $47,358 -$1,449 $58,802 -$12,893 1 $48,543 $53,384 -$4,841 $49,922 -$1,379 $62,025 -$13,482 2 $51,176 $56,234 -$5,058 $52,490 -$1,314 $65,249 -$14,073 3 $53,809 $59,084 -$5,275 $55,055 -$1,246 $68,470 -$14,661 4 $56,443 $61,936 -$5,493 $57,627 -$1,184 $71,693 -$15,250 5 $59,076 $64,786 -$5,710 $60,196 -$1,120 $74,915 -$15,839 6 $61,709 $67,637 -$5,928 $62,760 -$1,051 $78,139 -$16,430 7 $64,343 $70,488 -$6,145 $65,329 -$986 $81,359 -$17,016 8 $66,976 $73,339 -$6,363 $67,899 -$923 $84,583 -$17,607 9 $69,609 $76,189 -$6,580 $70,459 -$850 $87,804 -$18,195 10* $74,353 $79,039 -$4,686 $73,028 $1,325 $91,028 -$16, $85,038 -$10,685 Difference between step 0 and step 10 $28,444 $28,505 $25,670 $32,226 Notes: Selection of equivalent categories for BC s and 6 was done by comparing definitions and requirements for each category, by province or territory. The categories chosen as the most suitable matches are based on information on teacher certification qualifications available online for each province or territory. For further information, contact [email protected] in BCTF Research. increase percentages calculated by BCTF Research based on figures in each collective agreement. * Prince George: Some schools in Prince George receive $57 more at step 10 due to the grid lift for schools eligible for the Recruitment & Retention allowance. ** Near North salary grid taken from collective agreement for Elementary teachers (ETFO). *** New Brunswick: NB has a provincial salary grid. The 4% salary increase for NB is based on a 2% increase as of March 1, 2010 and a 2% increase as of September 1, **** Lethbridge: 2010 salary figures from collective agreement. Sources: ETFO Near North Collective Agreement (Sept 1, 2008 Aug 31, 2012): New Brunswick Teachers' Federation Collective Agreement (Mar 1, 2008 Feb 29, 2012): Lethbridge School District 51 Collective Agreement ( ): ethbridge%20school%20district%20no%2051%20(2007%20-%202012).aspx U102 9
 3%) Near North 2.")
10 Non-urban teacher salary comparisons September 2011 This comparison shows the salary difference between Prince George (BC) and Near North (ON), New Brunswick, and Lethbridge (AB) if salary levels for BC public school teachers remain unchanged in Category A3 Teacher s Certificate V Prince Near Prince New Prince George Lethbridge Prince Step George North** George Brunswick*** compared to **** George (Sept 2011: (Sept 2011: compared to (Sept 2011: New (Sept 2011: compared to 0%) 3%) Near North 3%) Brunswick 4.54%) Lethbridge 0 $45,909 $52,050 -$6,141 $48,793 -$2,884 $61,472 -$15,563 1 $48,543 $54,986 -$6,443 $51,435 -$2,892 $64,841 -$16,298 2 $51,176 $57,921 -$6,745 $54,081 -$2,905 $68,211 -$17,035 3 $53,809 $60,857 -$7,048 $56,723 -$2,914 $71,579 -$17,770 4 $56,443 $63,794 -$7,351 $59,373 -$2,930 $74,948 -$18,505 5 $59,076 $66,730 -$7,654 $62,020 -$2,944 $78,316 -$19,240 6 $61,709 $69,666 -$7,957 $64,662 -$2,953 $81,687 -$19,978 7 $64,343 $72,603 -$8,260 $67,309 -$2,966 $85,053 -$20,710 8 $66,976 $75,539 -$8,563 $69,957 -$2,981 $88,423 -$21,447 9 $69,609 $78,475 -$8,866 $72,594 -$2,985 $91,790 -$22,181 10* $74,353 $81,410 -$7,057 $75,241 -$888 $95,161 -$20, $87,589 -$13,236 Difference between step 0 and step 10 $28,444 $29,360 $26,448 $33,689 Notes: Selection of equivalent categories for BC s and 6 was done by comparing definitions and requirements for each category, by province or territory. The categories chosen as the most suitable matches are based on information on teacher certification qualifications available online for each province or territory. For further information, contact [email protected] in BCTF Research. increase percentages calculated by BCTF Research based on figures in each collective agreement. * Prince George: Some schools in Prince George receive $57 more at step 10 due to the grid lift for schools eligible for the Recruitment & Retention allowance. ** Near North salary grid taken from collective agreement for Elementary teachers (ETFO). *** New Brunswick: NB has a provincial salary grid. The 3% salary increase for NB is based on a 2% increase as of March 1, 2011 and a 1% increase as of September 1, September 1, 2011 salary increase is effective to February 29, **** Lethbridge: 2011 salary figures from collective agreement. Sources: ETFO Near North Collective Agreement (Sept 1, 2008 Aug 31, 2012): New Brunswick Teachers' Federation Collective Agreement (Mar 1, 2008 Feb 29, 2012): Lethbridge School District 51 Collective Agreement ( ): ethbridge%20school%20district%20no%2051%20(2007%20-%202012).aspx 10 U102
 3%) Near North 3%) Brunswick 4.")
11 Recent bargaining settlements in British Columbia Public sector settlements: Percentage increase in wages and salaries Municipal employees Comox Valley Regional District (CUPE 556) 2% 2% 3% 2% Courtenay (CUPE Loc. 556) 2% 2% 2.75% 2.25 International Assoc. of Fire Fighters ( 953) Kelowna TBA TBA TBA International Assoc. of Fire Fighters (1271) Surrey 3.0% 2.5% Vancouver Police Union 2.95% 2.95% 1.25% 1.3% West Kelowna Association of Local Government Employees Union 1.5% 1.5% 1.5% Transportation, Communications and Other Utilities BC Rapid Transit Co (CUPE 7000) 3% TBA TBA TBA Note: TBA Increases will match those negotiated with other IAFF or TransLink workers. See BC Bargaining Database, Vol. 04, NO. 03 July 2011: Settlement Summaries at: Public sector settlements: Percentage increase in wages and salaries Federal employees Canada Revenue Agency Public Service Alliance 1.50% 1.50% Municipal employees (CUPE) Kelowna 1.25% 1.25% 1.50% 1.50% North Cowichan 2.00% 2.50% 2.50% 3.00% Penticton 0% 1.00% 1.00% 1.00% Revelstoke 1.25% 1.25% 1.50% 1.50% Salmon Arm 1.25% 1.25% Transportation, Communications and Other Utilities: Percentage increase in wages and salaries Canadian Freightways (Teamsters, Loc 31) 0% 1.50% 2.50% Canadian National Railway (CAW) 2.40% 2.60% 3.00% 3.00% Canadian Pacific Railway (CAW, Loc 101) 3.00% 0% 3.00% 3.00% See BC Bargaining Database, Vol. 04, NO. 02 April 2011: Settlement Summaries at: Public sector settlements: Percentage increase in wages and salaries Federal employees Treasury Board of Canada (PSA) Education and Library Science 1.75% 1.50% 2.00% Program and Administration 1.75% 1.50% 2.00% Operational Services 1.75% 1.50% 2.00% Municipal employees (CUPE) Quesnel 0% 1.50% 2.00% Summerland 0% 1.50% 1.75% Kamloops 2.00% 2.00% 2.00% Transportation, Communications and Other Utilities CN Railway Company (Teamsters CTY) 2.40% 3.00% 3.00% See BC Bargaining database, Vol. 04, NO. 01 January 2011: Settlement Summaries at: U102 11
 3% TBA TBA TBA Note: TBA Increases will match those negotiated with other IAFF or TransLink workers.")
12 Average housing prices for major metropolitan areas A comparison of average housing prices for Census Metropolitan Areas (CMA) across Canada shows that the Vancouver CMA and the Victoria CMA had the highest average housing prices in Canada in 2009 and In 2010, the average price of a house in Vancouver (CMA) was $925,852 compared to $606,617 in Toronto (CMA), $490,128 in Edmonton (CMA), and $376,625 in Winnipeg (CMA). Average price ($) of absorbed single-detached units (ranked using 2010 prices, from highest to lowest) CMA* YTD 2010 YTD 2009 % change Vancouver CMA $925,852 $905, % Victoria CMA $635,664 $668, % Toronto CMA $606,617 $582, % Greater Toronto Area (GTA) $591,551 $563, % Abbotsford CMA $562,751 $540, % Calgary CMA $514,466 $547, % Edmonton CMA $490,128 $543, % Regina CMA $438,979 $382, % Saskatoon CMA $380,600 $383, % Oshawa CMA $378,405 $356, % Winnipeg CMA $376,625 $369, % * Includes surrounding areas. BCTF Research table with data extracted from CMHC reports for a sample of Metropolitan areas. Source: CMHC. (2011). Table 4.1: Average Price ($) of Absorbed Single-detached Units. Housing Now Housing market information (by CMA). www03.cmhcschl.gc.ca/catalog/productlist.cfm?cat=70&lang=en&fr= U102
 of absorbed single-detached units (ranked using 2010 prices, from highest to lowest) CMA* YTD 2010 YTD 2009 % change Vancouver CMA $925,852 $905,011 2.")
13 Average rents for one-, two-, and three-or-more-bedroom apartments In October 2010, Vancouver had the highest average rents for two-bedroom and three-ormore-bedroom apartments in a comparison of 18 Canadian cities. In October 2010, the average monthly rent for a two-bedroom apartment was $700 in Montreal, $881 in Regina, $1,015 in Edmonton, and $1,195 in Vancouver. Average rents in privately initiated rental apartment structures of 3 units and over (October 2010) City/town 1 Bed. 2 Bed. 3+ Bed. Abbotsford $655 $785 $875 Calgary $894 $1,069 $1,057 Edmonton $843 $1,015 $1,171 Halifax $732 $891 $1,146 Kelowna $740 $898 $1,018 Lethbridge $734 $845 $865 Montreal $627 $700 $860 Nanaimo $648 $789 $957 North Bay $662 $816 $898 Ottawa $877 $1,048 $1,312 Prince George $592 $709 $794 Regina $742 $881 $1,058 Saskatoon $765 $934 $959 St. John's $649 $725 $761 Toronto $949 $1,123 $1,322 Vancouver $940 $1,195 $1,420 Victoria $806 $1,024 $1,223 Winnipeg $649 $837 $1,056 BCTF Research table with data for a sample of cities Source: CMHC. (2010). Rental Market Statistics. U102 13

14 14 U102
15 U102 15

16 16 U102

17 U102 17

18 :mf/tfeu 18 U102

4.0 Health Expenditure in the Provinces and Territories
 4.0 Health Expenditure in the Provinces and Territories Health expenditure per capita varies among provinces/territories because of different age distributions. xii Population density and geography also
Instructions NDEB Equivalency Process
 NDEB Equivalency Process Table of Contents Submitting an online application... 3 Website... 3 Online registration portal... 5 Submitting required documents... 10 Application Instructions-Final.docx 2 /
House for sale (Dept. of Finance) Real Estate
 Real Estate") House for sale (Dept. of Finance) Real Estate The residential real estate market turned in another solid performance in 2010. Strong demand for housing during the first half of 2010 was fuelled by record
House for sale (Dept. of Finance) Real Estate The residential real estate market turned in another solid performance in 2010. Strong demand for housing during the first half of 2010 was fuelled by record
Open Government and Information Management. Roy Wiseman Executive Director, MISA/ASIM Canada CIO (Retired), Region of Peel roy.wiseman@outlook.
, Region of Peel roy.wiseman@outlook.") Open Government and Information Management Roy Wiseman Executive Director, MISA/ASIM Canada CIO (Retired), Region of Peel [email protected] Open Government Defined Government of Canada defines Open
Open Government and Information Management Roy Wiseman Executive Director, MISA/ASIM Canada CIO (Retired), Region of Peel [email protected] Open Government Defined Government of Canada defines Open
Attachment A. Electricity Rate Comparison Annual Report. May 1, 2011 Rates
 Electricity Rate Comparison Annual Report May 1, 2011 Rates List of Tables Table 1 Residential Monthly Bills... 4 Table 2 Small Power Monthly Bills... 5 Table 3 Medium Power Monthly Bills... 6 Table 4
Police-reported crime statistics, 2013 Released at 8:30 a.m. Eastern time in The Daily, Wednesday, July 23, 2014
 Police-reported crime statistics, 2013 Released at 8:30 a.m. Eastern time in The Daily, Wednesday, July 23, 2014 The police-reported Crime Severity Index (CSI), which measures the volume and severity of
Nursing Education in Canada, Consolidated Statistics for Entry-to-Practice Certificate, Diploma and Baccalaureate Programs: 2006-2007
 STATISTICS Nursing Education in Canada, Consolidated Statistics for Entry-to-Practice Certificate, Diploma and Baccalaureate Programs: 2006-2007 The Canadian Association of Registered Psychiatric Nurse
Canadian Provincial and Territorial Early Hearing Detection and Intervention. (EHDI) Programs: PROGRESS REPORT
 Programs: PROGRESS REPORT") Canadian Provincial and Territorial Early Hearing Detection and Intervention (EHDI) Programs: PROGRESS REPORT www.sac-oac.ca www.canadianaudiology.ca 1 EHDI PROGRESS REPORT This progress report represents
Canadian Provincial and Territorial Early Hearing Detection and Intervention (EHDI) Programs: PROGRESS REPORT www.sac-oac.ca www.canadianaudiology.ca 1 EHDI PROGRESS REPORT This progress report represents
Resolving Customer Complaints
 Resolving Customer Complaints When a Problem Occurs - We Can Help As an MCAP Client you have come to expect a high level of customer service. If you have a complaint regarding our service or policy, we
Application deadline: march 31 Apply for a $2,000 bursary!
 VIVRE À FOND LA FRANCOPHONIE CANADIENNE THREE-WEEK PROGRAM for Grades 8 and 9 Application deadline: march 31 Apply for a $2,000 bursary! Follow us! #destinationclic www.fb.com/destination.clic @OLP-PLO
Section V. Jurisdictional Requirements (Section V) General Instructions
 General Instructions") Section V General Instructions Since the insurance legislation in the various jurisdictions in Canada is not exactly the same, certain differences must be accommodated. Everything related to each jurisdiction
Section V General Instructions Since the insurance legislation in the various jurisdictions in Canada is not exactly the same, certain differences must be accommodated. Everything related to each jurisdiction
Police-reported crime statistics, 2014 Released at 8:30 a.m. Eastern time in The Daily, Wednesday, July 22, 2015
 Police-reported crime statistics, 2014 Released at 8:30 a.m. Eastern time in The Daily, Wednesday, July 22, 2015 The Crime Severity Index (CSI) measures the volume and severity of police-reported crime.
Complaints or concerns about health care services or business services can be directed to a number of sources.
 What to do if you are not happy with service you received from your ENT, Audiologist, Speech- Language Pathologist, Hearing Aid Dispenser or Service Provider. Complaints or concerns about health care services
Engineers Canada 2012 Membership Survey
 Engineers Canada 2012 Membership Survey June 3, 2013 Contents List of Tables... i List of Figures... ii Descriptions of Membership Categories... iii 1 Introduction... 1 2 Membership Composition... 1 2.1
DOMINION LAND SURVEY. COMPOSED AND PRODUCED BY : Chris Rule. Permission is granted for use by acknowledging the author s name.
 COMPOSED AND PRODUCED BY : Chris Rule Permission is granted for use by acknowledging the author s name. The Dominion Land Survey System was initiated by the Canadian Government in 1869 for settlement purposes.
Canadian Geography for ESL/ESOL Classrooms
 Canadian Geography for ESL/ESOL Classrooms Submitted by: Patricia A. Kubes, Greer High School (Greer, SC) Date: August 1, 2014 Description: This lesson is intended for students learning English as a second
National Retail Report Canada FALL 2015 EDITION. Accelerating success.
 National Retail Report Canada FALL 2015 EDITION Accelerating success. Report prepared by Colliers International Consulting James Smerdon Vice President and Director, Retail Consulting DIRECT +1 604 685
Juristat Bulletin Article. Criminal harassment in Canada, 2009. By Shelly Milligan
 Component of Statistics Canada catalogue no. 85-005-X Juristat Bulletin Juristat Bulletin Article Criminal harassment in Canada, 2009 By Shelly Milligan Released: March 3, 2011 Juristat Bulletin Component
Workers Compensation How to Make a Claim
 Workers Compensation How to Make a Claim HOW TO MAKE A WORKERS COMPENSATION CLAIM dśğĩžůůžǁ ŝŷőŝŷĩžƌŵăɵžŷǁ ŝůůśğůɖljžƶƚžŵăŭğăǁ ŽƌŬĞƌƐΖĐŽŵƉĞŶƐĂƟŽŶĐůĂŝŵĨŽƌLJŽƵƌƐĞůĨŽƌ to help your fellow workers establish
BRAIN INJURY NATIONAL PROVINCIAL ALBERTA. A.N.D Canada
 NATIONAL BRAIN INJURY A.N.D Canada For individuals with a broad range of neurological disabilities that range from mild learning disorders to severe neurological impairments. The A.N.D. Centre 59 Clement
The Regulation and Supply of Nurse Practitioners in Canada: Health Expenditure Estimates
 The Regulation and Supply of Nurse Practitioners in Canada: Preliminary Technical Provincial Appendix and Territorial Government Health Expenditure Estimates 1974 1975 to 2004 2005 The Regulation and
TAXES AND SURCHARGES ON AIRLINE TICKETS
 PRB 05-72E TAXES AND SURCHARGES ON AIRLINE TICKETS Allison Padova Economics Division 22 February 2006 PARLIAMENTARY INFORMATION AND RESEARCH SERVICE SERVICE D INFORMATION ET DE RECHERCHE PARLEMENTAIRES
DIGITAL ECONOMY ANNUAL REVIEW
 DIGITAL ECONOMY ANNUAL REVIEW LABOUR MARKET DIGITAL ECONOMY TALENT ICT 2 0 1 4 THE INFORMATION AND COMMUNICATIONS TECHNOLOGY COUNCIL (ICTC) RESEARCH BY: THE INFORMATION AND COMMUNICATIONS TECHNOLOGY COUNCIL
THE CANADIAN ISP COUNT, 2003: How many, where they are and what they do
 THE CANADIAN ISP COUNT, 2003: How many, where they are and what they do Sponsored by Industry Framework Telecommunications Policy Branch, Industry Canada BY: The Canadian Association of Internet Providers
AGREEMENT IN PRINCIPLE Labour Mobility Chapter of the Agreement on Internal Trade/Teaching Profession 1999 09 29
 AGREEMENT IN PRINCIPLE Labour Mobility Chapter of the Agreement on Internal Trade/Teaching Profession 1999 09 29 This agreement in principle is developed in conformity with the provisions of Chapter 7
Income tax rates for Canadian-controlled private corporations (CCPCs) 2012-2013
 2012-2013") Income tax rates for Canadian-controlled private corporations (CCPCs) 2012-2013 Federal income tax rates for income earned by a CCPC 1 Small Active Income between $400,000 and General Active General corporate
Income tax rates for Canadian-controlled private corporations (CCPCs) 2012-2013 Federal income tax rates for income earned by a CCPC 1 Small Active Income between $400,000 and General Active General corporate
The Dietitian Workforce in Canada
 The Dietitian Workforce in Canada Meta-Analysis Report MARCH 2011 www.dietitians.ca www.dietetistes.ca Dietitians of Canada 2011. All rights reserved. DIETITIANS OF CANADA 1 Executive Summary The purpose
REGISTERED NURSING ASSOCATIONS CONTACT INFO
 REGISTERED NURSING ASSOCATIONS CONTACT INFO CANADIAN COUNCIL OF REGISTERED NURSE REGULATORS Greenbank North Post Office PO Box 30005 Ottawa, ON K2H 1A3 [email protected] Tel: 613.447.5253 COLLEGE OF REGISTERED
Internet Connectivity Among Aboriginal Communities in Canada
 Internet Connectivity Among Aboriginal Communities in Canada Since its inception the Internet has been the fastest growing and most convenient means to access timely information on just about everything.
2010 National Physician Survey :
 2010 National Physician Survey : Family Physician Usage of Electronic Medical Records Inese Grava-Gubins, Artem Safarov, Jonas Eriksson College of Family Physicians of Canada CAHSPR, Montreal, May 2012
POSTAL OUTLET FILE TECHNICAL SPECIFICATIONS
 POSTAL OUTLET FILE TECHNICAL SPECIFICATIONS February 2014 1 POSTAL OUTLET DATA FILE TECHNICAL SPECIFICATIONS INTRODUCTION The Postal Outlet Data product provides information on postal outlets across Canada.
Municipal Revenue Sources Review Inter jurisdictional Comparison of Revenue Tools
 Municipal Revenue Sources Review Inter jurisdictional Comparison of Revenue Tools August, 2012 Summary of Revenue Tools in Other Provinces Across Canada, local governments have four general tools for revenue
Minimum Wage Rates in Canada: 1965-2015
 Canada Social Report Minimum Wage Rates in Canada: 1965-2015 Ken Battle Copyright 2015 by The Caledon Institute of Social Policy ISBN 1-55382-655-8 Published by: Caledon Institute of Social Policy 1354
SUMMARY OF SERVICES WWW.WHRELOCATIONS.COM
 SUMMARY OF SERVICES WWW.WHRELOCATIONS.COM Features of our Service CUSTOMIZED EXPERT ASSISTANCE FOR ALL YOUR NEEDS National coverage we have an established network of specialists in many major centers in
2016 CARE. Chartered Accountancy Reciprocity Examination
 2016 CARE Chartered Accountancy Reciprocity Examination Information for Applicants Seeking to Qualify as Chartered Professional Accountants, Chartered Accountants and as Public Accountants in Ontario Preface
Where to Study Criminology/Criminal Justice and related fields of study/work in Canada
 Appendix 1 Where to Study Criminology/Criminal Justice and related fields of study/work in Canada A 1995 Statistics Canada Report revealed that not only are employment prospects bleak and getting bleaker
A Snapshot State of the Nation: K- 12 Online Learning in Canada
 A Snapshot State of the Nation: K- 12 Online Learning in Canada Michael K. Barbour, Wayne State University Robin Stewart, Chatham Kent Public Library Background A Snapshot State of the Nation Study: K-12
Pay Statement Guidelines
 The Canadian Payroll Association 1600 250 Bloor Street East Toronto, ON M4W 1E6 Tel: 416-487-3380 Toll-free: 1-800-387-4693 Fax: 416-487-3384 Payroll Infoline: [email protected] Membership: [email protected]
Sprott Flow-Through Limited Partnerships. Sprott Tax-Assisted Investments
 Sprott Flow-Through Limited Partnerships Sprott Tax-Assisted Investments sprott asset management lp Natural resources an essential element of a well-structured investment portfolio Adding natural resource
The state of early childhood education and care in Canada 2012
 movingchildcareforward.ca The state of early childhood education and care in Canada 2012 Carolyn Ferns & Martha Friendly, June 2014 This report provides a snapshot of the state of Canadian ECEC in 2012,
Pharmacist Workforce, 2012 Provincial/Territorial Highlights
 pic pic Pharmacist Workforce, 2012 Provincial/Territorial Highlights Spending and Health Workforce Our Vision Better data. Better decisions. Healthier Canadians. Our Mandate To lead the development and
Ressources humaines et Développement des compétences Canada
 Human Resources and Skills Development Canada PART-TIME STUDENT LOAN AND/OR GRANT APPLICATION CANADA STUDENT LOANS PROGRAM A. PERSONAL DATA Last name Ressources humaines et Développement des compétences
SECTION V. Each jurisdiction s requirements can now be found in this section, including filing requirements/dates and mailing addresses.
 SECTION V Insurers must accommodate for the differences in legislation from jurisdiction to jurisdiction in Canada. Each jurisdiction s requirements can now be found in this section, including filing requirements/dates
taxation Current to June 20, 2013 What s Inside www.bdo.ca
 www.bdo.ca taxation Tax Facts 2013 Current to June 20, 2013 Tax Facts 2013 provides you with a summary of 2013 personal income tax rates and amounts, as well as corporate tax rates (as at July 1, 2013),
PERMANENT RESIDENTS 2014
 PERMANENT RESIDENTS 290,000 280,000 270,000 260,000 250,000 240,000 230,000 220,000 210,000 Permanent Residents in Canada 280,688 260,067 235,823 2004 2005 2006 2007 2008 2009 2010 2011 2012 2013 Economic
Re-Settlers: The Secondary Migration of Immigrants Between Canada s Cities Jack Jedwab Executive Director Association for Canadian Studies
 Re-Settlers: The Secondary Migration of s Between Canada s Cities Jack Jedwab Executive Director Association for Canadian Studies Immigration is an important source of growth for Canada s cities. s tend
How to File the T5 Return of Investment Income
 How to File the T5 Return of Investment Income T4126(E) Rev. 06 Many people who file a T5 information return do not need all of the detailed information we give in our Guide T4015, T5 Guide Return of Investment
ICE CONSULTING INTERNATIONAL HANS R. WUTHRICH Box 1609 Gimli Manitoba Canada R0C 1B0 Fax. 204-642- 9026 Cell. 204-642- 2736
 ICE CONSULTING INTERNATIONAL HANS R. WUTHRICH Box 1609 Gimli Manitoba Canada R0C 1B0 Fax. 204-642- 9026 Cell. 204-642- 2736 HIGHLIGHTS OF QUALIFICATIONS: Power Engineers Certificate - Province of MB Class
Careers in wildlife conservation
 Careers in wildlife conservation If you care about wildlife and wilderness and find science exciting, a career in wildlife conservation could be rewarding. There is still a great deal to be learned about
R esearch report LEVIES, FEES, CHARGES AND TAXES ON NEW HOUSING: 2002 HOUSING AFFORDABILITY AND FINANCE SERIES
 R esearch report LEVIES, FEES, CHARGES AND TAXES ON NEW HOUSING: 2002 HOUSING AFFORDABILITY AND FINANCE SERIES CMHC Home to Canadians Canada Mortgage and Housing Corporation (CMHC) is Canada s national
CANADA S INTERNET PERFORMANCE: NATIONAL, PROVINCIAL AND MUNICIPAL ANALYSIS APRIL 2016
 CANADA S INTERNET PERFORMANCE: NATIONAL, PROVINCIAL AND MUNICIPAL ANALYSIS APRIL 2016 For more information on this report or to request data for your own region, please contact CIRA at [email protected] or
4,500 INTERIOR DESIGN PROFESSIONALS, INCLUDING STUDENTS. At IDC, we know the value that building relationships,
 W E L C O M E At IDC, we know the value that building relationships, strengthening connections, and promoting your brand can bring to your business. IDC, along with our nine provincial associations, represents
Aboriginal People in Canada s Labour Market: Work and Unemployment, Today and Tomorrow
 Aboriginal People in Canada s Labour Market: Work and Unemployment, Today and Tomorrow by Michael Mendelson March 2004 Aboriginal People in Canada s Labour Market: Work and Unemployment, Today and Tomorrow
Employment termination and group insurance coverage
 HEALTH & DENTAL / DISABILITY, LIFE AND AD&D 14-11 Employment termination and group insurance coverage This GroupLine is a revised version of GroupLine 07-02. Previous versions also include 05-21, 02-11
Transferring Pension Credit into the PSPP
 The Public Service Pension Plan (PSPP) participates in transfer agreements with a number of public and private sector pension plans. Transfer agreements allow eligible members to move their pension credit
PEI Population Demographics and Labour Force Statistics
 PEI Population Demographics and Labour Force Statistics PEI Public Service Commission PEI Population Demographics and Labour Force Statistics Diversity Division PEI Public Service Commission November 2010.
Salary Scale Analysis. For Medical Imaging and Radiation Technologists and Therapists
 Salary Scale Analysis For Medical Imaging and Radiation Technologists and Therapists Updated June 2015 Table of Contents 1.0 INTRODUCTION... 1 1.1 SUMMARY... 1 2.0 BRITISH COLUMBIA... 2 2.1 HEABC WAGE
Statistical Portrait of the Frenchspeaking Immigrant Population Outside Quebec (1991-2011)
") Statistical Portrait of the Frenchspeaking Immigrant Population Outside Quebec (1991-2011) René Houle, Daniel Pereira and Jean-Pierre Corbeil Statistics Canada June 2014 Research and Evaluation This project
Statistical Portrait of the Frenchspeaking Immigrant Population Outside Quebec (1991-2011) René Houle, Daniel Pereira and Jean-Pierre Corbeil Statistics Canada June 2014 Research and Evaluation This project
Atlantic Provinces 71 COMMUNITIES
 NATIONAL STUDY OF AUTOMOBILE INSURANCE RATES Third Release Atlantic Provinces 71 COMMUNITIES vs. British Columbia, Alberta Saskatchewan, Manitoba & Ontario 3,985,162 Auto Insurance Rates Compared October
Salary Scale Analysis. For Medical Imaging and Radiation Technologists and Therapists
 Salary Scale Analysis For Medical Imaging and Radiation Technologists and Therapists Updated May 2016 Table of Contents 1.0 INTRODUCTION... 1 1.1 SUMMARY... 1 2.0 BRITISH COLUMBIA... 2 2.1 HEABC WAGE SCALE...
COMPARISON OF ELECTRICITY PRICES IN MAJOR NORTH AMERICAN CITIES. Rates in effect April 1, 2015 0,0272
 COMPARISON OF ELECTRICITY PRICES IN MAJOR NORTH AMERICAN CITIES Rates in effect April 1, 2015 0,0272 TABLE OF CONTENTS INTRODUCTION 3 METHOD 7 HIGHLIGHTS 9 Residential Customers 9 Small-Power Customers
RECOGNIZED HEALTH CARE AIDE PROGRAMS
 RECOGNIZED HEALTH CARE AIDE PROGRAMS CRITERIA USED TO DETERMINE Recognition of Certificate The Health Care Aide Program should have a minimum of 500 hours of combined theory and practicum. The Health Care
Spending on Postsecondary. of Education, Fact Sheet. Education Indicators in Canada. June 2011
 Catalogue no. 81-599-X Issue no. 007 ISSN: 1709-8653 ISBN: 978-1-100-18860-7 Education Indicators in Canada Spending on Postsecondary Education June 2011 Tourism and the Centre for Education Statistics
DISABILITY PENSION (PLUS-related services and benefits)
") DISABILITY PENSION (PLUS-related services and benefits) Serving or Veteran members of the RCMP may be eligible for disability pensions under the Pension Act and related benefits through a process administered
DISABILITY PENSION (PLUS-related services and benefits) Serving or Veteran members of the RCMP may be eligible for disability pensions under the Pension Act and related benefits through a process administered
COMPARISON OF ELECTRICITY PRICES IN MAJOR NORTH AMERICAN CITIES. Rates in effect April 1, 2011
 COMPARISON OF ELECTRICITY PRICES IN MAJOR NORTH AMERICAN CITIES Rates in effect April 1, 2011 Amended November 2011 TABLE OF CONTENTS INTRODUCTION 3 METHOD 7 HIGHLIGHTS 9 Residential Customers 9 Small-Power
The Number of Businesses in Alberta is Gaining Momentum
 ECONOMIC COMMENTARY The Number of Businesses in Alberta is Gaining Momentum Highlights: The number of businesses in Alberta reached record-levels in 2012, with over 154,000 now having at least one employee.
Dear Reader: Presented herewith is the Annual Gaming Report pursuant to Section 56 of the Gaming Control Act for the year ending March 31, 2013.
 Dear Reader: Presented herewith is the Annual Gaming Report pursuant to Section 56 of the Gaming Control Act for the year ending March 31, 2013. The Annual Gaming Report covers the activities of the Alcohol
Article. Work absences in 2011. by Maria Dabboussy and Sharanjit Uppal
 Component of Statistics Canada Catalogue no. 75-001-X Perspectives on Labour and Income Article Work absences in 2011 by Maria Dabboussy and Sharanjit Uppal April 20, 2012 Statistics Canada Statistique
加 拿 大 留 學 中 心 (Foreign Student Services)
") 加 拿 大 留 學 中 心 (Foreign Student Services) 本 中 心 代 辦 的 學 校 - 公 立 中 學 Public Schools 01. Abbotsford School District #34 (Abbotsford) 18. North Vancouver School District #44 (North Vancouver) 02. Burnaby School
加 拿 大 留 學 中 心 (Foreign Student Services) 本 中 心 代 辦 的 學 校 - 公 立 中 學 Public Schools 01. Abbotsford School District #34 (Abbotsford) 18. North Vancouver School District #44 (North Vancouver) 02. Burnaby School
Control and sale of alcoholic beverages, for the year ending March 31, 2013 Released at 8:30 a.m. Eastern time in The Daily, Thursday, April 10, 2014
 Control and sale of alcoholic beverages, for the year ending March 31, 2013 Released at 8:30 a.m. Eastern time in The Daily, Thursday, April 10, 2014 Beer and liquor stores and agencies sold $21.4 billion
Access to Basic Banking Services
 Access to Basic Banking Services Opening a personal deposit account and cashing Government of Canada cheques or other instruments In order to improve access to basic banking services, legislation requires
Financial Recruitment Incentive Programs for Nursing Personnel in Canada
 LEADERSHIP PERSPECTIVE 41 Financial Recruitment Incentive Programs for Nursing Personnel in Canada Maria Mathews, PhD Professor of Health Policy/Health Care Delivery, Division of Community Health and Humanities
NEW CARRIER SIGN UP REQUEST FORM
 Instructions: (Please fax or email the completed documents) [email protected] Fax: 1-855-631-4174 o Fill o Copy o Copy o initial o Insurance out Carrier profile of Common Carrier Authority Company
Living in Alberta. Child Care Cost of Living Education Entertainment Food Items Gasoline Health Care
 Living in Alberta Child Care Cost of Living Education Entertainment Food Items Gasoline Health Care Housing Quality of Life Taxes Transportation Utilities Wages Weather Whitehorse Iqaluit Yellowknife Alberta
West Nile virus National Surveillance Report English Edition September 8 to September 14, 2013 (Report Week 37)
") West Nile virus National Surveillance Report English Edition September to September, (Report Week ) Canada Humans: During surveillance week, the Public Health Agency of Canada (the Agency) was informed
West Nile virus National Surveillance Report English Edition September to September, (Report Week ) Canada Humans: During surveillance week, the Public Health Agency of Canada (the Agency) was informed
Appendix. Value for Money? Teacher Compensation and Student Outcomes in Canada s Six Largest Provinces
 1 Appendix Commentary 434 Appendix Value for Money? Teacher Compensation and Student Outcomes in Canada s Six Largest Provinces Introduction This Appendix contains two additional lines of analysis as robustness
A Demographic and Socio-Economic Portrait of. AboriginAl PoPulAtions in CAnAdA
 A Demographic and Socio-Economic Portrait of AboriginAl PoPulAtions in CAnAdA table of Contents Aboriginal Population (Total)....1 Registered Indian Population....9 Non-Status Indian Population....17 Métis
Occupational Therapists in Canada, 2010 National and Jurisdictional Highlights and Profiles
 Occupational Therapists in Canada, 2010 National and Jurisdictional Highlights and Profiles October 2011 Spending and Health Workforce Who We Are Established in 1994, CIHI is an independent, not-for-profit
Catalogue no. 85-225-X. Police Resources in Canada
 Catalogue no. 85-225-X Resources in Canada 2012 How to obtain more information For information about this product or the wide range of services and data available from Statistics Canada, visit our website,
Control and sale of alcoholic beverages, for the year ending March 31, 2012 Released at 8:30 a.m. Eastern time in The Daily, Thursday, April 11, 2013
 Control and sale of alcoholic beverages, for the year ending March 31, 2012 Released at 8:30 a.m. Eastern time in The Daily, Thursday, April 11, 2013 Beer and liquor stores and agencies sold $20.9 billion
Investment Dealers Association of Canada
 2 Investment Dealers Association of Canada Dual Registration of Life Insurance Agents and Securities Salespersons The respective securities and insurance legislation and governing bodies of each of the
COMPARISON OF ELECTRICITY PRICES IN MAJOR NORTH AMERICAN CITIES. Rates in effect April 1, 2014 0,0272
 COMPARISON OF ELECTRICITY PRICES IN MAJOR NORTH AMERICAN CITIES Rates in effect April 1, 2014 0,0272 TABLE OF CONTENTS INTRODUCTION 3 METHOD 7 HIGHLIGHTS 9 Residential Customers 9 Small-Power Customers
Notices / News Releases
 Chapter 1 Notices / News Releases 1.1 Notices 1.1.1 CSA Staff Notice 45-314 Updated List of Current Exempt Market Initiatives January 28, Introduction CSA Staff Notice 45-314 Updated List of Current CSA
If you have an accident
 LABOUR PROGRAM If you have an accident What to do and how to do it LT-058-03-05 This publication is available in multiple formats (large print, audio cassette, braille and diskette) in English and French.
Ms. Cecilie Lord (Chair) Assistant Deputy Minister Health Strategies Division Alberta Health 10025 Jasper Avenue, 24th Floor Edmonton, AB T5J 2N3
 Assistant Deputy Minister Health Strategies Division Alberta Health 10025 Jasper Avenue, 24th Floor Edmonton, AB T5J 2N3") Ms. Cecilie Lord (Chair) Health Strategies Division 10025 Jasper Avenue, 24th Floor Mr. Ian Potter (Vice-Chair) Health Promotion and Programs Branch Room A1614, 16th Floor Tunney s Pasture (AL1916A) Ms.
Ms. Cecilie Lord (Chair) Health Strategies Division 10025 Jasper Avenue, 24th Floor Mr. Ian Potter (Vice-Chair) Health Promotion and Programs Branch Room A1614, 16th Floor Tunney s Pasture (AL1916A) Ms.