Performance Tools for Parallel Java Environments
|
|
|
- Lora Hoover
- 7 years ago
- Views:
Transcription
1 Performance Tools for Parallel Java Environments Sameer Shende and Allen D. Malony Department of Computer and Information Science, University of Oregon

2 Overview Parallel Java Environments TAU Performance Framework Performance Instrumentation Java Virtual Machine Profiler Interface MPI Profiling Interface Integration of multiple interfaces An Example Performance Measurement Overhead Conclusions Demonstration

3 Parallel Java Environments Java applications use MPI interface for IPC Implementation of mpijava [ JNI C-Wrapper for MPI One-to-One mapping Java<->C MPI Interface Execution of Java bytecode Classic bytecode interpreter JIT Compiler HotSpot JVM Performance Analysis of Multi-Language Applications
![html] JNI C-Wrapper for MPI One-to-One mapping Java<->C MPI Interface Execution of Java](/docs-images/47/20351819/images/page_3.jpg "bytecode Classic bytecode interpreter JIT Compiler HotSpot JVM Performance Analysis of")
4 TAU Performance Framework Tuning and Analysis Utilities (TAU) Execution Model: HPC++ Model of Computation Node Context Thread Multi-level instrumentation facility Modular measurement framework Multiple thread models Access to CPU Performance Counters (PAPI, PCL) Configurable performance profiling and tracing toolkit
 Configurable performance profiling and tracing")
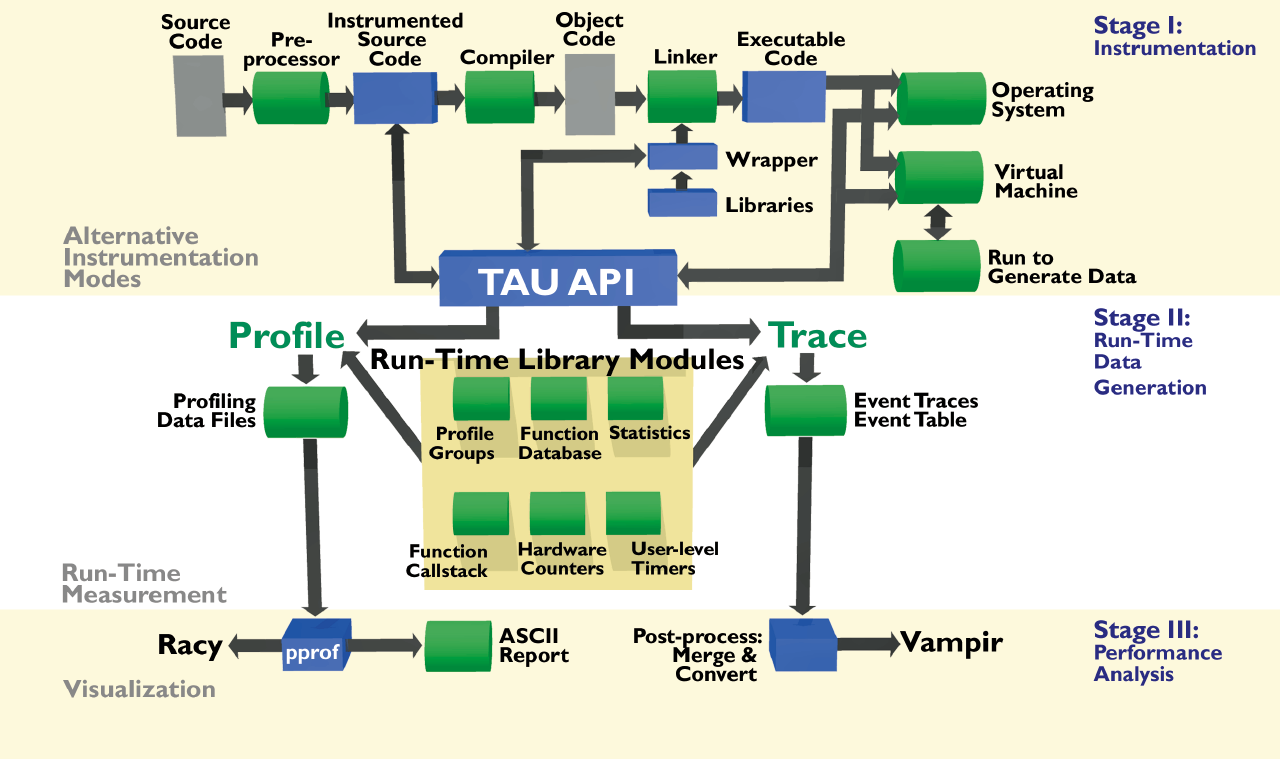
5 Architecture of TAU
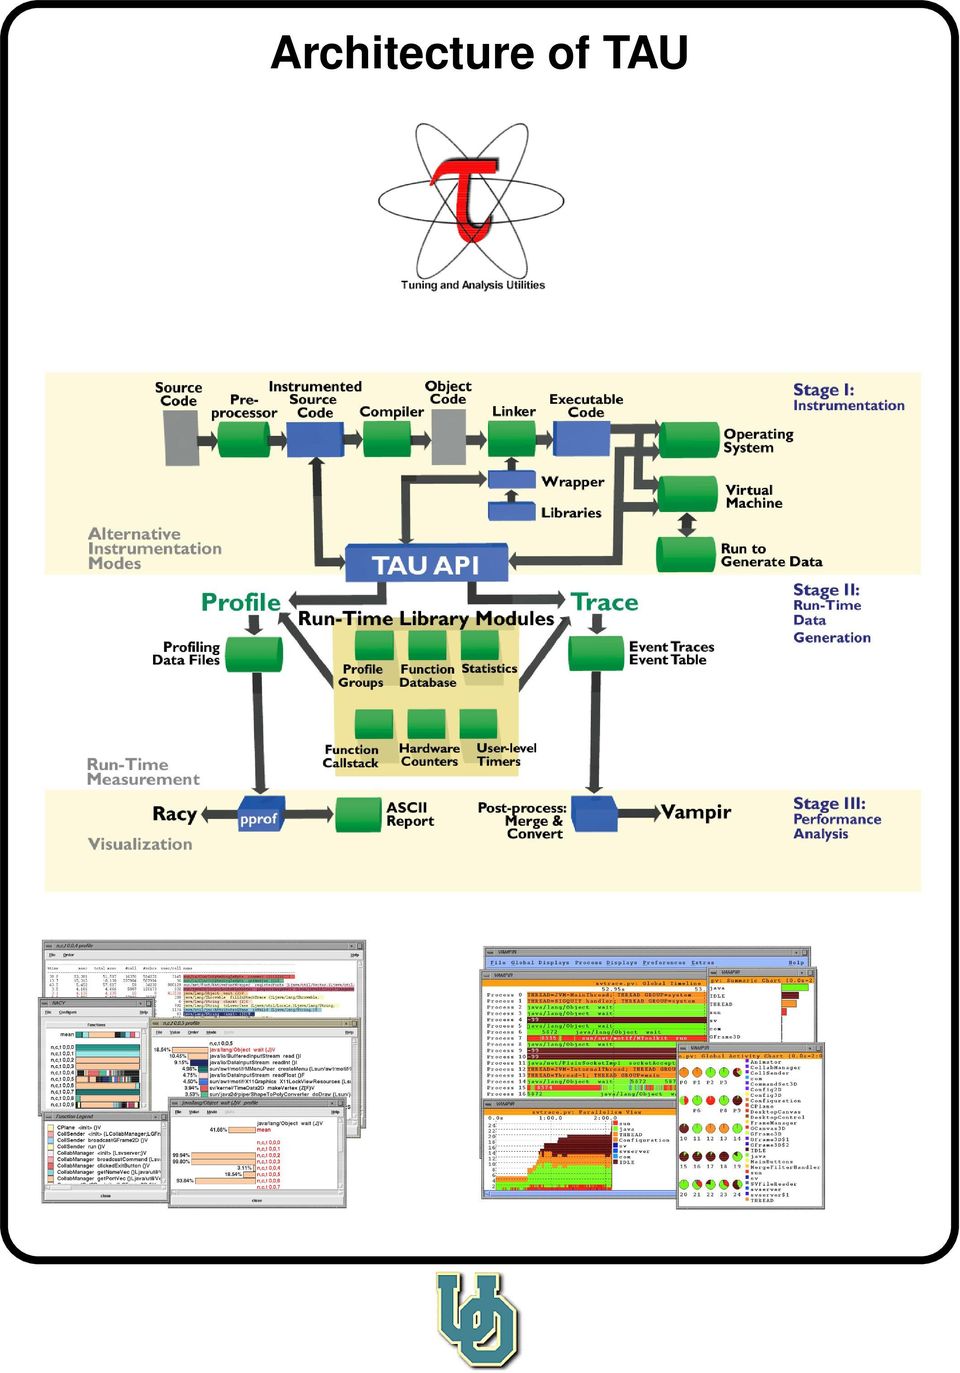
6 Performance Instrumentation Multi-language applications (Java, C++, C, Fortran) Hybrid execution models (Java threads, MPI) JNI/native Java implementations of MPI Java Interface Java Virtual Machine Profiler Interface (JVMPI) Java Native Interface (JNI) MPI Profiling Interlace
 Java Native Interface (JNI) MPI Profiling")
7 Java Virtual Machine Profiler Interface (JVMPI) Profiling Hooks into the Virtual Machine In-process profiling agent instruments Java application No changes to the Java source code, bytecode, or the executable code of the JVM Two-way call interface Profiler agent is a shared object (libtau.so) loaded at runtime Agent registers events to the JVMPI JVMPI notifies events to the agent at runtime Agent uses JNI to invoke JVMPI control routines (mutual exclusion, etc.)
 loaded at runtime Agent registers events to the JVMPI JVMPI notifies events to the agent at runtime Agent uses")
8 JVMPI Events Method transition events triggered at method entry and exits Memory events triggered when an object is allocated, moved, or deleted Heap arena events triggered when an arena is created or destroyed Garbage collection start and finish events Loading and unloading in memory events for classes and compiled methods JNI global and weak global reference allocation and deallocation events Monitor events for contended Java and raw monitors triggered when a thread attempts to enter, actually enters, or exits a monitor that is accessed by more than one thread Monitor wait events triggered when a thread is about to wait or finishes waiting on an object Thread start and end events when a thread starts or stops executing in the virtual machine Events that request a dump or resetting of the profiling data gathered by the in-process profiling agent Virtual machine initialization and shutdown events

9 Agent JVMPI interaction create a daemon thread in the virtual machine enable or disable the notification of an event enable, disable or force a garbage collection in the virtual machine obtain information regarding the current method call stack trace for a given thread obtain the accumulated CPU time consumed by the current thread obtain information about the object where a method took place get or set a pointer-sized thread-local storage data structure that can be used to record per-thread profiling data create or destroy a raw monitor. Raw monitors are not associated with Java objects and can be used by the profiler agent to maintain consistency of multi-threaded profiling data enter, exit or wait on a raw monitor for mutual exclusion. It can also notify all threads that are waiting on a raw monitor or specify a time-out period while waiting resume or suspend a thread exit the virtual machine

10 Integration of Multi-Level Instrumentation APIs JVM Java Program TAU package mpijava package thread API JVMPI event notification JNI TAU MPI Profiling Interface TAU wrapper Native MPI library profile DB Common TAU database for multiple sources

11 Example: Game of Life Profiling % prunjava 4 Life % racy

12 Example Tracing: Visualization in Vampir [ % prunjava 4 Life % tau_merge tautrace*.trc Life.trc % tau_convert -vampir Life.trc tau.edf Life.pv % vampir Life.pv
![de] % prunjava 4 Life % tau_merge tautrace*.](/docs-images/47/20351819/images/page_12.jpg "trc Life.trc % tau_convert -vampir Life.")
13 Dynamic Call-tree Visualization Vampir displays TAU traces

14 Performance Measurement Overhead TAU instrumentation overhead in microseconds Operation Mean Overhead (µsec) Standard Deviation Samples Range (µsec) Method Loading Method Entry Method Exit profiling profiling & tracing profiling profiling & tracing profiling profiling & tracing

15 Conclusions Complex parallel and distributed computing environment Need for observing performance events Requirements for an integrated portable performance analysis environment Constraints imposed by the system Unified JVM vs. native execution performance measurement TAU manages a multi-level, multi-threaded performance instrumentation framework Integrates performance instrumentation TAU is available from:

Integrating TAU With Eclipse: A Performance Analysis System in an Integrated Development Environment
 Integrating TAU With Eclipse: A Performance Analysis System in an Integrated Development Environment Wyatt Spear, Allen Malony, Alan Morris, Sameer Shende {wspear, malony, amorris, sameer}@cs.uoregon.edu
Tuning WebSphere Application Server ND 7.0. Royal Cyber Inc.
 Tuning WebSphere Application Server ND 7.0 Royal Cyber Inc. JVM related problems Application server stops responding Server crash Hung process Out of memory condition Performance degradation Check if the
End-user Tools for Application Performance Analysis Using Hardware Counters
 1 End-user Tools for Application Performance Analysis Using Hardware Counters K. London, J. Dongarra, S. Moore, P. Mucci, K. Seymour, T. Spencer Abstract One purpose of the end-user tools described in
Replication on Virtual Machines
 Replication on Virtual Machines Siggi Cherem CS 717 November 23rd, 2004 Outline 1 Introduction The Java Virtual Machine 2 Napper, Alvisi, Vin - DSN 2003 Introduction JVM as state machine Addressing non-determinism
Garbage Collection in the Java HotSpot Virtual Machine
 http://www.devx.com Printed from http://www.devx.com/java/article/21977/1954 Garbage Collection in the Java HotSpot Virtual Machine Gain a better understanding of how garbage collection in the Java HotSpot
Unified Performance Data Collection with Score-P
 Unified Performance Data Collection with Score-P Bert Wesarg 1) With contributions from Andreas Knüpfer 1), Christian Rössel 2), and Felix Wolf 3) 1) ZIH TU Dresden, 2) FZ Jülich, 3) GRS-SIM Aachen Fragmentation
2015 ej-technologies GmbH. All rights reserved. JProfiler Manual
 2015 ej-technologies GmbH. All rights reserved. JProfiler Manual Index JProfiler help... 8 How to order... 9 A Help topics... 10 A.1 Profiling... 10 A.1.1 Profiling modes... 10 A.1.2 Remote profiling...
Last Class: OS and Computer Architecture. Last Class: OS and Computer Architecture
 Last Class: OS and Computer Architecture System bus Network card CPU, memory, I/O devices, network card, system bus Lecture 3, page 1 Last Class: OS and Computer Architecture OS Service Protection Interrupts
Chapter 3 Operating-System Structures
 Contents 1. Introduction 2. Computer-System Structures 3. Operating-System Structures 4. Processes 5. Threads 6. CPU Scheduling 7. Process Synchronization 8. Deadlocks 9. Memory Management 10. Virtual
Kernel Types System Calls. Operating Systems. Autumn 2013 CS4023
 Operating Systems Autumn 2013 Outline 1 2 Types of 2.4, SGG The OS Kernel The kernel is the central component of an OS It has complete control over everything that occurs in the system Kernel overview
Multi-core Programming System Overview
 Multi-core Programming System Overview Based on slides from Intel Software College and Multi-Core Programming increasing performance through software multi-threading by Shameem Akhter and Jason Roberts,
Performance Tools. Tulin Kaman. tkaman@ams.sunysb.edu. Department of Applied Mathematics and Statistics
 Performance Tools Tulin Kaman Department of Applied Mathematics and Statistics Stony Brook/BNL New York Center for Computational Science tkaman@ams.sunysb.edu Aug 24, 2012 Performance Tools Community Tools:
Chapter 2 System Structures
 Chapter 2 System Structures Operating-System Structures Goals: Provide a way to understand an operating systems Services Interface System Components The type of system desired is the basis for choices
Introduction to the TAU Performance System
 Introduction to the TAU Performance System Leap to Petascale Workshop 2012 at Argonne National Laboratory, ALCF, Bldg. 240,# 1416, May 22-25, 2012, Argonne, IL Sameer Shende, U. Oregon sameer@cs.uoregon.edu
System Structures. Services Interface Structure
 System Structures Services Interface Structure Operating system services (1) Operating system services (2) Functions that are helpful to the user User interface Command line interpreter Batch interface
Profiling and Tracing in Linux
 Profiling and Tracing in Linux Sameer Shende Department of Computer and Information Science University of Oregon, Eugene, OR, USA sameer@cs.uoregon.edu Abstract Profiling and tracing tools can help make
An Oracle White Paper September 2013. Advanced Java Diagnostics and Monitoring Without Performance Overhead
 An Oracle White Paper September 2013 Advanced Java Diagnostics and Monitoring Without Performance Overhead Introduction... 1 Non-Intrusive Profiling and Diagnostics... 2 JMX Console... 2 Java Flight Recorder...
Example of Standard API
 16 Example of Standard API System Call Implementation Typically, a number associated with each system call System call interface maintains a table indexed according to these numbers The system call interface
An Instrumentation Tool for Threaded Java Application Servers
 XIII JORNADAS DE PARALELISMO LLEIDA, SEPTIEMBRE 2002 1 An Instrumentation Tool for Threaded Java Application Servers David Carrera, Jordi Guitart, Jordi Torres, Eduard Ayguadé and Jesús Labarta Abstract
Instrumentation Software Profiling
 Instrumentation Software Profiling Software Profiling Instrumentation of a program so that data related to runtime performance (e.g execution time, memory usage) is gathered for one or more pieces of the
Restraining Execution Environments
 Restraining Execution Environments Segurança em Sistemas Informáticos André Gonçalves Contents Overview Java Virtual Machine: Overview The Basic Parts Security Sandbox Mechanisms Sandbox Memory Native
WebSphere Architect (Performance and Monitoring) 2011 IBM Corporation
 2011 IBM Corporation") Track Name: Application Infrastructure Topic : WebSphere Application Server Top 10 Performance Tuning Recommendations. Presenter Name : Vishal A Charegaonkar WebSphere Architect (Performance and Monitoring)
Track Name: Application Infrastructure Topic : WebSphere Application Server Top 10 Performance Tuning Recommendations. Presenter Name : Vishal A Charegaonkar WebSphere Architect (Performance and Monitoring)
Trace-Based and Sample-Based Profiling in Rational Application Developer
 Trace-Based and Sample-Based Profiling in Rational Application Developer This document is aimed at highlighting the importance of profiling in software development and talks about the profiling tools offered
Oracle JRockit Mission Control Overview
 Oracle JRockit Mission Control Overview An Oracle White Paper June 2008 JROCKIT Oracle JRockit Mission Control Overview Oracle JRockit Mission Control Overview...3 Introduction...3 Non-intrusive profiling
JVM Tool Interface. Michal Pokorný
 JVM Tool Interface Michal Pokorný JVM TI Inspect & control execution on JVM (profiling, debugging, monitoring, thread analysis, coverage, ) Higher-level interface: Java Platform Debugger Architecture JVM
CSCI E 98: Managed Environments for the Execution of Programs
 CSCI E 98: Managed Environments for the Execution of Programs Draft Syllabus Instructor Phil McGachey, PhD Class Time: Mondays beginning Sept. 8, 5:30-7:30 pm Location: 1 Story Street, Room 304. Office
Improving Time to Solution with Automated Performance Analysis
 Improving Time to Solution with Automated Performance Analysis Shirley Moore, Felix Wolf, and Jack Dongarra Innovative Computing Laboratory University of Tennessee {shirley,fwolf,dongarra}@cs.utk.edu Bernd
Online Performance Observation of Large-Scale Parallel Applications
 1 Online Observation of Large-Scale Parallel Applications Allen D. Malony and Sameer Shende and Robert Bell {malony,sameer,bertie}@cs.uoregon.edu Department of Computer and Information Science University
Java Troubleshooting and Performance
 Java Troubleshooting and Performance Margus Pala Java Fundamentals 08.12.2014 Agenda Debugger Thread dumps Memory dumps Crash dumps Tools/profilers Rules of (performance) optimization 1. Don't optimize
Effective Java Programming. efficient software development
 Effective Java Programming efficient software development Structure efficient software development what is efficiency? development process profiling during development what determines the performance of
Zing Vision. Answering your toughest production Java performance questions
 Zing Vision Answering your toughest production Java performance questions Outline What is Zing Vision? Where does Zing Vision fit in your Java environment? Key features How it works Using ZVRobot Q & A
IBM SDK, Java Technology Edition Version 1. IBM JVM messages IBM
 IBM SDK, Java Technology Edition Version 1 IBM JVM messages IBM IBM SDK, Java Technology Edition Version 1 IBM JVM messages IBM Note Before you use this information and the product it supports, read the
Review of Performance Analysis Tools for MPI Parallel Programs
 Review of Performance Analysis Tools for MPI Parallel Programs Shirley Moore, David Cronk, Kevin London, and Jack Dongarra Computer Science Department, University of Tennessee Knoxville, TN 37996-3450,
HeapStats: Your Dependable Helper for Java Applications, from Development to Operation
 : Technologies for Promoting Use of Open Source Software that Contribute to Reducing TCO of IT Platform HeapStats: Your Dependable Helper for Java Applications, from Development to Operation Shinji Takao,
A Scalable Approach to MPI Application Performance Analysis
 A Scalable Approach to MPI Application Performance Analysis Shirley Moore 1, Felix Wolf 1, Jack Dongarra 1, Sameer Shende 2, Allen Malony 2, and Bernd Mohr 3 1 Innovative Computing Laboratory, University
Performance Measurement of Dynamically Compiled Java Executions
 Performance Measurement of Dynamically Compiled Java Executions Tia Newhall and Barton P. Miller University of Wisconsin Madison Madison, WI 53706-1685 USA +1 (608) 262-1204 {newhall,bart}@cs.wisc.edu
Apache Jakarta Tomcat
 Apache Jakarta Tomcat 20041058 Suh, Junho Road Map 1 Tomcat Overview What we need to make more dynamic web documents? Server that supports JSP, ASP, database etc We concentrates on Something that support
NVIDIA Tools For Profiling And Monitoring. David Goodwin
 NVIDIA Tools For Profiling And Monitoring David Goodwin Outline CUDA Profiling and Monitoring Libraries Tools Technologies Directions CScADS Summer 2012 Workshop on Performance Tools for Extreme Scale
Holly Cummins IBM Hursley Labs. Java performance not so scary after all
 Holly Cummins IBM Hursley Labs Java performance not so scary after all So... You have a performance problem. What next? Goals After this talk you will: Not feel abject terror when confronted with a performance
OPERATING SYSTEM SERVICES
 OPERATING SYSTEM SERVICES USER INTERFACE Command line interface(cli):uses text commands and a method for entering them Batch interface(bi):commands and directives to control those commands are entered
Using jvmstat and visualgc to Solve Memory Management Problems
 Using jvmstat and visualgc to Solve Memory Management Problems java.sun.com/javaone/sf 1 Wally Wedel Sun Software Services Brian Doherty Sun Microsystems, Inc. Analyze JVM Machine Memory Management Problems
11.1 inspectit. 11.1. inspectit
 11.1. inspectit Figure 11.1. Overview on the inspectit components [Siegl and Bouillet 2011] 11.1 inspectit The inspectit monitoring tool (website: http://www.inspectit.eu/) has been developed by NovaTec.
Java Garbage Collection Basics
 Java Garbage Collection Basics Overview Purpose This tutorial covers the basics of how Garbage Collection works with the Hotspot JVM. Once you have learned how the garbage collector functions, learn how
JRastro: A Trace Agent for Debugging Multithreaded and Distributed Java Programs
 JRastro: A Trace Agent for Debugging Multithreaded and Distributed Java Programs Gabriela Jacques da Silva 1, Lucas Mello Schnorr 1, Benhur de Oliveira Stein 1 1 Laboratório de Sistemas de Computação Universidade
Jonathan Worthington Scarborough Linux User Group
 Jonathan Worthington Scarborough Linux User Group Introduction What does a Virtual Machine do? Hides away the details of the hardware platform and operating system. Defines a common set of instructions.
General Introduction
 Managed Runtime Technology: General Introduction Xiao-Feng Li (xiaofeng.li@gmail.com) 2012-10-10 Agenda Virtual machines Managed runtime systems EE and MM (JIT and GC) Summary 10/10/2012 Managed Runtime
Tool - 1: Health Center
 Tool - 1: Health Center Joseph Amrith Raj http://facebook.com/webspherelibrary 2 Tool - 1: Health Center Table of Contents WebSphere Application Server Troubleshooting... Error! Bookmark not defined. About
Port of the Java Virtual Machine Kaffe to DROPS by using L4Env
 Port of the Java Virtual Machine Kaffe to DROPS by using L4Env Alexander Böttcher ab764283@os.inf.tu-dresden.de Technische Universität Dresden Faculty of Computer Science Operating System Group July 2004
Performance Technology for Parallel and Distributed Component Software
 Performance Technology for Parallel and Distributed Component Software A. Malony, S. Shende, N. Trebon, J. Ray, R. Armstrong, C. Rasmussen, and M. Sottile Department of Computer and Information Science,
Characteristics of Java (Optional) Y. Daniel Liang Supplement for Introduction to Java Programming
 Y. Daniel Liang Supplement for Introduction to Java Programming") Characteristics of Java (Optional) Y. Daniel Liang Supplement for Introduction to Java Programming Java has become enormously popular. Java s rapid rise and wide acceptance can be traced to its design
Characteristics of Java (Optional) Y. Daniel Liang Supplement for Introduction to Java Programming Java has become enormously popular. Java s rapid rise and wide acceptance can be traced to its design
Application Performance Analysis Tools and Techniques
 Mitglied der Helmholtz-Gemeinschaft Application Performance Analysis Tools and Techniques 2012-06-27 Christian Rössel Jülich Supercomputing Centre c.roessel@fz-juelich.de EU-US HPC Summer School Dublin
Mobile Application Languages XML, Java, J2ME and JavaCard Lesson 04 Java
 Mobile Application Languages XML, Java, J2ME and JavaCard Lesson 04 Java Oxford University Press 2007. All rights reserved. 1 C and C++ C and C++ with in-line-assembly, Visual Basic, and Visual C++ the
PTC System Monitor Solution Training
 PTC System Monitor Solution Training Patrick Kulenkamp June 2012 Agenda What is PTC System Monitor (PSM)? How does it work? Terminology PSM Configuration The PTC Integrity Implementation Drilling Down
B M C S O F T W A R E, I N C. BASIC BEST PRACTICES. Ross Cochran Principal SW Consultant
 B M C S O F T W A R E, I N C. PATROL FOR WEBSPHERE APPLICATION SERVER BASIC BEST PRACTICES Ross Cochran Principal SW Consultant PAT R O L F O R W E B S P H E R E A P P L I C AT I O N S E R V E R BEST PRACTICES
Object Instance Profiling
 Object Instance Profiling Lubomír Bulej 1,2, Lukáš Marek 1, Petr Tůma 1 Technical report No. 2009/7, November 2009 Version 1.0, November 2009 1 Distributed Systems Research Group, Department of Software
Study of Realized Mehtod on a Java Web Server Monitoring System
 DOI: 10.7763/IPEDR. 2012. V49. 14 Study of Realized Mehtod on a Java Web Server Monitoring System Kun Liu 1, Hai-yan Zhao 1, Long-jiang Dong 2 and Li-juan Du 1 1 College of Oriental Application & Technology,
What s Cool in the SAP JVM (CON3243)
") What s Cool in the SAP JVM (CON3243) Volker Simonis, SAP SE September, 2014 Public Agenda SAP JVM Supportability SAP JVM Profiler SAP JVM Debugger 2014 SAP SE. All rights reserved. Public 2 SAP JVM SAP
What s Cool in the SAP JVM (CON3243) Volker Simonis, SAP SE September, 2014 Public Agenda SAP JVM Supportability SAP JVM Profiler SAP JVM Debugger 2014 SAP SE. All rights reserved. Public 2 SAP JVM SAP
Fachbereich Informatik und Elektrotechnik SunSPOT. Ubiquitous Computing. Ubiquitous Computing, Helmut Dispert
 Ubiquitous Computing Ubiquitous Computing The Sensor Network System Sun SPOT: The Sun Small Programmable Object Technology Technology-Based Wireless Sensor Networks a Java Platform for Developing Applications
Interpreters and virtual machines. Interpreters. Interpreters. Why interpreters? Tree-based interpreters. Text-based interpreters
 Interpreters and virtual machines Michel Schinz 2007 03 23 Interpreters Interpreters Why interpreters? An interpreter is a program that executes another program, represented as some kind of data-structure.
Cloud Computing. Up until now
 Cloud Computing Lecture 11 Virtualization 2011-2012 Up until now Introduction. Definition of Cloud Computing Grid Computing Content Distribution Networks Map Reduce Cycle-Sharing 1 Process Virtual Machines
A Thread Monitoring System for Multithreaded Java Programs
 A Thread Monitoring System for Multithreaded Java Programs Sewon Moon and Byeong-Mo Chang Department of Computer Science Sookmyung Women s University, Seoul 140-742, Korea wonsein@nate.com, chang@sookmyung.ac.kr
Mobile Devices - An Introduction to the Android Operating Environment. Design, Architecture, and Performance Implications
 Mobile Devices - An Introduction to the Android Operating Environment Design, Architecture, and Performance Implications Dominique A. Heger DHTechnologies (DHT) dheger@dhtusa.com 1.0 Introduction With
Mission-Critical Java. An Oracle White Paper Updated October 2008
 Mission-Critical Java An Oracle White Paper Updated October 2008 Mission-Critical Java The Oracle JRockit family of products is a comprehensive portfolio of Java runtime solutions that leverages the base
Resource Utilization of Middleware Components in Embedded Systems
 Resource Utilization of Middleware Components in Embedded Systems 3 Introduction System memory, CPU, and network resources are critical to the operation and performance of any software system. These system
How To Use Java On An Ipa 2.2.2 (Jspa) With A Microsoft Powerbook (Jempa) With An Ipad 2.3.2 And A Microos 2.5 (Microos)
 With A Microsoft Powerbook (Jempa) With An Ipad 2.3.2 And A Microos 2.5 (Microos)") Java Monitoring and Diagnostic Tooling Iris Baron IBM Java JIT on System Z ibaron@ca.ibm.com Session ID: 16182 Insert Custom Session QR if Desired. Java Road Map Java 7.0 Language Updates Java 6.0 SE 5.0
Java Monitoring and Diagnostic Tooling Iris Baron IBM Java JIT on System Z ibaron@ca.ibm.com Session ID: 16182 Insert Custom Session QR if Desired. Java Road Map Java 7.0 Language Updates Java 6.0 SE 5.0
Performance technology for parallel and distributed component software
 CONCURRENCY AND COMPUTATION: PRACTICE AND EXPERIENCE Concurrency Computat.: Pract. Exper. 2005; 17:117 141 Published online in Wiley InterScience (www.interscience.wiley.com). DOI: 10.1002/cpe.931 Performance
Performance Analysis Tools For Parallel Java Applications on Shared-memory Systems
 Performance Analysis Tools For Parallel Java Applications on Shared-memory Systems Jordi Guitart, Jordi Torres, Eduard Ayguadé European Center for Parallelism of Barcelona (CEPBA) Computer Architecture
PC Based Escape Analysis in the Java Virtual Machine
 PC Based Escape Analysis in the Java Virtual Machine Manfred Jendrosch, Gerhard W. Dueck, Charlie Gracie, and AndréHinkenjann Abstract Current computer architectures are multi-threaded and make use of
Chapter 6 Concurrent Programming
 Chapter 6 Concurrent Programming Outline 6.1 Introduction 6.2 Monitors 6.2.1 Condition Variables 6.2.2 Simple Resource Allocation with Monitors 6.2.3 Monitor Example: Circular Buffer 6.2.4 Monitor Example:
Universidad Simón Bolívar
 Cardinale, Yudith Figueira, Carlos Hernández, Emilio Baquero, Eduardo Berbín, Luis Bouza, Roberto Gamess, Eric García, Pedro Universidad Simón Bolívar In 1999, a couple of projects from USB received funding
Comprehensive Profiling Support in the Java Virtual Machine
 THE ADVANCED COMPUTING SYSTEMS ASSOCIATION The following paper was originally published in the 5 th USENIX Conference on Object-Oriented Technologies and Systems (COOTS '99) San Diego, California, USA,
Last Class: OS and Computer Architecture. Last Class: OS and Computer Architecture
 Last Class: OS and Computer Architecture System bus Network card CPU, memory, I/O devices, network card, system bus Lecture 3, page 1 Last Class: OS and Computer Architecture OS Service Protection Interrupts
2 Introduction to Java. Introduction to Programming 1 1
 2 Introduction to Java Introduction to Programming 1 1 Objectives At the end of the lesson, the student should be able to: Describe the features of Java technology such as the Java virtual machine, garbage
Chapter 3: Operating-System Structures. Common System Components
 Chapter 3: Operating-System Structures System Components Operating System Services System Calls System Programs System Structure Virtual Machines System Design and Implementation System Generation 3.1
Agent Languages. Overview. Requirements. Java. Tcl/Tk. Telescript. Evaluation. Artificial Intelligence Intelligent Agents
 Agent Languages Requirements Overview Java Tcl/Tk Telescript Evaluation Franz J. Kurfess, Cal Poly SLO 211 Requirements for agent Languages distributed programming large-scale (tens of thousands of computers)
Eclipse Visualization and Performance Monitoring
 Eclipse Visualization and Performance Monitoring Chris Laffra IBM Ottawa Labs http://eclipsefaq.org/chris Chris Laffra Eclipse Visualization and Performance Monitoring Page 1 Roadmap Introduction Introspection
Effective Java Programming. measurement as the basis
 Effective Java Programming measurement as the basis Structure measurement as the basis benchmarking micro macro profiling why you should do this? profiling tools Motto "We should forget about small efficiencies,
Java VM monitoring and the Health Center API. William Smith will.smith@uk.ibm.com
 Java VM monitoring and the Health Center API William Smith will.smith@uk.ibm.com Health Center overview What problem am I solving? What is my JVM doing? Is everything OK? Why is my application running
DB2 Connect for NT and the Microsoft Windows NT Load Balancing Service
 DB2 Connect for NT and the Microsoft Windows NT Load Balancing Service Achieving Scalability and High Availability Abstract DB2 Connect Enterprise Edition for Windows NT provides fast and robust connectivity
JBoss Cookbook: Secret Recipes. David Chia Senior TAM, JBoss May 5 th 2011
 JBoss Cookbook: Secret Recipes David Chia Senior TAM, JBoss May 5 th 2011 Secret Recipes Byteman Cluster and Load Balancing Configuration Generator Troubleshooting High CPU Mocking a JBoss Hang State Byte
Practical Performance Understanding the Performance of Your Application
 Neil Masson IBM Java Service Technical Lead 25 th September 2012 Practical Performance Understanding the Performance of Your Application 1 WebSphere User Group: Practical Performance Understand the Performance
Graylog2 Lennart Koopmann, OSDC 2014. @_lennart / www.graylog2.org
 Graylog2 Lennart Koopmann, OSDC 2014 @_lennart / www.graylog2.org About me 25 years old Living in Hamburg, Germany @_lennart on Twitter Co-Founder of TORCH - The Graylog2 company. Graylog2 history Started
Java Virtual Machine: the key for accurated memory prefetching
 Java Virtual Machine: the key for accurated memory prefetching Yolanda Becerra Jordi Garcia Toni Cortes Nacho Navarro Computer Architecture Department Universitat Politècnica de Catalunya Barcelona, Spain
ELEC 377. Operating Systems. Week 1 Class 3
 Operating Systems Week 1 Class 3 Last Class! Computer System Structure, Controllers! Interrupts & Traps! I/O structure and device queues.! Storage Structure & Caching! Hardware Protection! Dual Mode Operation
GPU Profiling with AMD CodeXL
 GPU Profiling with AMD CodeXL Software Profiling Course Hannes Würfel OUTLINE 1. Motivation 2. GPU Recap 3. OpenCL 4. CodeXL Overview 5. CodeXL Internals 6. CodeXL Profiling 7. CodeXL Debugging 8. Sources
Online Recruitment System 1. INTRODUCTION
 1. INTRODUCTION This project Online Recruitment System is an online website in which jobseekers can register themselves online and apply for job and attend the exam. Online Recruitment System provides
PERFORMANCE ENHANCEMENTS IN TreeAge Pro 2014 R1.0
 PERFORMANCE ENHANCEMENTS IN TreeAge Pro 2014 R1.0 15 th January 2014 Al Chrosny Director, Software Engineering TreeAge Software, Inc. achrosny@treeage.com Andrew Munzer Director, Training and Customer
A Pattern-Based Approach to. Automated Application Performance Analysis
 A Pattern-Based Approach to Automated Application Performance Analysis Nikhil Bhatia, Shirley Moore, Felix Wolf, and Jack Dongarra Innovative Computing Laboratory University of Tennessee (bhatia, shirley,
Performance Monitoring and Visualization of Large-Sized and Multi- Threaded Applications with the Pajé Framework
 Performance Monitoring and Visualization of Large-Sized and Multi- Threaded Applications with the Pajé Framework Mehdi Kessis France Télécom R&D {Mehdi.kessis}@rd.francetelecom.com Jean-Marc Vincent Laboratoire
Data Structure Oriented Monitoring for OpenMP Programs
 A Data Structure Oriented Monitoring Environment for Fortran OpenMP Programs Edmond Kereku, Tianchao Li, Michael Gerndt, and Josef Weidendorfer Institut für Informatik, Technische Universität München,
Techniques for Real-System Characterization of Java Virtual Machine Energy and Power Behavior
 Techniques for Real-System Characterization of Java Virtual Machine Energy and Power Behavior Gilberto Contreras Margaret Martonosi Department of Electrical Engineering Princeton University 1 Why Study
PAPI - PERFORMANCE API. ANDRÉ PEREIRA ampereira@di.uminho.pt
 1 PAPI - PERFORMANCE API ANDRÉ PEREIRA ampereira@di.uminho.pt 2 Motivation Application and functions execution time is easy to measure time gprof valgrind (callgrind) It is enough to identify bottlenecks,
Experiences and Lessons Learned with a Portable Interface to Hardware Performance Counters
 Experiences and Lessons Learned with a Portable Interface to Hardware Performance Counters Jack Dongarra Kevin London Shirley Moore Philip Mucci Daniel Terpstra Haihang You Min Zhou University of Tennessee
Debugging Java performance problems. Ryan Matteson matty91@gmail.com http://prefetch.net
 Debugging Java performance problems Ryan Matteson matty91@gmail.com http://prefetch.net Overview Tonight I am going to discuss Java performance, and how opensource tools can be used to debug performance
An Implementation of the POMP Performance Monitoring Interface for OpenMP Based on Dynamic Probes
 An Implementation of the POMP Performance Monitoring Interface for OpenMP Based on Dynamic Probes Luiz DeRose Bernd Mohr Seetharami Seelam IBM Research Forschungszentrum Jülich University of Texas ACTC
Performance Improvement In Java Application
 Performance Improvement In Java Application Megha Fulfagar Accenture Delivery Center for Technology in India Accenture, its logo, and High Performance Delivered are trademarks of Accenture. Agenda Performance
Operating Systems and Networks
 recap Operating Systems and Networks How OS manages multiple tasks Virtual memory Brief Linux demo Lecture 04: Introduction to OS-part 3 Behzad Bordbar 47 48 Contents Dual mode API to wrap system calls
Complete Instrumentation Requirements for Performance Analysis of Web Based Technologies
 Complete Instrumentation Requirements for Performance Analysis of Web Based Technologies David Carrera Jordi Guitart Jordi Torres Eduard Ayguadé Jesús Labarta European Center for Parallelism of Barcelona
PART IV Performance oriented design, Performance testing, Performance tuning & Performance solutions. Outline. Performance oriented design
 PART IV Performance oriented design, Performance testing, Performance tuning & Performance solutions Slide 1 Outline Principles for performance oriented design Performance testing Performance tuning General
Application Performance Monitoring: Trade-Off between Overhead Reduction and Maintainability
 Application Performance Monitoring: Trade-Off between Overhead Reduction and Maintainability Jan Waller, Florian Fittkau, and Wilhelm Hasselbring 2014-11-27 Waller, Fittkau, Hasselbring Application Performance