B M C S O F T W A R E, I N C. BASIC BEST PRACTICES. Ross Cochran Principal SW Consultant
|
|
|
- Samantha Jenkins
- 10 years ago
- Views:
Transcription
1 B M C S O F T W A R E, I N C. PATROL FOR WEBSPHERE APPLICATION SERVER BASIC BEST PRACTICES Ross Cochran Principal SW Consultant

2 PAT R O L F O R W E B S P H E R E A P P L I C AT I O N S E R V E R BEST PRACTICES INTRO DU CTION This paper will cover the best practices for PATROL for WebSphere Application Server. The paper assumes the reader understands J2EE concepts and terms. New and veteran users of PATROL for WebSphere Application Server will see the basic aspects of J2EE runtime environment management in this paper. First lets cover the basics of a J2EE transaction. An end user will request information from a browser. If the request is for a static HTML document, the request will be handled by the HTTP (Web) server. If the request is for a dynamically made HTML document, the HTTP server will pass the request to the WebSphere Application Server (WAS). The WAS will be running inside of a Java Virtual Machine (JVM). (The JVM will be consuming CPU cycles and memory while handling the request for the dynamically made HTML document). The WAS will pass the request to a servlet. The servlet may ask an Enterprise Java Bean (EJB) for information from a database or the servlet may lookup the information itself. Once all the information is ready for presentation back to the browser-based user, the servlet passes the information to the Java Server Page (JSP). The JSP will pass the dynamically created HTML document back to the HTTP server for eventual delivery to the end user. This is how it works and it works perfectly every time, right? Not exactly, that is why BMC Software developed PATROL for WebSphere Application Server, for when things do not go perfect. This paper will cover how to manage some of the primary components of The WebSphere Application Server with PATROL. It will not cover the other mentioned components of a J2EE transaction such as browsers, networks, and HTTP servers. BMC Software has management solutions for these areas but they are not discussed here. This paper also will not cover advanced J2EE techniques such as profiling, JAVA Management Extensions (JMX), and byte-code instrumentation. Before the individual components of WebSphere are discussed, here are a few limitations of managing WebSphere. These items apply to any J2EE WebSphere Application Server based application. Some J2EE applications are so poorly written, no amount of tuning and management will make them run better You can not improve what you can not measure Make your HTTP (Web) servers do as much work as possible. This will keep unnecessary work off your WebSphere Application Server. In other words, do not have servlets and JSPs serving up static content pages.
 server.")
3 JVM memory is like money there is never enough Now we understand the limitations of managing WebSphere. We ask ourselves, what parts of WebSphere can I manage? The remainder of this paper will cover the best practices of using PATROL for WebSphere Application Server to manage The WebSphere Application Server. The primary areas of interest are: Memory How much memory is available or being used by the JVM Servlets These will govern the overall control of a J2EE transaction Threads The JVM allocates a finite number of threads for work EJBs These will control the business logic of a J2EE transaction WAS logs Where to look when a J2EE transaction generates error messages. HTTP Sessions Used to maintain the relationship between a given user s browser and their WAS session.

4 MEMORY Programming in JAVA is not like many other application programming languages. In the other languages, your code is compiled into machine language; whereas with JAVA, your code is still compiled, but it is not compiled into machine language. JAVA code is compiled into language the JVM will execute. JAVA compiled code does not run natively on the operating system, but on the JVM. This requires the JVM to allocate memory (called the heap ) from the operating system for two reasons: 1. To run the JVM 2. To run JAVA programs Another reason JAVA is different from other programming languages is the J2EE specification allows a JAVA programmer to not manage memory. In other traditional programming languages, memory management (allocating and freeing memory) is the responsibility of the application programmer. However with JAVA, this is the responsibility of the JVM. Keeping the above two reasons for JVM memory management in mind, lets look at how PATROL for WebSphere manages the memory (heap size) of the JVM.
 from the operating system for two reasons: 1. To run the JVM 2.")

5 The Total Memory parameter is the total amount of memory allocated by the JVM from the operating system at that moment in time. This parameter is not the maximum possible heap size. The parameter is important because it is all the memory the JVM will have unless the JVM allocates more from the operating system. You also should consider this parm should not exceed the physical memory of the system. If this parm is near the total system memory installed, the operating system itself will not have any memory to run. Access the parameter from the WebSphere icon JVM server icon Server Resources Total Memory. This parameter is updated every five minutes.

6 The Free Memory parameter is the amount of memory (in MB) of the currently allocated heap size that the JVM has remaining to use. This parameter is important because if the JVM runs out of memory the JVM could stop running. If this parameter is zero, you could have a problem with Garbage Collection (see discussion later in this paper) or have a problem with a JAVA application not freeing up memory/objects (known to many as a memory leak). Important note: The JVM can automatically allocate more memory from the operating system; assuming the JVM has not reached the maximum amount of memory allowable for allocation from the operating system. See the next parm (Percent Memory Used) for more details. For example, the chart below shows the JVM has MB of memory free. Access the parameter from the WebSphere icon JVM server icon Server Resources Free Memory. This parameter is updated every five minutes. A traditional graph of this parm will move toward zero followed by a sharp/steep increase. Normally this sharp/steep increase is because Garbage Collection has occurred recently. The result is a graph below that resembles a saw blade.
.")

7 The Percent Memory Used parameter is the current percentage of memory used inside the JVM based upon the maximum possible heap size. JVMs will allocate memory throughout time, but only allocate up to the maximum heap size. The maximum heap size is specified at JVM startup time and cannot be changed while the JVM is running. So it is important to know of all the memory that is being used based on the possible maximum heap size. Hint 100% equals the maximum possible allocated heap size Not 100% of the currently allocated heap size. For example, the chart below shows % of the total possible JVM memory is in use. To determine the MB value represented by %, review your JVM startup parms for the maximum heap size. Then take % of that maximum heap size to determine the Mbytes currently used by the JVM. Access the parameter from the WebSphere icon JVM server icon Server Resources Percent Memory Used. This parameter is updated every five minutes.

8 The Garbage Collection Duration is the parameter that displays the average amount of time (over the given discovery cycle) the JVM spent cleaning up unused portions of memory. Remember the JVM is in charge of gathering up and reusing free memory because the J2EE specification frees the JAVA programmer from that task. Garbage collection is the process of the JVM that frees unused portions of memory and returns the portions to the heap size. Garbage collection is good and bad. It is good because it gives the JVM more memory for the JVM heap. It is bad because the JVM tends to slow down J2EE transactions during Garbage Collection. This makes Garbage Collection a balancing act ; if Garbage Collection does not happen, then the JVM runs out of memory. If Garbage Collection happens to often or takes too long, your JAVA programs will slow down. The Garbage Collection Duration should start small and grow over time (this is because initially the JVM does not have a lot of memory to free up). As a rule of thumb, if your JVM is spending more than 5% of the time in garbage collection, you may have a problem. In the chart below, assuming the Garbage Collection Duration is collected every 5 minutes (300 seconds), a good warning level for this parm would be 15 seconds. Access the parameter from the WebSphere icon JVM server icon Server Resources Garbage Collection Duration. This parameter is updated every five minutes.

.")
9 SERVLETS The Servlet Response Time is the parameter (in milliseconds) that displays average response time of the servlets. This parameter is important because a given servlet could be waiting indefinitely on a backend resource (such as a DB). Some JAVA programmers may not code a finite amount of time to wait before timing out the servlet s request to a DB. Additionally if there are other servlets accessing the same non-responsive DB, then the JVM will be allocating a thread for each of these non-respsponsive servlets. The possible result is the JVM will start to run out of threads. This will eventually result in a frozen web site. (See the Threads portion of this paper for debugging thread problems.) By managing the servlet response time you can prevent a potential thread resource problem in the JVM. Access the parameter from the WebSphere icon JVM server icon Web Modules Select targeted servlet Summary Servlet Response Time. This parameter is updated every five minutes.

 and the number of requests goes to zero, this could be an indication")
10 The Servlet Total Requests parameter tracks the number of request processed by the servlet during the collection interval. This parameter is important because if you know a given servlet is normally passing requests continually (such as a login servlet) and the number of requests goes to zero, this could be an indication of some problem outside of the JVM (such as the HTTP server out of listeners or a network outage). It could also be an indication a servlet is waiting on a backend DB request. If the chart below was for a normally busy servlet, the time from 11:45 to 13:15 is suspicious (because of no servlet request). It could be all outstanding servlet requests are hanging up waiting on a resource. Check the previous Servlet Response Time parameter from 11:45 to 13:15 for a bottleneck in servlets processing requests. Access the parameter from the WebSphere icon JVM server icon Web Modules Select targeted servlet Select your object Servlet Total Request. This parameter is updated every five minutes.
.")
 may not be releasing objects when it is through with them.")
11 TH READS The Thread Objects parameter shows the number of objects being used by JVM threads at the end of the collection cycle. This parameter is important because a growing value could indicate an application(s) may not be releasing objects when it is through with them. Eventually this type of problem could result in a JVM memory problem. Remember the JVM allocates memory (heap) for each used object. Access the parameter from the WebSphere icon JVM server icon Server Resources Threads Objects. This parameter is updated every five minutes.
 for each used object.")

12 The Thread Percent Maxed parameter shows the average percent of time the usage of the thread pool reached 100%. This parameter is important because the JVM cannot run out of threads. If it runs out of threads, all new servlet and JSP requests will stop. Yes, the JVM can dynamically add more threads, but only to the point of the maximum thread pool size (The maximum thread pool size is set at JVM initiation.) The result is you need to know what portion of the possible thread pool the JVM has been consumed. Increasing the maximum thread pool size is not always the answer. Eventually some number of threads will cause the JVM to request resources (for memory and CPU) that it cannot handle. The JVM will end up requesting resources for threads and not doing any real productive work. This is one of those parameters where a constant value of zero is good. Hint: Before JAVA, using threads was relatively difficult; so programmers stayed away from them. JAVA has made the use of threads much easier; so many JAVA programmers may be new to programming threads in their applications. Watch for a novice JAVA programmer abusing the thread pool. If the value is consistently above 10%, then consider increasing your maximum size parameter of your thread pool. Access the parameter from the WebSphere icon JVM server icon Server Resources Threads Percent Maxed. This parameter is updated every five minutes.
 The result is you need to know what portion of the possible thread pool the JVM has been consumed. Increasing the maximum thread pool size is not always the answer.")
13 ENTE RPRISE JAVA B EANS You can have a robust web site without Enterprise Java Beans by using your web server, servlets, and JSPs. However, if your web site requires access to a central body of business logic and/or requires access to numerous backend databases, EJBs are for you. EJBs provide a layer of abstraction between your JAVA applications and backend databases. This abstraction layer also provides the coordination of business logic for your JAVA applications. This layer is different from a servlet, in that a servlet provides the coordination for the application program logic of a JAVA application through the WAS. The result is EJBs must perform as well as servlets because of their usage being in the middle of JAVA applications. One of the best parameters to determine overall EJB health is the Bean Method Response Time. The parameter is important because it shows the overall response time (excluding time for bean creation and deletion) of all EJBs. An elongated response time could suggest a poorly coded servlet. This poorly written servlet could be trying to access an EJB (via an entity bean) with multiple calls to satisfy a single DB request. These types of entity bean connections are costly on performance. A better-written servlet could use fewer calls to the EJB (via a session bean) for the same DB information. In the chart below we reached a peak of 500+ milliseconds. Is this good or bad? It depends. Work with your JAVA application programmers to determine if 500 milliseconds are acceptable for their code. Access the parameter from the WebSphere icon JVM server icon Enterprise Beans Beans Summary Bean Method RT. This parameter is updated every two minutes.

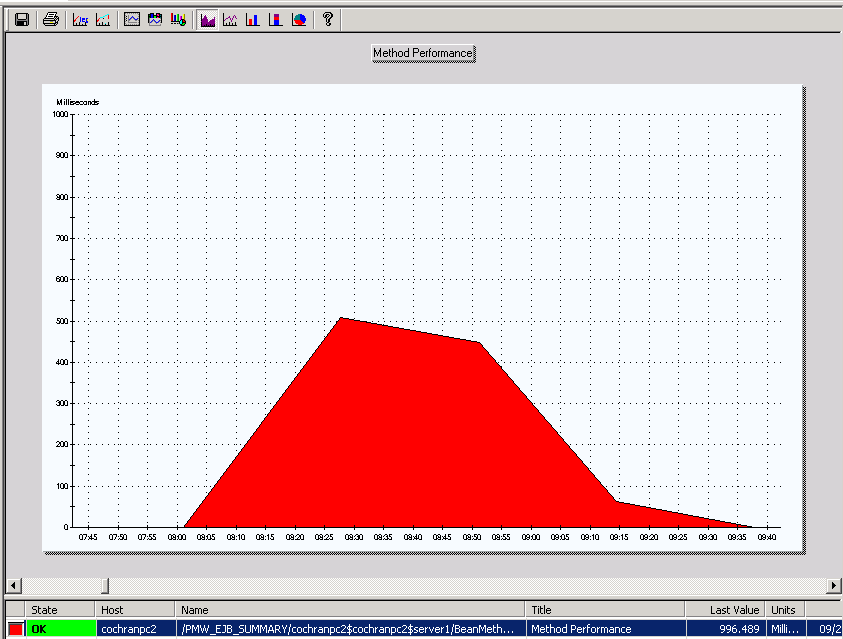
14

15 The Bean Pool Size parameter shows the average number of objects in the pool over the past collection interval. This parameter is important because the EJB pool size depends on two variables - the number of beans and size of the beans. If your bean pool becomes too large you will deplete your heap size. You might consider placing a cap on your EJB pool size by specifying BEANTYPE=MIN, MAX. Access the parameter from the WebSphere icon JVM server icon Enterprise Beans Beans Summary Bean Pool Size. This parameter is updated every five minutes.

16 LOGS Servlets have many options for logging. Additionally there are several places logging can occur. Logging can occur in the following WAS supplied logs: Activity System Out Native Standard Out System Error Start Server JAVA application specific Regardless of where logging occurs, logging eventually results in physical I/O to a hard drive. Physical I/O takes exponentially longer to execute than I/O to memory. It is suggested to use logging in development and not in production. If you have to use it in production, use it sparingly (for example never trace a servlet in production).


17 The Log Growth Size parameter shows the amount of space (in KB) the targeted log has grown over the past discovery cycle. This parameter is important because an unexpected spike in logging could suggest a new JAVA program is being put into production. For example many JAVA programmers perform a common coding technique of inserting a system.out.println() statement to help debug code in development. It is a common mistake to accidentally leave this statement in the code while migrating to production. This accident can cause up to 7X degradation in performance because of the overhead in logging. Another common JAVA programming mistake is a new JAVA application may log meaningless messages. The application programmer may not fully understand the significance of producing meaningful error messages. So be on the lookout for meaningless log messages. Access the parameter from the WebSphere icon Log Monitor Server Pick your log Log Growth Size.

18 HT TP SE SSIO NS Since browser based sessions are session-less (meaning there is not a permanent session between the WAS and browser), the WAS needs to maintain a record of a browser based user. This record is accomplished via an exchange of a cookie between a stored HTTP session in WAS memory and the users browser. Since the HTTP sessions are stored in memory, this has the potential of affecting the heap size. The trick is to monitor the heap size (covered early in this paper) and monitor the number of live HTTP sessions.

 waiting for the HTTP session/user to return. We all know many HTTP sessions (users) will not return to a web site.")
19 The Live Sessions parameter monitors the current number of live HTTP sessions. This parameter is important because too many HTTP sessions will eventually deplete the WAS of the heap size. The WAS will hold HTTP sessions in memory (hint heap usage) waiting for the HTTP session/user to return. We all know many HTTP sessions (users) will not return to a web site. The result is the WAS may end up holding too many HTTP sessions in memory. To prevent this problem, review your WAS timeout value for inactive HTTP sessions. Access the parameter from the WebSphere icon Server Sessions Live Sessions.
 will not return to a web site. The result is the WAS may end up holding too many HTTP sessions in memory.")
20 SUMM ARY AND CO NCLUSI ONS Monitor your WebSphere Application Server for a few weeks to determine the normal peaks and valleys of resource utilization. Keep an eye on memory usage and verify Garbage Collection is happening, but not happening too much. Verify your servlets are not taking too long to timeout waiting on files. Threads are a finite resource; verify your JAVA programmers are releasing threads in a timely fashion. EJBs are becoming widely accepted and many companies are still learning how to use them. Remember an EJB can timeout much like a servlet waiting on a backend resource. By monitoring EJB and Servlet response times you can anticipate (and hopefully prevent) a frozen web site. Scrutinize your JAVA logs and only log meaningful messages. In theory a web site should be stateless (this is impractical) requiring minimum HTTP sessions in the WAS, however verify your JAVA programmers try to code as stateless as possible web sites.
 a frozen web site.")
Tuning WebSphere Application Server ND 7.0. Royal Cyber Inc.
 Tuning WebSphere Application Server ND 7.0 Royal Cyber Inc. JVM related problems Application server stops responding Server crash Hung process Out of memory condition Performance degradation Check if the
Solutions for detect, diagnose and resolve performance problems in J2EE applications
 IX Konferencja PLOUG Koœcielisko PaŸdziernik 2003 Solutions for detect, diagnose and resolve performance problems in J2EE applications Cristian Maties Quest Software Custom-developed J2EE applications
Monitoring applications in multitier environment. Uroš Majcen [email protected]. A New View on Application Management. www.quest.
 A New View on Application Management www.quest.com/newview Monitoring applications in multitier environment Uroš Majcen [email protected] 2008 Quest Software, Inc. ALL RIGHTS RESERVED. Management Challenges
WebSphere Server Administration Course
 WebSphere Server Administration Course Chapter 1. Java EE and WebSphere Overview Goals of Enterprise Applications What is Java? What is Java EE? The Java EE Specifications Role of Application Server What
IBM WebSphere Server Administration
 IBM WebSphere Server Administration This course teaches the administration and deployment of web applications in the IBM WebSphere Application Server. Duration 24 hours Course Objectives Upon completion
Mission-Critical Java. An Oracle White Paper Updated October 2008
 Mission-Critical Java An Oracle White Paper Updated October 2008 Mission-Critical Java The Oracle JRockit family of products is a comprehensive portfolio of Java runtime solutions that leverages the base
Performance Optimization For Operational Risk Management Application On Azure Platform
 Performance Optimization For Operational Risk Management Application On Azure Platform Ashutosh Sabde, TCS www.cmgindia.org 1 Contents Introduction Functional Requirements Non Functional Requirements Business
WebSphere Performance Monitoring & Tuning For Webtop Version 5.3 on WebSphere 5.1.x
 Frequently Asked Questions WebSphere Performance Monitoring & Tuning For Webtop Version 5.3 on WebSphere 5.1.x FAQ Version 1.0 External FAQ1. Q. How do I monitor Webtop performance in WebSphere? 1 Enabling
TECHNOLOGY WHITE PAPER. Application Performance Management. Introduction to Adaptive Instrumentation with VERITAS Indepth for J2EE
 TECHNOLOGY WHITE PAPER Application Performance Management Introduction to Adaptive Instrumentation with VERITAS Indepth for J2EE TABLE OF CONTENTS ABOUT ADAPTIVE INSTRUMENTATION 3 WHY ADAPTIVE INSTRUMENTATION?
Web Performance, Inc. Testing Services Sample Performance Analysis
 Web Performance, Inc. Testing Services Sample Performance Analysis Overview This document contains two performance analysis reports created for actual web testing clients, and are a good example of the
Tomcat Tuning. Mark Thomas April 2009
 Tomcat Tuning Mark Thomas April 2009 Who am I? Apache Tomcat committer Resolved 1,500+ Tomcat bugs Apache Tomcat PMC member Member of the Apache Software Foundation Member of the ASF security committee
Informatica Master Data Management Multi Domain Hub API: Performance and Scalability Diagnostics Checklist
 Informatica Master Data Management Multi Domain Hub API: Performance and Scalability Diagnostics Checklist 2012 Informatica Corporation. No part of this document may be reproduced or transmitted in any
Identifying Performance Bottleneck using JRockit. - Shivaram Thirunavukkarasu Performance Engineer Wipro Technologies
 Identifying Performance Bottleneck using JRockit - Shivaram Thirunavukkarasu Performance Engineer Wipro Technologies Table of Contents About JRockit Mission Control... 3 Five things to look for in JRMC
White Paper. How to Achieve Best-in-Class Performance Monitoring for Distributed Java Applications
 White Paper How to Achieve Best-in-Class Performance Monitoring for Distributed Java Applications July / 2012 Introduction Critical Java business applications have been deployed for some time. However,
Agility Database Scalability Testing
 Agility Database Scalability Testing V1.6 November 11, 2012 Prepared by on behalf of Table of Contents 1 Introduction... 4 1.1 Brief... 4 2 Scope... 5 3 Test Approach... 6 4 Test environment setup... 7
A Comparison of Software Architectures for E-Business Applications
 A Comparison of Software Architectures for E-Business Applications Emmanuel Cecchet, Anupam Chanda, Sameh Elnikety, Juli Marguerite and Willy Zwaenepoel Rice University Department of Computer Science Dynamic
ELIXIR LOAD BALANCER 2
 ELIXIR LOAD BALANCER 2 Overview Elixir Load Balancer for Elixir Repertoire Server 7.2.2 or greater provides software solution for load balancing of Elixir Repertoire Servers. As a pure Java based software
Course Description. Course Audience. Course Outline. Course Page - Page 1 of 5
 Course Page - Page 1 of 5 WebSphere Application Server 7.0 Administration on Windows BSP-1700 Length: 5 days Price: $ 2,895.00 Course Description This course teaches the basics of the administration and
JBoss Seam Performance and Scalability on Dell PowerEdge 1855 Blade Servers
 JBoss Seam Performance and Scalability on Dell PowerEdge 1855 Blade Servers Dave Jaffe, PhD, Dell Inc. Michael Yuan, PhD, JBoss / RedHat June 14th, 2006 JBoss Inc. 2006 About us Dave Jaffe Works for Dell
THE BUSY DEVELOPER'S GUIDE TO JVM TROUBLESHOOTING
 THE BUSY DEVELOPER'S GUIDE TO JVM TROUBLESHOOTING November 5, 2010 Rohit Kelapure HTTP://WWW.LINKEDIN.COM/IN/ROHITKELAPURE HTTP://TWITTER.COM/RKELA Agenda 2 Application Server component overview Support
WebSphere Architect (Performance and Monitoring) 2011 IBM Corporation
 2011 IBM Corporation") Track Name: Application Infrastructure Topic : WebSphere Application Server Top 10 Performance Tuning Recommendations. Presenter Name : Vishal A Charegaonkar WebSphere Architect (Performance and Monitoring)
Track Name: Application Infrastructure Topic : WebSphere Application Server Top 10 Performance Tuning Recommendations. Presenter Name : Vishal A Charegaonkar WebSphere Architect (Performance and Monitoring)
PART IV Performance oriented design, Performance testing, Performance tuning & Performance solutions. Outline. Performance oriented design
 PART IV Performance oriented design, Performance testing, Performance tuning & Performance solutions Slide 1 Outline Principles for performance oriented design Performance testing Performance tuning General
An Oracle White Paper July 2011. Oracle Primavera Contract Management, Business Intelligence Publisher Edition-Sizing Guide
 Oracle Primavera Contract Management, Business Intelligence Publisher Edition-Sizing Guide An Oracle White Paper July 2011 1 Disclaimer The following is intended to outline our general product direction.
Enterprise Manager Performance Tips
 Enterprise Manager Performance Tips + The tips below are related to common situations customers experience when their Enterprise Manager(s) are not performing consistent with performance goals. If you
Table of Contents INTRODUCTION... 3. Prerequisites... 3 Audience... 3 Report Metrics... 3
 Table of Contents INTRODUCTION... 3 Prerequisites... 3 Audience... 3 Report Metrics... 3 IS MY TEST CONFIGURATION (DURATION / ITERATIONS SETTING ) APPROPRIATE?... 4 Request / Response Status Summary...
Java Monitoring. Stuff You Can Get For Free (And Stuff You Can t) Paul Jasek Sales Engineer
 Paul Jasek Sales Engineer") Java Monitoring Stuff You Can Get For Free (And Stuff You Can t) Paul Jasek Sales Engineer A Bit About Me Current: Past: Pre-Sales Engineer (1997 present) WaveMaker Wily Persistence GemStone Application
Java Monitoring Stuff You Can Get For Free (And Stuff You Can t) Paul Jasek Sales Engineer A Bit About Me Current: Past: Pre-Sales Engineer (1997 present) WaveMaker Wily Persistence GemStone Application
Rational Application Developer Performance Tips Introduction
 Rational Application Developer Performance Tips Introduction This article contains a series of hints and tips that you can use to improve the performance of the Rational Application Developer. This article
WEBLOGIC ADMINISTRATION
 WEBLOGIC ADMINISTRATION Session 1: Introduction Oracle Weblogic Server Components Java SDK and Java Enterprise Edition Application Servers & Web Servers Documentation Session 2: Installation System Configuration
Tuning Your GlassFish Performance Tips. Deep Singh Enterprise Java Performance Team Sun Microsystems, Inc.
 Tuning Your GlassFish Performance Tips Deep Singh Enterprise Java Performance Team Sun Microsystems, Inc. 1 Presentation Goal Learn tips and techniques on how to improve performance of GlassFish Application
Holistic Performance Analysis of J2EE Applications
 Holistic Performance Analysis of J2EE Applications By Madhu Tanikella In order to identify and resolve performance problems of enterprise Java Applications and reduce the time-to-market, performance analysis
Oracle Weblogic. Setup, Configuration, Tuning, and Considerations. Presented by: Michael Hogan Sr. Technical Consultant at Enkitec
 Oracle Weblogic Setup, Configuration, Tuning, and Considerations Presented by: Michael Hogan Sr. Technical Consultant at Enkitec Overview Weblogic Installation and Cluster Setup Weblogic Tuning Considerations
Oracle WebLogic Server Monitoring and Performance Tuning
 Oracle WebLogic Server Monitoring and Performance Tuning Duško Vukmanović Principal Sales Consultant, FMW Stuck Threads A Label given to threads not returned to thread pool after
Foglight. Monitoring Application Servers User and Reference Guide
 Foglight Monitoring Application Servers User and Reference Guide 2014 Quest Software, Inc. ALL RIGHTS RESERVED. This guide contains proprietary information protected by copyright. The software described
Performance brief for IBM WebSphere Application Server 7.0 with VMware ESX 4.0 on HP ProLiant DL380 G6 server
 Performance brief for IBM WebSphere Application Server.0 with VMware ESX.0 on HP ProLiant DL0 G server Table of contents Executive summary... WebSphere test configuration... Server information... WebSphere
11.1 inspectit. 11.1. inspectit
 11.1. inspectit Figure 11.1. Overview on the inspectit components [Siegl and Bouillet 2011] 11.1 inspectit The inspectit monitoring tool (website: http://www.inspectit.eu/) has been developed by NovaTec.
Resource Monitoring During Performance Testing. Experience Report by Johann du Plessis. Introduction. Planning for Monitoring
 Resource Monitoring During Performance Testing Experience Report by Johann du Plessis Introduction During a recent review of performance testing projects I completed over the past 8 years, one of the goals
Analyzing IBM i Performance Metrics
 WHITE PAPER Analyzing IBM i Performance Metrics The IBM i operating system is very good at supplying system administrators with built-in tools for security, database management, auditing, and journaling.
<Insert Picture Here> Java Application Diagnostic Expert
 Java Application Diagnostic Expert Agenda 1. Enterprise Manager 2. Challenges 3. Java Application Diagnostics Expert (JADE) 4. Feature-Benefit Summary 5. Features Overview Diagnostic
Delivering Quality in Software Performance and Scalability Testing
 Delivering Quality in Software Performance and Scalability Testing Abstract Khun Ban, Robert Scott, Kingsum Chow, and Huijun Yan Software and Services Group, Intel Corporation {khun.ban, robert.l.scott,
WebSphere Application Server - Introduction, Monitoring Tools, & Administration
 WebSphere Application Server - Introduction, Monitoring Tools, & Administration presented by: Michael S. Pallos, MBA Senior Solution Architect IBM Certified Systems Expert: WebSphere MQ 5.2 e-business
Monitoring Custom Applications User and Reference Guide
 Foglight 5.6.3 Monitoring Custom Applications User and Reference Guide 2012 Quest Software, Inc. ALL RIGHTS RESERVED. This guide contains proprietary information protected by copyright. The software described
Chapter 2 TOPOLOGY SELECTION. SYS-ED/ Computer Education Techniques, Inc.
 Chapter 2 TOPOLOGY SELECTION SYS-ED/ Computer Education Techniques, Inc. Objectives You will learn: Topology selection criteria. Perform a comparison of topology selection criteria. WebSphere component
IT Best Practices Audit TCS offers a wide range of IT Best Practices Audit content covering 15 subjects and over 2200 topics, including:
 IT Best Practices Audit TCS offers a wide range of IT Best Practices Audit content covering 15 subjects and over 2200 topics, including: 1. IT Cost Containment 84 topics 2. Cloud Computing Readiness 225
SW5706 Application deployment problems
 SW5706 This presentation will focus on application deployment problem determination on WebSphere Application Server V6. SW5706G11_AppDeployProblems.ppt Page 1 of 20 Unit objectives After completing this
Apache and Tomcat Clustering Configuration Table of Contents
 Apache and Tomcat Clustering Configuration Table of Contents INTRODUCTION REVISION HISTORY DOWNLOAD AND INSTALL JDK DOWNLOAD AND INSTALL APACHE WEB SERVER (HTTPD) DOWNLOAD AND INSTALL TOMCAT SERVER APACHE
25 May 11.30 Code 3C3 Peeling the Layers of the 'Performance Onion John Murphy, Andrew Lee and Liam Murphy
 UK CMG Presentation 25 May 11.30 Code 3C3 Peeling the Layers of the 'Performance Onion John Murphy, Andrew Lee and Liam Murphy Is Performance a Problem? Not using appropriate performance tools will cause
NetBeans Profiler is an
 NetBeans Profiler Exploring the NetBeans Profiler From Installation to a Practical Profiling Example* Gregg Sporar* NetBeans Profiler is an optional feature of the NetBeans IDE. It is a powerful tool that
Monitoring HP OO 10. Overview. Available Tools. HP OO Community Guides
 HP OO Community Guides Monitoring HP OO 10 This document describes the specifications of components we want to monitor, and the means to monitor them, in order to achieve effective monitoring of HP Operations
Apache Tomcat Tuning for Production
 Apache Tomcat Tuning for Production Filip Hanik & Mark Thomas SpringSource September 2008 Copyright 2008 SpringSource. Copying, publishing or distributing without express written permission is prohibited.
Performance Monitoring and Tuning. Liferay Chicago User Group (LCHIUG) James Lefeu 29AUG2013
 James Lefeu 29AUG2013") Performance Monitoring and Tuning Liferay Chicago User Group (LCHIUG) James Lefeu 29AUG2013 Outline I. Definitions II. Architecture III.Requirements and Design IV.JDK Tuning V. Liferay Tuning VI.Profiling
Performance Monitoring and Tuning Liferay Chicago User Group (LCHIUG) James Lefeu 29AUG2013 Outline I. Definitions II. Architecture III.Requirements and Design IV.JDK Tuning V. Liferay Tuning VI.Profiling
Diagnosing Production Java Applications Madhav Sathe
 Diagnosing Production Java Applications Madhav Sathe Oracle India Agenda Types of applications and issues Challenges Approaches to diagnostics Runtime JVM diagnostics Best practices Demo Q & A Folientitel
A Scalability Study for WebSphere Application Server and DB2 Universal Database
 A Scalability Study for WebSphere Application and DB2 Universal Database By Yongli An, Tsz Kin Tony Lau, and Peter Shum DB2 Universal Database Performance & Advanced Technology IBM Toronto Lab, IBM Canada
WebSphere Application Server V7: Monitoring the Runtime
 Chapter 11 of WebSphere Application Server V7 Administration and Configuration Guide, SG24-7615 WebSphere Application Server V7: Monitoring the Runtime Being able to measure and monitor system interactions
OpenLoad - Rapid Performance Optimization Tools & Techniques for CF Developers
 OpenDemand Systems, Inc. OpenLoad - Rapid Performance Optimization Tools & Techniques for CF Developers Speed Application Development & Improve Performance November 11, 2003 True or False? Exposing common
A Guide to Getting Started with Successful Load Testing
 Ingenieurbüro David Fischer AG A Company of the Apica Group http://www.proxy-sniffer.com A Guide to Getting Started with Successful Load Testing English Edition 2007 All Rights Reserved Table of Contents
Load Testing with JMeter
 Load Testing with JMeter Presented by Matthew Stout - [email protected] JMeter Overview Java application for load testing and measuring performance Originally for web applications but has grown to support lots
Characteristics of Java (Optional) Y. Daniel Liang Supplement for Introduction to Java Programming
 Y. Daniel Liang Supplement for Introduction to Java Programming") Characteristics of Java (Optional) Y. Daniel Liang Supplement for Introduction to Java Programming Java has become enormously popular. Java s rapid rise and wide acceptance can be traced to its design
Characteristics of Java (Optional) Y. Daniel Liang Supplement for Introduction to Java Programming Java has become enormously popular. Java s rapid rise and wide acceptance can be traced to its design
EVALUATION ONLY. WA2088 WebSphere Application Server 8.5 Administration on Windows. Student Labs. Web Age Solutions Inc.
 WA2088 WebSphere Application Server 8.5 Administration on Windows Student Labs Web Age Solutions Inc. Copyright 2013 Web Age Solutions Inc. 1 Table of Contents Directory Paths Used in Labs...3 Lab Notes...4
Configuring Nex-Gen Web Load Balancer
 Configuring Nex-Gen Web Load Balancer Table of Contents Load Balancing Scenarios & Concepts Creating Load Balancer Node using Administration Service Creating Load Balancer Node using NodeCreator Connecting
IBM Software Group. SW5706 JVM Tools. 2007 IBM Corporation 4.0. This presentation will act as an introduction to JVM tools.
 SW5706 JVM Tools This presentation will act as an introduction to. 4.0 Page 1 of 15 for tuning and problem detection After completing this topic, you should be able to: Describe the main tools used for
Mobile Application Languages XML, Java, J2ME and JavaCard Lesson 04 Java
 Mobile Application Languages XML, Java, J2ME and JavaCard Lesson 04 Java Oxford University Press 2007. All rights reserved. 1 C and C++ C and C++ with in-line-assembly, Visual Basic, and Visual C++ the
Oracle WebLogic Foundation of Oracle Fusion Middleware. Lawrence Manickam Toyork Systems Inc www.toyork.com http://ca.linkedin.
 Oracle WebLogic Foundation of Oracle Fusion Middleware Lawrence Manickam Toyork Systems Inc www.toyork.com http://ca.linkedin.com/in/lawrence143 History of WebLogic WebLogic Inc started in 1995 was a company
An Oracle White Paper September 2013. Advanced Java Diagnostics and Monitoring Without Performance Overhead
 An Oracle White Paper September 2013 Advanced Java Diagnostics and Monitoring Without Performance Overhead Introduction... 1 Non-Intrusive Profiling and Diagnostics... 2 JMX Console... 2 Java Flight Recorder...
How To Improve Performance On An Asa 9.4 Web Application Server (For Advanced Users)
") Paper SAS315-2014 SAS 9.4 Web Application Performance: Monitoring, Tuning, Scaling, and Troubleshooting Rob Sioss, SAS Institute Inc., Cary, NC ABSTRACT SAS 9.4 introduces several new software products
Paper SAS315-2014 SAS 9.4 Web Application Performance: Monitoring, Tuning, Scaling, and Troubleshooting Rob Sioss, SAS Institute Inc., Cary, NC ABSTRACT SAS 9.4 introduces several new software products
Cognos8 Deployment Best Practices for Performance/Scalability. Barnaby Cole Practice Lead, Technical Services
 Cognos8 Deployment Best Practices for Performance/Scalability Barnaby Cole Practice Lead, Technical Services Agenda > Cognos 8 Architecture Overview > Cognos 8 Components > Load Balancing > Deployment
3 Examples of Reliability Testing. Dan Downing, VP Testing Services MENTORA GROUP www.mentora.com
 WOPR 11 Experience Report Intuit Oct. 24 08 3 Examples of Reliability Testing Dan Downing, VP Testing Services MENTORA GROUP www.mentora.com # 1 Component Failover Testing Application: Donor Management
Effective Java Programming. measurement as the basis
 Effective Java Programming measurement as the basis Structure measurement as the basis benchmarking micro macro profiling why you should do this? profiling tools Motto "We should forget about small efficiencies,
Online Fuzzy-C-Means clustering
 Online Fuzzy-C-Means clustering Authors: Author s Addresses: Contact: Dezső Kancsár, Ágnes B. Simon H-1157 Budapest, Nyírpalota u. 79/C 2/8; College of Nyíregyháza, Rákóczi út 69. [email protected], [email protected]
Snapt Balancer Manual
 Snapt Balancer Manual Version 1.2 pg. 1 Contents Chapter 1: Introduction... 3 Chapter 2: General Usage... 4 Configuration Default Settings... 4 Configuration Performance Tuning... 6 Configuration Snapt
Tuning Guide for BEA WebLogic Server on HP NonStop Servers. 528917-002 Author: Santosh Menon November 17, 2005
 Tuning Guide for BEA WebLogic Server on HP NonStop Servers 528917-002 Author: Santosh Menon November 17, 2005 TABLE OF CONTENTS 1.0 Introduction...3 2.0 Background Information...3 2.1 Connection Management...4
Exam : Oracle 1Z0-108. : Oracle WebLogic Server 10gSystem Administration. Version : DEMO
 Exam : Oracle 1Z0-108 Title : Oracle WebLogic Server 10gSystem Administration Version : DEMO 1. Scenario : A single tier WebLogic cluster is configured with six Managed Servers. An Enterprise application
Monitoring Best Practices for COMMERCE
 Monitoring Best Practices for COMMERCE OVERVIEW Providing the right level and depth of monitoring is key to ensuring the effective operation of IT systems. This is especially true for ecommerce systems
Enterprise Application Performance Monitoring with JENNIFER
 JENNIFER Tech Note Enterprise Application Performance Monitoring with JENNIFER Date: 2009-03-30 Autor: S.J. Kim 1 / 11 http://www.jennifersoft.com In this article, I would like to discuss about the Enterprise
Java DB2 Developers Performance Best Practices
 Java DB2 Developers Performance Best Practices Dave Beulke & Associates A division of Pragmatic Solutions, Inc 3213 Duke Street Suite 805 Alexandria, VA 22314 703 798 3283 Member of the inaugural IBM DB2
WEBAPP PATTERN FOR APACHE TOMCAT - USER GUIDE
 WEBAPP PATTERN FOR APACHE TOMCAT - USER GUIDE Contents 1. Pattern Overview... 3 Features 3 Getting started with the Web Application Pattern... 3 Accepting the Web Application Pattern license agreement...
Monitoring Pramati EJB Server
 Monitoring Pramati EJB Server 17 Overview The EJB Server manages the execution of enterprise applications that run on the J2EE server. The JAR modules deployed on the Server are supported by the EJB container.
Analyzing Java Performance on iseries
 Session #: E2122 Analyzing Java Performance on iseries Speaker: Gregory S. Hurlebaus Title: PartnerWorld for Developers, iseries Technology Consultant May 7-10, 2002 Abstract This presentation will cover
Performance White Paper
 Sitecore Experience Platform 8.1 Performance White Paper Rev: March 11, 2016 Sitecore Experience Platform 8.1 Performance White Paper Sitecore Experience Platform 8.1 Table of contents Table of contents...
Test Run Analysis Interpretation (AI) Made Easy with OpenLoad
 Made Easy with OpenLoad") Test Run Analysis Interpretation (AI) Made Easy with OpenLoad OpenDemand Systems, Inc. Abstract / Executive Summary As Web applications and services become more complex, it becomes increasingly difficult
Test Run Analysis Interpretation (AI) Made Easy with OpenLoad OpenDemand Systems, Inc. Abstract / Executive Summary As Web applications and services become more complex, it becomes increasingly difficult
Web Server (Step 1) Processes request and sends query to SQL server via ADO/OLEDB. Web Server (Step 2) Creates HTML page dynamically from record set
 Processes request and sends query to SQL server via ADO/OLEDB. Web Server (Step 2) Creates HTML page dynamically from record set") Dawn CF Performance Considerations Dawn CF key processes Request (http) Web Server (Step 1) Processes request and sends query to SQL server via ADO/OLEDB. Query (SQL) SQL Server Queries Database & returns
Dawn CF Performance Considerations Dawn CF key processes Request (http) Web Server (Step 1) Processes request and sends query to SQL server via ADO/OLEDB. Query (SQL) SQL Server Queries Database & returns
Tool - 1: Health Center
 Tool - 1: Health Center Joseph Amrith Raj http://facebook.com/webspherelibrary 2 Tool - 1: Health Center Table of Contents WebSphere Application Server Troubleshooting... Error! Bookmark not defined. About
Apache Jakarta Tomcat
 Apache Jakarta Tomcat 20041058 Suh, Junho Road Map 1 Tomcat Overview What we need to make more dynamic web documents? Server that supports JSP, ASP, database etc We concentrates on Something that support
An introduction to creating JSF applications in Rational Application Developer Version 8.0
 An introduction to creating JSF applications in Rational Application Developer Version 8.0 September 2010 Copyright IBM Corporation 2010. 1 Overview Although you can use several Web technologies to create
How to analyse your system to optimise performance and throughput in IIBv9
 How to analyse your system to optimise performance and throughput in IIBv9 Dave Gorman [email protected] 2013 IBM Corporation Overview The purpose of this presentation is to demonstrate how to find the
Using jvmstat and visualgc to Solve Memory Management Problems
 Using jvmstat and visualgc to Solve Memory Management Problems java.sun.com/javaone/sf 1 Wally Wedel Sun Software Services Brian Doherty Sun Microsystems, Inc. Analyze JVM Machine Memory Management Problems
J2EE-JAVA SYSTEM MONITORING (Wily introscope)
") J2EE-JAVA SYSTEM MONITORING (Wily introscope) Purpose: To describe a procedure for java system monitoring through SAP certified third party tool Wily introscope. Scope: (Assumption) This procedure is applicable
J2EE-JAVA SYSTEM MONITORING (Wily introscope) Purpose: To describe a procedure for java system monitoring through SAP certified third party tool Wily introscope. Scope: (Assumption) This procedure is applicable
enterprise^ IBM WebSphere Application Server v7.0 Security "publishing Secure your WebSphere applications with Java EE and JAAS security standards
 IBM WebSphere Application Server v7.0 Security Secure your WebSphere applications with Java EE and JAAS security standards Omar Siliceo "publishing enterprise^ birmingham - mumbai Preface 1 Chapter 1:
Performance Analysis of Web based Applications on Single and Multi Core Servers
 Performance Analysis of Web based Applications on Single and Multi Core Servers Gitika Khare, Diptikant Pathy, Alpana Rajan, Alok Jain, Anil Rawat Raja Ramanna Centre for Advanced Technology Department
PeopleSoft Online Performance Guidelines
 PeopleSoft Online Performance Guidelines Agenda Introduction Web Browser configuration Web Server configuration Application Server PIA PeopleSoft Internet Architecture Introduction Pure Internet Architecture
IBM RATIONAL PERFORMANCE TESTER
 IBM RATIONAL PERFORMANCE TESTER Today, a major portion of newly developed enterprise applications is based on Internet connectivity of a geographically distributed work force that all need on-line access
How To Monitor A Server With Zabbix
 & JavaEE Platform Monitoring A Good Match? Company Facts Jesta Digital is a leading global provider of next generation entertainment content and services for the digital consumer. subsidiary of Jesta Group,
Introduction 1 Performance on Hosted Server 1. Benchmarks 2. System Requirements 7 Load Balancing 7
 Introduction 1 Performance on Hosted Server 1 Figure 1: Real World Performance 1 Benchmarks 2 System configuration used for benchmarks 2 Figure 2a: New tickets per minute on E5440 processors 3 Figure 2b:
JVM Performance Study Comparing Oracle HotSpot and Azul Zing Using Apache Cassandra
 JVM Performance Study Comparing Oracle HotSpot and Azul Zing Using Apache Cassandra January 2014 Legal Notices Apache Cassandra, Spark and Solr and their respective logos are trademarks or registered trademarks
Virtual Credit Card Processing System
 The ITB Journal Volume 3 Issue 2 Article 2 2002 Virtual Credit Card Processing System Geraldine Gray Karen Church Tony Ayres Follow this and additional works at: http://arrow.dit.ie/itbj Part of the E-Commerce
CHAPTER 1 - JAVA EE OVERVIEW FOR ADMINISTRATORS
 CHAPTER 1 - JAVA EE OVERVIEW FOR ADMINISTRATORS Java EE Components Java EE Vendor Specifications Containers Java EE Blueprint Services JDBC Data Sources Java Naming and Directory Interface Java Message