Capability Analysis Using Statgraphics Centurion
|
|
|
- Lynn Jackson
- 9 years ago
- Views:
Transcription
1 Capability Analysis Using Statgraphics Centurion Neil W. Polhemus, CTO, StatPoint Technologies, Inc. Copyright 2011 by StatPoint Technologies, Inc. Web site:

2 Outline Definition of process capability analysis Examples 1. Capability analysis for attributes 2. Estimating capability for variable data 3. Capability indices 4. Statistical tolerance limits 5. Multivariate capability analysis Sample size determination 2

3 Capability Analysis Determination based on data of a process s ability to meet established specifications. Specifications may be stated in terms of variables (such as the tolerance on the diameter of a part) or in terms of attributes (such as the frequency of customer complaints). 3
 or in terms of attributes (such")
4 Capability Measurements The essential measure of process capability is DPM (defects per million) or DPMO (defects per million opportunities), defined as the number of times that a process does not meet the specifications out of every million possibilities. DPM may be estimated directly or inferred from statistics such as a capability index or statistical tolerance limit. 4

5 How can we estimate capability using Statgraphics? Direct counting of defects Estimation of DPM from a fitted distribution Indirect inference about DPM from a capability index Demonstration of required capability through a statistical tolerance interval or bound 5


6 Example #1 - defects1.sgd Inspected k=30 batches of n=500 items each. Counted number of defective items. 6


7 Procedure Capability Analysis Percent Defective 7


8 8 Output

9 Conclusions Best estimate for DPM = With 95% confidence, DPM is no greater than 1,377.2 Tolerance limit: 95% of all batches of n=500 items will have no more than 2 defectives Equivalent Z =


10 Example #2 - resistivity.sgd Measured resistivity of n=100 electronic components 10

11 Procedure Capability Analysis Variable Data - Individuals 11

12 12 Selecting Proper Distribution

13 frequency Capability Plot Process Capability for resistivity USL = Largest Extreme Value Mode= Scale= Cpk = 0.85 Ppk = resistivity 13

14 14 Estimate of DPM

15 Capability Indices 15 6ˆ LSL USL C P 3 ˆ ˆ, 3 ˆ ˆ min USL LSL C PK ˆ ˆ, ˆ ˆ min USL LSL Z

16 16 Long-term and Short-term


17 17 Six Sigma Calculator


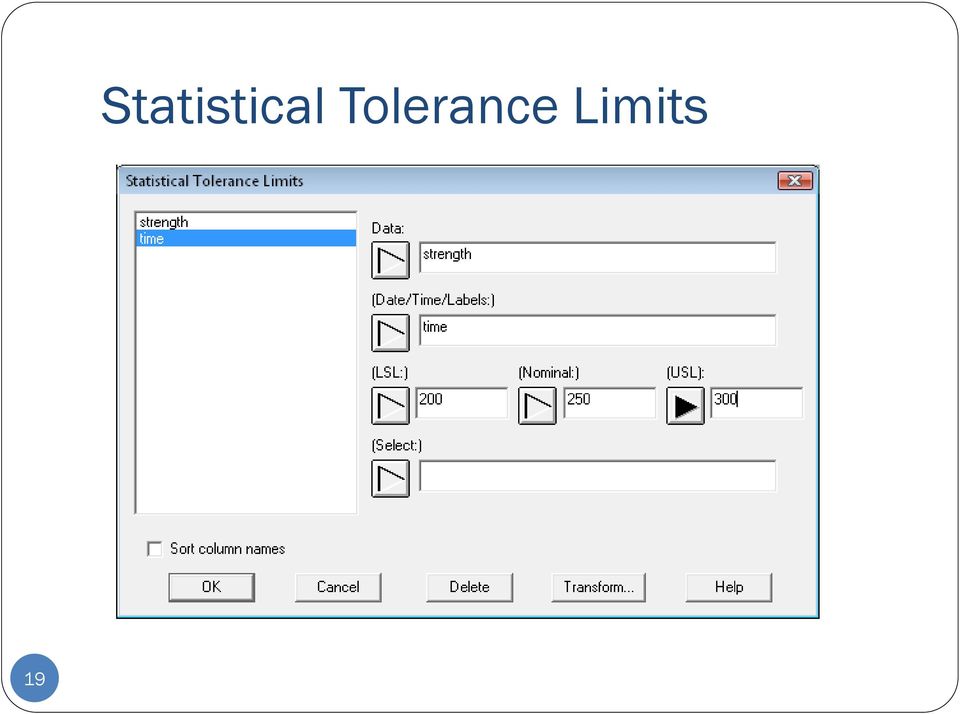
18 Example #3 - bottles.sgd Measured breaking strength of n=100 glass bottles 18


19 19 Statistical Tolerance Limits

20 20 Tolerance Limit Options

21 frequency Output Fitted Normal Distribution mean=254.64, std. dev.= Limits UTL: LTL: strength 21
22 Conclusions The StatAdvisor Assuming that strength comes from a normal distribution, the tolerance limits state that we can be 95.0% confident that 99.0% of the distribution lies between and This interval is computed by taking the mean of the data +/ times the standard deviation. 22
23 Multivariate Capability Analysis For multiple variables, determines the probability that ALL variables meet their established specification limits. Important when the variables are strongly correlated. 23

24 Example #4 - bivariate.sgd Measurements of height and weight of n=150 items. Specs: height 5 ± 0.3, weight 215 ± 7 24

25 25 Data Input
26 Bivariate Normal Distribution Multivariate Capability Plot DPM = height weight 26
27 weight Capability Ellipse % Capability Ellipse MCP = height 27
28 Multivariate Capability Multivariate capability indices defined to give same relationship with DPM as in univariate case. 28

29 Sample Size Determination - Counting Suppose I wish to estimate DPM to within +/-10% with 95% confidence. 29

30 Sample Size Determination Capability Indices Suppose I wish to estimate Cpk to within +/-10% with 95% confidence. 30 Requires measuring n = 154 items

31 Sample Size Determination Statistical Tolerance Limits 0.04 Normal Distribution Mean=250.0, Std. dev.= n= X 31 A tolerance interval covering 80% of the distance between the spec limits requires a sample of n = 20 items in this case.
32 More Information Go to Or send to 32
SPC Response Variable
 SPC Response Variable This procedure creates control charts for data in the form of continuous variables. Such charts are widely used to monitor manufacturing processes, where the data often represent
Confidence Intervals for Cpk
 Chapter 297 Confidence Intervals for Cpk Introduction This routine calculates the sample size needed to obtain a specified width of a Cpk confidence interval at a stated confidence level. Cpk is a process
Statistical Process Control (SPC) Training Guide
 Training Guide") Statistical Process Control (SPC) Training Guide Rev X05, 09/2013 What is data? Data is factual information (as measurements or statistics) used as a basic for reasoning, discussion or calculation. (Merriam-Webster
Statistical Process Control (SPC) Training Guide Rev X05, 09/2013 What is data? Data is factual information (as measurements or statistics) used as a basic for reasoning, discussion or calculation. (Merriam-Webster
Confidence Intervals for Cp
 Chapter 296 Confidence Intervals for Cp Introduction This routine calculates the sample size needed to obtain a specified width of a Cp confidence interval at a stated confidence level. Cp is a process
Applied Business Improvement. Introduction to ABI and Statgraphics Centurion
 Introduction to ABI and Statgraphics Centurion 1 Nobody gives a hoot about profits. Deming Successful Businesses Disagree.. Statgraphics Centurion TM and ABI can HELP your business INCREASE PROFIT Statgraphics
Confidence Intervals for the Difference Between Two Means
 Chapter 47 Confidence Intervals for the Difference Between Two Means Introduction This procedure calculates the sample size necessary to achieve a specified distance from the difference in sample means
SPSS Tests for Versions 9 to 13
 SPSS Tests for Versions 9 to 13 Chapter 2 Descriptive Statistic (including median) Choose Analyze Descriptive statistics Frequencies... Click on variable(s) then press to move to into Variable(s): list
Six Sigma Applications in Healthcare. Muder Alkrisat PhD, MSN, RN, CSSBB, CSHA, HACP Director of Clinical Process Improvement
 Six Sigma Applications in Healthcare Muder Alkrisat PhD, MSN, RN, CSSBB, CSHA, HACP Director of Clinical Process Improvement Insanity is continuing to do things the way you ve always done them and expecting
Robust Parameter Design Using Statgraphics Centurion. Dr. Neil W. Polhemus Copy right 2011 by StatPoint Technologies, Inc.
 Robust Parameter Design Using Statgraphics Centurion Dr. Neil W. Polhemus Copy right 2011 by StatPoint Technologies, Inc. 1 Robust Parameter Designs Experimental designs containing 2 types of factors:
Control Charts - SigmaXL Version 6.1
 Control Charts - SigmaXL Version 6.1 Control Charts: Overview Summary Report on Test for Special Causes Individuals & Moving Range Charts Use Historical Groups to Display Before VS After Improvement X-Bar
Control Charts for Variables. Control Chart for X and R
 Control Charts for Variables X-R, X-S charts, non-random patterns, process capability estimation. 1 Control Chart for X and R Often, there are two things that might go wrong in a process; its mean or its
Statistical Process Control OPRE 6364 1
 Statistical Process Control OPRE 6364 1 Statistical QA Approaches Statistical process control (SPC) Monitors production process to prevent poor quality Acceptance sampling Inspects random sample of product
STATISTICAL REASON FOR THE 1.5σ SHIFT Davis R. Bothe
 STATISTICAL REASON FOR THE 1.5σ SHIFT Davis R. Bothe INTRODUCTION Motorola Inc. introduced its 6σ quality initiative to the world in the 1980s. Almost since that time quality practitioners have questioned
How To Use Statgraphics Centurion Xvii (Version 17) On A Computer Or A Computer (For Free)
 On A Computer Or A Computer (For Free)") Statgraphics Centurion XVII (currently in beta test) is a major upgrade to Statpoint's flagship data analysis and visualization product. It contains 32 new statistical procedures and significant upgrades
Statgraphics Centurion XVII (currently in beta test) is a major upgrade to Statpoint's flagship data analysis and visualization product. It contains 32 new statistical procedures and significant upgrades
Instruction Manual for SPC for MS Excel V3.0
 Frequency Business Process Improvement 281-304-9504 20314 Lakeland Falls www.spcforexcel.com Cypress, TX 77433 Instruction Manual for SPC for MS Excel V3.0 35 30 25 LSL=60 Nominal=70 Capability Analysis
Six Sigma. Breakthrough Strategy or Your Worse Nightmare? Jeffrey T. Gotro, Ph.D. Director of Research & Development Ablestik Laboratories
 Six Sigma Breakthrough Strategy or Your Worse Nightmare? Jeffrey T. Gotro, Ph.D. Director of Research & Development Ablestik Laboratories Agenda What is Six Sigma? What are the challenges? What are the
THE PROCESS CAPABILITY ANALYSIS - A TOOL FOR PROCESS PERFORMANCE MEASURES AND METRICS - A CASE STUDY
 International Journal for Quality Research 8(3) 399-416 ISSN 1800-6450 Yerriswamy Wooluru 1 Swamy D.R. P. Nagesh THE PROCESS CAPABILITY ANALYSIS - A TOOL FOR PROCESS PERFORMANCE MEASURES AND METRICS -
STATGRAPHICS Online. Statistical Analysis and Data Visualization System. Revised 6/21/2012. Copyright 2012 by StatPoint Technologies, Inc.
 STATGRAPHICS Online Statistical Analysis and Data Visualization System Revised 6/21/2012 Copyright 2012 by StatPoint Technologies, Inc. All rights reserved. Table of Contents Introduction... 1 Chapter
Software Quality. Unit 2. Advanced techniques
 Software Quality Unit 2. Advanced techniques Index 1. Statistical techniques: Statistical process control, variable control charts and control chart for attributes. 2. Advanced techniques: Quality function
Statistical Quality Control
 Statistical Quality Control CHAPTER 6 Before studying this chapter you should know or, if necessary, review 1. Quality as a competitive priority, Chapter 2, page 00. 2. Total quality management (TQM) concepts,
Measurement Systems Correlation MSC for Suppliers
 Measurement Systems Correlation MSC for Suppliers Copyright 2003-2007 Raytheon Company. All rights reserved. R6σ is a Raytheon trademark registered in the United States and Europe. Raytheon Six Sigma is
Confidence Intervals for Spearman s Rank Correlation
 Chapter 808 Confidence Intervals for Spearman s Rank Correlation Introduction This routine calculates the sample size needed to obtain a specified width of Spearman s rank correlation coefficient confidence
Process Capability Analysis Using MINITAB (I)
") Process Capability Analysis Using MINITAB (I) By Keith M. Bower, M.S. Abstract The use of capability indices such as C p, C pk, and Sigma values is widespread in industry. It is important to emphasize
Process Capability Analysis Using MINITAB (I) By Keith M. Bower, M.S. Abstract The use of capability indices such as C p, C pk, and Sigma values is widespread in industry. It is important to emphasize
Lean Six Sigma Analyze Phase Introduction. TECH 50800 QUALITY and PRODUCTIVITY in INDUSTRY and TECHNOLOGY
 TECH 50800 QUALITY and PRODUCTIVITY in INDUSTRY and TECHNOLOGY Before we begin: Turn on the sound on your computer. There is audio to accompany this presentation. Audio will accompany most of the online
Basic Probability and Statistics Review. Six Sigma Black Belt Primer
 Basic Probability and Statistics Review Six Sigma Black Belt Primer Pat Hammett, Ph.D. January 2003 Instructor Comments: This document contains a review of basic probability and statistics. It also includes
Control de calidad. Felipe de Mendiburu. Second sample Calibration data in D[trial] New data in D[!trial] First samples UCL. Group summary statistics
![Control de calidad. Felipe de Mendiburu. Second sample Calibration data in D[trial] New data in D[!trial] First samples UCL. Group summary statistics](/thumbs/25/6906789.jpg "Control de calidad. Felipe de Mendiburu. Second sample Calibration data in D[trial] New data in D[!trial] First samples UCL. Group summary statistics") Control de calidad con First samples Second sample Calibration data in D[trial] New data in D[!trial] summary statistics 0.0 0.1 0.2 0.3 0.4 0.5 Felipe de Mendiburu 1 4 7 11 15 19 23 27 31 39 47 55 63
Control de calidad con First samples Second sample Calibration data in D[trial] New data in D[!trial] summary statistics 0.0 0.1 0.2 0.3 0.4 0.5 Felipe de Mendiburu 1 4 7 11 15 19 23 27 31 39 47 55 63
THE INTERNATIONAL JOURNAL OF BUSINESS & MANAGEMENT
 THE INTERNATIONAL JOURNAL OF BUSINESS & MANAGEMENT Process Performance Analysis in the Production Process of Medical Bottles Dr. Kabaday Nihan Research Asistant, Department of Production Management, Business
Six Sigma Acronyms. 2-1 Do Not Reprint without permission of
 Six Sigma Acronyms $k Thousands of dollars $M Millions of dollars % R & R Gauge % Repeatability and Reproducibility ANOVA Analysis of Variance AOP Annual Operating Plan BB Black Belt C & E Cause and Effects
Simulation and Lean Six Sigma
 Hilary Emmett, 22 August 2007 Improve the quality of your critical business decisions Agenda Simulation and Lean Six Sigma What is Monte Carlo Simulation? Loan Process Example Inventory Optimization Example
THIS PAGE WAS LEFT BLANK INTENTIONALLY
 SAMPLE EXAMINATION The purpose of the following sample examination is to present an example of what is provided on exam day by ASQ, complete with the same instructions that are given on exam day. The test
Confidence Intervals for One Standard Deviation Using Standard Deviation
 Chapter 640 Confidence Intervals for One Standard Deviation Using Standard Deviation Introduction This routine calculates the sample size necessary to achieve a specified interval width or distance from
II. DISTRIBUTIONS distribution normal distribution. standard scores
 Appendix D Basic Measurement And Statistics The following information was developed by Steven Rothke, PhD, Department of Psychology, Rehabilitation Institute of Chicago (RIC) and expanded by Mary F. Schmidt,
CAPABILITY PROCESS ASSESSMENT IN SIX SIGMA APPROACH
 METALLURGY AND FOUNDRY ENGINEERING Vol. 33, 007, No. Andrzej Czarski * CAPABILITY PROCESS ASSESSMENT IN SIX SIGMA APPROACH 1. INTRODUCTION We can state that statistical methods belong to a quality tools
STUDY GUIDE FOR THE LEAN SIX SIGMA (LSS) CERTIFICATION EXAM
 CERTIFICATION EXAM") STUDY GUIDE FOR THE LEAN SIX SIGMA (LSS) CERTIFICATION EXAM LSSYB LSSGB LSSBB ATMAE ATMAE ATMAE NOTE: An individual can become lean six sigma black belt certified by earning an 80% or higher on this exam.
STUDY GUIDE FOR THE LEAN SIX SIGMA (LSS) CERTIFICATION EXAM LSSYB LSSGB LSSBB ATMAE ATMAE ATMAE NOTE: An individual can become lean six sigma black belt certified by earning an 80% or higher on this exam.
THE USE OF STATISTICAL PROCESS CONTROL IN PHARMACEUTICALS INDUSTRY
 THE USE OF STATISTICAL PROCESS CONTROL IN PHARMACEUTICALS INDUSTRY Alexandru-Mihnea SPIRIDONICĂ 1 E-mail: [email protected] Abstract The use of statistical process control has gained a major
Descriptive Analysis
 Research Methods William G. Zikmund Basic Data Analysis: Descriptive Statistics Descriptive Analysis The transformation of raw data into a form that will make them easy to understand and interpret; rearranging,
THE OPEN SOURCE SOFTWARE R IN THE STATISTICAL QUALITY CONTROL
 1. Miriam ANDREJIOVÁ, 2. Zuzana KIMÁKOVÁ THE OPEN SOURCE SOFTWARE R IN THE STATISTICAL QUALITY CONTROL 1,2 TECHNICAL UNIVERSITY IN KOŠICE, FACULTY OF MECHANICAL ENGINEERING, KOŠICE, DEPARTMENT OF APPLIED
Unit 23: Control Charts
 Unit 23: Control Charts Summary of Video Statistical inference is a powerful tool. Using relatively small amounts of sample data we can figure out something about the larger population as a whole. Many
Statistical Process Control Basics. 70 GLEN ROAD, CRANSTON, RI 02920 T: 401-461-1118 F: 401-461-1119 www.tedco-inc.com
 Statistical Process Control Basics 70 GLEN ROAD, CRANSTON, RI 02920 T: 401-461-1118 F: 401-461-1119 www.tedco-inc.com What is Statistical Process Control? Statistical Process Control (SPC) is an industrystandard
Moving from Quality Control to Quality Assurance (Proactive Compliance!)
") Moving from Quality Control to Quality Assurance (Proactive Compliance!) Guy Wingate, VP & Compliance Officer Global Manufacturing & Supply, GlaxoSmithKline Disclaimer The views and opinions expressed
Moving from Quality Control to Quality Assurance (Proactive Compliance!) Guy Wingate, VP & Compliance Officer Global Manufacturing & Supply, GlaxoSmithKline Disclaimer The views and opinions expressed
Product Quality Management
 Product Quality Management Deborah Baly, Ph.D Sr. Director, Commercial Product Quality Management, GNE/ROCHE 1 Presentation Outline: Product Quality Management Regulatory landscape and need for integrated
LAB 4 INSTRUCTIONS CONFIDENCE INTERVALS AND HYPOTHESIS TESTING
 LAB 4 INSTRUCTIONS CONFIDENCE INTERVALS AND HYPOTHESIS TESTING In this lab you will explore the concept of a confidence interval and hypothesis testing through a simulation problem in engineering setting.
Correlation and Simple Linear Regression
 Correlation and Simple Linear Regression We are often interested in studying the relationship among variables to determine whether they are associated with one another. When we think that changes in a
Why Is EngineRoom the Right Choice? 1. Cuts the Cost of Calculation
 What is EngineRoom? - A Web based data analysis application with an intuitive, drag-and-drop graphical interface. - A suite of powerful, simple-to-use Lean and Six Sigma data analysis tools that you can
Multiplexer Software. www.elcometer.com. Multiplexer Software. Dataputer DATA-XL Software
 Multiplexer Software Multiplexer Software There are two ways that data can be collected Electronically, where there is no human intervention, and Manually, where data is collected by the User with the
Shainin: A concept for problem solving
 Shainin: A concept for problem solving Lecture at the Shainin conference Amelior 11 December 2009 Willy Vandenbrande www.qsconsult.be 1 Dorian Shainin (1914 2000) Aeronautical engineer (MIT 1936) Design
A Multi-Stream Process Capability Assessment Using a Nonconformity Ratio Based Desirability Function
 A Multi-Stream Process Capability Assessment Using a Nonconformity Ratio Based Desirability Function Thesis for the Acquisition of the Degree of a Doctor in Natural Sciences of the University of Dortmund
Point and Interval Estimates
 Point and Interval Estimates Suppose we want to estimate a parameter, such as p or µ, based on a finite sample of data. There are two main methods: 1. Point estimate: Summarize the sample by a single number
How To Test For Significance On A Data Set
 Non-Parametric Univariate Tests: 1 Sample Sign Test 1 1 SAMPLE SIGN TEST A non-parametric equivalent of the 1 SAMPLE T-TEST. ASSUMPTIONS: Data is non-normally distributed, even after log transforming.
Imputing Values to Missing Data
 Imputing Values to Missing Data In federated data, between 30%-70% of the data points will have at least one missing attribute - data wastage if we ignore all records with a missing value Remaining data
Dimensionality Reduction: Principal Components Analysis
 Dimensionality Reduction: Principal Components Analysis In data mining one often encounters situations where there are a large number of variables in the database. In such situations it is very likely
Chapter 7 Section 1 Homework Set A
 Chapter 7 Section 1 Homework Set A 7.15 Finding the critical value t *. What critical value t * from Table D (use software, go to the web and type t distribution applet) should be used to calculate the
Data-Base Workflow. From Raw Material Data to Simulation input
 Data-Base Workflow From Raw Material Data to input Realize innovation. Raw Data Raw Data Data Reduction Material Spec Material entry and Tests Data Raw Material specifications Manufacturer details Material
Inferential Statistics. What are they? When would you use them?
 Inferential Statistics What are they? When would you use them? What are inferential statistics? Why learn about inferential statistics? Why use inferential statistics? When are inferential statistics utilized?
The Standard Normal distribution
 The Standard Normal distribution 21.2 Introduction Mass-produced items should conform to a specification. Usually, a mean is aimed for but due to random errors in the production process we set a tolerance
STATISTICAL QUALITY CONTROL (SQC)
") Statistical Quality Control 1 SQC consists of two major areas: STATISTICAL QUALITY CONTOL (SQC) - Acceptance Sampling - Process Control or Control Charts Both of these statistical techniques may be applied
Statistical Quality Control 1 SQC consists of two major areas: STATISTICAL QUALITY CONTOL (SQC) - Acceptance Sampling - Process Control or Control Charts Both of these statistical techniques may be applied
Simple Linear Regression Inference
 Simple Linear Regression Inference 1 Inference requirements The Normality assumption of the stochastic term e is needed for inference even if it is not a OLS requirement. Therefore we have: Interpretation
Multivariate Normal Distribution
 Multivariate Normal Distribution Lecture 4 July 21, 2011 Advanced Multivariate Statistical Methods ICPSR Summer Session #2 Lecture #4-7/21/2011 Slide 1 of 41 Last Time Matrices and vectors Eigenvalues
3.4 Statistical inference for 2 populations based on two samples
 3.4 Statistical inference for 2 populations based on two samples Tests for a difference between two population means The first sample will be denoted as X 1, X 2,..., X m. The second sample will be denoted
INFLUENCE OF MEASUREMENT SYSTEM QUALITY ON THE EVALUATION OF PROCESS CAPABILITY INDICES
 METALLURGY AND FOUNDRY ENGINEERING Vol. 38, 2012, No. 1 http://dx.doi.org/10.7494/mafe.2012.38.1.25 Andrzej Czarski*, Piotr Matusiewicz* INFLUENCE OF MEASUREMENT SYSTEM QUALITY ON THE EVALUATION OF PROCESS
Coefficient of Determination
 Coefficient of Determination The coefficient of determination R 2 (or sometimes r 2 ) is another measure of how well the least squares equation ŷ = b 0 + b 1 x performs as a predictor of y. R 2 is computed
Pharmaceutical Product Quality, Quality by Design, cgmp, and Quality Metrics
 Pharmaceutical Product Quality, Quality by Design, cgmp, and Quality Metrics Lawrence X. Yu, Ph.D. Deputy Director Office of Pharmaceutical Quality Center for Drug Evaluation and Research Food and Drug
3.2 Measures of Spread
 3.2 Measures of Spread In some data sets the observations are close together, while in others they are more spread out. In addition to measures of the center, it's often important to measure the spread
HYPOTHESIS TESTING: CONFIDENCE INTERVALS, T-TESTS, ANOVAS, AND REGRESSION
 HYPOTHESIS TESTING: CONFIDENCE INTERVALS, T-TESTS, ANOVAS, AND REGRESSION HOD 2990 10 November 2010 Lecture Background This is a lightning speed summary of introductory statistical methods for senior undergraduate
Six Sigma Project Charter
 rev 12 Six Sigma Project Charter Name of project: Reduce the time of producing admissions dashboard reports Green belt: Yes Submitted by: Xingming Yu e-mail: [email protected] Date submitted: May 21, 212
Chapter 23. Inferences for Regression
 Chapter 23. Inferences for Regression Topics covered in this chapter: Simple Linear Regression Simple Linear Regression Example 23.1: Crying and IQ The Problem: Infants who cry easily may be more easily
Exercise 1.12 (Pg. 22-23)
") Individuals: The objects that are described by a set of data. They may be people, animals, things, etc. (Also referred to as Cases or Records) Variables: The characteristics recorded about each individual.
Individuals: The objects that are described by a set of data. They may be people, animals, things, etc. (Also referred to as Cases or Records) Variables: The characteristics recorded about each individual.
THE SIX SIGMA BLACK BELT PRIMER
 INTRO-1 (1) THE SIX SIGMA BLACK BELT PRIMER by Quality Council of Indiana - All rights reserved Fourth Edition - September, 2014 Quality Council of Indiana 602 West Paris Avenue West Terre Haute, IN 47885
12.5: CHI-SQUARE GOODNESS OF FIT TESTS
 125: Chi-Square Goodness of Fit Tests CD12-1 125: CHI-SQUARE GOODNESS OF FIT TESTS In this section, the χ 2 distribution is used for testing the goodness of fit of a set of data to a specific probability
The Normal distribution
 The Normal distribution The normal probability distribution is the most common model for relative frequencies of a quantitative variable. Bell-shaped and described by the function f(y) = 1 2σ π e{ 1 2σ
Section Format Day Begin End Building Rm# Instructor. 001 Lecture Tue 6:45 PM 8:40 PM Silver 401 Ballerini
 NEW YORK UNIVERSITY ROBERT F. WAGNER GRADUATE SCHOOL OF PUBLIC SERVICE Course Syllabus Spring 2016 Statistical Methods for Public, Nonprofit, and Health Management Section Format Day Begin End Building
BA 275 Review Problems - Week 6 (10/30/06-11/3/06) CD Lessons: 53, 54, 55, 56 Textbook: pp. 394-398, 404-408, 410-420
 CD Lessons: 53, 54, 55, 56 Textbook: pp. 394-398, 404-408, 410-420") BA 275 Review Problems - Week 6 (10/30/06-11/3/06) CD Lessons: 53, 54, 55, 56 Textbook: pp. 394-398, 404-408, 410-420 1. Which of the following will increase the value of the power in a statistical test
BA 275 Review Problems - Week 6 (10/30/06-11/3/06) CD Lessons: 53, 54, 55, 56 Textbook: pp. 394-398, 404-408, 410-420 1. Which of the following will increase the value of the power in a statistical test
2. Filling Data Gaps, Data validation & Descriptive Statistics
 2. Filling Data Gaps, Data validation & Descriptive Statistics Dr. Prasad Modak Background Data collected from field may suffer from these problems Data may contain gaps ( = no readings during this period)
Process Quality. BIZ2121-04 Production & Operations Management. Sung Joo Bae, Assistant Professor. Yonsei University School of Business
 BIZ2121-04 Production & Operations Management Process Quality Sung Joo Bae, Assistant Professor Yonsei University School of Business Disclaimer: Many slides in this presentation file are from the copyrighted
Body of Knowledge for Six Sigma Green Belt
 Body of Knowledge for Six Sigma Green Belt What to Prepare For: The following is the Six Sigma Green Belt Certification Body of Knowledge that the exam will cover. We strongly encourage you to study and
Estimation of σ 2, the variance of ɛ
 Estimation of σ 2, the variance of ɛ The variance of the errors σ 2 indicates how much observations deviate from the fitted surface. If σ 2 is small, parameters β 0, β 1,..., β k will be reliably estimated
Two Related Samples t Test
 Two Related Samples t Test In this example 1 students saw five pictures of attractive people and five pictures of unattractive people. For each picture, the students rated the friendliness of the person
SENSITIVITY ANALYSIS AND INFERENCE. Lecture 12
 This work is licensed under a Creative Commons Attribution-NonCommercial-ShareAlike License. Your use of this material constitutes acceptance of that license and the conditions of use of materials on this
CHAPTER 13. Control Charts
 13.1 Introduction 1 CHAPTER 13 Control Charts This chapter discusses a set of methods for monitoring process characteristics over time called control charts and places these tools in the wider perspective
Descriptive Statistics and Exploratory Data Analysis
 Descriptive Statistics and Exploratory Data Analysis Dean s s Faculty and Resident Development Series UT College of Medicine Chattanooga Probasco Auditorium at Erlanger January 14, 2008 Marc Loizeaux,
1. What is the critical value for this 95% confidence interval? CV = z.025 = invnorm(0.025) = 1.96
 = 1.96") 1 Final Review 2 Review 2.1 CI 1-propZint Scenario 1 A TV manufacturer claims in its warranty brochure that in the past not more than 10 percent of its TV sets needed any repair during the first two years
1 Final Review 2 Review 2.1 CI 1-propZint Scenario 1 A TV manufacturer claims in its warranty brochure that in the past not more than 10 percent of its TV sets needed any repair during the first two years
Descriptive statistics Statistical inference statistical inference, statistical induction and inferential statistics
 Descriptive statistics is the discipline of quantitatively describing the main features of a collection of data. Descriptive statistics are distinguished from inferential statistics (or inductive statistics),
Stata Walkthrough 4: Regression, Prediction, and Forecasting
 Stata Walkthrough 4: Regression, Prediction, and Forecasting Over drinks the other evening, my neighbor told me about his 25-year-old nephew, who is dating a 35-year-old woman. God, I can t see them getting
Six Sigma Workshop Fallstudie och praktisk övning
 Six Sigma Workshop Fallstudie och praktisk övning 0-fels LEAN-konferens, Folkets Hus 05-NOV-2013 Lars Öst GE business segments Technology Infrastructure Energy Infrastructure GE Capital NBC Universal Healthcare
SPC Demonstration Tips
 Tip Sheet SPC Demonstration Tips Key Points to Cover When Demonstrating Ignition SPC Downtime In general, the SPC Module is designed with a great level of flexibility to support a wide variety of production
Unit 22: Sampling Distributions
 Unit 22: Sampling Distributions Summary of Video If we know an entire population, then we can compute population parameters such as the population mean or standard deviation. However, we generally don
Correlation and Regression
 Correlation and Regression Scatterplots Correlation Explanatory and response variables Simple linear regression General Principles of Data Analysis First plot the data, then add numerical summaries Look
SAMPLE SIZE CONSIDERATIONS
 SAMPLE SIZE CONSIDERATIONS Learning Objectives Understand the critical role having the right sample size has on an analysis or study. Know how to determine the correct sample size for a specific study.
Copyright 2013 wolfssl Inc. All rights reserved. 2
 - - Copyright 2013 wolfssl Inc. All rights reserved. 2 Copyright 2013 wolfssl Inc. All rights reserved. 2 Copyright 2013 wolfssl Inc. All rights reserved. 3 Copyright 2013 wolfssl Inc. All rights reserved.
Data exploration with Microsoft Excel: analysing more than one variable
 Data exploration with Microsoft Excel: analysing more than one variable Contents 1 Introduction... 1 2 Comparing different groups or different variables... 2 3 Exploring the association between categorical
BA 275 Review Problems - Week 5 (10/23/06-10/27/06) CD Lessons: 48, 49, 50, 51, 52 Textbook: pp. 380-394
 CD Lessons: 48, 49, 50, 51, 52 Textbook: pp. 380-394") BA 275 Review Problems - Week 5 (10/23/06-10/27/06) CD Lessons: 48, 49, 50, 51, 52 Textbook: pp. 380-394 1. Does vigorous exercise affect concentration? In general, the time needed for people to complete
BA 275 Review Problems - Week 5 (10/23/06-10/27/06) CD Lessons: 48, 49, 50, 51, 52 Textbook: pp. 380-394 1. Does vigorous exercise affect concentration? In general, the time needed for people to complete
SPI HS70. Remote Control of Multiple Lines with RMCworks. Systematic Process Management by Inspection Spec Server
 SPI HS70 Remote Control of Multiple Lines with RMCworks Machine Status Monitoring It costs highly to post process analysis technicians for each production line. RMCworks provides solution that one technical
Cause and Effect Matrix. SixSigmaTV.Net
 Cause and Effect Matrix SixSigmaTV.Net Vital Few Identification We must identify the Vital Few root causes from the many probably root causes The Vital Few are those input and process factors (Xs) That
Modifying Integrated Model for Manufacturing Process Improvement
 Modifying Integrated Model for Manufacturing Process Improvement Nguyen Van Hop. 1, Sumate N. 2, Patantip N. 3, and Sitawatch N. 4 1, 2, 3, 4. Industrial Engineering Program Sirindhorn International Institute