ADVANCED DATA VISUALIZATION
|
|
|
- Maryann Benson
- 10 years ago
- Views:
Transcription
1 If I can't picture it, I can't understand it. Albert Einstein ADVANCED DATA VISUALIZATION REDUCE TO THE TIME TO INSIGHT AND DRIVE DATA DRIVEN DECISION MAKING Mark Wolff, Ph.D. Principal Industry Consultant Health and Life Sciences Global Practice SAS Institute HISTORY JOHN W. TUKEY The greatest value of a picture is when it forces us to notice what we never expected to see. John Tukey Automatic analysis techniques such as statistics and data mining developed independently from visualization and interaction techniques Important shift from confirmatory data analysis (using exploratory data analysis charts and other visual representations to just present results) to exploratory data analysis (interacting with the data/results) J.W. Tukey. Exploratory Data Analysis. Addison-Wesley, Reading MA,
 to exploratory data analysis (interacting with the data/results) J.W. Tukey.")
2 DEFINITIONS VISUAL The science of analytical reasoning facilitated by interactive human-machine interfaces" Visual analytics combines automated analysis with interactive visualizations for an effective understanding, reasoning and decision making on the basis of very large and complex datasets. P. C. Wong and J. Thomas. Visual analytics. IEEE Computer Graphics and Applications, 24(5):20 21, Daniel Keim, Jörn Kohlhammer, Geoffrey Ellis and Florian Mansmann (Eds.) Mastering The Information Age Solving Problems with Visual Analytics Eurographics, 2010, pp.57-86, ISBN: DEFINITIONS VISUAL The creation of tools and techniques to enable people to: Synthesize information and derive insight from massive, dynamic, ambiguous, and often conflicting data. Detect the expected and discover the unexpected. Provide timely, defensible, and understandable assessments. Communicate these assessment electively for action. 2
 Mastering The Information Age Solving Problems with Visual Analytics Eurographics, 2010, pp.")
3 DEFINITIONS BIG DATA Volume Variety Velocity Variability Complexity it s relative - when an organization s ability to handle, store and analyze data exceeds its current capacity they have big data DEFINITIONS VISUAL P. C. Wong and J. Thomas. Visual analytics. IEEE Computer Graphics and Applications, 24(5):20 21, Daniel Keim, Jörn Kohlhammer, Geoffrey Ellis and Florian Mansmann (Eds.) Mastering The Information Age Solving Problems with Visual Analytics Eurographics, 2010, pp.57-86, ISBN:

4 ENTERPRISE THE LANDSCAPE ENTERPRISE VISUALIZATION FIT FOR PURPOSE 4

5 VISUALIZATION WHICH OPTION TO PROPOSE? Business Intelligence Personas: General Data: General Purpose: Basic visualization/reporting Value: Easy understanding of information, trends and status Data Explorer Personas: SAS Drug Development User Data: SAS Datasets in SDD Purpose: Quick view, filtering, structure exploration Value: Built in capability to browse and explore data sets JMP Clinical Personas: Scientist, Medical Reviewer, Clinical Researcher Data: SDTM-like data sets Purpose: Clinical Trial specific visualization (e.g. Patient Profile, Patient Narratives, Medical Monitor Dashboard, Fraud Detection) Value: Wide variety of pre-built clinical solutions. Easy to use non-coder analytical viewer Visual Analytics Personas: Senior Management, non statisticians Data: Large/Big data, Aggregated, Mixed purpose/secondary use Purpose: Ad hoc Exploration, Cohort Definition, Outlier Identification, Big Data Exploration Value: Intuitive, nonstatistician explorer, Responsive large data exploration, Visually pleasing reporting and dashboards SAS BI/SAS GRAPH ROBERT ALLISON Clarke Error Grid Plot Hemoglobin Error Grid Flu Tracking Analytics U.S. Fuel Ethanol Jim Goodnight dot plot Election Forecast Map Exposure to Meningitis Interactive Human Body Custom SG Matrix Star Trek's Dashboard Baby Name Popularity China's Favorite Mobile Oil & Gasoline Price Oil & Gas Correlation Basketball Forecasting 5

6 STATISTICAL DISCOVERY FROM SAS VISUAL ADVANCED DATA VISUALIZATION Move from big data to right data Dramatically increase the speed to insight Meaningfully support data driven decision making Intuitive and collaborative access to information Explore data independently No sub-setting or sampling required 6

7 DELIVERS A SINGLE SOLUTION FOR FASTER, SMARTER DECISIONS Central Entry Point Integration Role-Based Views PREPARE EXPLORE DESIGN Manage data Load and join data Create calculated columns Perform ad-hoc data exploration Insights generated through analytic visualizations Create dashboard style reports for web or mobile DELIVER SAS Mobile BI - native tablet applications delivering interactive reports Web and PDF IN-MEMORY ENGINE VISUAL APPLIED ADVANCED DATA VISUALIZATION Clinical Research Cross study/meta analysis Molecular/genomics Patient Safety Post marketing surveillance Disproportionality analysis Disease Management Monitor large populations Identify cohorts of interest Outcomes Research Hypothesis generation Real time interactive exploration 7

8 KEY HIGHLIGHTS OF VISUAL 6.1 Analytics Visualization Mobility Enterprise Forecasting Precision Layout New Visualizations Enhanced Security Correlation Analysis Enhanced Interactivity Enhanced Interactivity Advanced Data Preparation Advanced Regression Enhanced Visualizations Enhanced Security Incremental Data Enhanced Box Plot Analysis Custom Calculations Android Support Share Data (Export) ANALYTICAL CAPABILITIES Intelligent Forecasting Model selection Clear explanation of Forecasting results Details in graphical and tabular format Share results. 8
 ANALYTICAL CAPABILITIES Intelligent")
9 ANALYTICAL CAPABILITIES Multiple regression model options Clear explanation of analytical results Details in graphical and tabular format Share results. ENHANCED VISUALIZATION & INTERACTIVITY Brushing Mode allows for interactivity between multiple visuals Dynamic filtering allows for quickly selecting inclusions / exclusions Share results. 9

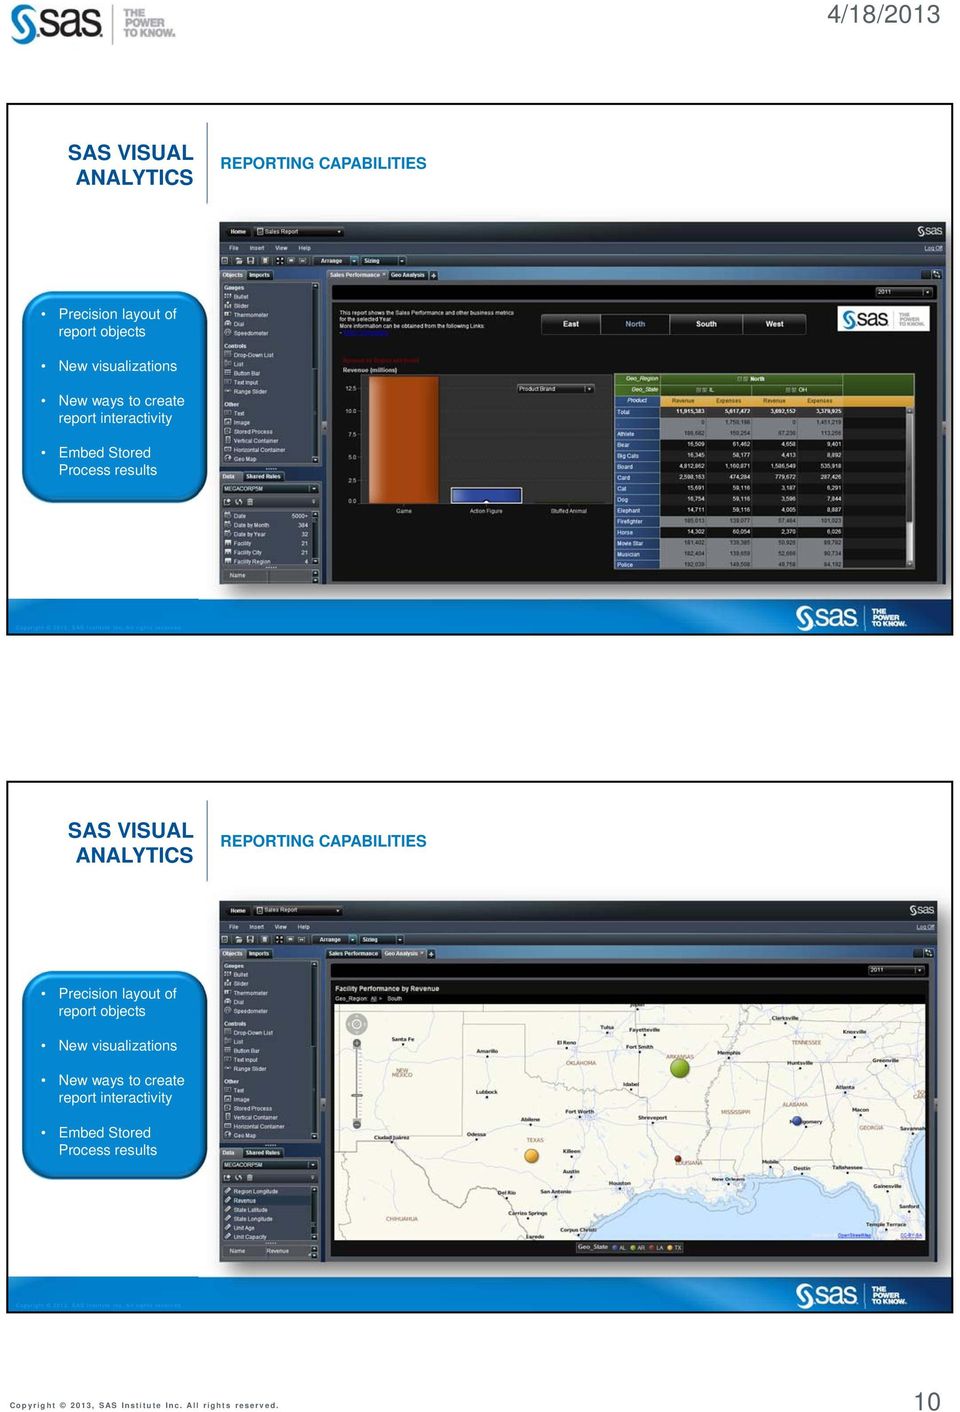
10 REPORTING CAPABILITIES Precision layout of report objects New visualizations New ways to create report interactivity Embed Stored Process results REPORTING CAPABILITIES Precision layout of report objects New visualizations New ways to create report interactivity Embed Stored Process results 10
11 DATA PREPARATION CAPABILITIES Operations for analytical data preparation Robust data query and structuring Easy to use SQL based operations DATA ADMINISTRATION Table Level Security Row-Level Security 11

12 DEMONSTRATION 12

DATA VISUALIZATION: CONVERTING INFORMATION TO DECISIONS DAVID FRONING, PRINCIPAL PRODUCT MANAGER
 DATA VISUALIZATION: CONVERTING INFORMATION TO DECISIONS DAVID FRONING, PRINCIPAL PRODUCT MANAGER SAS WHO WE ARE World leader in analytics Founded in 1976 400 offices world-wide Used at 65,000 sites in
Visual Analytics on Public Sector Open Access Data
 Visual Analytics on Public Sector Open Access Data Dr. Andreas S. Maniatis Commercial Manager / Head of BI CyberStream LTD Big Data and Business Analytics: Theory and Practice Wednesday, October 24 th
Encontro de Utilizadores Esri 2013. Desafios de Big Data SAS / Esri Orador: Luis Bettencourt Moniz : Mário Correia SAS
 Encontro de Utilizadores Esri 2013 Desafios de Big Data SAS / Esri Orador: Luis Bettencourt Moniz : Mário Correia SAS O DESAFIO DE BIG DATA - SAS / ESRI LISBOA, 2013/JUN/06 LUÍS BETTENCOURT MONIZ DIRECTOR
Implementing Data Models and Reports with Microsoft SQL Server 20466C; 5 Days
 Lincoln Land Community College Capital City Training Center 130 West Mason Springfield, IL 62702 217-782-7436 www.llcc.edu/cctc Implementing Data Models and Reports with Microsoft SQL Server 20466C; 5
PBI365: Data Analytics and Reporting with Power BI
 POWER BI FOR BUSINESS ANALYSTS AND POWER USERS 3 DAYS PBI365: Data Analytics and Reporting with Power BI AUDIENCE FORMAT COURSE DESCRIPTION Business Analysts, Statisticians and Data Scientists Instructor-led
Demonstration of SAP Predictive Analysis 1.0, consumption from SAP BI clients and best practices
 September 10-13, 2012 Orlando, Florida Demonstration of SAP Predictive Analysis 1.0, consumption from SAP BI clients and best practices Vishwanath Belur, Product Manager, SAP Predictive Analysis Learning
CRGroup Whitepaper: Digging through the Data. www.crgroup.com. Reporting Options in Microsoft Dynamics GP
 CRGroup Whitepaper: Digging through the Data Reporting Options in Microsoft Dynamics GP The objective of this paper is to provide greater insight on each of the reporting options available to you within
Implementing Data Models and Reports with Microsoft SQL Server
 Course 20466C: Implementing Data Models and Reports with Microsoft SQL Server Course Details Course Outline Module 1: Introduction to Business Intelligence and Data Modeling As a SQL Server database professional,
SAP Predictive Analysis: Strategy, Value Proposition
 September 10-13, 2012 Orlando, Florida SAP Predictive Analysis: Strategy, Value Proposition Thomas B Kuruvilla, Solution Management, SAP Business Intelligence Scott Leaver, Solution Management, SAP Business
Data Visualization Techniques
 Data Visualization Techniques From Basics to Big Data with SAS Visual Analytics WHITE PAPER SAS White Paper Table of Contents Introduction.... 1 Generating the Best Visualizations for Your Data... 2 The
WebFOCUS InfoDiscovery
 Information Builders helps organizations transform data into business value. Our business intelligence, integration, and data integrity solutions enable smarter decision-making, strengthen customer relationships,
Data Visualization Techniques
 Data Visualization Techniques From Basics to Big Data with SAS Visual Analytics WHITE PAPER SAS White Paper Table of Contents Introduction.... 1 Generating the Best Visualizations for Your Data... 2 The
Predictive Analytics
 Predictive Analytics How many of you used predictive today? 2015 SAP SE. All rights reserved. 2 2015 SAP SE. All rights reserved. 3 How can you apply predictive to your business? Predictive Analytics is
Microsoft 20466 - Implementing Data Models and Reports with Microsoft SQL Server
 1800 ULEARN (853 276) www.ddls.com.au Microsoft 20466 - Implementing Data Models and Reports with Microsoft SQL Server Length 5 days Price $4070.00 (inc GST) Version C Overview The focus of this five-day
Self-Service Business Intelligence
 Self-Service Business Intelligence BRIDGE THE GAP VISUALIZE DATA, DISCOVER TRENDS, SHARE FINDINGS Solgenia Analysis provides users throughout your organization with flexible tools to create and share meaningful
Implementing Data Models and Reports with Microsoft SQL Server 2012 MOC 10778
 Implementing Data Models and Reports with Microsoft SQL Server 2012 MOC 10778 Course Outline Module 1: Introduction to Business Intelligence and Data Modeling This module provides an introduction to Business
Microsoft Services Exceed your business with Microsoft SharePoint Server 2010
 Microsoft Services Exceed your business with Microsoft SharePoint Server 2010 Business Intelligence Suite Alexandre Mendeiros, SQL Server Premier Field Engineer January 2012 Agenda Microsoft Business Intelligence
SAS REPORTS ON YOUR FINGERTIPS? SAS BI IS THE ANSWER FOR CREATING IMMERSIVE MOBILE REPORTS
 PharmaSUG 2015 - Paper AD10 SAS REPORTS ON YOUR FINGERTIPS? SAS BI IS THE ANSWER FOR CREATING IMMERSIVE MOBILE REPORTS Swapnil Udasi, inventiv Health, Hyderabad, India ABSTRACT The widespread use of smartphone
How To Choose A Business Intelligence Toolkit
 Background Current Reporting Challenges: Difficulty extracting various levels of data from AgLearn Limited ability to translate data into presentable formats Complex reporting requires the technical staff
Information Visualization WS 2013/14 11 Visual Analytics
 1 11.1 Definitions and Motivation Lot of research and papers in this emerging field: Visual Analytics: Scope and Challenges of Keim et al. Illuminating the path of Thomas and Cook 2 11.1 Definitions and
<no narration for this slide>
 1 2 The standard narration text is : After completing this lesson, you will be able to: < > SAP Visual Intelligence is our latest innovation
Microsoft Dynamics NAV
 Microsoft Dynamics NAV Maximising value through business insight Business Intelligence White Paper October 2015 CONTENTS Reports were tedious. Earlier it would take days for manual collation. Now all this
Maximising value through business insight. Business Intelligence White Paper
 Maximising value through business insight Business Intelligence White Paper October 2015 CONTENTS Reports were tedious. Earlier it would take days for manual collation. Now all this is available at the
Implementing Data Models and Reports with Microsoft SQL Server
 CÔNG TY CỔ PHẦN TRƯỜNG CNTT TÂN ĐỨC TAN DUC INFORMATION TECHNOLOGY SCHOOL JSC LEARN MORE WITH LESS! Course 20466C: Implementing Data Models and Reports with Microsoft SQL Server Length: 5 Days Audience:
Microsoft Dynamics NAV
 Microsoft Dynamics NAV 2015 Microsoft Dynamics NAV Maximising value through business insight Business Intelligence White Paper December 2014 CONTENTS Reports were tedious. Earlier it would take days for
Visualizing Clinical Trial Data Matt Becker, SAS Institute
 Visualizing Clinical Trial Data Matt Becker, SAS Institute ABSTRACT Today, all employees at health and life science corporations may need access to view operational data. There may be visualization needs
www.ducenit.com Self-Service Business Intelligence: The hunt for real insights in hidden knowledge Whitepaper
 Self-Service Business Intelligence: The hunt for real insights in hidden knowledge Whitepaper Shift in BI usage In this fast paced business environment, organizations need to make smarter and faster decisions
How SAP Business Intelligence Solutions provide real-time insight into your organization
 How SAP Business Intelligence Solutions provide real-time insight into your organization 28 Oct 2015 Agenda 1) What is Business Intelligence (BI) 2) SAP BusinessObjects Features Overview 3) Demo & Report
Microsoft Dynamics NAV
 Microsoft Dynamics NAV Maximizing value through business insight Business Intelligence White Paper November 2011 The information contained in this document represents the current view of Microsoft Corporation
SAS Visual Analytics. fact sheet What does SAS Visual Analytics do? Benefits
 fact sheet What does SAS Visual Analytics do? SAS Visual Analytics provides a complete platform for analytics visualization, enabling you to identify patterns and relationships in data that weren t initially
Microsoft Dynamics NAV
 Microsoft Dynamics NAV Maximising value through business insight Business Intelligence White Paper May 2013 Reports were tedious. Earlier it would take days for manual collation. Now all this is available
Cloud Self Service Mobile Business Intelligence MAKE INFORMED DECISIONS WITH BIG DATA ANALYTICS, CLOUD BI, & SELF SERVICE MOBILITY OPTIONS
 Cloud Self Service Mobile Business Intelligence MAKE INFORMED DECISIONS WITH BIG DATA ANALYTICS, CLOUD BI, & SELF SERVICE MOBILITY OPTIONS VISUALIZE DATA, DISCOVER TRENDS, SHARE FINDINGS Analysis extracts
WebFOCUS RStat. RStat. Predict the Future and Make Effective Decisions Today. WebFOCUS RStat
 Information Builders enables agile information solutions with business intelligence (BI) and integration technologies. WebFOCUS the most widely utilized business intelligence platform connects to any enterprise
Empowering the Masses with Analytics
 Empowering the Masses with Analytics THE GAP FOR BUSINESS USERS For a discussion of bridging the gap from the perspective of a business user, read Three Ways to Use Data Science. Ask the average business
A GENERAL TAXONOMY FOR VISUALIZATION OF PREDICTIVE SOCIAL MEDIA ANALYTICS
 A GENERAL TAXONOMY FOR VISUALIZATION OF PREDICTIVE SOCIAL MEDIA ANALYTICS Stacey Franklin Jones, D.Sc. ProTech Global Solutions Annapolis, MD Abstract The use of Social Media as a resource to characterize
Introduction to Data Mining and Machine Learning Techniques. Iza Moise, Evangelos Pournaras, Dirk Helbing
 Introduction to Data Mining and Machine Learning Techniques Iza Moise, Evangelos Pournaras, Dirk Helbing Iza Moise, Evangelos Pournaras, Dirk Helbing 1 Overview Main principles of data mining Definition
SQL Server 2012 Business Intelligence Boot Camp
 SQL Server 2012 Business Intelligence Boot Camp Length: 5 Days Technology: Microsoft SQL Server 2012 Delivery Method: Instructor-led (classroom) About this Course Data warehousing is a solution organizations
An In-Depth Look at In-Memory Predictive Analytics for Developers
 September 9 11, 2013 Anaheim, California An In-Depth Look at In-Memory Predictive Analytics for Developers Philip Mugglestone SAP Learning Points Understand the SAP HANA Predictive Analysis library (PAL)
Big Data Use Cases Update
 Big Data Use Cases Update Sanat Joshi Industry Solutions Manufacturing Industries Business Unit 1 Data Explosion Web & social networks experienced it first Infographic by Go-gulf.com 2 Number Of Connected
White Paper. Data Visualization Techniques. From Basics to Big Data With SAS Visual Analytics
 White Paper Data Visualization Techniques From Basics to Big Data With SAS Visual Analytics Contents Introduction... 1 Tips to Get Started... 1 The Basics: Charting 101... 2 Line Graphs...2 Bar Charts...3
Using Microsoft Business Intelligence Dashboards and Reports in the Federal Government
 Using Microsoft Business Intelligence Dashboards and Reports in the Federal Government A White Paper on Leveraging Existing Investments in Microsoft Technology for Analytics and Reporting June 2013 Dev
20 A Visualization Framework For Discovering Prepaid Mobile Subscriber Usage Patterns
 20 A Visualization Framework For Discovering Prepaid Mobile Subscriber Usage Patterns John Aogon and Patrick J. Ogao Telecommunications operators in developing countries are faced with a problem of knowing
Five Levels of Embedded BI From Static to Analytic Applications
 5 Five Levels of Embedded BI From Static to Analytic Applications Introduction The expanding role of data in business management promises smarter operational applications that manage and automate better
White Paper. Redefine Your Analytics Journey With Self-Service Data Discovery and Interactive Predictive Analytics
 White Paper Redefine Your Analytics Journey With Self-Service Data Discovery and Interactive Predictive Analytics Contents Self-service data discovery and interactive predictive analytics... 1 What does
MicroStrategy Products
 MicroStrategy Products Bringing MicroStrategy Reporting, Analysis, and Monitoring to Microsoft Excel, PowerPoint, and Word With MicroStrategy Office, business users can create and run MicroStrategy reports
MicroStrategy Desktop 10.2. MicroStrategy 10.2: New features overview. microstrategy.com 1
 MicroStrategy Desktop 10.2 MicroStrategy 10.2: New features overview. microstrategy.com 1 TABLE OF CONTENTS MicroStrategy Desktop 10.2 Easier integration of custom visualizations 3 BETA Dashboard annotation
Expanding Uniformance. Driving Digital Intelligence through Unified Data, Analytics, and Visualization
 Expanding Uniformance Driving Digital Intelligence through Unified Data, Analytics, and Visualization The Information Challenge 2 What is the current state today? Lack of availability of business level
SalesLogix Advanced Analytics
 SalesLogix Advanced Analytics SalesLogix Advanced Analytics Benefits Snapshot Increase organizational and customer intelligence by analyzing data from across your business. Make informed business decisions
GRAPHING DATA FOR DECISION-MAKING
 GRAPHING DATA FOR DECISION-MAKING Tibor Tóth, Ph.D. Center for Applied Demography and Survey Research (CADSR) University of Delaware Fall, 2006 TABLE OF CONTENTS Introduction... 3 Use High Information
KnowledgeSTUDIO HIGH-PERFORMANCE PREDICTIVE ANALYTICS USING ADVANCED MODELING TECHNIQUES
 HIGH-PERFORMANCE PREDICTIVE ANALYTICS USING ADVANCED MODELING TECHNIQUES Translating data into business value requires the right data mining and modeling techniques which uncover important patterns within
Information Visualization and Visual Analytics
 Information Visualization and Visual Analytics Pekka Wartiainen University of Jyväskylä [email protected] 23.4.2014 Outline Objectives Introduction Visual Analytics Information Visualization Our
High-Performance Analytics
 High-Performance Analytics David Pope January 2012 Principal Solutions Architect High Performance Analytics Practice Saturday, April 21, 2012 Agenda Who Is SAS / SAS Technology Evolution Current Trends
Business Intelligence and Process Modelling
 Business Intelligence and Process Modelling F.W. Takes Universiteit Leiden Lecture 2: Business Intelligence & Visual Analytics BIPM Lecture 2: Business Intelligence & Visual Analytics 1 / 72 Business Intelligence
In-Memory Analytics for Big Data
 In-Memory Analytics for Big Data Game-changing technology for faster, better insights WHITE PAPER SAS White Paper Table of Contents Introduction: A New Breed of Analytics... 1 SAS In-Memory Overview...
Tax Fraud in Increasing
 Preventing Fraud with Through Analytics Satya Bhamidipati Data Scientist Business Analytics Product Group Copyright 2014 Oracle and/or its affiliates. All rights reserved. 2 Tax Fraud in Increasing 27%
Oracle Big Data Discovery Unlock Potential in Big Data Reservoir
 Oracle Big Data Discovery Unlock Potential in Big Data Reservoir Gokula Mishra Premjith Balakrishnan Business Analytics Product Group September 29, 2014 Copyright 2014, Oracle and/or its affiliates. All
THE QLIKVIEW PRODUCT FAMILY
 THE QLIKVIEW PRODUCT FAMILY is the world s first associative, in-memory Business Discovery platform. It enables business users to assemble data from multiple sources, explore it, make discoveries, and
A Visualization is Worth a Thousand Tables: How IBM Business Analytics Lets Users See Big Data
 White Paper A Visualization is Worth a Thousand Tables: How IBM Business Analytics Lets Users See Big Data Contents Executive Summary....2 Introduction....3 Too much data, not enough information....3 Only
A Comprehensive Review of Self-Service Data Visualization in MicroStrategy. Vijay Anand January 28, 2014
 A Comprehensive Review of Self-Service Data Visualization in MicroStrategy Vijay Anand January 28, 2014 Speaker Bio Vijay Anand Product Manager Vijay Anand is a Product Manager for Self-Service and High
This Symposium brought to you by www.ttcus.com
 This Symposium brought to you by www.ttcus.com Linkedin/Group: Technology Training Corporation @Techtrain Technology Training Corporation www.ttcus.com Big Data Analytics as a Service (BDAaaS) Big Data
Turning your Warehouse Data into Business Intelligence: Reporting Trends and Visibility Michael Armanious; Vice President Sales and Marketing Datex,
 Turning your Warehouse Data into Business Intelligence: Reporting Trends and Visibility Michael Armanious; Vice President Sales and Marketing Datex, Inc. Overview Introduction What is Business Intelligence?
SAS VISUAL ANALYTICS AN OVERVIEW OF POWERFUL DISCOVERY, ANALYSIS AND REPORTING
 SAS VISUAL ANALYTICS AN OVERVIEW OF POWERFUL DISCOVERY, ANALYSIS AND REPORTING WELCOME TO SAS VISUAL ANALYTICS SAS Visual Analytics is a high-performance, in-memory solution for exploring massive amounts
Business Intelligence. A Presentation of the Current Lead Solutions and a Comparative Analysis of the Main Providers
 60 Business Intelligence. A Presentation of the Current Lead Solutions and a Comparative Analysis of the Main Providers Business Intelligence. A Presentation of the Current Lead Solutions and a Comparative
Competitive Analytics
 Competitive Analytics Utilize data to help analyze future scenarios to make more accurate assumptions Ed Allison Compelligence, Inc. Ed Allison Education: Computer & Management Science US Army: Captain
Salesforce.com and MicroStrategy. A functional overview and recommendation for analysis and application development
 Salesforce.com and MicroStrategy A functional overview and recommendation for analysis and application development About the Speaker Prittam Bagani Director, Product Management Prittam started working
How To Turn Big Data Into An Insight
 mwd a d v i s o r s Turning Big Data into Big Insights Helena Schwenk A special report prepared for Actuate May 2013 This report is the fourth in a series and focuses principally on explaining what s needed
Spotfire and Tableau Positioning. Summary
 Licensed for distribution Summary Both TIBCO Spotfire and Tableau allow users of various skill levels to create attractive visualizations of data, displayed as charts, dashboards and other visual constructs.
Attaining Supply Chain Analytical Literacy. Sr. Director of Analytics Wal Mart (Bentonville, AR)
") Attaining Supply Chain Analytical Literacy Rhonda R. Lummus F. Robert Jacobs Indiana University Bloomington Kelley School of Business Sr. Director of Analytics Wal Mart (Bentonville, AR) The Senior Director
Attaining Supply Chain Analytical Literacy Rhonda R. Lummus F. Robert Jacobs Indiana University Bloomington Kelley School of Business Sr. Director of Analytics Wal Mart (Bentonville, AR) The Senior Director
APPROACHABLE ANALYTICS MAKING SENSE OF DATA
 APPROACHABLE ANALYTICS MAKING SENSE OF DATA AGENDA SAS DELIVERS PROVEN SOLUTIONS THAT DRIVE INNOVATION AND IMPROVE PERFORMANCE. About SAS SAS Business Analytics Framework Approachable Analytics SAS for
ProStix Business Intelligence (BI)
") ProStix Business Intelligence (BI) WHAT IS BI? Business Intelligence (BI), according to Gartner, the global leader in technology research and IT services, is an umbrella term that includes the applications,
ProStix Business Intelligence (BI) WHAT IS BI? Business Intelligence (BI), according to Gartner, the global leader in technology research and IT services, is an umbrella term that includes the applications,
Pentaho Data Mining Last Modified on January 22, 2007
 Pentaho Data Mining Copyright 2007 Pentaho Corporation. Redistribution permitted. All trademarks are the property of their respective owners. For the latest information, please visit our web site at www.pentaho.org
Customer Case Study. Sharethrough
 Customer Case Study Customer Case Study Benefits Faster prototyping of new applications Easier debugging of complex pipelines Improved overall engineering team productivity Summary offers a robust advertising
2015 Workshops for Professors
 SAS Education Grow with us Offered by the SAS Global Academic Program Supporting teaching, learning and research in higher education 2015 Workshops for Professors 1 Workshops for Professors As the market
Dashboard Overview. Bernd Schneider. Technical Solution Professional BI Microsoft Switzerland [email protected]
 Dashboard Overview Bernd Schneider Technical Solution Professional BI Microsoft Switzerland [email protected] Techdays Bern (8./9. April) http://www.techdays.ch + * Including Microsoft Office
Oracle Business Intelligence EE. Prab h akar A lu ri
 Oracle Business Intelligence EE Prab h akar A lu ri Agenda 1.Overview 2.Components 3.Oracle Business Intelligence Server 4.Oracle Business Intelligence Dashboards 5.Oracle Business Intelligence Answers
SAP Predictive Analytics Roadmap Charles Gadalla SAP SESSION CODE: #####
 SAP Predictive Analytics Roadmap Charles Gadalla SAP SESSION CODE: ##### LEARNING POINTS What are SAP s Advanced Analytics offerings Advanced Analytics gives a competitive advantage, it can no longer be
Τhe SAS BI delivers business-critical answers ahead of the competition Yannis Salamaras Senior Business Intelligence Consultant SAS Greece & Cyprus
 Τhe SAS BI delivers business-critical answers ahead of the competition Yannis Salamaras Senior Business Intelligence Consultant SAS Greece & Cyprus The Value of the Information What s wrong with this picture?
How can you unlock the value in real-world data? A novel approach to predictive analytics could make the difference.
 How can you unlock the value in real-world data? A novel approach to predictive analytics could make the difference. What if you could diagnose patients sooner, start treatment earlier, and prevent symptoms
ANALYTICS STRATEGY: creating a roadmap for success
 ANALYTICS STRATEGY: creating a roadmap for success Companies in the capital and commodity markets are looking at analytics for opportunities to improve revenue and cost savings. Yet, many firms are struggling
SQL Server 2016 BI Any Data, Anytime, Anywhere. Phua Chiu Kiang PCK CONSULTING MVP (Data Platform)
") SQL Server 2016 BI Any Data, Anytime, Anywhere Phua Chiu Kiang PCK CONSULTING MVP (Data Platform) SQL Server 2016 Pin paginated report items to Power BI dashboards Visualization Mobile and paginated reports
SQL Server 2016 BI Any Data, Anytime, Anywhere Phua Chiu Kiang PCK CONSULTING MVP (Data Platform) SQL Server 2016 Pin paginated report items to Power BI dashboards Visualization Mobile and paginated reports
Effective Visualization Techniques for Data Discovery and Analysis
 WHITE PAPER Effective Visualization Techniques for Data Discovery and Analysis Chuck Pirrello, SAS Institute, Cary, NC Table of Contents Abstract... 1 Introduction... 1 Visual Analytics... 1 Static Graphs...
ORACLE OLAP. Oracle OLAP is embedded in the Oracle Database kernel and runs in the same database process
 ORACLE OLAP KEY FEATURES AND BENEFITS FAST ANSWERS TO TOUGH QUESTIONS EASILY KEY FEATURES & BENEFITS World class analytic engine Superior query performance Simple SQL access to advanced analytics Enhanced
Business Benefits From Microsoft SQL Server Business Intelligence Solutions How Can Business Intelligence Help You? PTR Associates Limited
 Business Benefits From Microsoft SQL Server Business Intelligence Solutions How Can Business Intelligence Help You? www.ptr.co.uk Business Benefits From Microsoft SQL Server Business Intelligence (September
X3 Intelligence Reporting
 X3 Intelligence Reporting Frequently asked questions Sage X3 Intelligence Reporting customers Contents 1. Overview of Sage Intelligence Reporting 3 2. Comparison of Sage Intelligence Reporting and Sage
KnowledgeSEEKER Marketing Edition
 KnowledgeSEEKER Marketing Edition Predictive Analytics for Marketing The Easiest to Use Marketing Analytics Tool KnowledgeSEEKER Marketing Edition is a predictive analytics tool designed for marketers