Elements of statistics (MATH0487-1)
|
|
|
- Noel Daniels
- 10 years ago
- Views:
Transcription
1 Elements of statistics (MATH0487-1) Prof. Dr. Dr. K. Van Steen University of Liège, Belgium December 10, 2012

2 Introduction to Statistics Basic Probability Revisited Sampling Exploratory Data Analysis - EDA Estimation Confidence Intervals Hypothesis Testing Tab Outline I 1 Introduction to Statistics Why? What? Probability Statistics Some Examples Making Inferences Inferential Statistics Inductive versus Deductive Reasoning 2 Basic Probability Revisited 3 Sampling Samples and Populations Sampling Schemes Deciding Who to Choose Deciding How to Choose Non-probability Sampling Probability Sampling A Practical Application Study Designs Prof. Dr. Dr. K. Van Steen Elements of statistics (MATH0487-1)

3 Introduction to Statistics Basic Probability Revisited Sampling Exploratory Data Analysis - EDA Estimation Confidence Intervals Hypothesis Testing Tab Outline II Classification Qualitative Study Designs Popular Statistics and Their Distributions Resampling Strategies 4 Exploratory Data Analysis - EDA Why? Motivating Example What? Data analysis procedures Outliers and Influential Observations How? One-way Methods Pairwise Methods Assumptions of EDA 5 Estimation Introduction Motivating Example Approaches to Estimation: The Frequentist s Way Estimation by Methods of Moments Prof. Dr. Dr. K. Van Steen Elements of statistics (MATH0487-1)

4 Introduction to Statistics Basic Probability Revisited Sampling Exploratory Data Analysis - EDA Estimation Confidence Intervals Hypothesis Testing Tab Outline III Motivation What? How? Examples Properties of an Estimator Recapitulation Point Estimators and their Properties Properties of an MME Estimation by Maximum Likelihood What? How? Examples Profile Likelihoods Properties of an MLE Parameter Transformations 6 Confidence Intervals Importance of the Normal Distribution Interval Estimation What? How? Pivotal quantities Prof. Dr. Dr. K. Van Steen Elements of statistics (MATH0487-1)

5 Introduction to Statistics Basic Probability Revisited Sampling Exploratory Data Analysis - EDA Estimation Confidence Intervals Hypothesis Testing Tab Outline IV Examples Interpretation of CIs Recapitulation Pivotal quantities Examples Interpretation of CIs 7 Hypothesis Testing General procedure Hypothesis test for a single mean P-values Hypothesis tests beyond a single mean Errors and Power 8 Table analysis Dichotomous Variables Comparing two proportions using2 2 tables About RRs and ORs and their confidence intervals Chi-square Tests Goodness-of-fit test Independence test Prof. Dr. Dr. K. Van Steen Elements of statistics (MATH0487-1)

6 Introduction to Statistics Basic Probability Revisited Sampling Exploratory Data Analysis - EDA Estimation Confidence Intervals Hypothesis Testing Tab Outline V Homogeneity test 9 Introduction to Linear Regression Correlation Analysis Simple Linear Regression Centering Inference on Regression Coefficients Checking Model Assumptions Relation between Experience and Wage 10 Frequently Asked Questions Prof. Dr. Dr. K. Van Steen Elements of statistics (MATH0487-1)

7 Introduction to Statistics Basic Probability Revisited Sampling Exploratory Data Dichotomous Analysis - EDA Variables Estimation Chi-square Confidence Tests Intervals Hypothesis Testing Tab Testing Hypothesis with Table Data Several Types of χ 2 -tests: The following tests give rise to test statistics that follow a χ 2 -distribution under their appropriate null (hypothesis) Test of Goodness of fit Test of independence Test of homogeneity or (no) association Prof. Dr. Dr. K. Van Steen Elements of statistics (MATH0487-1)
 association Prof. Dr. Dr. K.")
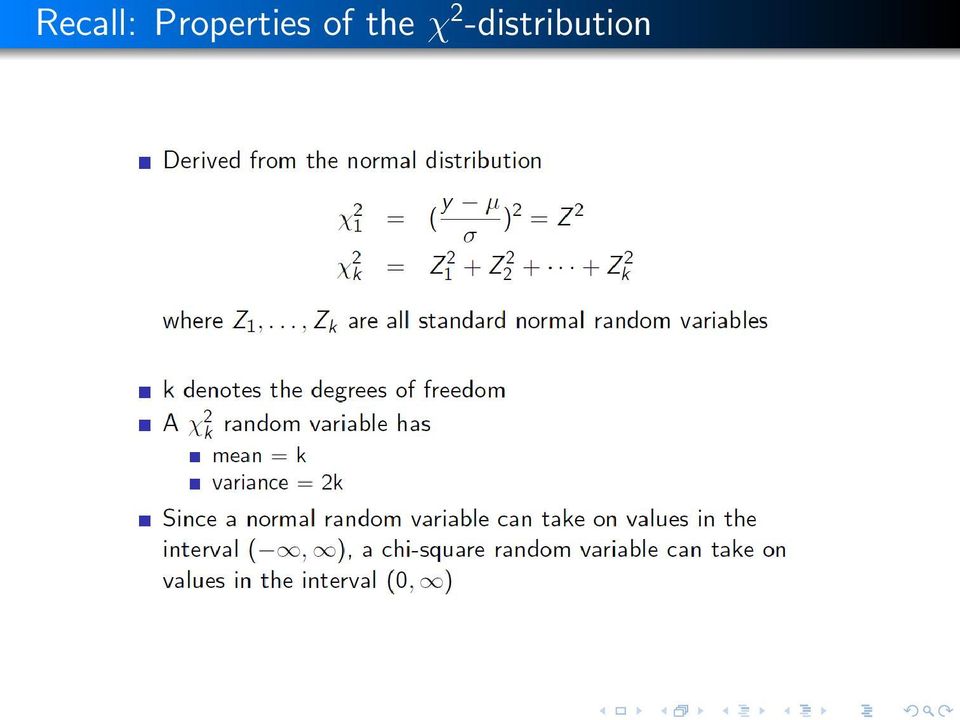
8 Recall: Properties of the χ 2 -distribution
9 A family of χ 2 -distributions

10 Critical values of χ 2

11 The χ 2 -table

12 The χ 2 -table via the R software

13 Introduction to Statistics Basic Probability Revisited Sampling Exploratory Data Dichotomous Analysis - EDA Variables Estimation Chi-square Confidence Tests Intervals Hypothesis Testing Tab The χ 2 goodness-of-fit test Prof. Dr. Dr. K. Van Steen Elements of statistics (MATH0487-1)

14 The χ 2 goodness-of-fit test

15 Example: Handgun survey

16 Example: Handgun survey

17 Example: Handgun survey

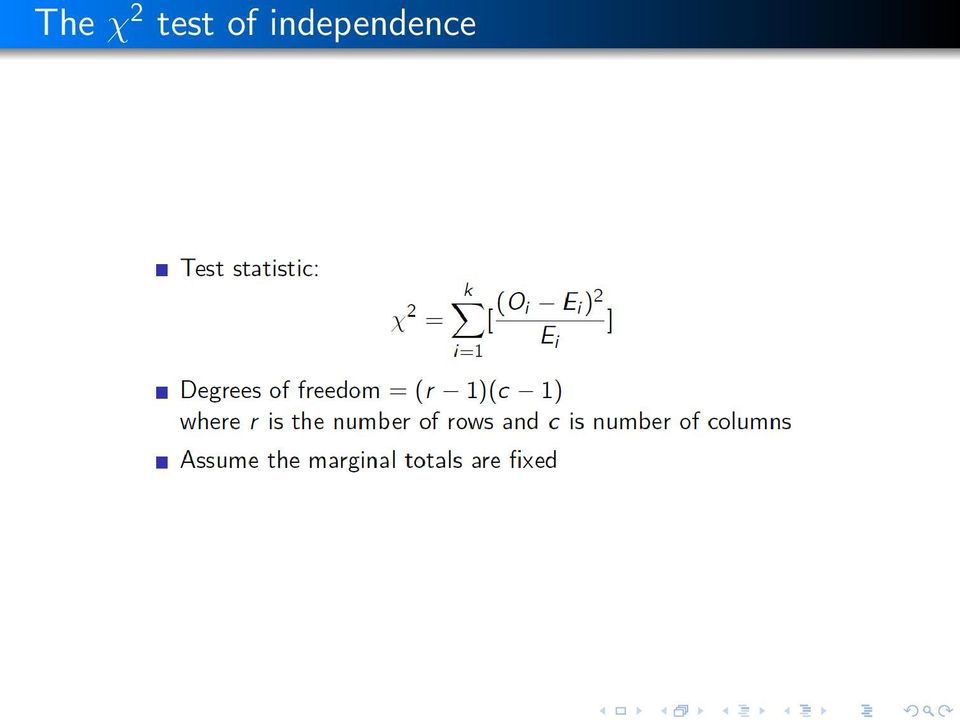
18 Introduction to Statistics Basic Probability Revisited Sampling Exploratory Data Dichotomous Analysis - EDA Variables Estimation Chi-square Confidence Tests Intervals Hypothesis Testing Tab The χ 2 test of independence Prof. Dr. Dr. K. Van Steen Elements of statistics (MATH0487-1)

19 The χ 2 test of independence
20 Introduction to Statistics Basic Probability Revisited Sampling Exploratory Data Dichotomous Analysis - EDA Variables Estimation Chi-square Confidence Tests Intervals Hypothesis Testing Tab The χ 2 test of no association (homogeneity) Prof. Dr. Dr. K. Van Steen Elements of statistics (MATH0487-1)
 Prof. Dr. Dr. K.")
21 Example: treatment response
22 Example: treatment response
23 Example: treatment response
24 Introduction to Statistics Basic Probability Revisited Sampling Exploratory Data Correlation Analysis -Analysis EDA Estimation Simple Linear Confidence Regression Intervals Centering Hypothesis Inference Testing on Regre Tab Quanitfying Associations Prof. Dr. Dr. K. Van Steen Elements of statistics (MATH0487-1)
25 Correlation Analysis
26 Correlation Coefficients
27 Correlation Coefficients
28 Correlation Coefficients
29 To Remember
30 To Remember
31 Examples
32 Examples
33 Examples
34 Examples
35 Association and Causality
36 Bradford Hill s Criteria for Causality
37 Introduction to Statistics Basic Probability Revisited Sampling Exploratory Data Correlation Analysis -Analysis EDA Estimation Simple Linear Confidence Regression Intervals Centering Hypothesis Inference Testing on Regre Tab Simple Linear Regression (SLR) Prof. Dr. Dr. K. Van Steen Elements of statistics (MATH0487-1)
38 Example Boxplot of % low income by education level:
39 Simple Linear Regression: Regression Line
40 Regression Analysis represented by Regression Line Equation
41 Interpretation of Regression Model Components
42 Interpretation of Regression Model Components
43 Why is Linear Regression so popular? Linear regression can refer to simple linear regression (one predictor) or multiple linear regression (more than 1 predictor) Linear regression naturally extends to quadratic, cubic... regression to investigate curvilinear relationships Linear regression is flexible, since it can deal with binary X continuous X categorical X confounders interactions (leading to k-order regression models)

44 Example: Galton s study on height
45 Example: Galton s study on height
46 Regression Formalism I
47 Regression Formalism II
48 Regression Formalism: Model Assumptions The regression formalism naturally leads to four model assumptions: The relationship is linear The errors have the same variance The errors are independent of each other The errors are normally distributed When we satisfy the assumptions, it means that we have used all of the information available from the patterns in the data. When we violate an assumption, it usually means that there is a pattern to the data that we have not included in our model, and we could actually find a model that fits the data better.
49 Regression Formalism: Geometric Interpretation
50 Another example: City education versus income
51 Another example: City education versus income
52 Introduction to Statistics Basic Probability Revisited Sampling Exploratory Data Correlation Analysis -Analysis EDA Estimation Simple Linear Confidence Regression Intervals Centering Hypothesis Inference Testing on Regre Tab Where is our Intercept? Prof. Dr. Dr. K. Van Steen Elements of statistics (MATH0487-1)
53 Need for Centering As in the City education versus income example:
54 Centering Use c = 12, as education level to center with:
55 Centering - New Regression Equation / Interpretation
56 Using Sample Data to Estimate the Truth So far, we have presented our fitted regression line as ŷ i = β 0 +β 1 x i, without having said anything about how to obtain the best such regression line.
57 Using Sample Data to Estimate the Truth Note: Sometimes linear regression is referred to as least squares regression. This has to do with the fact that a criterium of minimizing squared deviations from the mean is often used to estimate the parameters of the regression model. However, other estimation methods exist (beyond the scope of this course). Hence, since we actually used a sample to estimate the population regression line, a more accurate notation would have been ŷ i = ˆβ 0 + ˆβ 1 x i

58 Drawing Conclusions about Population Associations
59 Hypothesis Testing in Regression Formulation of null hypothesis, alternative hypothesis, derivation of test statistic:
60 Hypothesis Testing in Regression Would you have expected this statistic to follow a t-distribution?
61 Hypothesis Testing in Regression Would you have expected this statistic to follow a t-distribution? Summary table:confidence intervals for difference in means
62 Example: Education

63 Example: Education
64 The use of Confidence Intervals It becomes easy once you have a pivotal quantity identified:

65 The use of Confidence Intervals

66 Introduction to Statistics Basic Probability Revisited Sampling Exploratory Data Correlation Analysis -Analysis EDA Estimation Simple Linear Confidence Regression Intervals Centering Hypothesis Inference Testing on Regre Tab Statistical Modeling General Approach: Prof. Dr. Dr. K. Van Steen Elements of statistics (MATH0487-1)

67 Statistical Modeling General Approach (continued):
68 Model Validity Checks
69 Model Validity Checks What do we have to check?

70 Model Validity Checks How do we have to check?
71 Residual Plots
72 LINE: Linear relationship
73 LINE: Linear relationship In applied statistics, a partial regression plot attempts to show the effect of adding an additional variable to the model (given that one or more independent variables are already in the model). Partial regression plots are also referred to as added variable plots or adjusted variable plots. Partial regression plots are formed by: 1 Computing the residuals of regressing the response variable against the independent variables but omitting Xi 2 Computing the residuals from regressing Xi against the remaining independent variables 3 Plotting the residuals from 1. against the residuals from 2.
74 LINE: Independent observations The relevant question here is: Are all the subjects surveyed independent of one another? In order to answer this question, one needs information about how the data were collected... Can the independence assumption be assessed graphically?
75 LINE: Independent observations Can the independence assumption be assessed graphically? If the lag plot (Y i versus Y i 1 ) is without structure, then the randomness assumption holds...
76 LINE

77 LINE
78 Graphical Model Validity Checks Plotting y versus x
79 Graphical Model Validity Checks: Residual Analysis Standardized residuals:

80 Graphical Model Validity Checks: Residual Analysis

81 Example 1: Residual Analysis on Health Status
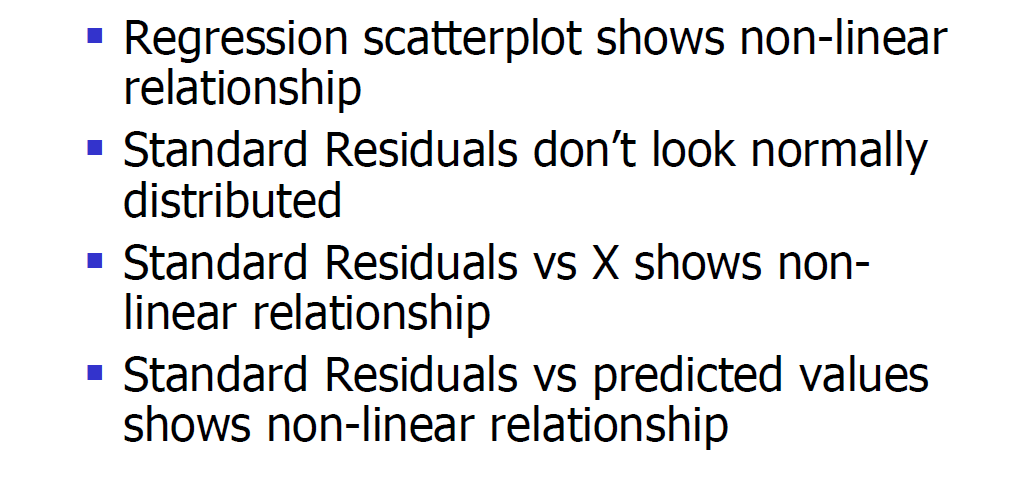
82 Example 2: Non-linearity

83 Example 3: Outliers

84 Example 4: Non-normality

85 Example 5: Heteroscedasticity
86 Minimal Practice: Fit a regression line and...
87 Check model assumptions For instance, plot residuals versus x:
88 Check model assumptions Compute standardized residuals: Note that for a normal distribution, About 68.27% of the values lie within 1 standard deviation of the mean. Similarly, about 95.45% of the values lie within 2 standard deviations of the mean. Nearly all (99.73%) of the values lie within 3 standard deviations of the mean
89 Check model assumptions Plot standardized residuals versus x: Model fit: Residual pattern for people with very little experience?

90 Caution: Outliers Check

91 Caution: Normality Check
92 Caution: Homescedasticity Check
93 Recapitulation Questions?
94 Introduction to Statistics Basic Probability Revisited Sampling Exploratory Data Analysis - EDA Estimation Confidence Intervals Hypothesis Testing Tab Acknowledgements Most slides on formal statistical inference, chi-square testing and regression are based on an excellent course series of Sandy Eckel, Department of Biostatistics, Johns Hopkins Bloomberg School of Public Health, USA. Prof. Dr. Dr. K. Van Steen Elements of statistics (MATH0487-1)
Simple Linear Regression Inference
 Simple Linear Regression Inference 1 Inference requirements The Normality assumption of the stochastic term e is needed for inference even if it is not a OLS requirement. Therefore we have: Interpretation
Chapter 7: Simple linear regression Learning Objectives
 Chapter 7: Simple linear regression Learning Objectives Reading: Section 7.1 of OpenIntro Statistics Video: Correlation vs. causation, YouTube (2:19) Video: Intro to Linear Regression, YouTube (5:18) -
Institute of Actuaries of India Subject CT3 Probability and Mathematical Statistics
 Institute of Actuaries of India Subject CT3 Probability and Mathematical Statistics For 2015 Examinations Aim The aim of the Probability and Mathematical Statistics subject is to provide a grounding in
Fairfield Public Schools
 Mathematics Fairfield Public Schools AP Statistics AP Statistics BOE Approved 04/08/2014 1 AP STATISTICS Critical Areas of Focus AP Statistics is a rigorous course that offers advanced students an opportunity
Introduction to Regression and Data Analysis
 Statlab Workshop Introduction to Regression and Data Analysis with Dan Campbell and Sherlock Campbell October 28, 2008 I. The basics A. Types of variables Your variables may take several forms, and it
Example: Boats and Manatees
 Figure 9-6 Example: Boats and Manatees Slide 1 Given the sample data in Table 9-1, find the value of the linear correlation coefficient r, then refer to Table A-6 to determine whether there is a significant
Factors affecting online sales
 Factors affecting online sales Table of contents Summary... 1 Research questions... 1 The dataset... 2 Descriptive statistics: The exploratory stage... 3 Confidence intervals... 4 Hypothesis tests... 4
Example: Credit card default, we may be more interested in predicting the probabilty of a default than classifying individuals as default or not.
 Statistical Learning: Chapter 4 Classification 4.1 Introduction Supervised learning with a categorical (Qualitative) response Notation: - Feature vector X, - qualitative response Y, taking values in C
" Y. Notation and Equations for Regression Lecture 11/4. Notation:
 Notation: Notation and Equations for Regression Lecture 11/4 m: The number of predictor variables in a regression Xi: One of multiple predictor variables. The subscript i represents any number from 1 through
Business Statistics. Successful completion of Introductory and/or Intermediate Algebra courses is recommended before taking Business Statistics.
 Business Course Text Bowerman, Bruce L., Richard T. O'Connell, J. B. Orris, and Dawn C. Porter. Essentials of Business, 2nd edition, McGraw-Hill/Irwin, 2008, ISBN: 978-0-07-331988-9. Required Computing
MTH 140 Statistics Videos
 MTH 140 Statistics Videos Chapter 1 Picturing Distributions with Graphs Individuals and Variables Categorical Variables: Pie Charts and Bar Graphs Categorical Variables: Pie Charts and Bar Graphs Quantitative
Curriculum Map Statistics and Probability Honors (348) Saugus High School Saugus Public Schools 2009-2010
 Saugus High School Saugus Public Schools 2009-2010") Curriculum Map Statistics and Probability Honors (348) Saugus High School Saugus Public Schools 2009-2010 Week 1 Week 2 14.0 Students organize and describe distributions of data by using a number of different
Curriculum Map Statistics and Probability Honors (348) Saugus High School Saugus Public Schools 2009-2010 Week 1 Week 2 14.0 Students organize and describe distributions of data by using a number of different
Regression Analysis: A Complete Example
 Regression Analysis: A Complete Example This section works out an example that includes all the topics we have discussed so far in this chapter. A complete example of regression analysis. PhotoDisc, Inc./Getty
11. Analysis of Case-control Studies Logistic Regression
 Research methods II 113 11. Analysis of Case-control Studies Logistic Regression This chapter builds upon and further develops the concepts and strategies described in Ch.6 of Mother and Child Health:
Statistics 305: Introduction to Biostatistical Methods for Health Sciences
 Statistics 305: Introduction to Biostatistical Methods for Health Sciences Modelling the Log Odds Logistic Regression (Chap 20) Instructor: Liangliang Wang Statistics and Actuarial Science, Simon Fraser
Course Text. Required Computing Software. Course Description. Course Objectives. StraighterLine. Business Statistics
 Course Text Business Statistics Lind, Douglas A., Marchal, William A. and Samuel A. Wathen. Basic Statistics for Business and Economics, 7th edition, McGraw-Hill/Irwin, 2010, ISBN: 9780077384470 [This
CHAPTER 13 SIMPLE LINEAR REGRESSION. Opening Example. Simple Regression. Linear Regression
 Opening Example CHAPTER 13 SIMPLE LINEAR REGREION SIMPLE LINEAR REGREION! Simple Regression! Linear Regression Simple Regression Definition A regression model is a mathematical equation that descries the
Biostatistics: Types of Data Analysis
 Biostatistics: Types of Data Analysis Theresa A Scott, MS Vanderbilt University Department of Biostatistics [email protected] http://biostat.mc.vanderbilt.edu/theresascott Theresa A Scott, MS
Silvermine House Steenberg Office Park, Tokai 7945 Cape Town, South Africa Telephone: +27 21 702 4666 www.spss-sa.com
 SPSS-SA Silvermine House Steenberg Office Park, Tokai 7945 Cape Town, South Africa Telephone: +27 21 702 4666 www.spss-sa.com SPSS-SA Training Brochure 2009 TABLE OF CONTENTS 1 SPSS TRAINING COURSES FOCUSING
Assumptions. Assumptions of linear models. Boxplot. Data exploration. Apply to response variable. Apply to error terms from linear model
 Assumptions Assumptions of linear models Apply to response variable within each group if predictor categorical Apply to error terms from linear model check by analysing residuals Normality Homogeneity
Organizing Your Approach to a Data Analysis
 Biost/Stat 578 B: Data Analysis Emerson, September 29, 2003 Handout #1 Organizing Your Approach to a Data Analysis The general theme should be to maximize thinking about the data analysis and to minimize
NCSS Statistical Software Principal Components Regression. In ordinary least squares, the regression coefficients are estimated using the formula ( )
") Chapter 340 Principal Components Regression Introduction is a technique for analyzing multiple regression data that suffer from multicollinearity. When multicollinearity occurs, least squares estimates
Chapter 340 Principal Components Regression Introduction is a technique for analyzing multiple regression data that suffer from multicollinearity. When multicollinearity occurs, least squares estimates
SPSS Explore procedure
 SPSS Explore procedure One useful function in SPSS is the Explore procedure, which will produce histograms, boxplots, stem-and-leaf plots and extensive descriptive statistics. To run the Explore procedure,
Lecture 1: Review and Exploratory Data Analysis (EDA)
") Lecture 1: Review and Exploratory Data Analysis (EDA) Sandy Eckel [email protected] Department of Biostatistics, The Johns Hopkins University, Baltimore USA 21 April 2008 1 / 40 Course Information I Course
Lecture 1: Review and Exploratory Data Analysis (EDA) Sandy Eckel [email protected] Department of Biostatistics, The Johns Hopkins University, Baltimore USA 21 April 2008 1 / 40 Course Information I Course
Simple linear regression
 Simple linear regression Introduction Simple linear regression is a statistical method for obtaining a formula to predict values of one variable from another where there is a causal relationship between
1. The parameters to be estimated in the simple linear regression model Y=α+βx+ε ε~n(0,σ) are: a) α, β, σ b) α, β, ε c) a, b, s d) ε, 0, σ
 are: a) α, β, σ b) α, β, ε c) a, b, s d) ε, 0, σ") STA 3024 Practice Problems Exam 2 NOTE: These are just Practice Problems. This is NOT meant to look just like the test, and it is NOT the only thing that you should study. Make sure you know all the material
STA 3024 Practice Problems Exam 2 NOTE: These are just Practice Problems. This is NOT meant to look just like the test, and it is NOT the only thing that you should study. Make sure you know all the material
 T O P I C 1 2 Techniques and tools for data analysis Preview Introduction In chapter 3 of Statistics In A Day different combinations of numbers and types of variables are presented. We go through these
Chapter 13 Introduction to Linear Regression and Correlation Analysis
 Chapter 3 Student Lecture Notes 3- Chapter 3 Introduction to Linear Regression and Correlation Analsis Fall 2006 Fundamentals of Business Statistics Chapter Goals To understand the methods for displaing
Applied Multiple Regression/Correlation Analysis for the Behavioral Sciences
 Applied Multiple Regression/Correlation Analysis for the Behavioral Sciences Third Edition Jacob Cohen (deceased) New York University Patricia Cohen New York State Psychiatric Institute and Columbia University
Service courses for graduate students in degree programs other than the MS or PhD programs in Biostatistics.
 Course Catalog In order to be assured that all prerequisites are met, students must acquire a permission number from the education coordinator prior to enrolling in any Biostatistics course. Courses are
Statistics in Retail Finance. Chapter 2: Statistical models of default
 Statistics in Retail Finance 1 Overview > We consider how to build statistical models of default, or delinquency, and how such models are traditionally used for credit application scoring and decision
Directions for using SPSS
 Directions for using SPSS Table of Contents Connecting and Working with Files 1. Accessing SPSS... 2 2. Transferring Files to N:\drive or your computer... 3 3. Importing Data from Another File Format...
Factor Analysis. Principal components factor analysis. Use of extracted factors in multivariate dependency models
 Factor Analysis Principal components factor analysis Use of extracted factors in multivariate dependency models 2 KEY CONCEPTS ***** Factor Analysis Interdependency technique Assumptions of factor analysis
List of Examples. Examples 319
 Examples 319 List of Examples DiMaggio and Mantle. 6 Weed seeds. 6, 23, 37, 38 Vole reproduction. 7, 24, 37 Wooly bear caterpillar cocoons. 7 Homophone confusion and Alzheimer s disease. 8 Gear tooth strength.
Least Squares Estimation
 Least Squares Estimation SARA A VAN DE GEER Volume 2, pp 1041 1045 in Encyclopedia of Statistics in Behavioral Science ISBN-13: 978-0-470-86080-9 ISBN-10: 0-470-86080-4 Editors Brian S Everitt & David
Regression Modeling Strategies
 Frank E. Harrell, Jr. Regression Modeling Strategies With Applications to Linear Models, Logistic Regression, and Survival Analysis With 141 Figures Springer Contents Preface Typographical Conventions
Final Exam Practice Problem Answers
 Final Exam Practice Problem Answers The following data set consists of data gathered from 77 popular breakfast cereals. The variables in the data set are as follows: Brand: The brand name of the cereal
Lecture 3: Linear methods for classification
 Lecture 3: Linear methods for classification Rafael A. Irizarry and Hector Corrada Bravo February, 2010 Today we describe four specific algorithms useful for classification problems: linear regression,
Data analysis process
 Data analysis process Data collection and preparation Collect data Prepare codebook Set up structure of data Enter data Screen data for errors Exploration of data Descriptive Statistics Graphs Analysis
430 Statistics and Financial Mathematics for Business
 Prescription: 430 Statistics and Financial Mathematics for Business Elective prescription Level 4 Credit 20 Version 2 Aim Students will be able to summarise, analyse, interpret and present data, make predictions
17. SIMPLE LINEAR REGRESSION II
 17. SIMPLE LINEAR REGRESSION II The Model In linear regression analysis, we assume that the relationship between X and Y is linear. This does not mean, however, that Y can be perfectly predicted from X.
Chapter 7 Notes - Inference for Single Samples. You know already for a large sample, you can invoke the CLT so:
 Chapter 7 Notes - Inference for Single Samples You know already for a large sample, you can invoke the CLT so: X N(µ, ). Also for a large sample, you can replace an unknown σ by s. You know how to do a
Overview Classes. 12-3 Logistic regression (5) 19-3 Building and applying logistic regression (6) 26-3 Generalizations of logistic regression (7)
 19-3 Building and applying logistic regression (6) 26-3 Generalizations of logistic regression (7)") Overview Classes 12-3 Logistic regression (5) 19-3 Building and applying logistic regression (6) 26-3 Generalizations of logistic regression (7) 2-4 Loglinear models (8) 5-4 15-17 hrs; 5B02 Building and
Overview Classes 12-3 Logistic regression (5) 19-3 Building and applying logistic regression (6) 26-3 Generalizations of logistic regression (7) 2-4 Loglinear models (8) 5-4 15-17 hrs; 5B02 Building and
business statistics using Excel OXFORD UNIVERSITY PRESS Glyn Davis & Branko Pecar
 business statistics using Excel Glyn Davis & Branko Pecar OXFORD UNIVERSITY PRESS Detailed contents Introduction to Microsoft Excel 2003 Overview Learning Objectives 1.1 Introduction to Microsoft Excel
The importance of graphing the data: Anscombe s regression examples
 The importance of graphing the data: Anscombe s regression examples Bruce Weaver Northern Health Research Conference Nipissing University, North Bay May 30-31, 2008 B. Weaver, NHRC 2008 1 The Objective
The Basic Two-Level Regression Model
 2 The Basic Two-Level Regression Model The multilevel regression model has become known in the research literature under a variety of names, such as random coefficient model (de Leeuw & Kreft, 1986; Longford,
Descriptive Statistics
 Descriptive Statistics Primer Descriptive statistics Central tendency Variation Relative position Relationships Calculating descriptive statistics Descriptive Statistics Purpose to describe or summarize
SAS Software to Fit the Generalized Linear Model
 SAS Software to Fit the Generalized Linear Model Gordon Johnston, SAS Institute Inc., Cary, NC Abstract In recent years, the class of generalized linear models has gained popularity as a statistical modeling
Simple Predictive Analytics Curtis Seare
 Using Excel to Solve Business Problems: Simple Predictive Analytics Curtis Seare Copyright: Vault Analytics July 2010 Contents Section I: Background Information Why use Predictive Analytics? How to use
4. Simple regression. QBUS6840 Predictive Analytics. https://www.otexts.org/fpp/4
 4. Simple regression QBUS6840 Predictive Analytics https://www.otexts.org/fpp/4 Outline The simple linear model Least squares estimation Forecasting with regression Non-linear functional forms Regression
1. What is the critical value for this 95% confidence interval? CV = z.025 = invnorm(0.025) = 1.96
 = 1.96") 1 Final Review 2 Review 2.1 CI 1-propZint Scenario 1 A TV manufacturer claims in its warranty brochure that in the past not more than 10 percent of its TV sets needed any repair during the first two years
1 Final Review 2 Review 2.1 CI 1-propZint Scenario 1 A TV manufacturer claims in its warranty brochure that in the past not more than 10 percent of its TV sets needed any repair during the first two years
HYPOTHESIS TESTING: CONFIDENCE INTERVALS, T-TESTS, ANOVAS, AND REGRESSION
 HYPOTHESIS TESTING: CONFIDENCE INTERVALS, T-TESTS, ANOVAS, AND REGRESSION HOD 2990 10 November 2010 Lecture Background This is a lightning speed summary of introductory statistical methods for senior undergraduate
2. Simple Linear Regression
 Research methods - II 3 2. Simple Linear Regression Simple linear regression is a technique in parametric statistics that is commonly used for analyzing mean response of a variable Y which changes according
Multiple Regression: What Is It?
 Multiple Regression Multiple Regression: What Is It? Multiple regression is a collection of techniques in which there are multiple predictors of varying kinds and a single outcome We are interested in
Week TSX Index 1 8480 2 8470 3 8475 4 8510 5 8500 6 8480
 1) The S & P/TSX Composite Index is based on common stock prices of a group of Canadian stocks. The weekly close level of the TSX for 6 weeks are shown: Week TSX Index 1 8480 2 8470 3 8475 4 8510 5 8500
STATISTICA Formula Guide: Logistic Regression. Table of Contents
 : Table of Contents... 1 Overview of Model... 1 Dispersion... 2 Parameterization... 3 Sigma-Restricted Model... 3 Overparameterized Model... 4 Reference Coding... 4 Model Summary (Summary Tab)... 5 Summary
Ordinal Regression. Chapter
 Ordinal Regression Chapter 4 Many variables of interest are ordinal. That is, you can rank the values, but the real distance between categories is unknown. Diseases are graded on scales from least severe
Section Format Day Begin End Building Rm# Instructor. 001 Lecture Tue 6:45 PM 8:40 PM Silver 401 Ballerini
 NEW YORK UNIVERSITY ROBERT F. WAGNER GRADUATE SCHOOL OF PUBLIC SERVICE Course Syllabus Spring 2016 Statistical Methods for Public, Nonprofit, and Health Management Section Format Day Begin End Building
Penalized regression: Introduction
 Penalized regression: Introduction Patrick Breheny August 30 Patrick Breheny BST 764: Applied Statistical Modeling 1/19 Maximum likelihood Much of 20th-century statistics dealt with maximum likelihood
LOGIT AND PROBIT ANALYSIS
 LOGIT AND PROBIT ANALYSIS A.K. Vasisht I.A.S.R.I., Library Avenue, New Delhi 110 012 [email protected] In dummy regression variable models, it is assumed implicitly that the dependent variable Y
AP Statistics: Syllabus 1
 AP Statistics: Syllabus 1 Scoring Components SC1 The course provides instruction in exploring data. 4 SC2 The course provides instruction in sampling. 5 SC3 The course provides instruction in experimentation.
Linear Regression. Chapter 5. Prediction via Regression Line Number of new birds and Percent returning. Least Squares
 Linear Regression Chapter 5 Regression Objective: To quantify the linear relationship between an explanatory variable (x) and response variable (y). We can then predict the average response for all subjects
Introduction to Quantitative Methods
 Introduction to Quantitative Methods October 15, 2009 Contents 1 Definition of Key Terms 2 2 Descriptive Statistics 3 2.1 Frequency Tables......................... 4 2.2 Measures of Central Tendencies.................
Multiple Linear Regression
 Multiple Linear Regression A regression with two or more explanatory variables is called a multiple regression. Rather than modeling the mean response as a straight line, as in simple regression, it is
A Primer on Mathematical Statistics and Univariate Distributions; The Normal Distribution; The GLM with the Normal Distribution
 A Primer on Mathematical Statistics and Univariate Distributions; The Normal Distribution; The GLM with the Normal Distribution PSYC 943 (930): Fundamentals of Multivariate Modeling Lecture 4: September
A Primer on Forecasting Business Performance
 A Primer on Forecasting Business Performance There are two common approaches to forecasting: qualitative and quantitative. Qualitative forecasting methods are important when historical data is not available.
Section 14 Simple Linear Regression: Introduction to Least Squares Regression
 Slide 1 Section 14 Simple Linear Regression: Introduction to Least Squares Regression There are several different measures of statistical association used for understanding the quantitative relationship
Title: Lending Club Interest Rates are closely linked with FICO scores and Loan Length
 Title: Lending Club Interest Rates are closely linked with FICO scores and Loan Length Introduction: The Lending Club is a unique website that allows people to directly borrow money from other people [1].
How To Check For Differences In The One Way Anova
 MINITAB ASSISTANT WHITE PAPER This paper explains the research conducted by Minitab statisticians to develop the methods and data checks used in the Assistant in Minitab 17 Statistical Software. One-Way
Note 2 to Computer class: Standard mis-specification tests
 Note 2 to Computer class: Standard mis-specification tests Ragnar Nymoen September 2, 2013 1 Why mis-specification testing of econometric models? As econometricians we must relate to the fact that the
Univariate Regression
 Univariate Regression Correlation and Regression The regression line summarizes the linear relationship between 2 variables Correlation coefficient, r, measures strength of relationship: the closer r is
16 : Demand Forecasting
 16 : Demand Forecasting 1 Session Outline Demand Forecasting Subjective methods can be used only when past data is not available. When past data is available, it is advisable that firms should use statistical
Statistics I for QBIC. Contents and Objectives. Chapters 1 7. Revised: August 2013
 Statistics I for QBIC Text Book: Biostatistics, 10 th edition, by Daniel & Cross Contents and Objectives Chapters 1 7 Revised: August 2013 Chapter 1: Nature of Statistics (sections 1.1-1.6) Objectives
5. Linear Regression
 5. Linear Regression Outline.................................................................... 2 Simple linear regression 3 Linear model............................................................. 4
Generalized Linear Models
 Generalized Linear Models We have previously worked with regression models where the response variable is quantitative and normally distributed. Now we turn our attention to two types of models where the
Unit 31 A Hypothesis Test about Correlation and Slope in a Simple Linear Regression
 Unit 31 A Hypothesis Test about Correlation and Slope in a Simple Linear Regression Objectives: To perform a hypothesis test concerning the slope of a least squares line To recognize that testing for a
Statistical Models in R
 Statistical Models in R Some Examples Steven Buechler Department of Mathematics 276B Hurley Hall; 1-6233 Fall, 2007 Outline Statistical Models Structure of models in R Model Assessment (Part IA) Anova
Recall this chart that showed how most of our course would be organized:
 Chapter 4 One-Way ANOVA Recall this chart that showed how most of our course would be organized: Explanatory Variable(s) Response Variable Methods Categorical Categorical Contingency Tables Categorical
RARITAN VALLEY COMMUNITY COLLEGE ACADEMIC COURSE OUTLINE MATH 111H STATISTICS II HONORS
 RARITAN VALLEY COMMUNITY COLLEGE ACADEMIC COURSE OUTLINE MATH 111H STATISTICS II HONORS I. Basic Course Information A. Course Number and Title: MATH 111H Statistics II Honors B. New or Modified Course:
Additional sources Compilation of sources: http://lrs.ed.uiuc.edu/tseportal/datacollectionmethodologies/jin-tselink/tselink.htm
 Mgt 540 Research Methods Data Analysis 1 Additional sources Compilation of sources: http://lrs.ed.uiuc.edu/tseportal/datacollectionmethodologies/jin-tselink/tselink.htm http://web.utk.edu/~dap/random/order/start.htm
MULTIPLE REGRESSION AND ISSUES IN REGRESSION ANALYSIS
 MULTIPLE REGRESSION AND ISSUES IN REGRESSION ANALYSIS MSR = Mean Regression Sum of Squares MSE = Mean Squared Error RSS = Regression Sum of Squares SSE = Sum of Squared Errors/Residuals α = Level of Significance
Simple Linear Regression
 STAT 101 Dr. Kari Lock Morgan Simple Linear Regression SECTIONS 9.3 Confidence and prediction intervals (9.3) Conditions for inference (9.1) Want More Stats??? If you have enjoyed learning how to analyze
12.5: CHI-SQUARE GOODNESS OF FIT TESTS
 125: Chi-Square Goodness of Fit Tests CD12-1 125: CHI-SQUARE GOODNESS OF FIT TESTS In this section, the χ 2 distribution is used for testing the goodness of fit of a set of data to a specific probability
GLM I An Introduction to Generalized Linear Models
 GLM I An Introduction to Generalized Linear Models CAS Ratemaking and Product Management Seminar March 2009 Presented by: Tanya D. Havlicek, Actuarial Assistant 0 ANTITRUST Notice The Casualty Actuarial
POLYNOMIAL AND MULTIPLE REGRESSION. Polynomial regression used to fit nonlinear (e.g. curvilinear) data into a least squares linear regression model.
 data into a least squares linear regression model.") Polynomial Regression POLYNOMIAL AND MULTIPLE REGRESSION Polynomial regression used to fit nonlinear (e.g. curvilinear) data into a least squares linear regression model. It is a form of linear regression
Polynomial Regression POLYNOMIAL AND MULTIPLE REGRESSION Polynomial regression used to fit nonlinear (e.g. curvilinear) data into a least squares linear regression model. It is a form of linear regression
DATA ANALYSIS. QEM Network HBCU-UP Fundamentals of Education Research Workshop Gerunda B. Hughes, Ph.D. Howard University
 DATA ANALYSIS QEM Network HBCU-UP Fundamentals of Education Research Workshop Gerunda B. Hughes, Ph.D. Howard University Quantitative Research What is Statistics? Statistics (as a subject) is the science
Data Analysis, Research Study Design and the IRB
 Minding the p-values p and Quartiles: Data Analysis, Research Study Design and the IRB Don Allensworth-Davies, MSc Research Manager, Data Coordinating Center Boston University School of Public Health IRB
Description. Textbook. Grading. Objective
 EC151.02 Statistics for Business and Economics (MWF 8:00-8:50) Instructor: Chiu Yu Ko Office: 462D, 21 Campenalla Way Phone: 2-6093 Email: [email protected] Office Hours: by appointment Description This course
ROCHESTER INSTITUTE OF TECHNOLOGY COURSE OUTLINE FORM COLLEGE OF SCIENCE. School of Mathematical Sciences
 ! ROCHESTER INSTITUTE OF TECHNOLOGY COURSE OUTLINE FORM COLLEGE OF SCIENCE School of Mathematical Sciences New Revised COURSE: COS-MATH-252 Probability and Statistics II 1.0 Course designations and approvals:
The Statistics Tutor s Quick Guide to
 statstutor community project encouraging academics to share statistics support resources All stcp resources are released under a Creative Commons licence The Statistics Tutor s Quick Guide to Stcp-marshallowen-7
Premaster Statistics Tutorial 4 Full solutions
 Premaster Statistics Tutorial 4 Full solutions Regression analysis Q1 (based on Doane & Seward, 4/E, 12.7) a. Interpret the slope of the fitted regression = 125,000 + 150. b. What is the prediction for
Regression Analysis (Spring, 2000)
") Regression Analysis (Spring, 2000) By Wonjae Purposes: a. Explaining the relationship between Y and X variables with a model (Explain a variable Y in terms of Xs) b. Estimating and testing the intensity
Regression Analysis (Spring, 2000) By Wonjae Purposes: a. Explaining the relationship between Y and X variables with a model (Explain a variable Y in terms of Xs) b. Estimating and testing the intensity
Lecture 2: Descriptive Statistics and Exploratory Data Analysis
 Lecture 2: Descriptive Statistics and Exploratory Data Analysis Further Thoughts on Experimental Design 16 Individuals (8 each from two populations) with replicates Pop 1 Pop 2 Randomly sample 4 individuals
Multinomial Logistic Regression
 Multinomial Logistic Regression Dr. Jon Starkweather and Dr. Amanda Kay Moske Multinomial logistic regression is used to predict categorical placement in or the probability of category membership on a
Once saved, if the file was zipped you will need to unzip it. For the files that I will be posting you need to change the preferences.
 1 Commands in JMP and Statcrunch Below are a set of commands in JMP and Statcrunch which facilitate a basic statistical analysis. The first part concerns commands in JMP, the second part is for analysis
Chicago Booth BUSINESS STATISTICS 41000 Final Exam Fall 2011
 Chicago Booth BUSINESS STATISTICS 41000 Final Exam Fall 2011 Name: Section: I pledge my honor that I have not violated the Honor Code Signature: This exam has 34 pages. You have 3 hours to complete this
Simple Methods and Procedures Used in Forecasting
 Simple Methods and Procedures Used in Forecasting The project prepared by : Sven Gingelmaier Michael Richter Under direction of the Maria Jadamus-Hacura What Is Forecasting? Prediction of future events
Please follow the directions once you locate the Stata software in your computer. Room 114 (Business Lab) has computers with Stata software
 has computers with Stata software") STATA Tutorial Professor Erdinç Please follow the directions once you locate the Stata software in your computer. Room 114 (Business Lab) has computers with Stata software 1.Wald Test Wald Test is used
STATA Tutorial Professor Erdinç Please follow the directions once you locate the Stata software in your computer. Room 114 (Business Lab) has computers with Stata software 1.Wald Test Wald Test is used