Edwards Aquifer Recovery Implementation Program
|
|
|
- Sharon James
- 8 years ago
- Views:
Transcription
1 Edwards Aquifer Recovery Implementation Program Habitat Conservation Plan November 2012 Prepared For Dr. Robert L. Gulley Program Manager Prepared By RECON Environmental, Inc. Hicks & Company Zara Environmental LLC BIO-WEST

2 TABLE OF CONTENTS Chapter 1 Introduction Background Permit Area Permit Holders and Permit Duration Species Proposed for Coverage under the Permit Regulatory Framework Alternatives Considered during the Development of the HCP Public Involvement 1-18 Chapter 2 Activities Covered by the Permit Covered Activities Edwards Aquifer Authority City of New Braunfels City of San Marcos Texas State University San Antonio Water System Texas Parks and Wildlife Department Adaptive Management Process 2-16 Chapter 3 Environmental Setting and Baseline Conditions Climate Aquifer-fed Springs Edwards (Balcones Fault Zone) Aquifer The Edwards Aquifer, Comal Springs, and San Marcos Springs Listed Species Covered by the ESA Section 10(a)(1)(b) Incidental Take Permit Species Warranted for Listing Covered by the Section 10(a)(1)(B) Permit, If listed in the future 3-67 Chapter 4 Covered Species Analysis Introduction Long Term Biological Goals and Objectives Potential Impacts to and Incidental Take of Covered Species 4-36 Chapter 5 Minimization and Mitigation Measures; Measures Specifically Intended to Contribute to Recovery 5-1 ii

3 5.0 Approach to the Implementation of the Minimization and Mitigation Measures Edwards Aquifer Authority City of New Braunfels City of San Marcos Texas State University San Antonio Water System Texas Parks and Wildlife Department Measures that Specifically Contribute to Recovery HDR s Analysis of the Springflow Protection Measures EAA s Authority to Implement Measures to Maintain Springflow Prior to the Complete Implementation of the Phase I Package 5-56 Chapter 6 Adaptive Management Program Adaptive Management Process Monitoring Adaptive Management Research and Modeling for the Phase I Adjustments and Phase II Strategic Adaptive Management Decisions Core Adaptive Management Actions 6-14 Chapter 7 Costs and Funding Introduction Phase I Measures Funding Assurances for Any Additional Phase II Measures Alternative Funding 7-7 Chapter 8 Changed Circumstances, Unforeseen Circumstances, No Surprises, and Other Federal Commitments Introduction Changed Circumstances Unforeseen Circumstances Additional Federal Commitments 8-10 Chapter 9 Permit Administration Governance Permit Amendments Annual Reporting Subsequent Listing of Covered Species 9-5 iii

4 Chapter 10 Preparers and Contributors 10-1 Chapter 11 Abbreviations and Acronyms 11-1 Chapter 12 Literature Cited 12-1 FIGURES 1-1: Edwards Aquifer : EARIP HCP Plan Area : Summary of Alternative Minimization and Mitigation Measures Considered : Climate Regions of Texas : Average Annual High Temperature ( ) : Average Annual Precipitation ( ) : Projected Precipitation Differences between 2009 and 2050 based on : Division 6 Rainfall : Division 6 Rainfall Frequency Distribution : Three-year Moving Average Rainfall : Five-year Moving Average Rainfall : Seven-year Moving Average Rainfall : Ten-year Moving Average Rainfall a: 1956 Photo of Landa Lake b: 1956 Photo of Landa Lake : General Location Map of Springs 3-25 iv

5 3-13: Major Faults and Interpreted Groundwater Flowpaths to Comal and Hueco Springs : Cave Map of Fern Bank Springs : Geological Map showing the plotted Location of Fern Bank Springs Cave and Edwards Limestone Outcrop near the Blanco River Various Segments of the Edwards Aquifer : Estimated Annual Recharge and 10 Year Floating Average of Charge For the San Antonio Segment ( ) : Groundwater Pumping Compared to Springflow to the Edwards Aquifer a: Comal Springs Ecosystem Vicinity Map b: Comal Springs Ecosystem Vicinity Map a: San Marcos Springs Ecosystem Vicinity Map b: San Marcos Springs Ecosystem Vicinity Map c: San Marcos Springs Ecosystem Vicinity Map : Representative Sample Reaches Comal Springs : Comal Springs Riffle Beetle Sample Area : Representative Sample Reaches San Marcos Springs : San Marcos Salamander Sample Areas a: Direct Mortality Factors affecting the Fountain Darter and its Habitat b: Direct Mortality Factors affecting the Comal Springs Riffle Beetle and its Habitat c: Direct Mortality Factors affecting Texas Wild Rice a: Minimization and Mitigation Measures for Fountain Darter Impacts 4-43 v

6 4-6b: Minimization and Mitigation Measures for Comal Springs Riffle Beetle Impacts c: Minimization and Mitigation Measures for Texas Wild-Rice : Appreciable Reduction in the Likelihood of Survival and Recovery : Modeled Comal Total Springflow for No Action Baseline, Existing Baseline, and HCP (Phase I) for Model Period a: Modeled Comal Total Springflow for No Action Baseline, Existing Baseline, and HCP (Phase I and Phase II) for Model Period b: Modeled HCP-Phase I Comal Total Discharge Relative to the Minimum Flow-Related Management Objective c: Modeled HCP-Phase II Comal Total Discharge Relative to the Minimum Flow-Related Management Objective a: Modeled San Marcos Total Springflow for No Action Baseline, Existing Baseline, and HCP (Phase I) for Model Period b: Modeled San Marcos Total Springflow for the No Action Baseline, Existing Baseline, and HCP (Phase I and II) for the Model Period c: Modeled HCP-Phase I and Phase II San Marcos Total Discharge Relative to the Higher Flows Component of the Minimum Flow Objective : Stella Model Interface for Fountain Darter Habitat Model at Comal Springs : Habitat Quality Relationship for Bryophytes Versus Total Comal Springflow in the Upper Spring Run Reach : Total Comal Springflow Scenarios Evaluated in Stella : Total Fountain Darters within Representative Reaches Comal System: (No Old Channel ERPA) : Total Fountain Darters within Representative Reaches Comal System (with Old Channel ERPA) 4-77 vi

7 4-16: Low Flow Representative Nine-Year Rolling Average (Total Comal Springflow) for HCP, No Action Baseline, and Existing Baseline modeled scenarios and historically observed(old Channel ERPA) : Moderate Flow Representative Nine-Year Rolling Average (Total Comal Springflow) for the HCP, No Action Baseline, and Existing Baseline Modeled Scenarios and Historically Observed : High Flow Representative Nine-Year Rolling Average (Total Comal Springflow) for HCP, No Action Baseline, and Existing Baseline modeled scenarios and Historically observed : Modeled Fountain Darter Population at Comal Springs over the HCP Period for the HCP (with and without ERPA) and No Action Baseline : Modeled Fountain Darter Population at Comal Springs over the ITP for the HCP Phase I package and No Action Baseline : Modeled Wetted Area along Western Shoreline of Landa Lake and Spring Island at Total Daily Average Comal Discharge of 30 cfs : Stella Model Interface for Comal Springs Riffle Beetle Habitat Model at Comal Springs : Wetted Area to Flow Relationship for Spring Run 3 Sample Area : Total Comal Springflow current scenario ( ) Evaluated in Stella : Comal Springs Riffle Beetles (within sample areas) Predicted by Stella Model : Total Comal Springs Riffle Beetles within Sample Areas Predicted during the Low-Flow Representative Period for the HCP-Phase I Package, No-Action Baseline, Existing Baseline, and the Historical Conditions Comal System : Stella Model Interface for Fountain Darter Habitat Model at San Marcos Springs : Habitat Quality Relationship for Cabomba versus Total vii
 and No Action Baseline 4-86 4-20: Modeled Fountain Darter Population at Comal Springs over the ITP for the")
8 San Marcos Springflow as a Daily Average in the City Park Reach : Total San Marcos Springflow Scenarios Evaluated in Stella : Total Fountain Darters within Representative Reaches of the San Marcos System : Low, Moderate, and High Nine-year Rolling Averages (Total San Marcos Springflow) for Phase I package (Top) and No Action Baseline (bottom) Modeled Scenarios : Low, Moderate, and High Nine-year Rolling Averages of the No Action Baseline : Total Fountain Darters in the San Marcos System for the Phase I Package San Marcos System : Stella Model Interface for San Marcos Salamander Habitat Model at San Marcos Springs : Wetted Area to Flow Relationship for Eastern Spillway Sample Area : Total San Marcos Springflow (Daily Average) Current Scenario ( ) Evaluated in Stella : San Marcos Salamander (within Sample Areas) Predicted by Stella Habitat Model : Total San Marcos Salamanders for the HCP -- San Marcos System : Location and Geology Surrounding the Springs : Hydrographs of Comal and Hueco Springs, : Crossplot of Comal and Hueco Springflows : Areas Where San Marcos Will Implement Minimization and Mitigation Measures : Aquatic Harvester Zones in San Marcos Springs and River Ecosystem 5-32 viii

9 5-3: Texas State University Surface Water Diversions : Simulated Monthly Average Springflow at Comal Springs : Simulated Monthly Average Springflow at San Marcos Springs : Simulated Monthly Average Springflow at Comal Springs with the specified Phase II Presumptive Measure : Simulated Monthly Average Springflow at San Marcos Springs ( ) with the Specified Phase II Presumptive Measure 5-53 TABLES 1-1: Critical Period Withdrawal Reduction Stages for the San Antonio Pool : Critical Period Withdrawal Reduction Stages for the Uvalde Pool : Species Proposed for Coverage in the HCP : Critical Period Withdrawal Reduction Stages for the San Antonio Pool : Critical Period Withdrawal Reduction Stages for the Uvalde Pool : Annual Rainfall Records from Texas Climate Division : Probability of Drought of Record Based on Annual Rainfall Totals : Calculated and Modeled Probability of Recurrence of Drought of Record : Estimated Spring Discharge from the Edwards Aquifer, : Contributions of Major River Basins to Average Annual Recharge of the Edwards Aquifer, : Fountain Darter Habitat (Aquatic Vegetation) In Meters Squared (m 2 ) and Fountain Darter Median Density (number/m 2 ) Per Habitat Type 4-4 ix

10 4-2: Long-Term Average and Minimum Total Comal Discharge Management Objectives : Example of Bryophytes Areal Coverage in the Upper Spring Run Reach and Landa Lake, and Hygrophila Areal Coverage in the Old and New Channels Over Time : Fountain Darter Habitat in Comal Springs Ecosystem (m 2 ) (Aquatic Vegetation) : Maximum Fountain Darter Habitat (Aquatic Vegetation) (m 2 ) : Proposed Goals Fountain Darter Habitat (Aquatic Vegetation) (m 2 ) : Comal Springs Riffle Beetle Long-Term Biological Goals : Number of Comal Springs Riffle Beetles Captured During Each Sampling Event via Cotton Lure Methodology from 2004 through : Comal Springs Riffle Beetle Density (#/Lure) : Long-term Biological Goal for Texas Wild-Rice : Minimum Texas Wild-Rice Areal Coverage per Segment during Drought of Record-Like Conditions : Recreation Awareness throughout the Whole River at All Flows With Designated Control in the Following High Quality Habitat Areas below 100 cfs Total San Marcos Discharge : Long-Term Average and Minimum Total San Marcos Discharge Conditions : Texas Wild Rice Areal Coverage and Percentage of Breakdown per Combined River Segment for the 2009 TPWD Data : Full TPWD Data Set: : Recovery 1.5 Multiplier Goals : Post-1998 Flood Data 4-20 x
 4-14 4-10: Long-term Biological Goal for Texas Wild-Rice")
11 4-18: Recovery 1.5 Multiplier Goals Post-1998 Data : USFWS Texas Wild Rice Recovery Plan Recommendations : Comparison of Biological Goals Using Different Methodologies : Fountain Darter Habitat (Aquatic Vegetation) in Meters Squared (m 2 ) and Fountain Darter Median Density (number/m 2 ) per Habitat Type : Areal Coverage of Aquatic Vegetation by Reach Fountain Darter Habitat (Aquatic Vegetation) (m 2 ) : Maximum (m 2 ) Fountain Darter Habitat (Aquatic Vegetation) : Proposed Goals (m 2 ) for Fountain Darter Habitat in San Marcos Springs Ecosystem (Aquatic Vegetation) : San Marcos Salamander Long-term Biological Goals : San Marcos Salamander Density (number/m 2 ) : San Marcos Salamander Densities (number/m 2 ) : USFWS 1993 Determination of Minimum Springflows Needed to Prevent Take, Jeopardy, or Adverse Modification of Critical Habitat : Total Withdrawals from the Aquifer : Comal Springs Total Discharge Statistics for the Modeled No Action Baseline, Existing Baseline, And HCP (Phase I and II) Along with the Historically Observed Discharge from : San Marcos Springs Total Discharge Statistics for the Modeled No Action Baseline, Existing Baseline, and HCP (Phase I and II) Along with the Historically Observed Discharge : Fountain Darter Densities Per Aquatic Vegetation Type in the Comal System Over Time : Habitat Quality Ranking for Fountain Darter Densities 4-73 xi
 (m 2 ) 4-28 4-23: Maximum (m 2 ) Fountain Darter Habitat (Aquatic Vegetation) 4-30 4-24: Proposed Goals (m 2 ) for Fountain Darter Habitat in San Marcos Springs Ecosystem")
12 4-34: Total Fountain Darters within Representative Reaches for the HCP (with and without ERPA), No Action Baseline and Historical Conditions Comal System : Total Fountain Darters in the Comal System Based on a Conversion Factor of 0.19 Relative to Modeled Results from the Representative Reaches for the Phase I Package With and Without an Old Channel ERPA : Total Number of Comal Springs Riffle Beetles (Heterelmis Comalensis) Collected With Cotton Lures (Adults and Larvae) for Each EAA Variable Flow Sampling Date : Comal Springs Riffle Beetle Densities per Cotton Lure per Sample Area in the Comal System Over Time ( ) : Habitat Quality Ranking for Comal Springs Riffle Beetle Densities : Total Comal Springs Riffle Beetles within Sample Reaches for the Phase I Package, No Action Baseline, and Historical Conditions Comal System : Total Comal Springs Riffle Beetles per sample area for Current Conditions, Phase I Package, No Action Baseline, Existing Baseline and Historical Model Scenarios for the Low-Flow Representative Period : Size (m²) of Three Comal Springs Riffle Beetle Sample Areas and Percentage of Total Sample Area : Fountain Darter Densities per Aquatic Vegetation Type in the San Marcos System Over Time : Habitat Quality Ranking for Fountain Darter Densities : Total Fountain Darters within Representative Reaches for both the Phase I Package and No Action Baseline San Marcos System : Total Fountain Darters in the San Marcos River (excluding Spring Lake) Based on a Conversion Factor of 0.11 Relative to Modeled Results from the Representative Reaches for the Phase I Package xii
 Collected With Cotton Lures (Adults and Larvae) for Each EAA Variable Flow Sampling Date 2004 2010 4-91 4-37: Comal Springs Riffle Beetle Densities per Cotton Lure per Sample Area in the")
13 4-46: San Marcos Salamander Densities per Sample Area in the San Marcos System Over Time ( ) : Habitat Quality Ranking for San Marcos Salamander Densities : Total San Marcos Salamanders within Sample Reaches for Both the HCP and No Action Baseline San Marcos System : Total San Marcos Salamanders within Samples Areas Predicted for Current, HCP, and No Action Baseline Scenarios : Summary of Minimization and Mitigation Measures Included in the Phase I Package : Acre-Feet of Interest in VISPO by County : Flow-Split Management for Old and New Channels : Reductions in Surface Water Diversion Rates during Low Flow Conditions Under Texas State University s TCEQ Certificates and Number of Occurrences of Springflow Below Selected Thresholds ( ) : Monthly Average Springflow for Selected Statistics ( ) : Springflow Occurrences Below Selected Thresholds with Phase I And Phase II Measures ( ) : Springflow for Selected Conditions with Phase I and Phase II Mesures ( ) : Annualized Implementation Costs : Changed Circumstances and Response Measures 8-2 APPENDICES A: Memorandum of Agreement for the with the United States Fish and Wildlife Service, 2008 xiii

14 B: Report of the Science Subcommittee, Evaluation of Designating a San Marcos Pool, Maintaining Minimum Spring Flows at Comal and San Marcos Springs, and Adjusting the Critical Period Management Triggers for the San Marcos Springs, November 13, C: Sustainable Ecosystems Institute, Peer Review of the Edwards Aquifer Recovery Implementation Program s Science Subcommittee s k Charge Recommendations, March D: Report of the Science Subcommittee, Analysis of Species Requirements in Relation to Spring Discharge Rates and Associated Withdrawal Reductions and Stages for Critical Period Management of the Edwards Aquifer, December 28, E: Annear Associates, LLC, Peer Review of the Edwards Aquifer Recovery Implementation Program s Science Subcommittee Recommendations and the Hardy Study, May 28, F: Recharge Facilities Feasibility Subcommittee, Findings, Determinations and Recommendations Regarding Five Charges in Subsection (n) of Section 1.26A of the Edwards Aquifer Authority Act, November 23, G: Ecosystem Restoration Subcommittee, Restoration and Mitigation Actions for the Comal Springs Ecosystem, and Report on Restoration Options for the San Marcos River, December H: Dr. Thomas B. Hardy, Technical Assessments in Support of the Edwards Aquifer Science Committee J Charge Flow Regime Evaluation for Comal and San Marcos River Systems, December 29, I: Annear Associates, LLC, Professional Peer Review of Evaluation of the Proposed Drought of Record Minimum Flow Regimes in the Comal and San Marcos River Systems, June 13, J: BIO-WEST, Inc., Environmental Restoration and Protection Areas Feasibility Study: Comal Springs, February K: HDR Engineering, Inc. and Todd Engineers, Evaluation of Water Management Programs and Alternatives for Springflow Protection of Endangered Species at Comal and San Marcos Springs, October L: Halff Associates, Inc., Initial Study on the Recreational Impacts to Protected Species and Habitats in the Comal and San Marcos Springs Ecosystem, November 3, M: United States Fish and Wildlife Service San Marcos National Fish Hatchery and Technology Center and BIO-WEST, Inc., Effectiveness of Host Snail Removal in the xiv

15 Comal River, Texas and its impact on Densities of the Gill Parasite Centrocestus formosanus (Tremotada: Heterophyidae), February N: United States Fish and Wildlife Service, Austin, Texas Fish and Wildlife Service Office, Draft 2003 Comal Springs Ecosystem Management Plan, June O: Documents pertaining to the VISPO Program, P: Resolution adopted by the San Marcos City Council on February 1, Q: Report of the Edwards Aquifer Recovery Implementation Low Impact Development/Water Quality Workgroup, September 3, R: Funding and Management Agreement to Fund and Manage the Habitat Conservation Plan for the Edwards Aquifer recovery Implementation Program, November 11, S: SAWS ASR Work Group, SAWS ASR Concept, February T: Conservation Work Group, White Paper Water Conservation Program, August 31, U: Ecosystem Restoration Subcommittee, High Priority Restoration and Mitigation Actions for the Comal and San Marcos Springs Ecosystems, September xv

16 Chapter 1 Introduction 1.1 Background Endangered Species Compliance Through a deliberative process, stakeholders in the Edwards Aquifer Recovery Implementation Program (EARIP) have recommended that the Edwards Aquifer Authority (EAA), the City of San Antonio, acting by and through its San Antonio Water System, (hereinafter SAWS), City of San Marcos, City of New Braunfels, and Texas State University (collectively hereinafter Applicants) apply for an Incidental Take Permit (ITP or Permit) under Section 10(a)(1)(B) of the Endangered Species Act (ESA). This Habitat Conservation Plan (HCP) is intended to support the issuance of an ITP which would allow the incidental take of threatened or endangered species resulting from the otherwise lawful activities involving regulating and pumping of groundwater from the Edwards Aquifer (Aquifer) within the boundaries of the EAA for beneficial use for irrigation, industrial, municipal and domestic and livestock uses, and the use of the Comal and San Marcos spring and river systems for recreational and other activities. The minimization and mitigation measures included in Chapter 5 of this HCP are designed to ensure that incidental take resulting from the Covered Activities will be minimized and mitigated to the maximum extent practicable and will not appreciably reduce the likelihood of the survival and recovery of covered species associated with the Aquifer and Comal and San Marcos springs and rivers ecosystems. The approach taken in this HCP incorporates a two-phased implementation strategy. Phase I of the strategy will involve implementation of a package of minimization and mitigation measures that will be implemented very quickly upon issuance of the permit. These measures (described in Chapter 5) provide protection for the species covered by the ITP and their associated ecosystems. An Adaptive Management Process (AMP) (described in Chapter 6) will use information from monitoring data collected during Phase I, along with evaluation of technical and engineering alternatives and improved groundwater, biological and ecological models, to make appropriate modifications, if any are needed, to the Phase I program. Specified additional measures, if necessary to achieve the biological goals, will be implemented during Phase II Description and Purpose of EARIP The EARIP is a collaborative, consensus-based stakeholder process in south-central Texas. This diverse group of stakeholders developed this plan to protect the federally-listed species potentially affected by the management and use of the Aquifer and certain other activities in the Comal and San Marcos ecosystems. In addition to meeting the legal requirements of Section 10(a) of the ESA, the Applicants have committed to benefit the Covered Species by contributing to their recovery. 1-1
, the City of San Antonio, acting by and through its San Antonio Water System, (hereinafter SAWS), City of San Marcos, City of New Braunfels, and Texas State University (collectively")
17 The Aquifer is a unique groundwater resource, extending 180 miles from Brackettville in Kinney County, Texas, to Kyle in Hays County, Texas. (Figure 1-1). It is the primary source of drinking water for over two million people in south-central Texas and serves the domestic, livestock, irrigation, industrial, municipal, and recreational needs of the area. The Aquifer is the source of the two largest springs remaining in Texas -- the San Marcos and the Comal springs. These springs are the headwaters of the San Marcos and Comal rivers, which are tributaries to the Guadalupe River. Eight species that depend directly on water in or discharged from the Aquifer are federally-listed as threatened or endangered. These species include fountain darter (Etheostoma fonticola), San Marcos salamander (Eurycea nana), San Marcos gambusia (Gambusia georgei), Texas blind salamander (Eurycea [formerly Typhlomolge] rathbuni), Peck's cave amphipod (Stygobromus pecki), Comal Springs dryopid beetle (Stygoparnus comalensis), Comal Springs riffle beetle (Heterelmis comalensis), and Texas wild rice (Zizania texana). The primary threat to these Aquifer-dependent species is the intermittent loss of habitat from reduced springflows. Springflow loss is the combined result of naturally fluctuating rainfall patterns, natural discharges at other springs, and regional pumping and drawdown of the Aquifer. In 1991, the Sierra Club filed a lawsuit under the ESA that resulted ultimately in the creation of the EAA. The Texas Legislature directed the EAA to regulate, among other things, pumping from the Aquifer, to implement critical period management restrictions, and to pursue a program to ensure that the continuous minimum springflows of the Comal Springs and the San Marcos Springs are maintained to protect endangered and threatened species to the extent required by federal law.... (EAA Act 1.14(h)). A workable plan for the protection for the federally-listed species has been adopted among the region s stakeholders as set out in this HCP. In the fall of 2006, the United States Fish and Wildlife Service (USFWS) brought together stakeholders from throughout the region to participate in a collaborative process to develop a plan to contribute to the recovery of federally listed species dependent on the Aquifer. This process is referred to as the EARIP. In May 2007, the Texas Legislature codified the EARIP in state law and directed the EAA and certain other state agencies, local units of government, and other stakeholders to participate in the EARIP and to prepare a USFWS-approved plan by 2012 for managing the Aquifer to preserve the federally-listed species. The Legislature directed that the plan must include, among other things, recommendations regarding withdrawal adjustments during critical periods that ensure that federally-listed species associated with the Aquifer will be protected Legislative Requirements In 1993, the Texas Legislature passed the Edwards Aquifer Authority Act (EAA Act) 1 which, among other things, created the EAA. Although the EAA Act was passed in 1993, litigation delayed agency start-up for three years, until The general intent of the EAA Act was to 1 Act of May 30, 1993, 73 rd Leg., R.S., ch 626, 1993, Tex. Gen. Laws 2350, as amended. 1-2

18 create a new regional entity to manage, conserve, preserve, and protect the aquifer and to increase the recharge of, and prevent the waste or pollution of water in, the [Edwards] aquifer. (EAA Act 1.08(a)). The following are among the major functions of the EAA as established by the EAA Act: Manage and control withdrawals of water from the Aquifer through the issuance of permits and the registration of wells. Protect the water quality of the Aquifer. Protect the water quality of the surface streams to which the Aquifer provides springflow. Achieve water conservation. Maximize the beneficial use of water available for withdrawal from the Aquifer. Protect aquatic and wildlife habitat. Protect species that are designated as threatened or endangered under applicable federal or state law. Provide for in-stream uses, bays, and estuaries. Protect water supplies. Protect the operation of existing industries. Protect the economic development of the state. Prevent the waste or pollution of water in the Aquifer. Increase recharge of water to the Aquifer. Enforce compliance with the EAA Act. 1-3


19 Figure 1-1. Edwards Aquifer 1-4

20 In addition to the above functions, the EAA Act gives the EAA the authority to conduct research on topics relevant to regional water resources management. This authority includes the ability to conduct or contract for research on topics including water quality, water resources management, the augmentation of springflow, and the development of additional water supplies. The EAA began developing regulations in 1996 to implement the EAA Act. The EAA's powers apply only to the use and management of the Aquifer within the EAA's boundaries. Except for water quality, as described below, the EAA has no regulatory powers over portions of the Aquifer outside of its boundaries, or over other groundwater within its boundaries. Moreover, the EAA has no authority over surface water resources. The EAA's water quantity jurisdiction is limited to the Aquifer within its boundaries, including all of Bexar, Medina, and Uvalde counties, and parts of Atascosa, Comal, Caldwell, Hays, and Guadalupe counties. This is the Plan (or Permit) Area proposed for coverage by the incidental take provisions of the HCP. Additionally, the EAA has extraterritorial water quality jurisdiction within a buffer zone extending five miles from its boundaries. Although the EAA's regulatory authority is limited to its jurisdictional boundaries and the five-mile buffer zone, the use and management of the Aquifer affects a much larger area. In addition to being the primary water source for over two million users within the EAA's boundaries, discharges from the Aquifer are also believed to supply a significant portion of the flow in the Guadalupe River Basin downstream of Comal and San Marcos Springs, particularly in drought conditions. In 2007, the Texas Legislature passed of Senate Bill 3 (SB 3) 2 amending the EAA Act to, among other things, provide that... for the period beginning January 1, 2008, the amount of permitted withdrawals from the aquifer may not exceed or be less than 572,000 acre-feet (ac-ft) of water per calendar year... subject to adoption and enforcement of a Critical Period Management (CPM) plan with withdrawal reduction percentages in the amounts indicated in Tables 1 and 2 of Section 1.26(b) of the EAA Act. Withdrawals are managed according to the index well levels or the Comal or San Marcos Springs flow, as applicable, for a total withdrawal reduction in Critical Period Stage IV of 40 percent of the permitted withdrawals under Table 1-1 for the San Antonio Pool and 35 percent under Table 1-2 for the Uvalde Pool. TABLE 1-1 CRITICAL PERIOD WITHDRAWAL REDUCTION STAGES FOR THE SAN ANTONIO POOL Critical Period Comal Springs San Marcos Springs Index Well J-17 Withdrawal Reduction Stage Flow (cfs) Flow (cfs) Level (MSL) - San Antonio Pool I <225 <96 <660 20% II <200 <80 <650 30% III <150 N/A <640 35% IV <100 N/A <630 40% cfs = cubic feet per second; MSL = mean sea level 2 Senate Bill 3 (Act of May 28, 2007.), 80 th Leg. R. S. ch 1430, , 2007 Tex. Gen. Laws 5848,

21 TABLE 1-2 CRITICAL PERIOD WITHDRAWAL REDUCTION STAGES FOR THE UVALDE POOL Critical Period Stage Index Well J-27 Level (MSL) Withdrawal Reduction Uvalde Pool I N/A N/A II <850 5% III <845 20% IV <842 35% MSL = mean sea level; NA== not applicable The legislation also stipulated that [b]eginning September 1, 2007, the authority [EAA] may not require the volume of permitted withdrawals to be less than an annualized rate of 340,000 acrefeet, under critical period Stage IV. (EAA Act 1.26A(d)). Further, [a]fter January 1, 2013, the [EAA] may not require the volume of permitted withdrawals to be less than an annualized rate of 320,000 acre-feet, under critical period Stage IV unless, after review... the [EAA] determines that a different volume of withdrawals is consistent with... maintaining protection for federally listed threatened and endangered species associated with the aquifer to the extent required by federal law. (Id. at (e)). As another requirement of the Senate Bill 3 legislation, the EAA must cooperatively develop a Recovery Implementation Program (RIP) through a facilitated, consensus-based process that involves input from the USFWS, other appropriate federal agencies, and all interested stakeholders, including those listed under Section 1.26A(e)(1) of the EAA Act. SB 3 further directed the EAA and other state agencies to participate in the EARIP and to jointly prepare, along with other stakeholders, a program document that may be in the form of a habitat conservation plan used in the issuance of an incidental take permit. (EAA Act 1.26A(d)). The EARIP stakeholders agreed that the program document would be an HCP in support of an ITP. SB 3 requires that this program document: (1) Provide recommendations for withdrawal adjustments based on a combination of spring discharge rates of the San Marcos and Comal springs and levels at the J-17 and J-27 index wells during critical periods to ensure that federally listed, threatened, and endangered species associated with the Aquifer will be protected at all times, including throughout a repeat of the drought of record; (2) Include provisions to pursue cooperative and grant funding to the extent available from all state, federal, and other sources for eligible programs included in the cooperative agreement under SB 3, including funding for a program director; and (3) Be approved and executed by the EAA, the Texas Commission on Environmental Quality (TCEQ), the Texas Parks and Wildlife Department (TPWD), the Texas Department of Agriculture, the Texas Water Development Board (TWDB), and the USFWS not later than September 1,
22 (Id. at 1.26A(d)(1)-(3)). The HCP must take effect December 31, (Id. at 1.26A.(d)(3)) 1.2 Permit Area The Plan Area (also the Permit Area) is the area in which pumping from the Aquifer is regulated by the EAA and affects the springs and spring ecosystems used by the proposed Covered Species identified in Section 1.4 of this HCP (Figure 1-2). This is where the Covered Activities identified in Chapter 2 will occur as well as the adaptive management and minimization and mitigation measures. The Permit Area also includes recreational and other areas in which nonpumping-related impacts to Covered Species will occur including the Comal Springs and River ecosystems and San Marcos Springs and River ecosystems that are under the jurisdiction of the City of New Braunfels, the City of San Marcos, and Texas State University. 1.3 Permit Holders and Permit Duration Permit Holders The EAA, SAWS, City of San Marcos, Texas, City of New Braunfels, Texas, and Texas State University will be joint holders of the ITP Permit Duration The Applicants are requesting an ITP term of 15 years to be divided into two phases. Phase I will begin with the issuance of the ITP and include the implementation of: (1) all habitat 1-7
23 1-8
24 minimization and mitigation measures; (2) the Phase I springflow protection measures; and (3) the AMP to monitor the effectiveness of the measures and guide future management decisions. The Phase I package will be implemented throughout the permit term unless modified by the AMP. In Phase II, no later than Year 8 of the ITP, the specified additional measures (see Section 5.5.2) needed to achieve the springflows to meet the biological goals of the HCP will be implemented if required. 1.4 Species Proposed for Coverage under the Permit Eleven species are proposed for coverage under the permit. Seven are federally listed as endangered, and one is federally listed as threatened, and three are petitioned for listing as threatened or endangered. (See Table 1-3). Despite efforts to locate San Marcos gambusia (Gambusia georgei) [intensive collection efforts were conducted in 1990 with no San Marcos gambusia being collected (USFWS 1996a)], the last known sighting from the San Marcos River occurred in 1983, and the species is now thought to be extinct. (McKinney and Sharp 1995). Nonetheless, actions benefitting the other proposed Covered Species would provide benefits to this species were it to be rediscovered within the spring system, and it is, therefore, proposed for coverage. In addition to these 11 species, the EARIP and associated work groups examined the possibility of seeking coverage for one other listed species (whooping crane [Grus americana]) and a number of other petitioned Aquifer and freshwater mussel species that had received positive 90- day findings (USFWS 2009). A work group on Covered Species used the following criteria to determine whether covering additional unlisted species was warranted: the likelihood of listing during the permit term; effect of the Covered Activities on the species; status of knowledge about these species (in relation to meeting permit issuance criteria regarding demonstrating the link between the Covered Activities and take); and potential problems with implementation. This work group began with a potential list of 34 rare species. (Zara 2010; Covered Species Work Group 2010). This list was narrowed to nine species on the basis that they have been petitioned for listing and USFWS s determination that listing may be warranted, thus indicating a greater likelihood of listing during the permit term. These nine species include three that are proposed for coverage (Table 1-3), and six others including a snail (Phreatodrobia imitate), three salamanders (Eurycea robusta, Eurycea tridentifera, Eurycea neotenes), and two catfish (Trogloglanis pattersoni, Satan eurystomus). Using the aforementioned criteria, the work group concluded that seeking coverage for these Aquifer species was not warranted. In particular, the proposed action most dramatically affects spring dwelling species, those that occur at the top of the Aquifer where spring levels fluctuate. The snail, one of the salamanders (Euryce arobusta), and the two catfish occur in the deeper portions of the Aquifer. The other two cave and spring salamanders (Eurycea tridentifera, Eurycea neotenes) do not overlap geographically with the Covered Activities, since they do not occur at Comal or San Marcos springs. (But see Section 3.6.3). 1-9
25 TABLE 1-3 SPECIES PROPOSED FOR COVERAGE IN THE HCP Common Name Scientific Name ESA Status Fountain Darter Etheostoma fonticola Endangered Comal Springs Riffle Beetle Heterelmis comalensis Endangered San Marcos Gambusia Gambusia georgei Endangered Comal Springs Dryopid Beetle Stygoparnus comalensis Endangered Peck s Cave Amphipod Stygobromus pecki Endangered Texas Wild Rice Zizania texana Endangered Texas Blind Salamander Eurycea Endangered [formerly Typhlomolge] rathbuni San Marcos Salamander Eurycea nana Threatened Edwards Aquifer Diving Beetle Haideoporus texanus Petitioned Comal Springs Salamander Eurycea sp. Petitioned Texas Troglobitic Water Slater Lirceolus smithii Petitioned The work group considered six mussel species: Texas fatmucket (Lamspilis bracteata), golden orb (Quadrula aurea), Texas pimpleback (Quadrula petrina), false spike mussel (Quincuncina mitchelli), Salina mucket (Disconaias salinasensis), and Mexican fanwnsfoot (Truncilla cognata). The first four overlap most with the area of influence of the Covered Activities. Based on the criteria listed above, the work group concluded that seeking coverage for these six mussel species was not warranted. While the likelihood of listing during the permit term maybe high, the extent to which limitations to or modifications of Covered Activities will benefit the species is unclear as they do not occur in the headwaters of the two major springs and intervening activities that affect those species are not under the control of the Applicants. In addition the habitat, life cycle, and other biological parameters (e.g., tolerance of varying flow regimes) for these species are not sufficiently understood to determine whether the HCP will meet the issuance criteria with respect to the species. The whooping crane was considered for coverage in the HCP, but was not included. (See EARIP Technical Memorandum, Collection of Pertinent Data Regarding Whooping Cranes and Instream Flows, (March 2010)). 3 Factors affecting the crane and its habitat are not under the control of the Applicants for the ITP or affected adversely by their Covered Activities. In addition, the minimization and mitigation measures developed for the activities covered by the proposed permit should provide greater stability in the flows emerging from the spring systems at Comal and San Marcos Springs and, therefore, are expected to provide a potential net benefit to the habitat conditions for the ecosystem used by the crane. The springflow protection measures in the HCP increase the water available in the San Marcos and Comal rivers. For example, simulations by HDR Engineers show that, compared to current baseline conditions, the springflow in the worst year of a repeat of the drought of record, results in an additional 19,819 ac-ft of water in the San Marcos Springs and an additional 36,102 ac-ft 3 ; see also (April 8, 2010)(Comments on Technical Memorandum). 1-10
26 in Comal Springs. (HDR 2011). Using the Guadalupe-San Antonio River Basin Water Availability Model (GSA), HDR Engineers determined that the amount of fresh water inflow in the Guadalupe Estuary increases by 13,222 ac-ft in the worst year of a repeat of the drought of record. (Id.). EAA lacks jurisdiction over surface water flow. Thus, it lacks the authority to ensure that any additional springflow provided from the Edwards Aquifer will be available in the bays and estuaries. 1.5 Regulatory Framework Texas Water Law In Texas, the administration of water rights is dependent on the type of water in question surface water or groundwater. Surface water is governed by the prior appropriation doctrine which holds that the State of Texas owns all water in streams and rivers, and grants permission to use the water on a seniority basis through an administrative process. Under Texas common law, groundwater is governed by the rule of capture. Under this doctrine, an owner of land may drill a well to seek groundwater, withdraw any groundwater that may be encountered, and place the water to beneficial use without significant limitation as to amount, place, or purpose. Moreover, this common law privilege may generally be exercised without regard for any negative impacts to adjacent landowners or springflows. While generally the rule of capture remains in effect, groundwater conservation districts may, through rulemaking, limit or regulate the operation of the rule of capture within their respective boundaries under the specific authority provided by their enabling legislation or by Chapter 36, Texas Water Code. The first groundwater district was established in 1951, and as of 2011, 97 groundwater districts have been established (96 confirmed, 1 unconfirmed; TWDB 2011). Under the EAA Act, the common law has essentially been supplanted and groundwater within the Aquifer is regulated by statute rather than the rule of capture Edwards Aquifer Authority Administration of Groundwater Rights in the Edwards Aquifer The EAA Act requires the EAA to, among other things, regulate and manage withdrawals from the Aquifer. The EAA manages withdrawals primarily through its Groundwater Withdrawal Permit Program. The basic elements of this program include: (1) a fact-finding process to identify persons who qualified for a water right in the Aquifer; (2) the issuance and administration of groundwater withdrawal permits; (3) capping the aggregate amount of permits that may be issued; (4) allowing permits to be marketed; and (5) reducing withdrawals when necessary for the benefit of threatened and endangered species protected under the Endangered Species Act. 1-11
27 Rules of the Edwards Aquifer Authority As authorized by the EAA Act, the EAA has promulgated rules that, among other things, require permits for withdrawing water from the [A]quifer, set standards for the construction and maintenance of wells, [and] restrict certain activities on the recharge zone to protect the [A]quifer from pollution, and others Federal Endangered Species Act Section 9 Section 9 of the ESA prohibits the take of threatened and endangered species, including the attempt or action to harass, harm, pursue, hunt, shoot, wound, kill, trap, capture, or collect such species. (16 U.S.C. 1532). The term harm is defined to include any act which actually kills or injures wildlife. Such act may include significant habitat modification or degradation where it actually kills or injures wildlife by significantly impairing essential behavioral patterns, including breeding, feeding or sheltering. (50 C.F.R. 17.3). The term harass is defined as an intentional or negligent act or omission which creates the likelihood of injury to wildlife by annoying it to such an extent as to significantly disrupt normal behavioral patterns which include, but are not limited to, breeding, feeding, or sheltering. (50 C.F.R. 17.3). The ESA does not prohibit "take" of listed plants (e.g., Texas wild-rice) on private lands, but landowners must comply with state laws protecting imperiled plants. [W]ith respect to endangered species of plants, it is unlawful to: import or export; remove the species from areas under federal jurisdiction or maliciously damage or destroy it in those areas; remove, cut, dig up, damage or destroy the species in any other area in violation of state law or in the course of criminal trespass; deliver, receive, carry, transport, ship, sell or offer for sale in interstate or foreign commerce; violate any regulation pertaining to a threatened or endangered plant species. (16 U.S.C. 1538(a)(2)(A) through (E)). The requirement for compliance with state laws would apply to the State Scientific Areas established for Texas wild-rice as discussed in Section 5.6. Furthermore, the USFWS will analyze impacts in its Biological Opinion on the issuance of the ITP to ensure the Covered Activities do not jeopardize the continued existence of Texas wild-rice Section 10 Section 10(a)(1)(B) authorizes the issuance of permits for non-federal activities for take that may occur incidentally to otherwise lawful measures with the provision of an HCP. The term incidental take is defined as take that is incidental to, and not the purpose of, the carrying out of an otherwise lawful activity. (16 U.S.C. 1539(a)(1)(B); 50 C.F.R )
28 An HCP submitted in support of a Section 10 permit application must specify: The impact that will likely result from the taking; Steps the applicant will take to monitor, minimize, and mitigate such impacts; the funding available to implement such steps; and the procedures to be used to deal with unforeseen circumstances; Alternative actions to such taking considered by the applicant and the reasons why such alternatives are not proposed to be used; and Other measures that may be required as necessary or appropriate for the purposes of the plan. (16 U.S.C. 1539(a)(2)(A)(i)-(iv); 50 C.F.R (b)(iii)). To issue an incidental take permit, USFWS must find that: The taking will be incidental; The applicant will, to the maximum extent practicable, minimize and mitigate the impacts of such taking; The applicant will ensure that adequate funding for the conservation plan and procedures to deal with unforeseen circumstances will be provided; The taking will not appreciably reduce the likelihood of survival and recovery of the species in the wild; and The applicant will ensure that other measures as may be required by USFWS as necessary or appropriate for the purposes of the HCP will be implemented. (16 U.S.C. 10(a)(2)(B); 50 C.F.R (b)(2) and 17.32(b)(2)). The USFWS believes that the biological goals and objectives should be consistent with recovery but in a manner that is commensurate with the scope of the HCP. Under section 10 of the ESA, the USFWS does not explicitly require an HCP to recover listed species or contribute to the recovery objectives outlined in a recovery plan, however, USFWS discourages HCPs that might preclude a significant recovery option. (USFWS 1996(c) at 3-20; 65 FR 35,243, (June 1, 2000)). This approach reflects the intent of the section 10(a)(1)(B) incidental take permit process to provide for authorization of incidental take, not to mandate recovery. (Id.). The HCP Handbook Addendum (USFWS and National Marine Fisheries Service [NMFS] 2000), referred to as the "5-point policy, provides additional guidance and recommendations for the development of HCPs. The five points are as follows: 1. Defined conservation goals and objectives; 2. An adaptive management strategy; 3. Compliance and effectiveness monitoring; 1-13
29 4. An established permit duration; and 5. Opportunities for public participation. (65 FR at 35,250-56) Section 7 Issuance of an ITP is a federal action subject to Section 7 of the ESA. Section 7(a)(2) requires all federal agencies, in consultation with the USFWS, to ensure that any action authorized, funded, or carried out by an agency is not likely to jeopardize the continued existence of any endangered or threatened species or result in the destruction or adverse modification of designated critical habitat. The ESA describes Critical Habitat as those areas which contain the physical or biological features (1) essential to the conservation of the species and (2) which may require special management considerations or protection. (16 U.S.C. 1532(5)(A)(i)). USFWS regulations identify the constituent elements of critical habitat to include those that are essential to the conservation of the species, such as roost sites, nesting grounds, spawning sites, feeding sites, seasonal wetland or dryland, water quality or quantity, host species or plant pollinator, geological formation, vegetation type, tide, and specific soil types. (50 C.F.R ). Although the HCP does not cover actions with a federal nexus, Section 7 and its regulations require several considerations in the HCP process, including an analysis of indirect effects, effects on federally-listed plants, and effects on Critical Habitat. The results of the Section 7 consultation are documented in Biological Opinions developed by the USFWS. A Biological Opinion is generally produced near the end of the ESA permitting process to document conclusions regarding the likelihood of jeopardizing the continued existence of, or destroying or adversely modifying designated Critical Habitat for, any listed species Texas Parks and Wildlife Code Chapter 88 Texas wild-rice is listed as an endangered plant by the Texas Parks and Wildlife Department (TPWD). (TPW Code ) No person may take for commercial sale, possess for commercial sale, or sell all or part of an endangered plant from public land; these actions are also prohibited on private land unless authorized by a permit issued by TPWD. (TPW Code ) Endangered plants may be taken from public lands by qualified persons for propagation, education, or scientific study under a collection permit issued by TPWD. (Id.; Texas Administrative Code, Chapter 31, 69.1; see also TPW Code (defining take to mean to collect, pick, cut, dig up, or remove. )) Chapter
30 Texas Parks and Wildlife Department has the authority to establish state scientific areas for the purposes of education, scientific research, and preservation of flora and fauna of scientific or educational value. (TPW Code ). TPWD may make rules and regulations necessary for the management and protection of scientific areas. (TPW Code ). On March 29, 2012, the TPWD adopted a rule creating the San Marcos River State Scientific Area. (31 TAC ). (See Section 5.6.1) National Environmental Policy Act The National Environmental Policy Act (NEPA), 42 U.S.C et seq., is one of the primary laws governing the environmental protection process. It is a decision-making requirement that applies to proposals for major federal actions. The Council on Environmental Quality regulations define major federal action as an action with effects that may be major and which are potentially subject to federal control and responsibility including projects and programs entirely or partly financed, assisted, conducted, regulated, or approved by federal agencies. (40 C.F.R ). NEPA requires any federal agency undertaking a major federal action likely to significantly affect the human environment to prepare an Environmental Impact Statement (EIS). An EIS must provide a detailed statement of the environmental impacts of the action, possible alternatives, and measures to mitigate adverse effects of the proposed actions. (42 U.S.C. 4332(C)). While NEPA does not mandate any particular result, it requires the federal agency to follow particular procedures in its decision-making process. The purpose of these procedures is to ensure that the agency has the best possible information to make an intelligent, optimally beneficial decision and to ensure that the public is fully apprised of any environmental risks that may be associated with the preferred action. Issuance of an ITP under Section 10(a)(1)(B) is a federal action subject to NEPA compliance. Although ESA and NEPA requirements overlap considerably, the scope of NEPA goes beyond that of the ESA by considering the impacts of a federal action not only on fish and wildlife resources, but also on other resources such as water quality, socioeconomics, air quality, and cultural resources. The EIS process culminates in issuance of a Record of Decision (ROD). (40 C.F.R ). The ROD documents the alternative selected for implementation as well as any conditions that may be required and summarizes the impacts expected to result from the action. 1.6 Alternatives Considered during the Development of the HCP Under the ESA Section 10(a)(2)(A)(iii), the HCP must specify the alternative actions to such [incidental] taking the applicant considered and the reasons why such alternatives are not being utilized. (16 U.S.C. 1539(a)(2)(A); 50 C.F.R (b)(1) and 17.32(b)(1)). USFWS explained that two alternatives commonly included were: (1) any specific alternative that would reduce such take below take levels anticipated for the project proposal; and (2) a no action alternative, which means that no permit would be issued and take would be avoided or that the project would not be constructed or implemented. (USFWS 1996(c)). 1-15
31 The Applicants considered one alternative to the anticipated take that would either reduce the amount of take or avoid take. That alternative involved a critical period program that would sustain an overall trend of maintaining or increasing the population of the aquatic communities of the Comal and San Marcos springs, in particular the Covered Species. (EARIP 2009). To achieve this objective, the SSC determined that a single stage CPM reduction to approximately 85,000 ac-ft/yr would be necessary. That reduction would ensure: (1) a minimum monthly springflow of 30 cfs at Comal Springs and 60 cfs at San Marcos Springs; (2) minimum 6-month average flow of 75 cfs at Comal and San Marcos springs; and (3) long-term average flow of 225 cfs at Comal Springs and 140 cfs at San Marcos Springs. The trigger for that reduction would be 665 ft-msl at J-17 for the San Antonio Pool and 865 ft_msl for the Uvalde Pool. This alternative was not pursued for a variety of reasons. Because the required triggers are very close to the historical average for the two index wells, permitted pumping would have to be reduced from 572,000 ac-ft to approximately 86,000 ac-ft for significant amounts of time. Moreover, allowable withdrawal levels would have been well below the amount of water needed to meet public health and safety and fire protection needs. Although not formally evaluated, the cost to the region for the necessary replacement water, if in fact it could be obtained at all let alone in the time frame of the HCP, would be in the billions of dollars. Politically, it was generally viewed as impossible to obtain regional consensus on such an approach. For these reasons, this alternative was not pursued. A no action alternative does exist, although it was not pursued for reasons discussed below. If the Applicants did not proceed with the application for a Section 10(a)(1)(B) permit, then springflows at Comal Springs would have the potential to cease for 38 months during a repeat of the drought of record,(see Section 5.8 below), and be subject to possible litigation. However, EAA s enabling legislation requires it to implement and enforce water management practices, procedures, and methods to ensure that, not later than December 31, 2012, the continuous minimum springflows of the Comal Springs and the San Marcos Springs are maintained to protect endangered and threatened species to the extent required by federal law. (EAA Act 1.14(h)). That deadline has not arrived, and the EAA has not made a specific determination about the level of continuous springflow to be achieved, or whether it would seek to implement measures to avoid all take as required by Section 9 of the ESA or to obtain an incidental take permit under Section 10(a)(1)(B) of the ESA. Thus, it is not possible to say with any degree of certainty whether or not the level of take would be less than under the current HCP. This alternative was not pursued because it was believed that a regional, consensus-based approach was preferable. Further, EAA is an Applicant for this HCP, and EAA intends that this HCP satisfy the continuous minimum springflow requirement in Section 1.14(h). The Applicants considered other alternatives in developing the various minimization and mitigation measures designed to offset the impacts of the flow-related impacts of incidental take. The Phase I package of minimization and mitigation measures, consisted of identifying and conducting technical analyses for six basic alternative programs, each with one or more options. These alternative programs or packages included: 1-16
32 Creation of an Aquifer Storage and Recovery (ASR) facility, relying on unrestricted irrigation permits and water the EAA is allowed to pump pursuant to Section 1.14(h) of the EAA Act to fill and maintain the ASR. This concept protected springflow by providing water stored in the ASR for recharge during drought conditions. This resulted in increased volumes of Aquifer water flowing to the springs at Comal and San Marcos thereby supporting the Covered Species. A combination package incorporating selected Type II recharge structures to enhance recharge, a voluntary irrigation pumping reduction program to reduce agricultural pumping during drought, land stewardship activities including watershed management for enhanced surface flows, and the use of the SAWS Twin Oaks ASR facility in southern Bexar County. A Recharge and Recirculation program that places water from available EAA permits into recharge structures; recovers the previous year s recharge and recirculates it to the recharge structures; and allows the water to remain in the Aquifer until specified springflow triggers occur. A Trade-Off package in Bexar County using available EAA permits and EAA Act 1.14(h) water to fill and maintain an ASR developed by the EARIP; Stage IV pumping floor at 340,000 ac-ft/yr; recovery during drought of stored water for delivery to major distribution centers in Bexar County; with targeted storage and recovery maintaining springflow at both springs. Trade-Offs in Comal and Hays Counties, using non-edwards sources identified in the initial 2011 Region L Water Plan, permanent retirement of Edwards Permits, Stage IV pumping floor at 340,000 ac-ft/yr, and new distribution centers connecting source water with New Braunfels and San Marcos. These measures, as analyzed by HDR Engineering, Inc., generally did not result in flow levels greater than those achievable through the measures in the HCP at the scale examined. The preliminary cost estimates associated with these measures were considered impractical, ranging into the hundreds of millions of dollars, and had potential regulatory, technical, or political impediments to their implementation. An evaluation of these alternatives can be found in HDR 2011 and are summarized in Figure 1-3 below. 1-17
33 Figure 1-3: Summary of Alternative Minimization and Mtigation Measures Considered (HDR 2011) Other potential measures, such as water storage in abandoned quarries, were also explored and not evaluated further when the initial investigation revealed that these options could not provide adequate storage capacity for projected water needs. (Id.). 1.7 Public Involvement USFWS 5-Point Policy strongly encourages applicants for an ITP to provide extensive opportunities for public involvement during the planning and implementation process. 65 FR at 35,256. Under that policy USFWS encourages the use of scientific advisory committees and the use of peer review in the development of the HCP. (Id.) The following Section describes the public involvement in the development of this HCP. 1-18
34 1.7.1 Advisory Groups EARIP Steering Committee As stated previously, the EARIP is a collaborative, consensus-based stakeholder process. Thirty-nine individuals, entities and groups executed a Memorandum of Agreement with USFWS regarding participation in the EARIP. (See Appendix A). EARIP meetings were held on at least a monthly basis with between fifty and eighty people attending each meeting. SB 3, the legislation that amended created the EARIP called for the creation of a Steering Committee to oversee and assist in the development of the EARIP. The EAA Act specifies that the following entities be represented on the initial Steering Committee: Edwards Aquifer Authority Texas Commission on Environmental Quality Texas Parks and Wildlife Department Texas Department of Agriculture Texas Water Development Board San Antonio Water System Guadalupe-Blanco River Authority San Antonio River Authority South Central Texas Water Advisory Committee Bexar County CPS Energy Bexar Metropolitan Water District Nine other people representing retail, industrial, municipal, public utility, and agricultural permit holders by region, as well as environmental and recreational interests. Subsequently, the initial Steering Committee added five additional entities to the Steering Committee to ensure representation of all interests. The Steering Committee hired a program director, established a regular meeting schedule, and published that schedule to encourage public participation. Meetings of the Steering Committee were open to the public and all attendees were encouraged to actively participate. All decisions by the Steering Committee were made by consensus. The Steering Committee in its operating rules defined consensus as the absence of opposition to a decision. Although a mechanism 1-19
35 provides for consensus decision-making by a super majority of 75 percent of the Steering Committee members when opposition occurs, in practice, decisions generally were made without opposition and without the need for a vote by Steering Committee members. Collaborative Processes, facilitation consultants, facilitated the stakeholders in developing the elements of Phase I package. Stakeholder workshops were used to discuss complex scientific issues and other issues related to the ESA and the elements of the HCP Science Subcommittee SB 3 also specifies that the Steering Committee appoint an expert science subcommittee composed of neither fewer than seven nor more than fifteen, but always an odd number of, members. Members had to have technical expertise regarding the Aquifer system, the threatened and endangered species that inhabit the system, springflows, or the development of withdrawal limitations. Initially, the Texas Legislature charged the Science Subcommittee (SSC) with preparing initial recommendations by December 31, 2008 regarding: The option of designating a separate San Marcos Pool, evaluating how such a designation would affect existing pools, and determining the need for an additional well to measure the San Marcos Pool, if designated; The necessity to maintain minimum springflows, including a specific review of the necessity to maintain a flow to protect federally threatened and endangered species; and Whether adjustments in the trigger levels for the San Marcos Springs flow for the San Antonio Pool should be made. These recommendations were completed and submitted to the EARIP on November 13, The recommendations are included in a report entitled Evaluation of Designating a San Marcos Pool, Maintaining Minimum Spring Flows at Comal and San Marcos Springs, and Adjusting the Critical Period Management Triggers for the San Marcos Springs. (EARIP 2008). The SCC concluded that it could not recommend segmenting the San Antonio Pool until the relationships among rainfall, recharge, down gradient water levels and springflow became more predictable. The SSC also found that minimum springflows are required within the context of a system flow regime for the federally-listed species at Comal and San Marcos springs. Finally, the SSC found that the trigger levels for the San Marcos Springs should not be adjusted at this time. The full report is included in Appendix B. This report was peer-reviewed by an independent panel of scientists assembled by the Sustainable Ecosystems Institute. The report of the peer review team is attached as Appendix C. The Texas Legislature also required the SSC to analyze species requirements in relation to spring discharge rates and aquifer levels as a function of recharge and withdrawal levels. Based on that analysis, the SSC was to develop recommendations for withdrawal reduction levels and stages for critical period management. This charge included establishing, if appropriate, separate withdrawal reduction levels and stages for critical period management for different 1-20
36 pools of the aquifer as needed to maintain target spring discharge and Aquifer levels. The SSC submitted its final report in December (EARIP 2009). Based on its analyses, the SSC determined the following spring discharge rates incorporated into a flow regime would sustain an overall trend of maintaining or increasing the population of the aquatic communities of the Comal and San Marcos springs, in particular the Covered Species, i.e., a recovery standard. Comal Springs Flow Regime Long-term average flow: 225 cfs Minimum 6-month average flow: 75 cfs Minimum 1-month average flow: 30 cfs with no flow below 5 cfs San Marcos Springs Flow Regime Long-term average flow: 140 cfs Minimum 6-month average flow: 75 cfs Minimum 1-month average flow: 60 cfs with no flow below 52 cfs The analysis expressly did not take into account the minimization and mitigation measures in the HCP. The SSC used an existing numerical groundwater flow model of the Edwards Aquifer and its associated management module to develop withdrawal reductions and stages for critical period management that met or exceeded the three flow criteria for each of the two springs. After 38 model runs, the last run showed that pumping needed to be reduced 85 percent in a single stage to meet or exceed the flow regime discharge rates. The full report is attached as Appendix D. This report was peer-reviewed by an independent panel of scientists assembled by Annear Associates, LLC. The report of the peer review team is attached as Appendix E Recharge Feasibility Subcommittee Section 1.26A(n) of the EAA Act requires the Steering Committee to establish a Recharge Facilities Feasibility Subcommittee and to charge it with addressing the following five issues: 1. Assess the need for the Authority or any other entity to own, finance, design, construct, operate, or maintain recharge facilities. 2. Formulate plans to allow the Authority or any other entity to own, finance, design, construct, operate, or maintain recharge facilities. 1-21
37 3. Make recommendations to the Steering Committee as to how to calculate the amount of additional water that is made available for use from a recharge project including during times of critical period reductions. 4. Maximize available federal funding for the Authority or any other entity to own, finance, design, construct, operate, or maintain recharge facilities. 5. Evaluate the financing of recharge facilities, including the use of management fees or special fees to be used for purchasing or operating the facilities. The subcommittee s final report is attached as Appendix F Public Outreach Subcommittee SB 3 authorized, but did not require, the EARIP Steering Committee to create other subcommittees, as necessary. The bill suggests several possible subcommittees, including a community outreach and education subcommittee. The Steering Committee created the Public Outreach Subcommittee (POS) to inform and educate the public, public officials, and the media about EARIP activities. The POS disseminates press releases, and reports its actions to the Steering Committee. The subcommittee is charged with reflecting the interest of the EARIP as a whole and not representing any single stakeholder position Ecosystem Restoration Subcommittee The Steering Committee created the Ecosystem Restoration Subcommittee with the following four charges: To report to the EARIP at its July 9, 2009 meeting regarding the identified opportunities to date for the development of options or potential implementation of the Comal River restoration work by or through cooperation with the United States Army Corps of Engineers (USACE). To assess existing conditions and restoration needs for the Comal River, including identification evaluation of restoration actions for the Comal River with an estimate of the ecological effectiveness and cost of each option. To consider opportunities for coordination with and eventual integration of the EARIP process with restoration options currently proposed for the San Marcos River. To submit its report on restoration options for the Comal and San Marcos rivers to the Steering Committee and EARIP as soon as possible but no later than March 1, Potential restoration actions were evaluated based on potential benefit to the listed species, contribution to improved water quality, limited negative impacts, estimated cost, potential to provide increased ecosystem resilience during critical periods, and other related criteria. 1-22
38 The subcommittee s final report (Appendix G) recommended a range of minimization and mitigation measures included in this HCP. Additional research items are listed in the subcommittee s final report and are intended to guide the development of future activities as part of the ongoing AMP Work Groups From time to time, the Steering Committee created work groups charged with addressing specific issues and reporting findings or recommendations to the Steering Committee. These committees are generally single-task oriented and short-term in nature, as opposed to the standing subcommittees. These work groups include the following: Additional Studies Work Group Phase I Implementation Work Group Voluntary Irrigation Suspension Program Option (VISPO) Work Group Conservation Work Group Environmental Restoration and Protection (ERPA) Work Group Funding Work Group Recreation Work Group Refugia Work Group Agricultural Water Enhancement Program Work Group Covered Species Work Group Restoration Work Group Low Impact Development (LID) Work Group Implementing Agreement Drafting Work Group SAWS ASR Work Group The MOA Work Group Facilitation Work Group Scientific Studies In addition to the reports by the Science Subcommittee discussed above, the EARIP contracted with Dr. Thomas Hardy of the River Systems Institute at Texas State University to conduct 1-23
39 modeling to evaluate flow regimes within the Comal and San Marcos Rivers necessary to provide adequate protection of Covered Species during a repeat of the drought of record. The conclusions of the Final Hardy Report (Hardy 2010) are also summarized in Section 4.4 and the full report is attached as Appendix H. This report was peer-reviewed by the Science Subcommittee and an independent panel of scientists assembled by Annear Associates, LLC. The report of the peer review team is attached as Appendix I. The EARIP also contracted with BIO-WEST to conduct a study on the development of Environmental Restoration and Protection Areas at Comal Springs. BIO-WEST s conclusions are set out in a report entitled Environmental Restoration and Protection Areas Feasibility Study: Comal Springs. (BIO-WEST 2011). This report is attached as Appendix J. To evaluate the effectiveness of the flow protection measures, the EARIP retained HDR Engineering, Inc. and Todd Engineers (collectively HDR) to simulate the springflows at Comal and San Marcos springs during the drought of record under baseline conditions and with sequential addition of each element of the flow protection elements of the Phase I action to the baseline conditions. The details of the model and the simulation results are set out in HDR, Inc. and Todd Engineers, Evaluation of Water Management Programs and Alternatives for Springflow Protection of Endangered Species at Comal and San Marcos Springs, October 2011 (HDR 2011). This report is attached as Appendix K. The EARIP contracted with Halff Associates, Inc. to prepare a study of the recreational impacts to the protected species in the Comal and San Marcos springs ecosystems. (Halff Associates, Inc. 2010). This report is attached as Appendix L. Finally, the EARIP contracted with USFWS and BIO-WEST to conduct a pilot study to determine the effectiveness of Melanoides tuberculatus removal on lowering drifting gill parasite numbers in the Comal River. USFWS San Marcos National Fish Hatchery and Technology Center and BIO-WEST, Inc., Effectiveness of Host Snail Removal in the Comal River, Texas and its Impact on Densities of the Gill Parasite Centrocestus formosanus (Tremotada: Heterophyidae), February 2011 (USFWS and BIO-WEST 2011). This report is attached as Appendix M Public Scoping Meetings The USFWS held seven public scoping meetings throughout the region during the month of April 2010 to receive public comment on the EARIP s intent to prepare an HCP and the Service s intent to prepare an EIS. These meetings were intended to provide the public with opportunities to comment, as part of the NEPA process regarding the scope of the proposed project and EIS. The seven meeting locations and times are listed below: Thursday, April 1, 2010 at Victoria Community Center, 2905 East North Street Victoria, Texas 77901, from 6 8 p.m. Monday, April 12, 2010 at New Braunfels Civic Center, 375 S. Casteel Avenue, New Braunfels, Texas 78130, from 6 8 p.m. 1-24
40 Wednesday, April 14, 2010 at AgriLife Research and Extension Center, 1619 Garner Field Rd., Uvalde, Texas 78801, from 6 8 p.m. Monday, April 19, 2010 at San Marcos Activity Center, 501 East Hopkins St., San Marcos, Texas 78666, from 6 8 p.m. Monday, April 26, 2010 at San Antonio Water System, 2800 North US Highway 281, San Antonio, Texas 78212, from 6 8 p.m. Wednesday, April 28, 2010 at Harte Research Institute, Texas A&M Corpus Christi, 6300 Ocean Drive, Corpus Christi, Texas 78412, from 6 8 p.m. Thursday, April 29, 2010 at Schreiner University, Cailloux Activity Center, 2100 Memorial Blvd., Kerrville, Texas 78028, from 6 8 p.m. Comments were recorded at the meetings and were accepted electronically through the EARIP Public Comment website and by mail to the USFWS Austin Ecological Services Field Office Collaboration with Other Jurisdictions, Regional Planning Efforts, Other Entities As potential recipients of the ITP permit, the EAA, SAWS, the City of San Marcos, the City of New Braunfels, and Texas State University will be responsible for the development, implementation, and monitoring of specific minimization and mitigation measures in this HCP. In addition, ongoing and proposed water infrastructure projects may require future collaboration not only between existing EARIP stakeholders and ITP Applicants, but also with other jurisdictions and planning entities. For example, permits will be required from the Texas Parks and Wildlife Department (TPWD) and the US Army Corps of Engineers for many of the restoration activities. An antiquities permit will also be required from the Texas Historical Commission to identify any potential cultural resources impacts from these activities. Further, ongoing and planned transportation projects that will involve direct, indirect, and cumulative impacts over the Aquifer may require collaboration with various Metropolitan Planning Organizations (MPOs), Regional Mobility Authorities (RMAs), Texas Department of Transportation, Federal Highway Administration, and various city and county governments. Coordination and collaboration may also be needed with private and public development interests concerning regional planning for development over the Contributing and Recharge zones of the Aquifer. Consultation with other Federal, state, and local agencies with mandated natural and cultural resource protection responsibilities will also be required. Consultation between the USFWS and the Texas State Historic Preservation Officer (SHPO) will be necessary under 106 of the National Historic Preservation Act regarding the impacts of the Covered Activities affecting the archeological sites in the Comal and San Marcos spring systems. It is our understanding that requirements coming out of this consultation will be passed on to the Applicants through the Incidental Take Permit. 1-25
41 This page intentionally left blank. 1-26
42 Chapter 2 Activities Covered by the Permit 2.1 Covered Activities The Applicants seek incidental take coverage for four categories of activities that may result in incidental take of the fish and wildlife Covered Species: (1) the regulation and use of the Aquifer; (2) recreational activities in the Comal and San Marcos spring and river ecosystems; (3) other activities in, and related to, the Comal and San Marcos springs and river ecosystems; and (4) activities involved in and related to the implementation of the minimization and mitigation measures in these ecosystems. The protection and regulation of the use Edwards Aquifer is the responsibility of the Edwards Aquifer Authority (EAA). The EAA also seeks coverage for the persons and entities it authorizes to use the Aquifer. The San Antonio Water System (SAWS), the City of San Marcos, and Texas State University seek incidental take coverage, as Applicants, for their pumping from the Aquifer authorized by the EAA. The cities of New Braunfels and San Marcos and Texas State University have the authority to manage the spring and river ecosystems within their respective jurisdictions including many aspects of the use of the ecosystems for recreation. They are seeking incidental take coverage for these activities. Each of the Applicants will be responsible for the implementation of minimization and mitigation measures as well as measures that contribute to the recovery of the Covered Species. In addition, Texas Parks and Wildlife Department (TPWD) has created a state scientific area to protect Texas wild-rice and habitat in the San Marcos Springs ecosystem during low flows. They will pursue an additional state scientific area in the Comal Springs ecosystem to protect fountain darter habitat. TPWD also intends to participate in the implementation of other minimization and mitigation measures in both ecosystems. Incidental take coverage is sought for all of these activities. The following is a brief description of the specific activities for which incidental take coverage is sought. Detailed descriptions of the measures that will be implemented to minimize and mitigate the impacts of the incidental take are set out in Chapter Edwards Aquifer Authority Relative to the HCP, the EAA s primary statutory obligation is to authorize and manage the withdrawal of groundwater from the Aquifer. The EAA carries out its statutory powers through rulemaking. The EAA seeks incidental take coverage for the EAA s programs that implement these statutory functions. In addition, the EAA seeks coverage for persons who are both authorized under the EAA Act and the EAA s rules to withdraw groundwater from the Aquifer within the jurisdictional 2-1
43 boundaries of the EAA and in compliance with the Act and rules. It does not seek incidental take coverage for any federal facility which withdraws groundwater from the Aquifer for the benefit of the federal facility. Finally, EAA seeks coverage for the minimization and mitigation measures that either it will implement or for which it bears responsibility for having implemented as identified in Chapter 5 of this HCP. The activities for which the EAA seeks coverage are described in more detail as follows Groundwater Withdrawal Program In General The EAA Act recognizes three categories of groundwater rights to withdraw and place to beneficial use water withdrawn from the Aquifer: (1) interim authorizations; (2) permits; and (3) exempt wells. Interim authorization rights are temporal groundwater rights that existed from the effective date of the EAA Act on June 28, 1996, for a limited period of time to provide a transitional bridge from the Texas common law to the statutory-based permit system established under the EAA Act. (See generally EAA Act 1.17). Interim authorization rights became superseded upon entry of final orders by the EAA on applications for initial regular permits, or upon the failure of a well owner to timely file by December 30, 1996, a declaration for historical use for the well. (See id 1.17(d)). The EAA does not currently recognize any interim authorization groundwater rights in the Aquifer. However, on rare occasions the EAA has had to place a well owner back on interim authorization status to address an unusual factual scenario, but does not anticipate in the future having to place a well owner back on interim authorization status. The second category of Aquifer groundwater rights is groundwater withdrawal permits. These include Initial Regular Permits (and their derivative Regular Permits), Term Permits, Emergency Permits, and Recharge Recovery Permits. (See id. 1.16, 1.19, 1.20 and EAA rules ). The final category of groundwater rights in the Aquifer are wells which are exempt from the permitting and metering requirements. (See id. 1.33). The EAA s rules that implement its groundwater withdrawal program are found at Chapter Authorized Groundwater Withdrawals Initial Regular Permits Withdrawals under Initial Regular Permits, and derivative permits due to transfers of these permits which are known as Regular Permits, are subject to the annual statutory cap on Aquifer withdrawals. In 2007, the Texas Legislature limited total withdrawals under all regular permits to 572,000 ac-ft/yr. (Section 1.14(c) of the EAA Act). Although the EAA Act provides in Section 1.18 that the EAA may also issue Additional Regular Permits, this portion of the Act cannot be implemented because no additional water is available for permitting under the 572,000 ac-ft/yr cap established by the Legislature in
44 EAA seeks incidental take coverage for its authorization of the withdrawals under the cap and for the owners or lessees of the permits making the authorized withdrawals under the permits. Term Permits The EAA Act authorizes the EAA to issue Term Permits, which authorize the withdrawal of groundwater for a defined term, up to a maximum of 10 years. (EAA Act 1.19). These permits are interruptible (i.e., the right to withdraw pursuant to these permits must be interrupted during the term of the permit based upon statutorily-specified Aquifer or springflow levels). Further, withdrawals may be made pursuant to these permits only when Aquifer levels are relatively high as measured at specified index wells - above 675 ft-msl in the San Antonio Pool of the Aquifer, and above 865 ft-msl in the Uvalde Pool or when springflow levels are relatively high (above 350 cubic feet per second [cfs] for Comal Springs and above 200 cfs for San Marcos Springs). Aquifer withdrawals made pursuant to Term Permits are not subject to or limited by the Aquifer-wide withdrawal cap that is discussed above in relation to Initial Regular Permits. The EAA last issued term permits in 1997 although the EAA no longer has any records for these permits. These term permits are believed to have expired in 1998, and the EAA currently has no Term Permits shown to be outstanding in its permit data base. Current policy of the EAA is to not issue Term Permits. This policy is reflected in Section (b) of the EAA rules providing that [u]nless the Board has issued an order authorizing applications for Term Permits to be filed with the Authority, Authority staff may not process any application received and must return the application to the applicant along with any application fee submitted. The Board has not issued such an order. In the unlikely event the EAA changes policy and again issues term permits during the term of the ITP, the EAA, seeks incidental take coverage for the authorization of the withdrawals from the Aquifer and for the owners or lessees making such withdrawals pursuant to a Term Permit. The manner in which those withdrawals will be addressed is discussed in the Changed Circumstances provisions of Section 8.1. Emergency Permits The EAA Act authorizes the EAA to issue Emergency Permits to withdraw Aquifer water for the limited needs of preventing the loss of life, or to prevent severe, imminent threats to the public health or safety. (EAA Act 1.20). Emergency Permits may be issued for a term of up to 30 days, but are renewable. A holder of an Emergency Permit may withdraw Aquifer water without regard to its effect on other permit holders. Aquifer withdrawals made pursuant to emergency permits are not subject to or limited by the Aquifer-wide withdrawal cap that is discussed above in relation to Initial Regular Permits. Since its inception, the EAA has issued only one Emergency Permit in 2004 for 150 ac-ft to help remediate a sewer line spill in Salado Creek. This permit expired in July, By their nature, the EAA does not expect to issue Emergency Permits with any level of frequency. 2-3
45 In the event the EAA may encounter an emergency condition that justifies the issuance of an emergency permit during the term of the ITP, EAA seeks incidental take coverage for its authorization of any withdrawals under an emergency permit and for the owners or lessees making the authorized withdrawals under any emergency permit. The manner in which those withdrawals will be addressed is discussed in the Changed Circumstances provisions of Section 8.1. Recharge Recovery Permits The EAA has implemented this statutory authority in its rules to authorize the recovery from the Aquifer of groundwater that is in storage due to the recharge efforts of the Authority or another political subdivision. The EAA s Aquifer Recharge, Storage, and Recovery Program rules are found at subchapter J of Chapter 711. As presently implemented, Recharge Recovery Permits may be issued pursuant to Aquifer storage and recovery projects conducted to increase the yield of the Aquifer, protect springflows, and ensure minimum springflows of the Comal and San Marcos Springs. The EAA has developed Aquifer recharge, storage and recovery rules to allow entities to conduct approved Aquifer storage and recharge activities. Aquifer withdrawals made pursuant to Recharge Recovery Permits are not subject to or limited by the Aquifer-wide withdrawal cap that is discussed above in relation to Initial Regular Permits. EAA seeks incidental take coverage for its authorization of any withdrawals under Recharge Recovery Permits and for the owners or lessees of the water making the authorized withdrawals under any Recharge Recovery Permit. The manner in which those withdrawals will be addressed is discussed in the Changed Circumstances provisions of Section 8.1. Exempt Wells Exempt wells are those wells that are exempt from the duty to obtain a groundwater withdrawal permit from the EAA and to meter withdrawals. (EAA Act 1.15, 1.16c, and 1.33). A well qualifies for exempt well status if: (1) it is capable of producing no more than 25,000 gallons of water a day; (2) it will be used solely for domestic or livestock use; and (3) it is not within or serving a subdivision requiring platting; or (4) the well is located on and operated by, or for the benefit of, a federal facility, and prior to September 1, 2003, the EAA has not approved the transfer of ownership of an application for an Initial Regular Permit related to the well from the federal facility to another person. (EAA Rules 702.1(b)(24) and 71.20). Further, Aquifer withdrawals made from exempt wells are not subject to or limited by the Aquifer-wide withdrawal cap that is discussed above in relation to Initial Regular Permits. However, the EAA requires owners of exempt wells to register the well. In so doing, the EAA can be sure that the well qualifies for exempt status. It is estimated that in 2010, 13,605 ac-ft of withdrawals were made from domestic and livestock exempt wells.(eaa 2011b). The mean amount of water withdrawn annually from these exempt wells between 2000 and 2010 was calculated to be 13,700 ac-ft. (Id.). The total withdrawal by 2-4
46 exempt federal facilities in 2010 was 5,126 ac-ft. (Id.) Thus, the total withdrawal from exempt wells in 2010 was 18,731 ac-ft. 1 EAA seeks incidental take coverage for its determination that a well qualifies for exempt status and withdrawals from the Aquifer from a well that the EAA has determined to qualify for exempt status. Any take of federally listed species resulting from the withdrawal of water from the Aquifer by a federal entity is not included as a Covered Activity in this HCP. The manner in which any significant change in those withdrawals will be addressed is discussed in the Changed Circumstances provisions of Section Permit Administration Permit Transfers and Amendments The ownership, point of withdrawal, purpose of use, place, of use, and maximum rate of withdrawal for a permit may be changed by a transfer or amendment process (EAA Rules Ch. 711, subch. L). The EAA seeks incidental take coverage for its authorization of withdrawals from the Aquifer pursuant to a change in permit under the EAA s permit administration rules in subchapter L of Chapter 711 and for owners and lessees making withdrawals under such a change in permit Conversion of Base Irrigation Groundwater The groundwater withdrawal amount for an Initial Regular Permit issued for irrigation purposes is bifurcated between an unrestricted amount and a base amount, (EAA Act 1.34(c); EAA Rules 702.1(29) and (199)). The place and purpose of use of the unrestricted portion is generally transferable. The base portion, however, is not freely transferable and must be used in accordance with the place of use and purpose of use for irrigation as set out in the originally issued Initial Regular Permit. By rule, the EAA has authorized the conversion of base water into unrestricted in certain limited circumstances. Upon conversion, the purpose of use and place of use for the base water becomes as freely transferable as that for unrestricted water (EAA Rules ). A conversion is authorized in only two circumstances: first, if the irrigator installs water conservation equipment such that less water is required for irrigation of the historically irrigated land (EAA Act 1.34(b)); and, second, if the historically irrigated lands that provided the basis for the issuance of the Initial Regular Permit have been developed and are no longer farmed under the circumstances described in the EAA rules. 1 In the modeling of springflow, HDR assumed the total withdrawal from exempt wells was 20,203 ac-ft. See Section below. 2-5
47 The EAA seeks incidental take coverage for its authorization of withdrawals pursuant to a conversion and for the owners or lessees of irrigation permits making withdrawals from the Aquifer pursuant to such a conversion Critical Period Management Program In 2007, the Texas Legislature amended the EAA Act by passage of Senate Bill 3. 2 The legislation amends Section 1.26(b) of the Act to direct the EAA to adopt and enforce a Critical Period Management (CPM) plan with withdrawal reduction percentages whether according to the index well levels or the springflow at Comal or San Marcos Springs as applicable, for a total withdrawal reduction in critical period Stage IV of 40 percent of the permitted withdrawals under Table 2-1 for the San Antonio Pool and 35 percent under Table 2-2 for the Uvalde Pool: TABLE 2-1 CRITICAL PERIOD WITHDRAWAL REDUCTION STAGES FOR THE SAN ANTONIO POOL Critical Period Stage Comal Springs Flow (cfs) San Marcos Springs Flow cfs Index Well J-17 Level MSL Withdrawal Reduction - San Antonio Pool I <225 <96 <660 20% II <200 <80 <650 30% III <150 N/A <640 35% IV <100 N/A <630 40% cfs = cubic feet per second; MSL = mean sea level TABLE 2-2 CRITICAL PERIOD WITHDRAWAL REDUCTION STAGES FOR THE UVALDE POOL Critical Period Stage Withdrawal Reduction Uvalde Pool Index Well J-27 Level MSL I N/A N/A II 5% <850 III 20% <845 IV 35% <842 MSL = mean sea level; N/A = not applicable 2 Senate Bill 3 (Act of May 28, 2007), 80 th Leg. R. S. ch 1430, , 2007 Tex. Gen. Laws 5848,
48 The legislation also stipulated that [b]eginning September 1, 2007, the [EAA] may not require the volume of permitted withdrawals to be less than an annualized rate of 340,000 acre-feet, under critical period Stage IV. (EAA Act 1.26(a)(d)). Further, [a]fter January 1, 2013, the [EAA] may not require the volume of permitted withdrawals to be less than an annualized rate of 320,000 acre-feet, under critical period Stage IV unless, after review and consideration of the recommendations provided under Section 1.26A [of the Act] the [EAA] determines that a different volume of withdrawals is consistent with... maintaining protection for federally listed threatened and endangered species associated with the Aquifer to the extent required by federal law. (Id. at (e)). The EAA seeks incidental take coverage for withdrawals from the Aquifer as may be reduced pursuant to the final CPM plan described above and in Section of the HCP Minimization and Mitigation Measures The following Covered Activities constitute minimization and mitigation measures and measures specifically intended to contribute to recovery under the HCP that will be implemented by the EAA. These measures are further detailed in Chapter 5. Support of USFWS refugia (Section 5.1.1) Voluntary Irrigation Suspension Program Option (Section 5.1.2) Regional Water Conservation Program (Section 5.1.3) Critical Period Management - - Stage V (Section 5.1.4) Expanded Water Quality Monitoring (Section 5.7.5) 2.3 City of New Braunfels The Comal Springs, Landa Lake, and the Comal River are located within the boundaries of the City of New Braunfels. The City has the authority to manage the ecosystems of the Comal Springs, Landa Lake, and the Comal River within its geographical boundaries. These ecosystems are also used for recreational activities that are regulated in part by the City. Further, the City of New Braunfels diverts surface water from the Comal River. As described below, the City seeks incidental take coverage for the recreational activities within its jurisdiction, the management of the ecosystems of the Comal Springs, Landa Lake, and Comal River and the diversion of water from the Comal River. Finally, the City of New Braunfels seeks coverage for the minimization and mitigation measures that it will either implement or have responsibility for having implemented. These Covered Activities are described in more detail below and in Chapter
49 2.3.1 Management of Public Recreational Use of Comal Springs and River Ecosystems Public recreational use of the Comal Springs and River ecosystems includes, but is not limited to, swimming, wading, tubing, boating, canoeing, kayaking, scuba diving, snorkeling, and fishing. Related activities include operation of the wading pool at Landa Park on Spring Run 2, non-motorized vessels on Landa Lake, and all tubing, regardless of origin of the tuber or tube, on the Comal River from the confluence of the Dry Comal Creek to the confluence of the Guadalupe River. Where this recreational use is facilitated in any respect by the City of New Braunfels, including but not limited to the providing public access or outfitting services, the City of New Braunfels seeks incidental take coverage for impacts of these Covered Activities. Where this recreation is facilitated by commercial outfitting businesses, the City seeks incidental take coverage for these businesses through Certificates of Inclusion issued by the City of New Braunfels. (See Section 5.2.3). This Certificate of Inclusion process is voluntary, and outfitting businesses may obtain a Certificate of Inclusion in order to obtain incidental take coverage for their recreational activities. Regardless, for a recreator to be covered, the person must be in compliance with all local, state and federal laws and regulations. The failure of a person to comply with these regulations or one or more outfitters lack of coverage pursuant to a Certificate of Inclusion in no way affects or alters the City of New Braunfels incidental take coverage or requirements under this HCP and the Permit Management of Water Levels in the Comal River The City of New Braunfels operates gates, culverts, and dam structures from Landa Lake to the Old Channel (three culverts), New Channel U.S. Geological Survey (USGS) Weir, Springfed Pool Inlet, Wading Pool Weir, Clemens Dam, USGS Weir (known as Stinky Falls ), Golf Course Weir, and Mill Pond Dam (joint New Braunfels Utility and City of New Braunfels operation) to maintain constant flow in the Comal River, maintain constant elevations of large pools, and regulate flow regimes in the Old and New Channels during high and low flow events. The City of New Braunfels also has a permit from TCEQ for 40 acre-feet of impounded water at Clemens Dam (City of New Braunfels Tube Chute). This permit is non-consumptive and establishes the constant level in the Comal River upstream of Clemens Dam to the confluence of the Old Channel and confluence of the Dry Comal Creek The City seeks incidental take coverage for the operation of these structures including any incidental take that may occur during their operation such as by entrapment of a Covered Species Golf Course Diversions and Operation The City of New Braunfels seeks incidental take coverage for the maintenance and upkeep of the Landa Park Golf Course adjacent to the Old Channel of the Comal River, including the use of plant protectants to maintain the golf course and the diversion of water from the Old Channel to maintain the golf course. 2-8
50 Irrigation water for the golf course is obtained via a single diversion from the Old Channel permitted by TCEQ (Permit , Permit A, Permit B, and Permit ). The diversion is located approximately 200 yards upstream of Hinman Island Drive and considerably downstream of the Old Channel ERPA. The total water that is permitted for that diversion is 300 ac-ft/yr (200 ac-ft under permit and 100 ac-ft/yr for permit ). Permit is the more junior water right. The total diversion rate allowed under both permits combined is 2 cfs. Currently, the pump for the diversion is capable of diverting only 1 cfs. The surface water diversion will be operated in accordance with TCEQ rules including any TCEQ order to reduce or stop diverting water during low flows. Historically, the City of New Braunfels Golf Course does not use its full permitted water rights for irrigating the Golf Course. From 2006 through 2010, an average of ac-ft of water was diverted under both permits for golf course irrigation. To reduce dependency on Comal River water further, the City of New Braunfels is working with New Braunfels Utilities under a grant received by the Texas Water Development Board to develop and implement a reuse water system that will be used to maintain the golf course by supplementing or when feasible replacing the surface diversions used for irrigation purposes. The design process is underway Spring-Fed Pool Diversions and Operation The City of New Braunfels seeks incidental take coverage for the impacts of its use and operation of the Landa Park Springfed Pool adjacent to the Old Channel of the Comal River. The City of New Braunfels is authorized to divert 8 ac-ft/yr of water from the Old Channel and impound it in the pool by TCEQ Permit Because the water is returned to the Old Channel, this diversion is permitted as a non-consumptive use. Maintenance operations (routine cleaning, algae removal, chemical application pursuant to label instructions, and filling/emptying) will be conducted according to the 2003 Comal Ecosystem Management Plan. (See Appendix N). Surface water diversions will be operated in accordance with TCEQ rules as established by Permit Boat Operations on Comal River and Landa Lake The City of New Braunfels seeks incidental take coverage for the boats it operates on the Comal River and Landa Lake related to research, enforcement, litter collection, and maintenance activities Infrastructure Maintenance and Repair The City of New Braunfels seeks incidental take coverage for the routine, minor repairs of infrastructure and facilities associated or located on City of New Braunfels property that is adjacent to or directly affects the Comal Springs and River ecosystem. Routine, minor repairs include activities such as repairs to access points or stairways adjacent or leading to the springs or river, but in any event would not involve activities requiring a USACE 404 permit or authorization. 2-9
51 2.3.7 Minimization and Mitigation Measures and Measures that Contribute to Recovery The following Covered Activities constitute minimization and mitigation measures as well as measures specifically designed to contribute to recovery under the HCP that will be implemented by the City of New Braunfels. These measures are further detailed in Chapter 5. Flow-split Management in the Old and New Channel (Section 5.2.1) Native Aquatic Vegetation Restoration and Maintenance (Section 5.2.2) Management of Public Recreational Use of Comal Springs and River Ecosystem (Section 5.2.3) Decaying Vegetation Removal and Dissolved Oxygen Management (Section 5.2.4) Control of Harmful Non-Native and Predator Species (Section 5.2.5) Non-Native Snail Removal Program and Gill Parasite Monitoring (Section 5.2.6) Prohibition of Hazardous Materials Transport Across the Comal River and Its Tributaries (Section 5.2.7) Native Riparian Habitat Restoration (Section 5.2.8) Reduction of Non-Native Species Introduction and Live Bait Prohibition (Section 5.2.9) Litter Collection and Floating Vegetation Management (Section ) Management of Golf Course Diversions and Operations (5.2.11) Management of Household Hazardous Wastes (Section 5.7.5) Impervious Cover/Water Quality Protection (Section 5.7.6) 2.4 City of San Marcos The City has the authority to manage the ecosystems of the San Marcos River and Springs within its jurisdiction. These ecosystems are also used for recreational activities that are regulated in part by the City. The City of San Marcos also is authorized to pump water from the Aquifer. The City seeks incidental take coverage for the recreational activities within its jurisdiction, the management of the ecosystems of the San Marcos River and Springs, and the permitted use of the Aquifer. Finally, the City of San Marcos seeks coverage for the mitigation and minimization measures that it will either implement or have the responsibility of implementing. These Covered Activities are described in more detail below and in Chapter
52 2.4.1 Management of Public Recreational Use of San Marcos Springs and River Ecosystems Public recreational uses of the San Marcos Spring and River ecosystems include, but are not limited to swimming, wading, tubing, boating, canoeing, kayaking, golfing, snorkeling, SCUBA diving, and fishing. The City of San Marcos seeks incidental take coverage for its management of public recreation and for the individuals who recreate in accordance with all applicable laws and regulations Boat Operations on San Marcos River The City of San Marcos seeks incidental take coverage for its operations related to enforcement, research, litter collection, and maintenance activities on the San Marcos River. No motors allowed except electric trolling motors. There are no gasoline or petroleum fueled boats in operation on the San Marcos River Infrastructure Maintenance and Repair The City of San Marcos seeks incidental take coverage for routine, minor repairs of infrastructure and facilities associated with or located on City of San Marcos property that are adjacent to or directly affect the San Marcos Springs and River ecosystem. Routine, minor repairs would include activities such as repairs to access points along the river, but would not involve activities requiring a USACE 404 permit or authorization Minimization and Mitigation Measures and Measures that Contribute to Recovery The following Covered Activities constitute minimization and mitigation measures and measures that are intended to contribute to recovery that will be implemented by the City of San Marcos. These measures are further detailed in Chapter 5. Texas Wild-Rice Enhancement and Restoration (Section 5.3.1) Management of Recreation in Key Areas (Section 5.3.2) Management of Vegetation and Litter below Sewell Park (Section 5.3.3) Prohibition of Hazardous Materials Transport Across the San Marcos River and Its Tributaries (Section 5.3.4) Reduction of Non-Native Species Introduction (Section 5.3.5) Sediment Removal below Sewell Park (Section 5.3.6) Designation of Permanent Access Points/Bank Stabilization (Section 5.3.7) Control of Non-native Plant Species (Section 5.3.8) Control of Harmful Non-Native and Predator Species (Section 5.3.9) Native Riparian Habitat Restoration (Section 5.7.1) 2-11
53 Septic System Registration and Permitting Program (Section 5.7.3) Minimization of Impacts of Contaminated Runoff (Section 5.7.4) Management of Household Hazardous Wastes (Section 5.7.5) Impervious Cover/Water Quality Protection (Section 5.7.6) 2.5 Texas State University Portions of the San Marcos River and the San Marcos Springs are located within the jurisdiction of Texas State University. The University has the authority to manage the ecosystems of the San Marcos River and Springs within its jurisdiction. These ecosystems are used for educational and research purposes by the University, for recreational activities by the students, faculty and staff of the University and for public service activities. The University is authorized to pump water from the Aquifer and to divert water from Spring Lake and San Marcos Springs. The University seeks incidental take coverage for the educational, research, recreational, and public service activities within its jurisdiction, the management of the ecosystems of the San Marcos River and Springs, the permitted use of the Aquifer, the diversion of water from the springs, and the use of the San Marcos Springs and River. The University seeks coverage for the minimization and mitigation measures that it will implement or have responsibility for having implemented. The Covered Activities are described in more detail below and in Chapter Management of Public Recreational Use of San Marcos Springs and River Ecosystems Public recreational use of the San Marcos Spring and River ecosystems include, but are not limited to swimming, wading, tubing, boating, canoeing, kayaking, golf, diving, snorkeling and fishing. Covered activities include recreation in accordance with all applicable laws and regulations Vegetation Management Management of Submerged and Floating Aquatic Vegetation in Spring Lake Texas State University currently harvests submerged vegetation from Spring Lake with a harvester boat and manually cuts vegetation from around spring openings, the underwater archaeological site, along the wall by the River Systems Institute, and in the fountain area. All vegetation is removed in order to enhance viewing from the River System Institute s glassbottom boats and prevent entanglement of plant material in the boat propeller. 2-12
54 Management of Aquatic Vegetation and Litter from Spring Lake Dam to City Park Lower flows in the San Marcos River increase the likelihood of vegetation mats forming on top of Texas wild-rice plants which may interfere with flowering and reproduction, block sunlight and interfere with photosynthesis, and slow current velocity (Power 1996). Additionally, the San Marcos River is heavily used for recreation from Spring Lake Dam to IH-35. Texas State University will remove floating vegetation mats and litter from the River to enhance the aesthetics and enjoyment of recreational activities, such as tubing, swimming, canoeing, and fishing, in areas from Spring Lake Dam to City Park Diving Classes in Spring Lake Texas State University provides educational activities within Spring Lake and the San Marcos River in accordance with all applicable laws and regulations. The University has designated an area of 2140 square meters as its Dive Training Area in Spring Lake; this area was the site of the underwater show of the Aquarena Springs theme park for over 40 years. The natural and cultural resources in this area have long been disturbed, hence diving activities occurring here will have minimal impact, if any, on listed species. To minimize the impacts of its classes and programs on the habitat in Spring Lake, any individual diving outside of the Dive Training Area has to complete the Diving for Science class. Texas State University seeks incidental take coverage for these educational activities. Current educational activities include the following Covered Activities: Diving for Science Program This program trains volunteers to SCUBA in a manner that protects listed species in Spring Lake. Upon completion, the volunteers help with various projects in the lake, but always under supervision. This Program is required for anyone diving outside the Dive Training Area in Spring Lake Continuing Education SCUBA Classes Texas State University allows the use the designated Dive Training Area (approximately 2,140 m 2 ) for a maximum of ten check-out dives by dive shops at the end of each semester for their beginning and advanced SCUBA classes. These divers will not be allowed to dive outside of this area Texas State University SCUBA Classes Texas State University will offer basic and advanced SCUBA classes with multiple sessions occurring year-round. All of these classes are taught only in the Dive Training Area Research Programs Research is a primary component of Texas State University s activities in Spring Lake. All research proposals will be reviewed by the staff of the River Systems Institute to ensure there is 2-13
55 no impact on Covered Species or their habitat in Spring Lake. If take cannot be avoided it will be minimized by educating the researchers as to the area where the species are located and measures to minimize any potential impacts as described in Section Any diving support to a research study in Spring Lake will be provided by individuals who have completed the Diving for Science Program Diversion of Water from Spring Lake Texas State University has surface water right certificates from the TCEQ, as described below. 3 Texas State University seeks incidental take coverage for the use and operation of the authorized diversions Spring Lake (Certificate ) Texas State University has a 100 ac-ft/yr irrigation water right. A pump house located adjacent to golf course green #8 diverts an average of 26 ac-ft/yr of water for the purpose of irrigating the 70-acre Aquarena golf course. The permit limits the diversion rate for the diversion to 1.33 cfs. The University also has a 534 ac-ft/yr industrial permit with a maximum permitted diversion rate of 600 gpm. Over the last five years, it has used an average of 103 ac-ft/yr of this industrial permit for two chiller plants (East Chill Plant and Cogen Plant). The water is pumped from an intake site located just below the Spring Lake dam. The permit limits the diversion rate for the diversion to 1.33 cfs. Texas State University has a 513 ac-ft/yr municipal water right; a 31,262 ac-ft/yr hydroelectric water right; and a 700 ac-ft/yr water right to operate an artificial waterfall. The permit for the hydroelectric plant and artificial waterfall is for non-consumptive use with the water being returned to Spring Lake near the point of diversion. The diversion rate for the 513 acre-foot right is limited by the permit to 2.22 cfs. The University has not exercised these rights and has no present intention to exercise these rights. However, Texas State University may consider exchanging these rights for additional irrigation or industrial rights if future growth requires additional water resources. In addition, the University is authorized to impound 150 ac-ft/yr in Spring Lake. The rate of diversion from Spring Lake for consumptive use water under TCEQ Certificate No is limited to a total of 4.88 cfs San Marcos River (Certificate ) Texas State University has a 40 ac-ft/yr irrigation right that is not currently being used. The diversion is located on the San Marcos River at Sewell Park. The permit requires Texas State to reduce the diversion to 20 ac-ft/yr when flow in the River falls below 128 cfs. The permit limits the rate of diversion for this water right to 1 cfs. The University also has a 60 ac-ft/yr industrial permit used to fill and replenish seven off-channel reservoirs (old fish hatchery ponds) 3 See also Section and Figures 5-3 and
56 for biological research and related educational purposes. Over the last five years, Texas State University has used an average of 36 ac-ft/yr to replenish these ponds. The permit limits the rate of diversion for this water right to 2.22 cfs. The water is diverted at a pump house located in Sewell Park. The total rate of diversion for consumptive use water from the San Marcos River under TCEQ Certificate No is limited to 3.22 cfs Management of Golf Course and Grounds Texas State University seeks incidental take coverage for the impacts of its maintenance of a nine-hole golf course located adjacent to Spring Lake. Management practices include application of fertilizer and pesticides, mowing, and landscaping Boating in Spring Lake and Sewell Park Texas State University seeks incidental take coverage for the impacts of its boating activities in Spring Lake and Sewall Park. Texas State University occasionally conducts canoeing/kayaking classes in Spring Lake and Sewell Park. Classes in Spring Lake occur in the glass-bottom boat runs, and the classes downstream of Spring Lake will use the area between Sewell Park and Rio Vista Falls. Additionally, the glass bottom boat and glass bottom kayaks operate in Spring Lake. Canoes and kayaks will also occasionally be used for research and maintenance projects in Spring Lake and in the River Minimization and Mitigation Measures The following Covered Activities constitute minimization and mitigation measures and measures specifically intended to contribute to recovery that Texas State University will have the responsibility for implementing. These measures are further detailed in Chapter 5. Texas Wild-Rice Enhancement and Restoration (Section 5.4.1) Control of Recreation in Key Areas (Section 5.4.2) Management of Vegetation (Section 5.4.3) Sediment Removal in Spring Lake and Sewell Park (Section 5.4.4) Diversion of Surface Water (Section 5.4.5) Sessom Creek Sand Bar Removal (Section 5.4.6) Diving Classes in Spring Lake (Section 5.4.7) Research Programs in Spring Lake (Section 5.4.8) Management of Golf Course and Grounds (Section 5.4.9) Boating in Spring Lake and Sewell Park (Section ) Reduction of Non-Native Species Introduction (Section ) Control of Non-Native Plant Species (Section ) 2-15
57 Control of Harmful Non-Native and Predator Species (Section ) 2.6 San Antonio Water System The San Antonio Water System (SAWS) is a water purveyor to residences, businesses and other end users in the City of San Antonio and parts of Bexar and surrounding counties. SAWS is authorized by the EAA to pump water from the Aquifer. SAWS has access or otherwise controls approximately 46 percent of the permitted water rights to pump from the Aquifer. As part of its operation, it stores water pumped from the Aquifer in an Aquifer Storage and Recovery facility (SAWS ASR) located in Southern Bexar County. The SAWS ASR is an underground storage reservoir in the Carrizo sand aquifer in Southern Bexar County. As a SAWS Water Management Project it is designed to store Aquifer water when demand is less than available supply. The stored water is returned to San Antonio for use during critical period when demand is high. SAWS seeks incidental take coverage for the impacts of its pumping from the Aquifer and for its use and operation of the SAWS ASR Minimization and Mitigation Measures The following Covered Activities constitute minimization and mitigation measures and measures specifically intended to contribute to recovery that will be implemented by SAWS. These activities are further detailed in Chapter 5. Use of the SAWS ASR for Springflow Protection. (Section 5.5.1). Phase II Expanded Use of the SAWS ASR and Water Resources Integration Program Pipeline. (Section 5.5.2). 2.7 Texas Parks and Wildlife Department To minimize the impacts of recreational activities on Texas wild-rice and other Covered Species habitat, Texas Parks and Wildlife Department (TPWD) in support of the HCP created a State Scientific Area in the San Marcos Springs ecosystem effective May 1, This Scientific Area is designed to protect Texas wild-rice by limiting recreation in these areas during low flow conditions. (See Section 5.6.1). TPWD also will pursue the creation of state scientific areas in the Comal Springs ecosystem for the protection of existing fountain darter habitat and additional habitat created by the City of New Braunfels. (See Section ). TPWD seeks incidental take coverage for the implementation of the regulations creating these state scientific areas. 2.8 Adaptive Management Process The Applicants anticipate the need for three levels of decisions (Section 6.1.3) relating to the AMP during the term of the ITP: (1) Routine Adaptive Management Decisions; (2) Non-routine Adaptive Management Decisions; and (3) Strategic Adaptive Management Decisions. As part of the AMP, the Applicants also will conduct applied research at the Applied Research Facility at 2-16
58 the San Marcos NFHTC. The Applicants seek incidental take coverage for the management, oversight, and implementation of measures developed in the AMP. 2-17
59 This page intentionally left blank 2-18
60 Chapter 3 Environmental Setting and Baseline Conditions 3.1 Climate Regional Description The prevailing climate of the HCP Study Area varies from subtropical steppe in the western region to subtropical subhumid in the central region and to subtropical humid in the eastern region. (Larkin and Bomar 1983; see Figure 3-1). The subtropical steppe is characterized by semi-arid to arid conditions. Subtropical subhumid climate is typified by long, hot summers and short, mild winters, while subtropical humid climate exhibits higher humidity and slightly milder summers. Regional prevailing winds are generally southerly, except during winter, when they are frequently from the north. Latitude, elevation, and proximity to the Gulf of Mexico influence the climate of the region. The average annual temperature in the study area is about 68 F (20 C), with average annual high temperatures of F (26 29 C) (Figure 3-2). Summertime temperatures commonly exceed 100 F (38 C) with average monthly high temperatures ranging from 90 F (32 C) to 97 F (36 C) (Larkin and Bomar 1983). Winters are generally mild with average monthly low temperatures ranging from about 36 F (2 C) to 60 F (16 C). Temperatures fall below freezing about 20 days each year (NOAA 2010). Average annual precipitation within the region varies from about 20 inches in western Kinney County to about 40 inches in Calhoun County (Figure 3-3); however, in some years the region may receive as much as 50 inches or as little as 10 inches of precipitation (National Oceanic and Atmospheric Administration 2000). Average annual precipitation over the Edwards Aquifer during the period of ranged from about 21.9 inches in the western region to 34.2 inches in the eastern region. During this period, San Antonio averaged 30.4 inches of precipitation. (EAA 2010b). Historically, precipitation is highest during May and September. Stalled cool fronts and summer tropical storms may result in increased precipitation amounts. It is reported that the potential incidence of high-magnitude flooding is greater for the Balcones Escarpment area of central Texas than for any other region of the United States. (Caran and Baker 1986). In part, this is due to the climatic provenance of central Texas; the area lies within a convergence zone of high and low pressure air masses. Additionally, tropical storms and hurricanes penetrate into the area from the Gulf of Mexico producing some of the areas heaviest rainfalls. (Patton and Baker 1976). Once rainfall hits the ground, runoff absorption rates become a function of landscape physiography. Along the Balcones Escarpment, valleys are 3-1

61 3-2
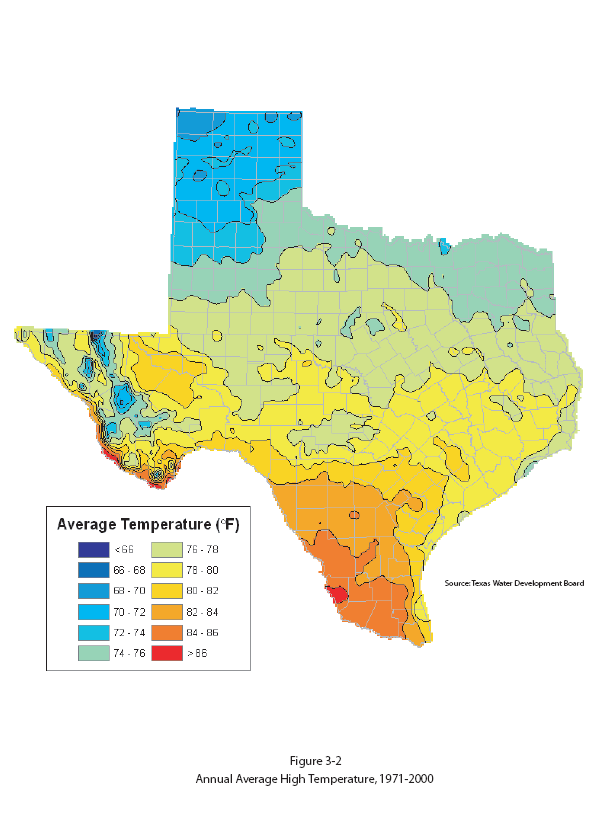
62 3-3
63 3-4
64 narrow, slopes are sparsely covered by vegetation, and the surface is variably exposed bedrock or overlain by thin upland soils. Below the Escarpment, on the Blackland Prairies, soils with lowabsorption rates. (Caran and Baker 1986; Patton and Baker 1976). Interacting together, these infiltration capacity severely limit factors greatly increase runoff and drainage discharge. Regional surface water features are subject to evaporation, especially during hot summer months. Average regional monthly gross lake-surface evaporation ranges from approximately 2.5 inches in January to over 9 inches in August. (Larkin and Bomar 1983). Evapotranspiration percentages vary throughout the region, with an average of approximately 85 to 90 percent of regional precipitation lost through evapotranspiration. (USGS 1995) Frequency of Tropical Storms Tropical storms, including hurricanes, hit the Texas Gulf Coast at a frequency of about 0.67 storm per year. (Brown et al. 1974). Occasionally these storms move inland while dissipating, resulting in severe weather over the region. As moisture-laden air masses move inland from the Gulf of Mexico and are forced to rise at the Balcones Escarpment, they mix with low pressure fronts from the north or west. Such systems can result in some of the largest storms ever recorded in the United States. High winds, excessive rainfall, hail, and tornadoes may result from these tropical storms. Flash flooding is common after thunderstorms that produce large amounts of precipitation in a relatively short period of time. One such instance was flooding associated with Hurricane Amelia in August Between August 1 and 3, 1978, more than 48 inches of rain fell on a ranch in Medina County, the highest three-day precipitation total ever recorded in the United States. (Caran and Baker 1986) Climate Change Regulatory Background The Council on Environmental Quality in the Executive Office of the President (CEQ) recently provided draft guidance for Federal agencies in analyzing the environmental effects of greenhouse gas (GHG) emissions and climate change as part of the assessment of the effects of a proposed action on the environment in accordance with Section 102 of NEPA and the CEQ Regulations for Implementing the Procedural Provisions of NEPA, 40 C.F.R. parts This draft guidance was provided in a February 18, 2010 memorandum (CEQ 2010). A summary of the existing and potential future effects of climate change on the affected environment are discussed below. Compounding effects of climate change to impacts of the Covered Activities on the affected environment of the HCP Plan Area are discussed in this Chapter. The U.S. Climate Change Science Program (CCSP) has concluded that the global climate is changing. Effects of this change on the existing environment has been evaluated in a 2008 U.S. national scientific assessment (National Science and Technology Council 2008) which integrates, evaluates, and interprets the findings of the CCSP and draws from and synthesizes 3-5
65 findings from previous assessments of the science, including reports and products by the Intergovernmental Panel on Climate Change (IPCC). The conclusions in the National Science and Technology Council assessment build on the vast body of observations, modeling, decision support, and other types of activities conducted under the auspices of CCSP and from previous assessments of the science, including reports and products by the IPCC, CCSP, and others. This assessment and the underlying assessments have been subjected to and improved through rigorous peer reviews. According to CCSP s Synthesis and Assessment Product (SAP) 4.3 (Backlund et al. 2008), it is very likely that temperature increases, increasing carbon dioxide levels, and altered patterns of precipitation are already affecting U.S. water resources, agriculture, land resources, biodiversity, and human health, among other things. SAP 4.3 also concluded that it is very likely that climate change will continue to have significant effects on these resources over the next few decades and beyond. Numerous lines of evidence robustly lead to the conclusion that the climate system is warming. The IPCC (2007a) stated in its Fourth Assessment Report: Warming of the climate system is unequivocal, as is now evident from observations of increases in global average air and ocean temperatures, widespread melting of snow and ice, and rising global average sea level Temperature and Precipitation Trends in Texas Based on the Historical Record Regional data for North America confirm that warming has occurred throughout most of the United States. The U.S. Historical Climate Network of the National Climatic Data Center found that for all but 3 of the 11 climate regions, the average temperature increased more than 0.6 degrees Celsius ( C) between 1901 and 2005 (NOAA 2007). According to data compiled by the National Climatic Data Center (2010) over the period of record 1895 to 2010, temperature in Texas has increased at a rate of about 0.1 degree Fahrenheit per decade or about 1 degree Fahrenheit over the past century, while precipitation during this same period has decreased at a rate of inch per decade or about 0.3 inch over the past century Future Temperature Projections In order to project future changes in the climate system, including temperature, precipitation, and sea level at global and regional scales, academic institutions and government-supported research laboratories in the United States and other countries have developed a number of computer models that simulate the Earth system and that are based on the various emissions scenarios described in the National Science and Technology Council s Scientific Assessment (NSTC 2008). The IPCC helps coordinate modeling efforts to facilitate comparisons across models, and synthesizes results published by several modeling teams. By mid-century (2046 to 2065), the choice of scenarios involving greenhouse gas emissions becomes more important for the magnitude of the projected global average warming, with average values of 1.3, 1.8, and 1.7 C from the models for 3-6
66 scenarios B1 (low emissions growth), A1B (medium emissions growth), and A2 (high emissions growth), respectively (Meehl et al. 2007). By the end of the century (2090 to 2099), projected global average surface warming varies significantly by emissions scenario. The full suite of the IPCC s Special Report on Emission Scenarios (SRES) (IPCC 2000) provide warming for 2090 to 2099 relative to 1980 to 1999 with a range of 1.8 to 4.0 C with an uncertainty range of 1.1 to 6.4 C. The IPCC found that all of North America is very likely not only to warm during this century, but to warm more than the global mean warming in most areas (Christensen et al. 2007). An increase in surface evaporation is expected to accompany the projected widespread increase in temperature. According to CCSP s Synthesis and Assessment Product (SAP) 4.3 (Backlund et al. 2008), it is very likely that temperature increases, increasing carbon dioxide levels, and altered patterns of precipitation are already affecting U.S. water resources, agriculture, land resources, biodiversity, and human health, among other things. SAP 4.3 also concluded that it is very likely that climate change will continue to have significant effects on these resources over the next few decades and beyond Precipitation Projections Overall, future model projections show that global mean precipitation increases with the warming of the climate (Meehl et al. 2007), but with substantial spatial and seasonal variations. Other conclusions provided by recent climate studies include: A widespread increase in annual precipitation is projected by the IPCC over most of the North American continent except the southern and southwestern part of the United States and over Mexico Some models project drying in the southwestern United States, and more than 90 percent of the models project drying in northern and particularly western Mexico. In western North America, modest changes in annual mean precipitation are projected, but the majority of models indicate an increase in winter and a decrease in summer. Models show greater consensus on winter increases to the north and on summer decreases to the south. Recent analyses (Milly et al. 2005; Karl et al. 2008) shows that several atmosphere ocean general circulation models project greatly reduced annual water availability over the southwestern United States and northern Mexico in the future. Climate model projections indicate that larger streamflow declines are expected in the West, where the balance between precipitation and evaporative demand changes will be dominated by increased evaporative demand. However, because of the uncertainty in climate model projections of precipitation change, future projections of streamflow are highly uncertain across most of the United States. (Lettennmaier et al. 2008). 3-7
67 While caution should be used as global climate projections move to more regional and localized levels, such projections may still provide insights into future trends. Climate projection data developed and used by the IPCC have been further refined and downscaled by the Lawrence Livermore National Laboratory (LLNL) Green Data Oasis (LLNL et al. 2010) to simulate climate projections on a regional level. Such data allows the evaluation of potential climate change on habitat of threatened and endangered species (Darby 2010). Projected change in precipitation for Texas from 2009 through 2050 using IPCC SRES CCSM Scenario B1 Scenario (low greenhouse gas emissions) as downscaled by the LLNL Green Data Oasis and portrayed by Darby (2010) is illustrated by Figure 3-4. Sea level rise could affect the southeastern Texas coast along the Gulf of Mexico. With increases in global ocean temperatures, the IPCC (2007a) projects sea level rise of between 0.59 and 1.9 ft. by the end of the century (2090 to 2099) relative to the base period (1980 to 1999). The projected rate of sea level rise off the low-lying U.S. South Atlantic and Gulf Coasts (which includes portions of the HCP Planning Area) is predicted to be higher than the global average Projections of Extreme Events Models suggest that climate change will alter the prevalence and severity of many extreme events such as heat waves, cold waves, storms, floods, and droughts. Projections of global temperature from the IPCC (Meehl et al. 2007) show that it is very likely that heat waves will become more intense, more frequent, and longer lasting in a future warm climate, whereas cold episodes are projected to decrease substantially. Meehl and Tebaldi (2004) and Meehl et al. (2007) found that the pattern of future changes in heat waves, showing the greatest increases in intensity over western Europe, the Mediterranean, and the southeastern and western United States is related in part to circulation changes resulting from an increase in greenhouse gases. The IPCC (Meehl et al. 2007) projected a tendency for drying in mid-continental areas during summer due to higher temperatures, indicating a greater risk of droughts in those regions. 3-8
68 Figure 3-4. Projected precipitation differences between 2009 and 2050 based on IPCC SRES CCSM Scenario B1 (low greenhouse gas emissions) SOURCE: (Darby 2010) 3-9
69 Climate Change Impacts IPCC studies suggest a number of components of the human environment, including water resources, will be impacted by climate change, resulting in a number of implications: All IPCC regions show an overall net negative impact of climate change on water resources and freshwater ecosystems (high confidence). The IPCC (Kundzewicz et al. 2007) concluded with high confidence that semi-arid and arid areas are particularly exposed to the impacts of climate change on freshwater. Projections for the Ogallala aquifer region show that natural groundwater recharge decreases more than 20 percent in all simulations with different climate models and future warming scenarios of 2.5 C or greater (Field et al. 2007) Global Implications The IPCC (Kundzewicz et al. 2007) reached several conclusions concerning the effects of global climate change on water resources: Climate change affects the function and operation of existing water infrastructure as well as water management practices (very high confidence). Adverse effects of climate on freshwater systems aggravate the impacts of other stresses, such as population growth, changing economic activity, land use change, and urbanization (very high confidence). Regionally, large changes in irrigation water demand as a result of climate change are likely (high confidence). Current water management practices are very likely to be inadequate to reduce the negative impacts of climate change on water supply reliability, flood risk, health, energy, and aquatic ecosystems (very high confidence). In the United States, many competing water uses will be adversely affected by climate change impacts on water supply and quality. Climate change impacts on water supply and quality will affect agricultural practices, including the increase in irrigation demand in dry regions and the aggravation of nonpoint source water pollution (e.g., pollution from urban areas, roads, or agricultural fields) problems in areas susceptible to intense rainfall events and flooding. (Field et al. 2007). Drawing on these studies, the IPCC concluded that climate change will constrain North America s over-allocated water resources, increasing competition among agricultural, municipal, industrial, and ecological uses (very high confidence). (Id.). Climate change has the potential not only to affect settlements directly, but also to affect them through impacts on other areas linked to their economies at regional, national, and 3-10
70 international scales. In addition, it can affect a settlement s economic base if it is sensitive to climate, as in areas where settlements are based on agriculture, forestry, water resources, or tourism (IPCC 2007b). In the United States, the most vulnerable areas are likely to be Alaska, coastal and river basin locations susceptible to flooding, arid areas where water scarcity is a pressing issue, and areas whose economic bases are climate-sensitive (Field et al. 2007) Regional Implications Climate change could impact groundwater resources by affecting recharge, pumping, natural discharge, and saline intrusion. (Mace and Wade 2008). They suggest that climate change will more adversely affect karstic aquifers, such as the Edwards Aquifer, that recharge locally from streams and rivers in comparison to aquifers where recharge is increased through pumping and the capture of intermediate and local groundwater flow paths. A warmer, dryer climate will increase demand for water to support agriculture, municipal, and industrial use. This will result in greater demand for both surface and groundwater. Decreases in surface water supply due to climate change may also increase demand for groundwater use. (Kundzewicz et al. 2007; Mace and Wade 2008). Natural aquifer discharge to springs and seeps is affected by recharge to the aquifer, discharge by pumping, and changes in groundwater gradients as affected by plants, including phreatophytic species that demand higher amounts of water. In coastal areas, groundwater and dependent resources may be affected by rising sea levels. As sea level rises, salt water moves inland, decreasing the areal extent of the aquifer and possibly affecting water quality in nearby wells. This is particularly important for shallow aquifers, especially karstic ones. (Mace and Wade 2008) Potential Climate Change Impacts to the Edwards Aquifer Mace and Wade (2008) and Loáiciga et al. (1996) suggest that the Aquifer is probably Texas s most vulnerable aquifer and groundwater resource with respect to climate change and variability In addition if there is a long-term drying of the climate in south-central Texas, area groundwater users can expect to be under more drought restrictions. Loáiciga et al. (2000) studied the climate change impacts on the Edwards Aquifer. Climate change scenarios were created from scaling factors derived from several general circulation models to assess the likely impacts of Aquifer pumping on the water resources of the Aquifer. Aquifer simulations using the GWSIM IV groundwater model indicate that, given the predicted growth and water demand in the Edwards Aquifer region, the Aquifer's ground water resources appear threatened under 2 CO 2 (i.e., doubling of CO 2 levels) climate scenarios. Their simulations indicate that 2 CO 2 climatic conditions could exacerbate negative impacts and water shortages in the Edwards Aquifer region even if pumping does not increase above its present average level. The historical evidence and the results of this research indicate that without proper consideration to variations in Aquifer recharge and sound pumping strategies, the water resources of the Edwards Aquifer could be severely impacted under a warmer climate. 3-11
71 Mace and Wade (2008) also used the GWSIM-IV groundwater model to evaluate effects of climate change. They scaled monthly recharge from 70 percent to 130 percent of the historical values to account for climate change and used pumpage defined by the critical period management rules in SB 3. Results indicated that for the period of , artesian flow at Comal Springs would cease despite critical period management. Modeling results further suggested that Aquifer pumping may have to be reduced by about 40,000 ac-ft/yr to maintain minimum springflows if recharge declines 30 percent Frequency of Droughts The Glossary of Meteorology defines droughts as "periods of abnormally dry weather sufficiently prolonged for the lack of water to cause a serious hydrologic imbalance. A number of different indices of drought, evaluating precipitation, temperature, and soil moisture data, have been developed to quantify drought, each with its own strengths and weaknesses. Two of the most commonly used are the Palmer Drought Severity Index and the Standard Precipitation Index. Serious droughts have been recorded in some parts of Texas in every decade since Droughts result from lower than normal precipitation levels; however, years with above average precipitation totals may still experience conditions of low water availability, especially after dry periods when increased groundwater pumping results in a shortage of water. Therefore, reporting the annual average amount of rainfall does not represent the occurrence of droughts or the impacts that droughts have on the Aquifer and the living organisms dependent upon it. Averaging the rainfall data tends to mask the duration and intensity of droughts. In addition, the lack of long-term rainfall data for the area hampers long-term analysis of droughts in the region. (Mauldin 2003). Droughts vary significantly in duration and intensity. At least five droughts of extended duration and extreme intensity have occurred since 1931 in the Plan Area. (Riggio et al. 1987). Numerous droughts of shorter duration and less intensity have also been recorded. In 1987, Riggio et al. conducted a comprehensive analysis of droughts using monthly rainfall data at many sites from 1931 to They defined droughts by the quantity and duration of rainfall events. Precipitation data were normalized to account for differences in rainfall between arid west Texas and humid east Texas. Between 1931 and 1985 the frequency of occurrence of the three-month drought in the Edwards Plateau region varied from 62 to 70 occurrences, depending on location. During the same period, the frequency of occurrence of the six-month drought varied between 32 and 40 occurrences. (Riggio et al. 1987). Less than 24 occurrences of the 12-month drought were recorded between 1931 and 1985 (Riggio et al. 1987). Although droughts are cyclic in nature, they are not consistent in frequency. The six-year drought that occurred from 1951 through 1956 is considered the drought of record for the Aquifer as it was the most severe drought recorded according to documented aquifer records maintained since This drought resulted in the only known cessation of artesian flow at Comal Springs in 1956, for 144 days (Longley 1995). To better understand the drought of record and how it relates to the long-term climate of the Aquifer, a study utilizing dendrochronology was conducted on existing data bases to evaluate historic drought patterns in 3-12
72 the Aquifer region (Mauldin 2003). Dendrochronlogy is the use of tree-ring analysis to evaluate historic climatic conditions. It is an established, critical element of climate research (Blasing and Fritts 1976; Robinson 1976; Stahle et al. 1985; Stahle and Cleaveland 1988; Cook et al. 1999). An extensive data base of tree-ring data for the southwest was used in the analysis (Cook 2000). Data collected from existing data-bases was correlated with the Palmer Drought Severity Index (PDSI) for a 280-year period ( ). The PDSI is a standard measure of soil moisture conditions used to classify drought frequency, intensity and duration. It has a range of -4.0 to 4.0, with an average year falling between -0.5 and 0.5. Droughts are defined as -1.0 through Over the 280-year period studied, 25.7 percent of the years were drought years. (Mauldin 2003). Although there are insufficient scientific techniques to accurately predict droughts, several conclusions may be drawn from this best available data. Droughts are not uncommon to the Aquifer region; however, they are usually short in duration and are generally not too intense. During the 280-year period (1700 through 1979), the Aquifer region experienced 40 droughts of various lengths. The duration of the average drought was 1.8 years, while droughts that lasted only 1 year were more common. Long-term droughts, defined as those exceeding 3 years in duration, occurred only four times, and three of those were in the 1700s. The fourth, long-term drought was the drought of record ( ), which lasted 6 years. The drought of record was the most intense long-term drought (-2.32 average PDSI, peaking about -3.1); however, six other droughts were more intense for shorter durations (PDSI > -3.1). (Mauldin 2003). Therrell (2000), also using tree-ring analysis, concluded that the drought of record was the most prolonged period of sustained drought in the past 347 years. The drought of record represents only 2.1 percent of the 280-year period analyzed and only 2.5 percent of the 40 droughts. However, there is evidence that much more severe droughts have occurred in North America prior to the instrumental record of roughly the last 100 years (Lettenmaier et al. 2008). When records of drought for the last two millennia are examined, the major twentieth century droughts appear to be relatively mild in comparison with other droughts that occurred within this time frame. (International Drought Information Center 2010). Although there are still a few high resolution (offering data on annual to seasonal scales), precisely dated (to the calendar year), tree-ring records available that extend back 2,000 years, most of the paleo-drought data that extends back this far are less precisely dated and more coarsely resolved. These records reflect periods of more frequent drought, or drier overall conditions rather than single drought events, so it is difficult to compare droughts in these records with twentieth century drought events. However, the twentieth century can still be evaluated in this context, allowing an assessment of whether parts of the twentieth century or the twentieth century as a whole were wetter or drier than in the past with these records. Several studies illustrate some paleo-drought records for the past 2,000 years. For instance, Woodhouse and Overpeck (1998), using paleoclimatic indicators (primarily tree rings), find that many droughts over the last 2,000 years have eclipsed the major U.S. droughts of the 1930s and 1950s, with much more severe droughts occurring as recently as the 1600s. Although the nature of future drought stress remains unclear, for those areas where climate models suggest drying, such as the southwest including the western half of Texas (Seager et al. 2007), extreme droughts as or more severe than those encountered in the instrumental record are more likely (Burke et al. 2006). More 3-13
73 recent (Cleaveland and Votteler 2011, in preparation) dendrochronology studies focused on the Aquifer region have reached similar conclusions for a 500-year time sequence beginning in The drought ending in 1956, as evaluated using 5-, 10-, and 20-year averages, ranks as either the second or forth driest period during the past 500 years. As actual rainfall is the driver in Aquifer recharge, and, therefore, spring flows, total rainfall during 1- to 10-year periods may better reflect the likelihood of decreased springflows such as that which occurred during the drought of record Likelihood of a Repeat of the Drought of Record In response to concerns about the likelihood of a reoccurrence of a significant drought that could adversely affect the spring systems during the term of the Permit, the potential for a repeat of the drought of record was analyzed from three perspectives: the long-term regional rainfall pattern based on tree-ring data, the regional pattern of rainfall from the instrumental rainfall records, and a probabilistic analysis based on the characteristics of the historic instrumental data Long-term Regional Rainfall Pattern (1500 to 2010) Based on a recent evaluation using tree-ring data as a proxy for annual rainfall, Cleaveland and Votteler (in preparation) have provided a depiction of the climate in the Edwards Aquifer region of Texas during the past 500 years. They identified the pattern of significant drought events in Divisions 6 and 7, which correspond to the Edwards Aquifer contributing zone and recharge zone respectively for this period. Significantly, the period ending in 1956 was the second driest 5-year period, the fourth driest 10 year period, and the second driest 20-year period in both Divisions, indicating that it was a significant, event of low frequency during this period The Regional Rainfall Record (1895 to 2010) Figure 3-5 displays the regional rainfall record from 1895 to
74 Annual Rainfall Total (inches) 50 Figure 4-6 Division 6 Rainfall Year Figure 3-5. Division 6 Rainfall Probabilistic Assessment of Recurrence of the Drought of Record Although not necessarily intuitive, annual rainfall totals are essentially random with little evidence for between year associations (Hershfield 1963; Guttman 1989). The distribution of annual rainfall totals is often nearly normal (or Gaussian) (Hirshfield 1963), but also can be represented by other statistical distributions. Guttman (1989) recommends evaluation of the data of interest prior to making assumptions as to the appropriate statistical descriptor. Rainfall data for the period from 1895 to 2010 (Table 3-1; Figure 3-6) were evaluated as to their approximation to a normal distribution. The mean rainfall during the period was inches per year (s.d. = 6.575) with a minimum of inches in
75 TABLE 3-1 ANNUAL RAINFALL RECORDS FROM TEXAS CLIMATE DIVISION 6 Year Annual Rainfall (inches) Year Annual Rainfall (inches) Year Annual Rainfall (inches) SOURCE: The distribution of this data was assessed using Microsoft Excel 2010 and the SYSTAT 11 statistical software package. The annual rainfall data was compared with a number of statistical 3-16
76 Frequency distributions but fit best with and were not significantly different from a normal distribution. (See Figure 3-6) Rainfall (Inches) Figure 3-6. Division 6 Rainfall Frequency Distribution Division 6 Annual Rainfall Normal Distribution Because the 1956 drought of record was the result of a multi-year sequence of drier than average years, the rainfall data set was also examined by calculating three, five, seven, and ten-year running averages. (Figures 3-7 through 3-10). Each of these sequences was also normally distributed. With this analysis, it was not possible to identify which sequence (three, five, seven, or ten-year would be the best descriptor of what occurred in the drought of record, therefore all of the sequences were evaluated. While the rainfall in 1956 was the lowest annual total for the entire period (11.22 inches), it does not stand out significantly from other years. (See Figure 3-6). However, the three, five, seven, and ten year sequences ending in 1956 each are distinguishable in the period, particularly the five and seven-year sequences. 3-17
77 Rainfall (in) Rainfall (in) 50 Division 6 Rainfall Rainfall Year Figure 3-7. Three-year moving average rainfall Division 6 Rainfall Rainfall Year Figure 3-8. Five-year moving average rainfall
78 Rainfall (in) Rainfall (in) 50 Division 6 Rainfall Rainfall Year Figure 3-9. Seven-year moving average rainfall Division 6 Rainfall Rainfall Year Figure Ten-year moving average rainfall
79 From the normal distributions for each of these sequences (from the individual yearly totals and the three, five, seven, and ten year totals), the cumulative probabilities for the drought of record were calculated based on the normal distributions (Table 3-2). TABLE 3-2 PROBABILITY OF DROUGHT OF RECORD BASED ON ANNUAL RAINFALL TOTALS Number of Years in Drought Sequence Mean for drought of record (inches) Calculated Cumulative Probability* P(rainfall< drought of record) *Calculated from rainfall data. From this it can be inferred that if the overall climatic regime during the past eleven years were to continue into the near term future, the probabilities of a recurrence of a year as dry as 1956 is approximately 1.6 percent in any given year. The probabilities of three- or five-year periods as dry as the drought of record are approximately 0.2 percent, and the probabilities of seven- or ten-year periods as dry as the drought of record are 0.1 percent or less. (Table 3-3). TABLE 3-3 CALCULATED AND MODELED PROBABILITY OF RECURRENCE OF DROUGHT OF RECORD Number of Years in Drought Sequence Mean for drought of record (inches) Calculated Cumulative Probability* P(rainfall< drought of record) Monte Carlo Modeled Cumulative Probability for Future Periods** 8 Year 15 Years ( ) ( ) Years ( ) *Calculated from rainfall data. **Based on 1,000 iterations Effects of the Drought of Record on Comal Springs The severity of the drought of 1956 and its impact on water levels at Landa Lake are unique in the hydrologic record for central Texas. The most critical period of low flow at Comal Springs was during the summer months of 1956, when the springs ceased artesian flow. Landa Lake 3-20
80 went from being full in early June, to being dry in August of that year. A description of what occurs at Comal Springs when water levels drop has been previously described, (LBG-Guyton Associates 2004), and is summarized below. Spring runs #1 and #2 stop flowing at Landa Park well water elevation of 622 feet above median sea level (ft-msl), when total Comal Springs flow is about 130 cfs. Spring run #3 stops flowing at Landa Park well water level of 620 feet MSL, which is also the current lake level, as controlled by the dam. Total Comal Springs flow at this point is about 50 cfs. Spring runs #1 and #2 went dry during the summer of 1953 and from the summer of 1954 until January 1957, and spring run #3 stopped flowing during the summer of 1955, and also from May until December Although flow stops from spring runs #1, #2, and #3 at a Landa Park well level of 620 ft- MSL, there was still flow out of Landa Lake due to spring discharge from the other spring runs into the lake itself. When the water elevation at the Landa Park well declined to about 619 ft- MSL, total spring discharge went to zero. During 1956, spring discharge was zero for 144 consecutive days, from June 13 to November 3. At this point, flow stopped at the New Channel dam, but water was still able to flow though the culvert to the Old Channel. Below a Landa Park well elevation of approximately 618 ft-msl, the elevation of the lake bottom immediately upstream of the culvert prevented flow from reaching the Old Channel culvert. Spring discharge could presumably still occur at water levels as low as the lowest lake-bottom elevation of 613 ft- MSL. However, for such discharge to occur, an outlet at that elevation would need to be constructed that would discharge to a location (such as Old Channel) at a lower elevation. Large parts of the lake bottom emerged at a lake elevation of 618 ft-msl. The north end of the lake, north of Spring Island, also emerged at about 618 ft. Although there were some deeper pools at the north end, flow from north to south was probably interrupted. Figures 3-11a and 3-11b are photographs of the southern end of Landa Lake that were taken sometime in the summer of The water level in the individual pools within the lake appeared to be about ft-msl. The lowest level of Landa Park well ( ft-msl) was reached August 21, The deepest pool, just south of Spring Island had a bottom elevation of 613 ft-msl, and newspaper clippings indicate that there may have been 6 inches of water left in the deep pools Effects of the Drought of Record on San Marcos Springs A description of what occurs at San Marcos Springs when water levels drop has been previously described (LBG-Guyton Associates 2004) and is summarized below. San Marcos Springs is at the end of a flow system for the Aquifer that includes most of the outcrop, streams, and the Blanco River in Hays County. The springs receive recharge from this area, and they often exhibit a rapid flow response to storm events in this region. San Marcos Springs also appears to receive a regional base flow of about 50 to 100 cfs that bypasses discharge at Comal Springs. Although San Marcos Springs did not go dry during the drought of record in the summer of 1956, spring discharge declined to 47 cfs. Seasonal water level rises and increased flows in the artesian section of the Aquifer (San Antonio pool), however, do not 3-21
81 3-22
82 always result in increases in discharge at San Marcos Springs. The increased flow is in large part captured as increased discharge at Comal Springs. All of the spring discharge at San Marcos is through spring complexes in the bottom of Spring Lake. There are few, if any, 3-23
83 subaerial springs, as occur at Comal Springs. Although some of the springs have distinct orifices where discharge can be measured, most of the spring discharge appears to be through rock rubble or sand boils in large flat sand plain areas. The southern springs appear to discharge groundwater from the regional flow system, while the northern springs receive their discharge from the more localized recharge zone in Hays County. Discharge rates in the southern springs would be expected to be far more stable under varying flow conditions than the northern springs, which should be more variable in proportion to total spring discharge values Effect of Drought on Hueco Springs Following Barr (1993), only recent drought and springflow data are presented here. The larger of the two springs, Hueco I, typically exhibits constant flow but has been documented to stop flowing during severe droughts (Ogden et al. 1986), such as in However, Hueco I did not stop flowing during the drought occurring in Hueco II is an intermittent spring that typically stops flowing during the driest months of the year. (Barr 1993). The Applicants do not own or have jurisdiction over these springs or the surrounding ecosystems Effect of Drought on Fern Bank Springs No long-term data exist for this site; however, a single-family owned the spring site from the late 1800s until In 2008, the landowner claimed that the spring never ceased flowing during that time, including the drought of the 1950s. The Applicants do not own or have jurisdiction over these springs or the surrounding ecosystems. 3.2 Aquifer-fed Springs Texas originally had 281 known major non-saline springs, and, of those, only four were defined as first-magnitude springs, having a flow of over 100 cfs. These four consist of Comal Springs, San Marcos Springs, Goodenough Springs, and San Felipe Springs. Goodenough and San Felipe springs are located in Val Verde County, west of the Edwards Balcones Fault Zone Aquifer, and Goodenough has since been inundated by the impoundment of Amistad International Reservoir. (Brune 1975). Comal and San Marcos springs remain the largest springs in Texas, and flow from these springs is supplied principally by the Aquifer. Other spring outlets of the Aquifer within the jurisdiction of the EAA include Leona Springs, San Pedro Springs, San Antonio Springs, Hueco Springs, and Fern Bank Springs. (See Figure 3-12). Total annual discharge from the six most significant springs shown in Table 3-4 during the period of record 1934 to 2009 has varied from 69,800 ac-ft in 1956 to 802,800 ac-ft in 1992 with an average annual discharge of 385,700 ac-ft. (EAA, 2010b). 3-24

84 3-25
85 TABLE 3-4 ESTIMATED SPRING DISCHARGE FROM THE EDWARDS AQUIFER, 2009 (acre-feet) Leona Springs and Leona River Underflow San Pedro Springs San Antonio Springs San Marcos Springs Total Monthly Discharge from springs Comal Hueco Month Springs Springs January 1, , ,000 26,830 February 1, , ,480 23,016 March 1, , ,140 24,937 April 1, , ,680 23,399 May , ,680 21,178 June , ,340 17,934 July , ,420 16,161 August , ,330 16,305 September ,610 1,880 5,550 19,514 October ,390 5,200 9,080 31,393 November ,590 4,130 10,670 33,287 December ,180 2,590 11,280 34,020 TOTAL 10,534 1, ,020 16,728 81, ,975 Data sources: EAA 2010b; Differences in totals may occur as a result of rounding Comal Springs Located in the City of New Braunfels in Comal County, Comal Springs is the largest natural spring system in the state and is the source of baseflow to the Comal River. At 623 feet above sea level, Comal Springs is one of the lowest elevation springs fed by the Aquifer. The springs discharge from four major orifices and numerous smaller discharge points, which flow into Landa Lake. (Abbott and Woodruff 1986; see Figure 3-12). Individual springs and/or spring runs have ceased flowing during recorded history, with the most recent event in The only time in recorded history that the cessation of spring discharge stopped the flow of the Comal River was during the drought of record, in 1956, for 144 days from June 13 to November 4 of that year (USFWS 1996; Longley 1995). The record high flow for Comal Springs is 1,059 ac-ft per day (534 cfs) in 1973, while the historical average flow for the period 1934 to 2010 was 291 cfs. (EAA, 2010b). Water discharging from Comal Springs has been recharged from numerous areas upgradient in the Aquifer recharge and contributing zones. Longer, regional scale flowpaths primarily originate in Bexar and Medina counties, while short, localized groundwater contributions to springflow occur in Comal County. Different spring orifices in the Comal Spring system reflect water originating from different flowpaths. For instance, Spring Runs 1, 2, and 3 have been shown to have a larger contribution from localized, shallow flowpaths while spring orifice number 7 reflects water emerging from deeper, more regional flowpaths. This has been 3-26
86 documented through a series of dye tracer tests at Comal Springs conducted by the EAA from the period of (EAA 2010a) San Marcos Springs San Marcos Springs, located in the city of San Marcos in Hays County, and very near the base of the Balcones Escarpment, is the second largest spring system in the state and is the source of baseflow to the San Marcos River. (Figure 3-12). San Marcos Springs, at 574 feet MSL, exhibit the lowest elevation of the major springs in the San Antonio segment of the Aquifer. Much of the water flows from six major and several minor orifices at the bottom of Spring Lake. The water in San Marcos Springs averages approximately 72F with slight seasonal variations. Because San Marcos Springs is lower in elevation than Comal Springs and is further down the pathway of the flow of water within the confined artesian Aquifer zone, discharge at Comal Springs appears to dampen effects at San Marcos Springs. Although Comal Springs went dry for approximately 144 days from June through November 1956 (South Central Texas Water Advisory Committee 2000), such an event has never occurred at San Marcos Springs. The springs did reach a recorded low discharge of 91 acre-feet per day (47 cfs) in The record high daily flow for San Marcos Springs was 627 acre-feet per day (316 cfs) in 1975 (Brune 1981), while the historical average flow from 1957 to 2009 was 175 cfs (EAA, 2010b). Local stream recharge from the Blanco and Guadalupe rivers and Sink, Purgatory, York, Dry Comal and Alligator Creeks contributes to San Marcos Springs as they cross the Recharge Zone. (Brune 1981). San Marcos Springs are also supplied by regional underflow past the Comal Springs area. (Guyton et al. 1979) Other Springs Hueco, Fern Bank, San Antonio, San Pedro, and Leona are lesser spring outlets for the Aquifer. (See Figure 3-12). These springs generally have declining or erratic flow due to their high elevation, seasonal fluctuations during dry years, and increased pumping from the Aquifer and other underlying aquifers. Hueco Springs, in Comal County, are located three miles north of New Braunfels near the junction of Elm Creek and the Guadalupe River on private property. It is the seventh-largest spring in Texas, and includes two main groups of springs, one on each side of River Road. These springs flow from the Hueco Springs fault, which is a major structural feature within the Aquifer with an offset of approximately 400 feet. (Guyton and Associates, 1979). The springs consist of two orifices at a high elevation (approximately 658 feet above sea level), and therefore have variable flow and often go dry or have long periods of low flow during drought (Abbott and Woodruff 1986). The maximum discharge for Hueco Springs was 260 ac-ft per day (131 cfs) in 1968 (Brune 1975) and has averaged about 70 acre-feet per day. Hueco Springs recharge has both local and regional components originating from the nearby Dry Comal Creek and Guadalupe River basins and from longer flowpaths from San Antonio. (Otero 2007; see Figure 3-13). Hueco Springs was documented with elevated nitrate levels (> 5 parts per million) 3-27
87 during the drought of the 1950s, but values have been below 2 ppm. One measurement was just above 2 ppm in 2000 since that time (Johnson et al. 2009). Figure Major Faults and Interpreted Groundwater Flowpaths to Comal and Hueco Springs from Otero (2007) Fern Bank Springs, also referred to by Brune (1981) as Little Arkansas or Krueger Springs, are about five miles east of the City of Wimberley on the south bank of the Blanco River in Hays 3-28
88 County. The primary spring emerges from a cave that has been surveyed to a length of 130 meters and is relatively flat, with enough gradient to allow water to flow the entire length and then drain out the entrance. (See Figure 3-14). The spring (cave entrance) is located at the base of an approximately sixty-meter escarpment, which is the geomorphic expression of the Hidden Valley fault. This is a major fault in the Balcones fault zone which juxtaposes the older Upper Glen Rose limestone on the northwest side (upthrown) of the fault to the lower members of the Kainer Formation on the southeast side (downthrown). Figure Cave Map of Fern Bank Springs The cave passage extends southeast along a bearing that is normal (perpendicular) to that of the strike of the fault, and appears to have developed along a bedding plane near the contact of the Upper Glen Rose and Basal-Nodular member of the Kainer Formation (Edwards Group). (See Figure 3-15). It appears that the spring waters are sourced from the Edwards limestone located in this portion of Hays County. Here the Kainer Formation (lower formation in the Edwards Group) is relatively thin and unconfined. Recent dye traces to Fern Bank Springs confirm that groundwater recharged south of the Blanco River in the Kainer Formation feed the spring (Johnson et al. 2009). There is a significant topographic high between the spring (approximately 800 ft-msl) and San Marcos Springs to the southeast (573 ft-msl). While the source of the water for Fern Bank Springs is undetermined (USFWS 2007), it may originate from the upper member of the Glen Rose Formation, from drainage from the Aquifer recharge zone, from water lost from the Blanco River, or from some combination of those sources. 3-29
89 (USFWS 2007). Springflow was documented to vary between five cfs in 1975 to less than one cfs in (Brune 1981). A single family owned the spring site from the late 1800 s until In Figure Local geologic map showing the plotted location of Fern Bank Springs cave and Edwards (Kainer Formation) limestone outcrop near the Blanco River 2008, the landowner claimed that the spring never ceased flowing during that time, including the drought of the 1950s. San Antonio Springs, originally a complex of over 100 springs (Brune 1981), are located principally on property of the University of the Incarnate Word and near Brackenridge Park within north central San Antonio. Most of the springs are at an elevation of about 672 ft-msl. The largest spring is called Head of the River or Blue Hole, reflecting that it is the head of the San Antonio River. 3-30
90 San Pedro Springs, in Bexar County, are located in San Pedro Park in San Antonio at 663 ft- MSL. Both San Antonio and San Pedro springs are recharged by waters over 62 miles to the west where the Frio, Sabinal, and Medina rivers and Hondo and Leon Creeks cross the Balcones Fault Zone. Both of these springs were very important to the early development of San Antonio, providing water to ancient Payayan Indian settlements, and to Spanish missions established during the early 1700s including the San Antonio de Valero Mission (the Alamo) founded in Water from these springs is discharged from faults in the Austin Chalk formation. Leona Springs are found in four groupings along or beneath the surface of the Leona River in Uvalde County. Leona Springs, 860 ft-msl, are recharged by the Nueces River and other streams to the northwest. (Brune 1981). These springs were an attractive stop on the Old Spanish Trail and were described as the purest streams of crystal water (Brune 1975). Water quality testing of the springs between 1976 and 1985 by USGS detected pesticide compounds, but no occurrences exceeded the maximum contaminant levels for drinking water. (USGS 1987). 3.3 Edwards (Balcones Fault Zone) Aquifer This section provides a general description of the hydrological boundaries of the Aquifer, hydrological zones, and hydraulic properties. The Aquifer, referred to as the Edwards Balcones Fault Zone Aquifer by the TWDB (2006a), is one of nine major aquifers in Texas and covers approximately 4,350 square miles across parts of eleven Texas counties. The Aquifer has focused recharge zones, enhanced secondary porosity, and excellent geochemical water quality conditions. These factors make the Aquifer one of the most productive groundwater reservoirs in the country (Sharp and Banner 1997). The Aquifer is the primary source of water for a large portion of central Texas, almost 2 million people. (EAA, 2010b; U.S. Census Bureau 2010). It supports cities, towns, rural communities, farms, and ranches. The water is used for a range of purposes, including municipal, industrial, or manufacturing, steam electric, irrigation, mining, livestock, and recreation. The Aquifer also supports several major springs which provide habitat for a number of endangered and threatened species. The Aquifer extends from a groundwater divide in Kinney County through the City of San Antonio northeast to Bell County. Within this area, the Aquifer is comprised of three segments: the southern (San Antonio) segment; the Barton Springs (Austin) segment; and the northern segment. Historical hydro-geological data supports the presence of a groundwater divide running west-northwest from the City of Kyle in Hays County, that under normal conditions hydrologically separates the San Antonio and Austin (Barton Springs) segments. At this location, under most conditions, groundwater from the San Antonio and Austin segments do not mix. Generally, groundwater north of the divide flows north, while groundwater south of the divide flows south. This groundwater divide may be diminished substantially during drought conditions. A recent study (HDR 2010) suggests that as water levels in the Aquifer decline during major droughts and current levels of pumping, this groundwater divide diminishes, allowing the potential for some groundwater to bypass San Marcos Springs and flow north into 3-31
91 the Barton Springs Segment of the Aquifer toward Barton Springs. The third segment of the Aquifer which is known as the northern segment is hydrologically separated from the Barton Springs Segment by the Colorado River. The focus of this groundwater discussion will be on the San Antonio segment of the Aquifer. The San Antonio segment of the Edwards Aquifer is approximately 180 miles long stretching from the city of Brackettville in Kinney County to north of Kyle, in Hays County, Texas. (See Figure 3-16). It varies in width from 5 to 40 miles. This segment of the Aquifer extends through all or part of eleven counties: Zavata, Frio, Atasco, Guadalupe, Kinney, Uvalde, Medina, Bexar, Comal, Caldwell, and Hays. As described in Section the Aquifer lies under several streams in three major river basins, the Nueces, the San Antonio, and the Guadalupe. The San Antonio segment of the Aquifer holds water that drains from approximately 8,000 square miles in some 12 counties in the contributing and recharge zone. The water-bearing body of the Aquifer itself underlies approximately 3,600 square miles in eight counties. The total volume of circulating freshwater in the Aquifer is estimated at 173 million acre-feet (Bureau of Economic Geology 1995), making it one of the most productive aquifers in the United States, although the amount of recoverable groundwater is not known. The Aquifer, which historically has been the sole source of water for the city of San Antonio (USGS 1995; EAA, 2001), provides base flow to the three river basins mentioned above (USGS 1999). Since 1968, annual discharge from springflow and pumping has frequently exceeded average annual recharge. However, the hydrograph of the J-17 Index Well does not show a declining trend in the level of the Aquifer. The Aquifer is considered a karst aquifer. Flow in the Aquifer is very complex (USGS 1995) and is typical of other karst aquifers, occurring over a wide range of hydraulic conductivity, from flow through the rock matrix (least conductive), flow in planar fractures and bedding planes to turbulent flow through integrated conduit systems (most conductive). In general, most storage occurs in the matrix, while most flow occurs in the fractures/faults and conduits. Matrix and conduit components may or may not mix effectively. Thus, groundwater in some components of the Aquifer may have very long residence times and be relatively resistant to surface contamination, while other components of the Aquifer may have extremely rapid travel times and be very vulnerable to contamination. The vulnerable parts of the Aquifer are also the most productive, feeding major springs and wells. In addition to the variability of flow velocities, flow directions are also variable in karst aquifers. Flow directions are influenced by both regional and local hydraulic gradients, but they are also 3-32
92 3-33
93 controlled by the location and orientation of conduit systems. Karst aquifers may be influenced by development and changes in geologic formations that occurred under previous water flow regimes, thus flow paths may not follow local topography or surface watersheds. It is common for flow in karst aquifers to cross watershed boundaries, which are typically considered as groundwater divides in other types of aquifers. Furthermore, the pattern and direction of flow in karst is often water-level dependent, as high water levels can utilize older flow paths and travel in non-linear directions using conduits formed under older groundwater regimes, which may differ from modern ones. Generally, the water flows south-southeastward from the recharge zone along low permeabilities and steep hydraulic gradients within the unconfined portion of the Aquifer. As the water flows into the confined portion of the Aquifer, the flow direction changes toward the east and northeast within the low gradient, highly permeable artesian zone. The water is then discharged from several springs, predominantly Comal and San Marcos springs (Section 3.2.1). Although the Aquifer contains vast reserves of water, a large volume of water cannot be extracted without affecting springflow and the overall water budget. This is because the springs are higher in elevation than much of the confined artesian zone. This relationship is similar to a bucket of water with holes at the top that are analogous to the spring locations. Although water is available in the lower portions of the bucket, it cannot be extracted without affecting the flow of water through the holes (springs) at the higher levels. The water budget of the Aquifer (recharge, discharge, and springflow) is discussed in Section The San Antonio segment of the Aquifer consists of a recharge zone and artesian zone. (See Figure 1-1). Each of these components is described below. The Aquifer is also affected by a contributing zone. Development over the contributing and recharge zones of the Aquifer is regulated under rules established by the TCEQ Edwards Aquifer Protection Program (2010). Section below provides an overview of these regulations. Contributing Zone The contributing zone is composed of drainage areas and catchments of surface streams upstream of the recharge zone that subsequently flow over the recharge zone. Much of the contributing zone lies over the older Glen Rose Formation, upthrust by the Balcones faulting. In the upthrown fault blocks, the Edwards Group rocks have been eroded away and are not present. Here, the Upper Glen Rose is exposed, and is classified as being the contributing zone to the Aquifer. The Contributing Zone of the San Antonio segment of the Aquifer is a surface component not technically part of the Aquifer that consists mainly of the drainage areas and catchments of surface streams, creeks, and rivers that subsequently flow over the Aquifer s recharge zone in the Nueces, San Antonio, and Guadalupe River Basins. The contributing zone encompasses some 5,400 square miles in all or part of Edwards, Real, Kerr, Bandera, Kendall, Gillespie, Blanco, Bexar, Comal, Hays, Kinney, Uvalde and Medina Counties. (See Figure 1-1). This area is important because of its substantial contribution to Aquifer recharge. Future development in the contributing zone will affect the quality and quantity of water draining to the recharge zone of the Aquifer. 3-34
94 Recharge Zone The recharge zone (also known as the unconfined zone) of the Aquifer is an approximately 1,250-square mile area where heavily faulted and fractured Edwards limestone outcrops at the land surface, allowing large quantities of water to flow into the Aquifer. The recharge zone stretches as a band from the area north and west of San Marcos and New Braunfels and extends southwesterly to the north of San Antonio, then westerly through the northern portions of Bexar, Medina, Uvalde and Kinney Counties. Recharge occurs when streams and rivers cross the permeable formation and a portion of their flow seeps underground, or when precipitation or runoff falls directly on the outcrop. Water flows are driven by gravity to discharge at water-table springs, to enter deeper flow systems and discharge at artesian springs, or to recharge the confined zone of the Aquifer. Surface water reservoirs on the recharge zone, such as Medina Lake, also contribute large amounts of water to the Aquifer. Except for the Guadalupe River, all rivers and streams that cross the outcrop of the Aquifer lose major portions of their flows to the Aquifer through joints, faults, and sink holes and other karst features (USGS 1995). Where the Guadalupe River crosses the recharge zone it may either gain or lose water from the Aquifer, depending on Aquifer levels. This is due to water levels in the river being near the groundwater table, whereas other creeks and streams are generally at significantly higher elevations. There are three river basins that cross the Aquifer area: the Nueces, the San Antonio, and the Guadalupe River. Extending from the west, the Nueces River Basin covers over half of the Aquifer area. Several major tributaries in the Nueces basin traverse the Aquifer Recharge Zone including the Nueces, West Nueces, Frio, Dry Frio, and Sabinal rivers, as well as Hondo Creek. The portion of the San Antonio River Basin that is located in the recharge zone extends from the Medina River to Cibolo Creek and includes the headwaters of Leon and Salado Creeks. Only a small portion of the Guadalupe River Basin intersects the eastern Aquifer area. However, two of the basin tributaries, the Comal and San Marcos rivers, are primarily fed by the Aquifer at the Comal and San Marcos springs. Under normal conditions most of the Aquifer recharge occurs in the basins west of Bexar County (USGS 1995), where the Edwards limestone outcrop is very wide at the surface. In the recharge zone, there are no other geologic formations overlying the Edwards limestone. It is therefore exposed at the surface. Periods of recharge are intermittent as most streams in south-central Texas are ephemeral; however, the recharge capacity of surface water into the Aquifer is extremely efficient due to the karstic nature of the system. Water passing over the contributing zone and into faults, fractures, and swallets of the recharge zone is rapidly transferred directly to the Aquifer with little or no filtration. The geologic mechanisms that form karst are complex, and many factors affect how karst is expressed in current settings. These factors control the way the groundwater system evolves, and ultimately how groundwater is recharged, transmitted, and naturally discharged through the Aquifer system. 3-35
95 Artesian Zone The artesian zone (also known as the confined zone of the Aquifer) is located between two relatively impermeable formations, the Glen Rose formation below, and the Del Rio clay above (Ferrill et al. 2004). The weight of water entering the Aquifer from the recharge zone creates tremendous pressure on water that is already present in the formation. Flowing artesian wells and springs exist where this pressure is sufficient to force water to the surface along faults or through wells. This zone is where the highest capacity wells and largest springs exist. (Collins and Hovorka 1997). Examples of natural springs under artesian conditions are San Marcos and Comal springs in the northeast. Groundwater movement through the Aquifer is generally controlled by a number of barrier faults that disrupt the continuity of the permeable Edwards limestone. This movement tends to be from the higher elevations in the west to discharge areas in the east. The displacement of strata ranges from very large, which causes permeable and impermeable layers to be juxtaposed, to very small. Water moves more freely through the Aquifer when displacement is minimal. Additionally, groundwater divides exist in the west near Brackettville and in the east near Kyle, so the central portion of the Aquifer is hydrogeologically separated from Edwards limestones on either side. (See Figure 3-16). Transition Zone The transition zone consists primarily of younger bedrock overlying the artesian zone of the Edwards Group that has been down thrust to the east in the Balcones Fault Zone. These younger and generally less permeable rocks of the transition zone overlie and form the upper confining units to the artesian zone of the Aquifer. While the surface bedrock in the transition zone is generally less permeable and karstified than the rocks of the Edwards Group, it was also extensively fractured and faulted by the Balcones Fault Zone, and hosts some highpermeability pathways into the artesian zone. An exception is the Austin Chalk formation, which is well karstified in some areas and hosts significant springs that discharge Aquifer water, such as San Antonio and San Pedro springs. (Veni and Heizler 2009). Contributing Zone within Transition Zone The area or watershed where runoff from precipitation flows down-gradient to the recharge zone of the Aquifer is considered contributing zone within transition zone. The contributing zone within the transition zone is located generally south and east of the recharge zone and includes specifically those areas where stratigraphic units not included in the Edwards Aquifer crop out at topographically higher elevations and drain to streams courses where stratigraphic units of the Edwards Aquifer crop out and are mapped as recharge zone. Hydraulic Properties Aquifer transmissivity (the ability of water to pass through the Aquifer, as measured by hydraulic conductivity and thickness) is high. According to Maclay and Small (1986), transmissivity of the Aquifer in the San Antonio area varies from one to two million square feet per day, allowing some wells in the city of San Antonio to discharge as much as 10,000 gpm or more (USGS 1995). One particular well was documented by the EAA to produce between 25,000 and 36,
96 gpm. Highest transmissivity was determined to exceed 4,300,000 square feet per day in Comal County near Comal Springs; the smallest was 130 square feet per day in the saline water zone (Maclay and Land 1988). Linear distance at which water may move through the Aquifer appears to vary greatly, depending on location. Ogden et al. (1986) documented travel from up to 1,000 feet per day to only a few feet per day. Recent tracer tests conducted by the EAA revealed discrete groundwater flowpaths near Panther Springs Creek with apparent (point-to-point) groundwater velocities ranging from 43 to 17,490 feet per day from the Recharge Zone to the transition/artesian Zone of the Aquifer. (EAA 2010a). Other evidence of high porosity of the Aquifer is the ability of Aquifer water levels to quickly respond to rainfall and recharge events and rapid decline of water levels over a large area due to increased pumpage. The Knippa Gap near Sabinal in eastern Uvalde County (see Figure 1-1) is a major controller of groundwater flow within the western portion of the Aquifer. The Knippa Gap is a geological restriction within the Aquifer that allows substantial flow of groundwater from west to east but restricts flow enough to maintain higher groundwater levels in the Uvalde pool than in the San Antonio pool. (Green et al. 2008). Wells to the west of the Knippa Gap display much less variability in water levels than wells to the east. Water entering the recharge zone in northwestern Uvalde County appears to flow through the gap to reach the main freshwater zones of the Aquifer in Medina and Bexar Counties. Flow models for the Aquifer show groundwater flowing from Uvalde and Medina Counties eastnortheast eventually discharging at Comal, Hueco, and San Marcos springs, numerous small springs, or extracted by groundwater pumping from wells. (Kuniansky et al. 2001). However, recent tracer studies in northern Bexar County performed by the EAA indicate water flowing from north to south with very rapid flow velocities. (Johnson et al. 2009). These observations indicate that flow paths may be more complex than originally thought, and rapid groundwater transport is dominated by karstic conduit flow. Freshwater/Saline Water Interface The freshwater/saline water interface (also known as the Bad Water Line or BWL) delineates the Edwards Aquifer s eastern and southern boundaries. It is not an actual, well-defined boundary but rather a transition zone on the southern and eastern limits of the Aquifer extending from west of Kinney County through Bexar County and northward beyond the northern extent of the San Antonio region of the Aquifer. Wells to the south and southeast of this line typically display total dissolved solids (TDS) concentrations of greater than 1,000 mg/l. Wells on the other side of this line typically have TDS concentrations of equal to or less than 1,000 mg/l. The reason the bad-water line exists is not clear; in some places it is coincident with geologic features such as faults, in other places there is no obvious geologic control. The presence of bad or more saline water appears to be more associated with relative permeabilities of the Aquifer rather than a density boundary between two different water types, which commonly exists in coastal sand aquifers. Wells in the transition zone have shown sections of brackish water that overlie freshwater, which in turn overlie brackish water, indicating that the type of rock and porosity influences the salinity of the water. 3-37
97 It has been hypothesized that increased pumping of freshwater from the Aquifer may lead to an expansion of the bad-water zone, which could be detrimental to existing irrigation and municipal wells. In 1985, the EAA, in cooperation with USGS, TWDB, and SAWS began testing in the fresh/saline interface area for possible saline-water encroachment into the freshwater zone. In 1997, the EAA reported that there were no significant changes in water quality in the test wells between 1985 and 1997 and that normal changes in Aquifer water levels have little effect on the quality of freshwater near the interface Inter-formational flow into the Edwards Aquifer The Edwards Aquifer receives most of its recharge directly where the limestone of the Person and Kainer Formations outcrop. However, a significant component of groundwater flow enters the Aquifer directly as inter-formational flow from the Trinity Aquifer. The recent Groundwater Availability Model for the Hill Country Portion of the Trinity Aquifer indicates that as much as 2400 acre/feet per year for each linear mile of Edwards-Trinity boundary in Bexar and Comal Counties (Jones 2011) exits the southern boundary of the GAM, indicating possible interformational flow from the Trinity aquifer in the Aquifer. This value is lower to the west in Medina and Uvalde Counties (660 ac-ft/yr/mi), and lowest further east in Hays and Travis Counties (350 ac-ft/yr/mi). Green (2011) has also demonstrated that losing streams in the contributing zone (Upper Glen Rose outcrop) are much more connected with the Edwards Aquifer than previously thought. In the Barton Springs Segment of the Edwards Aquifer, it has been shown that the Upper Glen Rose is in close hydraulic connection with the Edwards Aquifer, as documented by monitoring sophisticated multi-port wells. (Smith and Hunt, 2011). Dye tracer studies in northern Bexar County also indicate that very prolific connection between the two aquifers exists, and have documented rapid groundwater flow across faults that juxtapose the Edwards and Trinity Aquifers Groundwater Quality of the Edwards Aquifer Rules Governing Groundwater Quality Regulations governing the quality of groundwater in Texas have interrelated state and federal regulatory functions. In 1974, the Federal Safe Drinking Water Act was passed to protect sources of public drinking water. This Act, amended in 1996, mandated enforceable drinking water standards established by the EPA. The TCEQ has assumed responsibility for enforcement of drinking water standards in Texas and has established standards equally strict or more strict than the EPA. The Edwards Aquifer was designated as a sole source aquifer and TCEQ promulgated rules regulating development activity over zones of the Aquifer in eight counties pursuant to 30 Texas Administrative Code, Chapter 213. The counties include: Kinney, Uvalde, Medina, Bexar, Comal, Hays, Travis, and Williamson. Subchapter A applies to all regulated activities (defined as construction-related or post-construction activity) within the recharge zone, to certain activities within the surrounding transition zone that stretches along the eastern and southern boundary of the recharge zone, and to other activities that may potentially contaminate the Aquifer and hydrologically connected surface streams. Under these rules, developers must submit an application including an Aquifer protection plan to the TCEQ 3-38
98 prior to certain types of activity in the recharge, transition, or contributing zones of the Aquifer. For proposed development including any regulated construction-related activity over the Recharge Zone, a water pollution abatement plan (WPAP) is required. The WPAP must include a geological assessment report identifying pathways for movement of contaminants to the Aquifer, and a report on best management practices and measures to prevent pollution of the Aquifer. After the plan is approved, notice must also be filed in the county deed records that the property is subject to an approved Aquifer protection plan. Certain facilities are also prohibited from being built in the recharge or transition zones such as Type 1 municipal solid waste landfills and waste disposal wells. Subchapter B applies to regulated activities in the Aquifer s contributing zone. All activities that disturb the ground or alter a site s topographic, geologic, or existing recharge characteristics are subject to regulation, which would require either sediment and erosion controls or a contributing zone plan (CZP) to protect water quality during and after construction. Exemptions include construction of single-family residences on lots larger than five acres, where no more than one single-family residence is located on each lot; agricultural activities; oil and gas exploration, development, and production under the jurisdiction of the Texas Railroad Commission; clearing of vegetation without soil disturbance; and maintenance of existing structures not involving additional site disturbance. 30 TAC (6). The EAA has implemented a water quality protection program through rulemaking. Well construction rules have been adopted that regulate the construction, operation, maintenance, abandonment, and closure of wells. (See EAA Rules Chapter 713 (Water Quality), Subchapters B General Provisions), C (Well construction, Operation and Maintenance), and D (Well Closures). The EAA also regulates the reporting of spills (Subchapter E), storage of certain regulated substances (Subchapter F) on the recharge zone and the contributing zone of the Aquifer and the installation of tanks on the recharge zone of the Aquifer (Subchapter G)). The City of San Marcos has also enacted regulations to protect water quality over the Aquifer recharge zone. Primary Drinking Water Standards These standards are enforceable for public water supply systems and are often referred to as maximum contaminant levels (MCLs) or primary drinking water standards. The MCL for a contaminant is the maximum permissible level in water that is delivered to any user of a public water system. MCLs protect drinking water quality by limiting levels of specific contaminants that can adversely affect public health and are known or anticipated to occur in public water systems. The primary standards are based on concentrations published in Title 30 of the Texas Administrative Code, Chapter 290, Subchapter, and Chapter 350. This concentration is the value estimated to be protective of human health and the environment. Secondary Drinking Water Standards These standards are non-enforceable and are set for contaminants that may affect aesthetic qualities of drinking water, such as odor or appearance. 3-39
99 Current Status The groundwater of the Aquifer has historically been considered to be of high quality, typically fresh, but hard with an average dissolved solid concentration of less than 500 mg/l (Texas Water Commission [TWC] 1992). Cooperative efforts between the EAA, USGS, and TWDB have resulted in a systematic program of water data collection. Each year the EAA monitors the quality of water in the Aquifer by sampling approximately 80 wells, eight surface water sites, and major spring groups across the region. Sample collection sites are typically selected to provide representative samples of the recharge zone, shallow and deep artesian zone, springs, and surface streams that flow across the recharge zone as well as areas with historical detection of anthropogenic compounds. Tests for the wells included measurements of temperature, ph, conductivity, alkalinity, major ions, minor elements (including heavy metals), total dissolved solids, nutrients, pesticides, herbicides, Volatile Organic Compounds (VOCs), and other analytes. Results of the EAA s water quality testing program during 2009 (EAA 2010a) are summarized below: Metals Of 79 wells sampled for metals, laboratory analyses did not indicate the presence of any metals regulated under the primary drinking-water standards at concentrations exceeding their respective MCL. However, the metal strontium, regulated under the Texas Risk Reduction Program (TRRP), was detected above the TRRP limit, or Protective Concentration Levels (PCL) in one Medina County well near the saline water zone. The PCL for strontium is 15,000 μg/l. In addition, the metals iron and manganese were detected in several wells above their secondary drinking water standards of 300 μg/l and 50 μg/l, respectively. Iron was detected in wells in Medina and Hays Counties, while manganese was detected in Medina County near the saline water zone. Bacteria A total of 74 wells were sampled in 2009 for the presence of fecal streptococcus and fecal coliform bacteria presence as colony forming units (CFU) per 100 milliliters of water (CFU/100 ml). Most well bacterial results were less than two CFU/100 ml in concentration. However, the fecal coliform bacteria results from 12 wells were at or above two CFU/100 ml. In addition, fecal streptococcus bacteria were detected in three wells at two, three, and six CFU/100 ml for fecal streptococcus. Fecal coliform and fecal streptococcus bacteria are used to indicate the possible presence of fecal matter in ground- and surface water. There are no public water supply MCLs for fecal streptococcus. Nitrates Of 79 wells sampled for nitrates, none exceeded the MCL of ten milligrams per liter (mg/l). One well indicated a concentration above five mg/l, but less than ten mg/l, while 16 wells contained concentrations at or above 2.0 mg/l. 3-40
100 Volatile Organic Compounds (VOCs) Water samples collected from 78 wells were analyzed for VOCs. Three VOC compounds were detected in well samples during the year toluene, chloroform, and chloromethane. However, none of the detections exceeded their respective MCLs. In 2004, contaminated ground water was discovered in Leon Valley in northwestern San Antonio during an environmental investigation conducted by the TCEQ. This area, which has been designated as the Bandera Road Ground Water Plume Superfund site, is located in a mostly commercial area near Bandera Road between Poss Road and Grissom Road. Some homes are also located nearby. Major ground water contaminants include toluene and chlorinated solvents, such as tetrachloroethene (PCE), trichloroethene (TCE), and cis-1,2- dichloroethene (DCE). (EPA 2007). In 2007, the site was placed on the final National Priorities List. The EPA has been investigating the site to monitor the pollutants and identify sources of the contamination. Semi-volatile Organic Compounds (SVOCs) One well was sampled for SVOCs, with none detected. Pesticides, Herbicides, and PCBs Well water samples collected from 59 wells were analyzed for pesticides, herbicides, and polychlorinated biphenyls (PCBs). None tested positive for these contaminants. In summary, well sampling did not indicate widespread contamination in the Aquifer. However, elevated nitrate detections (greater than two mg/l) were present in 16 of the 79 wells sampled. Metals were detected above a regulatory limit in several of the 79 wells sampled. Detections of the metals strontium and iron are likely due to naturally occurring sources of these two metals. Strontium detections are typically highest in and close to the saline water part of the Aquifer. Iron detections are occasionally high in some parts of the Aquifer system. Although the quality of the water in the Aquifer is generally good, man-made contaminants, such as pesticides and solvents, have been found in streams that recharge the Aquifer, and in the Aquifer itself. Most of the contaminants are found in urbanized areas, and most of them appear to be derived from non-point sources. Examples of pesticide and solvent detections include: Pesticides in Lorence Creek (USGS 1999). This stream recharges the Aquifer in Bexar County. Atrazine in Leon Creek (Edwards Aquifer Authority 1999). This stream recharges the Aquifer in Bexar County. Atrazine in Aquifer recharge zone monitor wells, Bexar County (EAA 2009b; USGS 2000). 3-41
101 PCE in San Antonio Water System Dreamhill well, Bexar County (SAWS ). In the great majority of cases, concentrations of pesticides and solvents are far below the levels that have been established to protect human health. Thus, while the presence of these contaminants is cause for concern, it is not cause for alarm The Edwards Aquifer Water Budget Water levels of the Aquifer and associated flows of Comal and San Marcos springs are affected by the rate of water entering the Aquifer (recharge) and the rate of water exiting the Aquifer (discharge). Recharge occurs from water entering the Aquifer from streams, natural catchments, recharge structures, localized runoff from precipitation events, and from subsurface flow from adjacent aquifers. Seasonal rainfall over the region ultimately controls the rate of recharge. Discharge occurs from withdrawal of water from wells and from flow of natural springs and seeps. An unknown smaller quantity is discharged to the saline water zone (USGS 1995). Discharge is greatly affected by water demand and rate of pumping. If recharge is high, the Aquifer can sustain higher levels of pumping, while maintaining higher levels of springflows. However, if there is low seasonal recharge followed by reduced rainfall and by high rates of pumping, then Aquifer levels will decline with resulting decreased spring discharge. Historic recharge and discharge of the Aquifer and effects to springflow are discussed below. Groundwater Recharge Estimates of the average annual recharge of the Aquifer vary according to changes in weather cycles and resulting precipitation over the recharge and contributing zones. The USGS (1995) cites an average annual recharge of 635,000 ac-ft. However, Klemt et al. (1979) indicate an average annual recharge of approximately 651,000 ac-ft. Data from the EAA s 2009 Hydrogeologic Data Report (EAA, 2010b) indicate an average annual groundwater recharge of 717,500 ac-ft for the period of record , and an even higher annual average of 965,400 acre-feet during the last ten year period Contributions of the major river basins to the average annual recharge during the period of record are listed in Table 3-5. TABLE 3-5 CONTRIBUTIONS OF MAJOR RIVER BASINS TO AVERAGE ANNUAL RECHARGE OF THE EDWARDS AQUIFER, Area Average Annual Recharge (acre-feet) Frio River Dry Frio River Basin 139,700 Nueces River West Nueces River Basin 127,400 Area between Sabinal River and Medina River Basins 112,700 Cibolo Creek Dry Comal Creek Basin 112,100 Area between Medina River and Cibolo Creek Dry Comal Creek Basins 72,800 Medina River Basin 63,000 Blanco River Basin 46,900 Sabinal River Basin 42,900 TOTAL 717,500 SOURCE: EAA 2010b. 3-42
102 Recharge to the Aquifer varied greatly during the years as indicated in Figure Variability was correlated with annual precipitation and corresponding runoff into the major river and creek basins. Lowest annual recharge (44,000 ac-ft) occurred during 1956 at the peak of the drought of record. Highest recharge (2,486,000 ac-ft) occurred in Rates of infiltration of water carried by the streams across the recharge zone have been estimated by the USACE (1965) to range from 500 to greater than 1,000 cfs. Recent modeling studies using the Hydrologic Simulation Program Fortran (HSPF) indicate that land-based recharge outside of stream channels across the nine basins varies from a low of two percent to a high of 76 percent (EAA 2010b), whereas 24 to 98 percent of recharge across the nine basins occurs in stream channels as channel loss (LBG Guyton Associates, 2005). In addition, some recharge to the Aquifer originates from inter-formational flow from adjacent aquifers such as the Trinity Aquifer. Recent studies by Green and Bertetti (2010) indicate that a substantial volume of water directly enters the Aquifer through cross-formational flow from water recharged into the Trinity Aquifer (Glen Rose Limestone). Dye tracing conducted by the EAA in northern Bexar County suggests rapid and direct groundwater flowpaths from the Trinity to the Edwards Aquifers (Johnson et al. 2009). Estimates of the contribution from adjacent hydraulically-connected aquifers have been estimated by the EAA (2010a) to vary from 5,000 to 60,000 ac-ft/yr. Figure Estimated annual recharge and 10-year floating average recharge for the San Antonio Segment of the Edwards Aquifer (EAA 2010a). 3-43
103 Groundwater Discharge Water is diverted from the Aquifer through wells, and also exits from natural springs and seeps occurring near geological faults along the Edwards formation and Balcones Escarpment. Wells are the principal source of water for agricultural, municipal, and industrial uses in the region. Depths of wells range from less than 500 feet in the unconfined Aquifer to more than 3,000 feet in the confined Aquifer in the western region (USGS 1995). Wells in the area can be very large, with casing diameters ranging from 10 to 30 inches and capable of pumping in excess of 35,000 gallons per minute. Average annual discharge from wells over the period of record was 311,400 ac-ft (44.7 percent of all discharge), in comparison to 384,400 ac-ft (55.3 percent) from springflow. During droughts, the proportion of well discharge to spring discharge changes considerably. During 1956 at the height of the drought of record, wells contributed 82 percent of the discharge in comparison to 18 percent for springs. During the drought of 2008, wells contributed 51 percent of the total discharge, while spring discharge comprised 49 percent. Values for average and median discharge are provided in EAA (2010b). Well discharge has generally increased over the period of record to a point beginning in 1968 and running through 1989 where annual discharge consistently exceeded the average annual recharge (USGS1995). Pumping peaked in 1989 at an estimated level of 542,000 ac-ft. Since 1980, as a result of increased pumping, there has been greater fluctuation of springflow with increased time required for recovery, even during a period that recorded the two highest levels of Aquifer recharge (1992 and 2004). Examination of Figure 3-18 indicates increases in pumping beginning in 1982, 1987, and 1996, resulting in higher fluctuation of springflow. 3-44
104 3.4 The Edwards Aquifer, Comal Springs, and San Marcos Springs The Aquifer and associated springs (Comal Springs, San Marcos Springs, Hueco Springs, and Fern Bank Springs) are unique aquatic ecosystems containing some of the greatest diversity of groundwater and spring-associated species in the world. (Culver and Sket 2000, Holsinger and Longley 1980, Longley 1981; Reddell 1994) Edwards Aquifer Ecosystem The Aquifer lies within the Balcones Fault Zone along the eastern boundary of the Edwards Plateau and extends from a groundwater divide in Kinney County through San Antonio 3-45
105 northeast to Bell County. The recharge zone occurs in the Balcones Fault Zone at the Aquifer outcrop. Groundwater levels typically have seasonal and weather-related variations, with the potential for rapid changes in water level following heavy rainfall. While groundwater levels can change rapidly, water temperatures and quality remain constant in the absence of contamination events (McKinney and Sharp 1995). The focused recharge, enhanced cavernous porosity, and geochemical water quality conditions makes this one of the most productive groundwater reservoirs in the country (Sharp and Banner 1997), and may be one of the most biologically diverse karst aquifers in the world. Culver et al. (2003) showed that patterns of biodiversity were positively correlated with the number of caves and distance from the late Cretaceous Sea (among other things), which may account for the diversity of Texas caves. The Aquifer supports a highly adaptive biological assemblage that differs considerably from spring ecosystems. However, the hydrology of the Aquifer is directly related to the surface water ecosystems as water in the springs flows from the Aquifer at the base of the Balcones Escarpment (McKinney and Sharp 1995). Therefore, the systems are intertwined by components of water quantity, quality and thermal conditions, while separate with respect to biological organisms that directly rely on sunlight and surface energy. A high diversity of species are found only within the Aquifer and associated springs and karst formations, including blind catfish, salamanders, aquatic crustaceans, and terrestrial cave invertebrates. In a study investigating the occurrence of Aquifer biota from 33 wells and two springs in Bexar County, Karnei (1978) reported 18 aquatic species taxonomically representing three phyla, three classes, and seven orders of organisms. Several species are listed by the USFWS as endangered or threatened, or have been proposed for listing (see Section 3.5) Comal Springs Ecosystem The Comal Springs ecosystem (Figures 3-19a and b) is the largest spring system in Texas and in the southwestern United States, originating from the Aquifer and located mainly in Landa Park in New Braunfels, Comal County. The system is comprised of four major springs and several smaller spring runs that feed into Landa Lake. The spring runs and Landa Lake form the headwaters of the Comal River, the shortest river in Texas, which spans 3.1 miles before its confluence with the Guadalupe River. From Landa Lake, water flows into two channels, the original old channel and a new channel created in 1847 when the river was dammed and the millrace was excavated by hand to provide water for William Merriweather s saw and grist mill. The two channels then rejoin 1.6 miles downstream. (McKinney and Sharp 1995). The Old Channel retains many of its natural characteristics even though there are some small dams and channelization. Schlitterbahn, a water theme park, diverts some of the springflow in the Old Channel. The New Channel has a more uniform width and in some areas, a limestone bottom. Several dams have been constructed on the New Channel, to control overflow, as well as several parks and recreational tube chutes (McKinney and Sharp 1995). The city of New Braunfels withdraws some of the springflow in the New Channel for irrigation purposes. The physical, chemical, and biological characteristics of the Comal Springs and Comal River ecosystem have been recently evaluated to develop an understanding of alternative instream 3-46
106 flow strategies for the protection of Covered Species. (Hardy et al. 1999; BIO-WEST 2002b; Hardy 2009). Comal Springs has the largest mean discharge of any spring in the southwestern United States, averaging 275 cfs in (George et al. 1952; Edwards Underground Water District 1974). From June until November of 1956, the artesian flow at the springs ceased flowing. Around this same time, all known major springs in the Balcones Fault Zone ceased flow except for San Marcos Springs (U.S. Army Corps of Engineers 1965). This system exhibits nearconstant temperatures (annual mean 74.1 F or 23.4 C), excellent water quality, and low nutrient and bacteria levels (USFWS 1996a). Over the years, extensive urban development along the banks, channel modification, and the natural variability of the springs has resulted in biological community alterations (EH&A 1975). The Comal River has also been affected by recreational activities along the banks including the afore-mentioned network of parks and tube chutes. (McKinney and Sharp 1995). Several organisms occurring in the Comal Springs ecosystem are listed by the USFWS as threatened or endangered. The listed species will be discussed in further detail in Section
107 3-48
108 3-49
109 3.4.3 San Marcos Springs Ecosystem The San Marcos Springs ecosystem (Figures 3-20a-c) is the second-largest in Texas and has the most environmental stability and flow reliability of any spring system in the southwestern United States (USFWS 1996a). This spring system has never stopped flowing in recorded history, although it dropped to approximately 46 cfs during the drought of record occurring in the 1950s. The average discharge from the San Marcos Spring system from 1994 through 2001 was180 cfs (Edwards Aquifer Authority 2002a) and the stability of its springflow helps support the rare flora and fauna found in Spring Lake and in the San Marcos River. Spring Lake constitutes the headwaters of the San Marcos River, which extends 68.2 miles to its confluence with the Guadalupe River. Temperatures remain nearly constant year-round at 71.1 F (21.7 C) (USFWS 1996a). The biological uniqueness and high degree of endemism found in Spring Lake and in the upper San Marcos River can be attributed to its thermal stability, reliable flow, and consistent water chemistry (USFWS 1996a). Lemke (1989) documented 31 species of aquatic macrophytes (plants large enough to be seen with the naked eye) on the upper San Marcos River. Of these, 23 were native. Increasing competition with non-native species and resulting displacement of native species was noted. A recently observed new nonnative species in the San Marcos Springs ecosystem, water trumpet (Cryptocoryne becketti), has been observed forming colonies that extend from bank to bank excluding native plant species and threatening the habitats of Texas wild-rice and fountain darter. (Tu 2010). Construction and residential development continues to occur along the San Marcos River, although historically to a lesser degree than along the Comal River. (EH&A 1975). As with the Comal River, the San Marcos River is a haven for recreational activities. Upstream flood control dams within the watershed of the San Marcos River have enhanced recharge to the Aquifer by allowing water behind the dams, which would have gone downstream as irretrievable rapid flow, to infiltrate and contribute to the recharge system. Hydrologically, these dams have also reduced the magnitude of scouring flood events downstream, allowing an accumulation of sediments and resultant non-native vegetation encroachment. The San Marcos River has experienced increased sedimentation, which occurs when the sediment supply exceeds the ability of flood events to remove the sediment supply. A recent study was conducted (Earl and Wood 2002) which analyzed the impacts of upstream changes in the San Marcos River. It was found that a major source of the sediment is provided by Sessoms Creek, which receives runoff from the Texas State University campus. Based upon a density of 2.0 g/cm³, the sediment production rate from campus construction over three years of construction activities that began in 1995 would produce an annual sedimentation accumulation in the channel of the San Marcos River of 16 cm/year (6.3 inches per year). Construction on campus has continued since 1998 and it is likely that similar rates of sedimentation have occurred during this time. Projected through 2004, there would have been a total accumulation of 4.7 feet in the upper 273 yards (250 meters) of the San Marcos River channel in the nine years between 1995 and While these numbers likely have some error associated with them, it is clear that 3-50
110 3-51
111 3-52
112 3-53
113 sediments are accumulating at a high rate and that even significant floods are unable to erode and transport them. Sediments transported downstream in Sessoms Creek alter the depth and width of the San Marcos River channel where they are deposited. They are deposited in areas that are critical to Texas wild-rice, covering the streambed s natural substrate with materials from outside of the aquatic ecosystem that are not optimum substrate for native plant species. The sediments act as fill in the natural channel, making the channel downstream more shallow than what would otherwise be natural, creating a spit that extends about half way across the San Marcos River at the confluence with Sessoms Creek, about forty yards downstream of Spring Lake Dam. Since flood control measures on the San Marcos River have prevented large, scouring floods from occurring, the deposited sediments remain near the confluence of Sessoms Creek and the San Marcos River. The sediments impact Texas wild-rice by covering plants growing in the natural substrate and causing other plants to grow in a less than optimum substrate. The plants that do grow in the sediments are prone to being washed out or having their root masses exposed during high flow events. During low flows, the plants are unnaturally close to the surface of the stream, rather than being safely located in a deeper channel. The location in unnaturally shallow water makes Texas wild-rice more vulnerable to drought, low flow conditions, herbivores, and recreation. The end result is that more water is needed to maintain water depths necessary to minimize impacts to the threatened and endangered species and their habitat. Even the 1998 flood event, during which the peak flow was 21,500 cfs (USGS 1999), was unable to erode and transport this sediment deposit. This analysis may provide insight on the inability of future floods to remove sedimentation deposits. The increased sedimentation could potentially be reduced through a variety of measures such as the implementation of sediment check dams, efforts to reduce erosion, increasing the amount of flow passed through the flood control dams, and the reduction of non-native vegetation. However, each of these efforts could have adverse effects on a variety of features within this aquatic ecosystem. Several organisms occurring in the San Marcos Springs ecosystem are listed by the USFWS as either threatened or endangered, candidates, or proposed for listing, and additional species, though rare, are afforded no official protection status. The threatened and endangered species will be discussed in further detail in Section 3.5. Flows of San Marcos Springs have been recently evaluated to better understand the water quantity and quality needs of the spring ecosystem. (Saunders et al. 2001; BIO-WEST 2003b). Hueco Springs Ecosystem Hueco Springs is located in Comal County approximately four miles north of New Braunfels. This spring complex consists of two main groups of springs issuing from the floodplain of the Guadalupe River. Hueco I (Hueco A) is a large, typically perennial spring on the west side of River Road in an undeveloped area and Hueco II (Hueco B) is an intermittent spring on the east side of River Road, located in a campground. Hueco Springs has a local recharge component which could be enhanced by strategically placed recharge dams (Barr 1993). Fauna recorded from this site includes the Elmid beetle Microcylloepus sp., and the water penny beetle, 3-54
114 Psephenus texanus, surface dwelling amphipods, oligochaetes, caddisfly larvae, crayfish, clams snails, aquatic isopods, three species of copepod (Acanthocyclops vernalis, Mesocyclops edax and Skstodiaptomus sp.), hypogean amphipods (Stygobromus russelli) (Zara 2003), an aquifer salamander (possibly Eurycea rathbuni), and the federally listed Peck s Cave amphipod Stygobromus pecki (Barr 1993). Fern Bank Springs Ecosystem Fern Bank Springs is a series of small perennial springs and seeps that flow from the base of a bluff on the south bank of the Blanco River in Hays County. While the source of the water for Fern Bank Springs is undetermined, it may originate from the upper member of the Glen Rose Formation, from drainage from the Aquifer recharge zone, from water lost from the Blanco River, or from some combination of those sources (USFWS 2007). A recent dye tracer study performed by the EAA showed a connection from a sinkhole in the Edwards. (EAA 2010a). The springs themselves have been minimally altered, except for the installation of water collection containers below the spring orifices and an intake box and pipes near the uppermost orifice, where a pool inside of a small cave was previously utilized as a source of drinking water. A small orifice on the hillside to the east of the uppermost orifice is a known locality for Comal Springs dryopid beetle. Other taxa known from the site include hypogean amphipods (Stygobromus russelli), the spring-associated Fern Bank salamander Eurycea pterophila, and several aquatic epigean species. Fern Bank Springs is designated as Critical Habitat for the Comal Springs riffle beetle, Comal Springs dryopid beetle, and Peck s cave amphipod. (72 FR 39,247 (July 17, 2007)). 3.5 Listed Species Covered by the ESA Section 10(a)(1)(B) Incidental Take Permit Eight species are currently listed as endangered or threatened by the USFWS that depend entirely on the Aquifer and associated springs. Incidental take may be allowed for seven of these species if covered by an ESA Section 10(a)(1)(B) Permit. The ESA does not prohibit take of listed plants except on federal lands [16 U.S.C. 1532(8) and 1532(14)]. Additionally, although the last known sighting of the San Marcos gambusia from the San Marcos River occurred in 1983 and the species is now thought to be extinct (McKinney and Sharp 1995), this species is nonetheless proposed for incidental take coverage in the HCP. Listed species addressed in the HCP (and date of listing) include: Endangered Fountain darter (Etheostoma fonticola) (35 FR16,047 (Oct. 13, 1970)) Comal Springs riffle beetle (Heterelmis comalensis) (62 FR 66,295 (Dec. 18, 1997)) Comal Springs dryopid beetle (Stygoparnus comalensis) (62 FR 66,295 (Dec. 18, 1997)) Peck s Cave amphipod (Stygobromus pecki) (62 FR 66,295 (Dec. 18, 1997)) 3-55
115 Texas wild-rice (Zizania texana) (43 FR 17,910 (Apr. 26, 1978)) Texas blind salamander (Eurycea [formerly Typhlomolge] rathbuni) (32 FR 4,001 (Mar. 11, 1967)) San Marcos Gambusia ((Gambusia georgei) (35 FR (Oct. 13, 1970)) Threatened San Marcos salamander (Eurycea nana) (45 FR 47,355 (July 14, 1980)) A brief life history of each species covered in the HCP is provided below Fountain Darter (Etheostoma fonticola) The fountain darter, a member of the family Percidae, is endemic to the San Marcos and Comal rivers. This species was first collected in 1884 in the San Marcos River just below its confluence with the Blanco River and in 1891 in the Comal River (Schenck and Whiteside 1976). The historic range of this species on the San Marcos River extends from Spring Lake downstream to just below its confluence with the Blanco River, and in the Comal River from the headwaters downstream to its confluence with the Guadalupe River (Schenck and Whiteside 1976). Currently the fountain darter can be found in the upper portions of the Comal River including Landa Lake and in the San Marcos River system from Spring Lake downstream to the outfall of the San Marcos City wastewater treatment plant. (McKinney and Sharp 1995; Schenck and Whiteside 1976). Between 1954 and 1973, the original population of fountain darters was extirpated from the Comal River (Linam et al. 1993; Schenck and Whiteside 1976). It is believed that a combination of a rotenone treatment by the Texas Fish, Game, and Oyster Commission in 1951 [to remove non-native Rio Grande cichlids (Cichlasoma cyanoguttatum)], temperature variations due to the springs ceasing to flow for a six-month period in 1956, and a flood from Blieders Creek in 1971 all contributed to the die off of the fountain darter. (Linam et al. 1993; Schenck and Whiteside 1976). Beginning in 1975, a total of 457 fountain darters from San Marcos were re-introduced into the Comal River, from which the present Comal population is descended. (Linam et al. 1993; Schenck and Whiteside 1976). Fountain darters are small (usually <1.0 inch), olive-green in color, with dark markings along the lateral line, dark spots at the base of the tail, opercule, dorsal fin, and around the eye. (Gilbert 1887; Schenck and Whiteside 1976). Competing theories have been reported in the literature regarding the wild fountain darters reproductive cycles; some researchers support continuous spawning (Strawn 1955, Hubbs 1985) while others have noted seasonal peaks in reproductive activity. (Schenck and Whiteside 1977b). Fecundity is believed to be lower in fountain darters than other species of darters and appears to be controlled by both environmental and genetic factors including the influence of repeated spawnings throughout the year. This species exhibits sexual dimorphism, with the males having four morphological forms differing in size, color, and shape. (Schenck and Whiteside 1977b). Females deposit eggs in aquatic vegetation which are 3-56
116 then fertilized by breeding males that produce a small amount of transparent milt (sperm). (Hubbs 1958). Little or no parental care is provided to the eggs or young. (Schenck and Whiteside 1977b). Young fountain darters are restricted to the stream bottom in pools until they have grown enough to swim through currents. (Collette 1965; Strawn 1955). Fountain darter habitat requirements include clear, clean, flowing, and thermally constant waters, adequate food supply, undisturbed sand and gravel substrates, rock outcrops, and areas of submergent vegetation (algae, moss, vascular plants) for cover. (McKinney and Sharp 1995; Schenck and Whiteside 1977a; USFWS 1996b). BIO-WEST studies utilizing drop-net techniques have documented the highest densities of fountain darters in filamentous green algae (Rhizoclonium sp.) and the moss Riccia (BIO-WEST 2003a, 2003b) and rarely in areas devoid of vegetation (Schenck and Whiteside 1976; USFWS 1996b). Young fountain darters are found in heavily vegetated areas with low flows, while adults can be found in all suitable habitats (Schenck and Whiteside 1976). This strong preference for aquatic vegetation highlights the concern posed by the grazing activities of the afore-mentioned giant rams-horn snail. Critical habitat for the fountain darter has been designated at Spring Lake and its outflow, and the San Marcos River downstream to 0.5 mile below the IH-35 bridge. (45 FR 47355, (July 14, 1980)). Fountain darters appear to have adapted to a relative narrow temperature range at the downstream edges of their available habitat. Water temperature is a concern and laboratory studies have shown a significant decrease in reproductive capacity above 26 C (Brandt et al. 1993, Bonner et al. 1998, McDonald et al. 2007) and a critical thermal maximum of 34.8 C (Brandt et al. 1993). A more recent study conducted by BIO-WEST (2002c) and Dr. T.H. Bonner has discounted the hypothesis that the 2C diel fluctuations that occur in the wild have a significant impact on earlier findings. Regardless, these ranges in temperature tolerance observed in the laboratory are similar to other species with wider geographic and thermal distributions. (Bonner et al. 1998). Food sources for fountain darters consist of copepods, aquatic insect larvae, and amphipods. (McKinney and Sharp 1995; Schenck and Whiteside 1977a). Generally small aquatic invertebrates are the preferred food item; however, type and amount of food consumed changes with growth of the fish. (Schenck and Whiteside 1977a). The food sources of fountain darters are different in Spring Lake and the San Marcos River since the invertebrate communities are different and darters eat what is present and suitable in their environment. Fountain darters feed based on visual cues, primarily during the day, and are stationary feeders; waiting for their prey to come to them. (USFWS 1996b; Schenck and Whiteside 1976). Population estimates of the fountain darter are difficult to make because of its small body size, the range of sampling methods used in the past and the difficulty in accounting for all of the habitat dynamics in calculations. Prior to 1974, no collections gave any indication of the population abundance. When the rotenone treatment occurred in Landa Lake in 1951, an unknown number of fountain darters, along with other native fishes were seined, held in a protected area until the rotenone dissipated, and subsequently reintroduced (Ball et al. 1952). The stress imposed by this event likely reduced the fountain darter population in the Comal River. The collection by Hubbs and Strawn (1957) that occurred between the rotenone 3-57
117 poisoning and the zero springflow conditions in 1956 only indicated that the species was still present, not how many were there. Since that time, despite the difficulties, a few attempts have been made to estimate the population abundance in the San Marcos and Comal rivers. Schenck and Whiteside (1976) estimated the total population in the San Marcos River at 103,000 but did not provide a confidence range and the authors cautioned that the estimate was not the primary focus of their study. They also estimated 339 fountain darters within a small portion of Spring Lake. As part of that study, Schenck and Whiteside (1976) spent 300 personhours between March 1973 and February 1975 sampling the Comal River but did not collect any fountain darters there. After the fountain darters were reintroduced into the Comal River in 1975 using individuals from the San Marcos River, the population became re-established in the former. In 1990, Linam et al. (1993) estimated the total abundance of fountain darters in the San Marcos River (excluding Spring Lake) to be 45,900 individuals with a 90 percent confidence interval of 15,900 to 107,700. Recent observations in Spring Lake (BIO-WEST 2003a, 2003b) suggest that fountain darter densities are much higher there than in downstream areas and a population estimate that included the lake would be significantly higher. The Linam estimate was calculated using different methods of capture than those used by Schenck and Whiteside (1976) which limits comparisons; however, the earlier estimate falls within the range described by Linam et al. The Linam et al. study also estimated the mean population for the Comal River upstream of Torrey Mill Dam at 168,078 with 95 percent confidence limits of 114,178 and 254,110. The wide confidence intervals for these population estimates indicate the difficulty in developing them with any real confidence. There are a large number of factors that influence the population that are difficult to account for in a single sample effort. In addition, the fountain darter is short-lived and highly fecund which allows it to respond quickly to changes in habitat availability. Therefore, estimates of population abundance may have changed by the time the estimates are published. Population estimates have not been generated from sampling associated with the Variable Flow Study but the study has documented high densities of fountain darters in the Comal and San Marcos springs/river ecosystems recently. (BIO-WEST 2003a, 2003b). That study has shown that there is a wide range of habitat suitability among species of aquatic vegetation. Using vegetation composition (high, moderate, and low habitat suitability) may be a more accurate means of estimating the current status of the fountain darter population than developing population estimates. Recently, there has been an increase of parasitism in the fountain darter, especially in the Comal River. The most serious threat comes from the trematode hosted by the red-rimmed melania, which attacks the gills of the fountain darter causing reddening, swelling, and bleeding. The immune system of the fountain darter is sufficient to rid its body of the trematode, but not until the damage has already been done. (BMWD 1998; Fuller and Brandt 1997). Some of the concerns of the impact of this parasite are increased stress, reduced ability to avoid predators, and reduced reproductive capabilities. Recent laboratory studies suggest; however, that the trematodes do not impact reproduction, at least in early stages of infestation and under moderate parasite loads. (BIO-WEST 2002c). 3-58
118 3.5.2 Comal Springs Riffle Beetle (Heterelmis comalensis) The Comal Springs riffle beetle (family Elmidae) is known primarily from Comal Springs, and was first collected there in 1976 and described in 1988 by Bosse et al. (1988). Barr (1993) collected a single specimen in the headwaters of the San Marcos River, but specimens have been regularly found in that location more recently. (Gibson et al. 2008; Gonzales 2008). Although some riffle beetles are capable of flight, the Comal Springs riffle beetle is a flightless, surface aquatic beetle about one-eighth of an inch long (62 FR 66,295 (Dec. 18, 1997). Both larvae and adult riffle beetles are entirely aquatic with the adults feeding mainly on algae and detritus scraped from submerged weeds and rocks (Brown 1987). Comal Springs riffle beetles are found in the flowing, uncontaminated waters of the spring runs, but also occupy areas along the Landa Lake shoreline where springflow is present or in areas of upwelling springflow (including the deepest portions of the Landa Lake (BIO-WEST 2002a). Water flow appears to be important to respiration and survival of this species; therefore, a reduction of water flow or drying of the spring runs could be a limiting factor to their survival. (62 FR 66,295 (Dec. 18, 1997)). Previously, it was unclear how the species might respond to reduced springflow. Recent laboratory studies suggest that individuals tend to orient downward in the substrate, and toward flow BIO-WEST 2002b), a behavioral response that may permit individuals to move to suitable habitat when springflow is reduced at the surface. However, because this species was not identified until 1976, well after the documented drought of record and cessation of springflow at Comal Springs, the question of survivability of the species during no-flow periods remains unanswered. In addition to behavioral responses, the presence of individuals in deeper areas of Landa Lake, somewhat removed from the spring runs, may have facilitated survival despite loss of habitat and provided a source for recolonization. In 2007, the USFWS designated 19.8 acres of the Comal Springs complex and 10.5 acres of the San Marcos Springs complex as critical habitat for this species. (72 FR 39,247 (July 17, 2007)) Comal Springs Dryopid Beetle (Stygoparnus comalensis) First collected in 1987, the Comal Springs dryopid beetle is the only known subterranean aquatic (stygobiotic) species from the family Dryopidae. This species is translucent, is slightly pigmented, has vestigial (non-functioning) eyes, and is about one-eighth of an inch long. Specimens have predominantly been collected from Comal Springs spring run #2; however, they have also been collected from spring runs 3 and 4 on the Comal River and Fern Bank Springs in Hays County (Barr and Spangler 1992). This species is assumed to be restricted to headwaters of springs and spring runs due to its inability to swim. They are able to maintain a mass of small hydrophobic (unwettable) hairs on their underside where they retain a thin air bubble through which gas exchange occurs during respiration (BMWD 1998; Chapman 1982). As water flow decreases, subsequently decreasing dissolved oxygen levels, this method of respiration loses its effectiveness. Thus, FWS found that dryopid beetle requires flowing uncontaminated waters for survival. (62 FR 66,295 (Dec. 18, 1997)). 3-59
119 In 2007, the USFWS designated 31.8 acres of critical habitat for this species at the Comal Springs complex and 1.4 acres of critical habitat at the Fern Bank Springs complex. (72 FR 39,247 (July 17, 2007)) Peck s Cave Amphipod (Stygobromus pecki) Peck s Cave amphipod, is a subterranean aquatic species in the family Crangonyctidae. This species is eyeless and un-pigmented, which indicate that its primary habitat lies within the Aquifer in permanent darkness. If individuals venture outside the spring orifice, they become easy prey from predators. Therefore, individuals are typically found in the crevices of rocks and gravel near spring orifaces. This species was first collected at Comal Springs in 1964 and again in (62 FR 66,295 (Dec. 18, 1997)). Most of the specimens collected (over 300) were netted from gravel substrates near Spring Runs 1, 2, and 3 in the Comal Springs system. (Arsuffi 1993; Barr 1993). In 2002, five individuals were collected from Panther Canyon Well, known to be hydrologically connected to Spring Run 3 through dye tracer tests. (USFWS 2003a). Several specimens have also been collected from Hueco Springs. Extensive collection efforts have been unable to locate the species in other localities. (Barr 1993; Gibson et al. 2008; 62 FR 66,295 (Dec. 18, 1997)). Very little is currently known about the life history requirements of this species. Two critical habitat units have been designated for Peck s Cave Amphipod: Comal Springs and associated portions of Landa Lake, and the Heuco Spring complex (encompasses Hueco Springs and associated satellite springs). Primary constituent elements of the critical habitat for all three federally listed aquatic invertebrate species include: unpolluted, high quality water, Aquifer water temperatures between 68 o 75 o F, adequate dissolved oxygen levels and food supply, and substrates between inches in diameter San Marcos Salamander (Eurycea nana) The San Marcos salamander is a member of the lungless salamanders belonging to the family Plethodontidae. Eurycea are known as the brook salamanders, and include three species on the Edwards Plateau: the Texas blind salamander; the San Marcos salamander in the San Marcos River; and the Texas salamander (Eurycea neotenes), in the Comal River (USFWS 1996a). It was once thought that the latter two species were the same; however, investigations by Chippendale et al. (1992, 1994, and 1998) have suggested that these two populations may be genetically different. The San Marcos salamander is currently listed as a threatened species by the TPWD and as a threatened species by the USFWS. (USFWS 1996a). San Marcos salamanders were first collected from the San Marcos Springs and described in (Bishop, 1943). They are small, reaching a maximum length of 2.3 inches (58.4 mm), slender, and light brown in color. Prominent features include large eyes with a dark ring around the lens, well-developed and highly pigmented external gills, moderately short and slender limbs, four toes on the forefeet and five on the hind feet, and a well-developed dorsal fin. 3-60
120 (USFWS 1996a). Water issuing from the springs has a low oxygen content (30-40 percent saturated), causing the external gills of the San Marcos salamander to have a bright red coloration due to increased blood flow through the gills. (Tupa and Davis 1976). San Marcos salamanders are distinct when compared to other neotenic Eurycea from Texas, in that they are smaller, more slender, have different coloration, greater number of costal grooves (vertical wrinkles in the skin between front and hind legs), larger eyes relative to their head, and fewer teeth. (Tupa and Davis 1976; USFWS 1996a). San Marcos salamanders are found in Spring Lake in rocky areas around spring openings and downstream of the dam at Spring Lake. (Tupa and Davis 1976; Nelson 1993). They require clean, clear waters associated with springs in areas of sand, gravel, large rock, and vegetative cover at depth of 3.3 to 6.6 feet (Nelson 1993; USFWS 1996a). Populations have been found in front of the Aquarena Springs Hotel on concrete banks and in boulders which are covered with an aquatic moss (Leptodictyium riparium). (USFWS 1996a). Individuals can also be found in Lyngbya sp., a filamentous blue-green algae, which covers shallow sandy substrates and provides a good hiding place by means of camouflage for the salamanders (BMWD 1998; USFWS 1996a). Numerous rooted aquatic macrophytes occur on the boundary of the salamander habitat in suitable depths including arrowhead, water primrose, and eelgrass). Numerous individuals are found within these mats of vegetation at the shallow headwater areas. The vegetation houses the food source for the salamander in addition to protective cover for avoidance of predators (larger fish, crayfish, turtles, and aquatic birds) (Tupa and Davis 1976; USFWS 1996a). Flowing waters are one of the main requirements for the survival of the San Marcos salamander. They prefer waters that are slightly alkaline (ph 7.2), thermally constant 69.8 to 71.6 F (21-22 C), an oxygen saturation of percent, and little variation in bicarbonate alkalinity ( mg/l). (Tupa and Davis 1976). Critical habitat has been designated for the San Marcos salamander as Spring Lake and its outflow and the San Marcos River downstream to 164 feet below Spring Lake Dam. (USFWS 1996a). The main food source of the San Marcos salamander is amphipods. Stomach content analyses have shown that San Marcos salamanders also feed on tendipedid (midge fly) larvae and pupae, other small insect pupae and naiads, and small aquatic snails. San Marcos salamanders and the fountain darter often occupy the same habitat and pursue their prey in much the same way. These salamanders wait for the prey to come near their head, then snap forward with an open mouth and engulf their prey, indicating a behavior response to sensory cues from living prey. (Tupa and Davis 1976). Male San Marcos salamanders reach sexual maturity when they reach a snout-vent length of 0.74 inch or total length of 1.37 inches. (Tupa and Davis 1976). MacKay (1952) found sperm in all mature males from October to May and postulated that they have a breeding season in June and another in the fall. There are four classes of ova in female San Marcos salamanders: very small clear ova, small opaque-white ova, small yellow ova, and large yellow ova. Those that carried large yellow ova were considered ready for oviposition and were found in almost every 3-61
121 month of the year. Large yellow ova were present in females with a snout-vent length greater than 0.78 inch or 1.37 inches. (Id.). Courtship and egg deposition have not been observed and no eggs have been collected from the San Marcos salamander s natural habitat. However, in the closely related Comal Springs blind salamander (Eurycea tridentifera), courtship, oviposition, and hatching have been observed. Typically Eurycea breed in the running water of streams, springs, or caves and their adherent eggs are singly deposited on the bottom and sides of vegetation or rocks (USFWS 1996a). Tupa and Davis (1976) and Bogart (1967) performed studies on the San Marcos salamander that suggests they breed most of the year with a peak in late spring (May and June). Attempts to estimate population size have also been made. The San Marcos salamander population found in the shallow area of Spring Lake along the northern bank in front of the Aquarena Springs Hotel was estimated by Tupa and Davis (1976) to be 20,880. In 1991, the population was estimated at 23,200 in the same area, at 25,238 for rocky substrates around spring openings, and at 5,213 for rocky substrates 492 feet (150 m) downstream of the Spring Lake Dam, for a total population estimate of 53,651. (Nelson 1993) Texas Blind Salamander (Eurycea rathbuni) The Texas blind salamander was first collected in 1895 from the NFHTC in San Marcos, Texas, when they were expelled from an artesian well drilled to supply the hatchery with water (Longley 1978). Earlier taxonomists supported the recognition of genus Typhlomolge (Wake 1966, Potter and Sweet 1981); however, Mitchell and Reddell (1965) disagreed, stating that E. rathbuni represents Eurycea that has an extreme cave-associated morphology. Based on biochemical, morphometric, and molecular techniques, Chippindale et al. (1994) concluded that the Texas blind salamander is phylogenetically within the Texas Eurycea group. This conclusion has been more recently supported by allozyme and mitochondrial genetic (DNA) sequence studies by Chippendale et al. (2000). The USFWS reassigned this species as Eurycea. It was listed on the March 1999 Texas Threatened and Endangered Species list. (TPWD 1999). The Texas blind salamander is a smooth, unpigmented troglobitic (cave-adapted) species, and has a maximum length of 4.7 inches. It has a large and broad head, reduced eyes (two small dark spots beneath the skin), long and slender limbs, four toes on the forelegs and five on the hind legs. There are no definite external characteristics that can be used to determine sex. Due to the presence of juveniles year round, the Texas blind salamander appears to be sexually active throughout the year due to the thermally constant waters of the Aquifer. Observations of this species in captivity have shown three spawning events in one year and indicated a clutch size from 8 to 21 eggs per spawning (Longley 1978). Unpigmented eggs were attached to gravel either singly or in groups of 2 to 3 eggs. Constant water temperature within the Aquifer is essential for normal egg development (Longley 1978). Eggs hatch within 12 to 16 days after laying and feeding of the larvae begins within 1 month after hatching. Young salamanders feed on copepods while larger salamanders eat amphipods, blind shrimp (Palaemonetes antrorum) 3-62
122 in captivity, daphnia, small snails, and other invertebrates. Cannibalism has also been documented with the Texas blind salamander. (USFWS 1996a). Texas blind salamanders have been well documented from the subterranean waters of the San Marcos area of the Aquifer in Hays County. They live in water-filled cavernous areas and are neotenic (reproduce in the larval form) and aquatic throughout their life. Texas blind salamanders have been observed, in caves with access to the water table, traveling along submerged ledges within the Aquifer and swimming small distances before spreading their legs and settling to the bottom. It is likely that they are sensitive to changes in water temperatures, preferring the thermally constant temperatures of the Aquifer, although more research is needed to determine critical thermal minima and maxima for their various life stages. (Longley 1978; Berkhouse and Fries 1995). All collections of Texas blind salamanders documented in the literature have occurred in Hays County and since its initial collection from the San Marcos NFHTC, the salamander has been found at Ezell s Cave, San Marcos Springs, Rattlesnake Cave, Primer s Fissure, Texas State University s artesian well, and Frank Johnson s well (Russell 1976; Longley 1978). Previously it had been found in Wonder Cave; however, searches in 1977 did not discover any individuals (Longley 1978). The distribution of this species may be the Aquifer beneath and near San Marcos in an area as small as 25.9 square miles. (USFWS 1996a). Recent collections and genetic work support a more widespread distribution of this species, including four additional sites (Hueco Springs, Comal Springs, Panther Canyon Well, and Mission Bowling Well in Comal County). (Gluesenkamp, 2011) Texas Wild-Rice (Zizania texana) Texas wild-rice, an aquatic perennial grass from the family Poaceae, was originally collected in 1892 and identified as southern wild-rice (Z. aquatica). In 1932 amateur botanist W.A. Silveus of San Antonio, Texas collected and recognized Texas wild-rice as a distinct species (Silveus 1933; Terrell et al. 1978; Poole and Bowles 1999). It was described by A.S. Hichcock in (Hitchcock 1933). Texas wild-rice is endemic to the San Marcos River and is thought to have evolved in geographic isolation from other species of Zizania. The nearest present-day population is a coastal plain population of Z. aquatica in southern Louisiana, 400 miles (640 km) away, and is morphologically different from Z. texana. (Terrell et al. 1978). Texas wild-rice is an aquatic, monoecious, perennial macrophyte, 3.3 to 6.6 feet long. It is found growing and submerged primarily at a depth of 3.3 feet in swift moving, shallow areas of the San Marcos River. (Poole and Bowles 1999). During times of low flow, the upper portions of the culms (stems) and leaves become emergent (Terrell et al. 1978; USFWS 1996a). Texas wildrice is securely attached to the substrate by short spongy roots which are tightly intertwined and develop into a plant colony in 1.0 to 6.0 feet of water. (Beaty 1975). The leaves are linear, up to 3.3 feet long, and 0.5 inch wide. (Terrell et al. 1978; Poole et al. 2007). There previously was some debate about the ability of Texas wild-rice to reproduce via seeds except under laboratory conditions. (Beaty 1975; Emery 1967). Flowering plants are now recognized as a common occurrence in the wild, and genetic sampling shows greater diversity than would be predicted in 3-63
123 an asexually reproducing species. (Richards et al. 2007). Flowering typically occurs in the spring and fall but may be seen throughout the year due to the constant water temperatures. Texas wild-rice does reproduce vegetatively, by stolons, and appears to reestablish readily when uprooted and relocated during flood events. (BIO-WEST 2003a, 2003b). Texas wild-rice forms large clumps rooted in sand and gravel sediments which is overlain by Crawford black silt and clay (Vaughan 1986). They grow primarily in the middle of the river in areas with swift moving, shallow water of 3.3 feet or less, (Poole and Bowles 1999). Wild-rice require thermally constant temperatures, clear water, undisturbed stream bottom habitat, protection from floods, and protection allowing inflorescence (flower production) during reproduction. (McKinney and Sharp 1995). Associated plant species that occur in the upper 0.25-mile area of the San Marcos River, which is inhabited by Texas wild-rice, include eelgrass, arrowhead, pondweed, hydrilla, hornwort (Ceratophyllum demersum), elodea (Elodea densa), and water primrose. In the lower sections of the river, Texas wild-rice is found in isolated clumps and competition from other species is minimal (Terrell et al. 1978; Vaughan 1986). In many places on the river, the non-native elephant ear has invaded the edges of the river, narrowing the river and crowding other aquatic species. Other species such as sycamore (Platanus occidentalis), pecan (Carya illinoensis), bald cypress (Taxodium distichum), live oak (Quercus fusiformis), and American elm (Ulmus americana) have shaded the river, although it is not known if wild-rice is influenced by the amount of shading by the tree canopy. (Vaughan 1986). When Texas wild-rice was first described in 1933, it was found in abundance in the San Marcos River, as well as in Spring Lake, and in contiguous irrigation ditches, requiring considerable effort by an irrigation company to control its growth (Terrell et al. 1978; Silveus 1933). Thirty-four years after its discovery, its abundance had been significantly reduced. In 1967, Emery found only one plant in Spring Lake, and none in the uppermost 0.5 mile of the San Marcos River. Only scattered plants were found in the next 1.5 miles, and none were found below this point. (Emery 1967). Emery rechecked the abundance of Texas wild-rice in the upper portions of the San Marcos River in 1976, and found no plants in Spring Lake. During that investigation, the greatest concentrations of plants were found at the extreme upper and lower segments of the 1.5-mile reach of the river. (Emery 1977). He also estimated that Texas wild-rice plants covered 12,169.6 square feet of river habitat. Texas wild-rice was listed as an endangered species in After the listing, a continued decline occurred in the areal coverage of Texas wild-rice until it had declined to just 4,881 square feet (Vaughn 1986), which is less than half of Emery s 1976 estimate. Recent years have seen a significant increase in areal coverage of Texas wild-rice to 20,404 square feet in The species is abundant throughout the upper portion of its range, but rare downstream of the IH-35 bridge, despite the historic suitability of habitat below this point. Since June 1989, the TPWD has monitored areal coverage of Texas wild-rice which has averaged 14,794 square feet between 1989 and The current distribution of Texas wild-rice extends from the upper reaches of the San Marcos River, including several plants that were reintroduced into Spring Lake just upstream of the dam, and numerous stands just below the 3-64
124 dam (Emery and Vaughan did not report wild-rice from this area), throughout the river habitat to an area just below the wastewater treatment plant. Until recently, it had not occurred between the Rio Vista railroad bridge and the Cheatham Street dam (USFWS 1996a), however a single plant is now present in this reach (E. Oborny, BIO-WEST, personal communication). Increased sedimentation, water depth and turbidity, and a decrease in current velocities have contributed to a loss of habitat for Texas wild-rice growth throughout the lower portions of its historic range (Poole and Bowles 1999). While water depth and current velocity are a direct result of the influence of springflow into the San Marcos River, the impacts of increased sedimentation and turbidity on Texas wild-rice are largely a result of urbanization within the contributing watershed. The species critical habitat has been designated as Spring Lake and its outflow, and the San Marcos River downstream to its confluence with the Blanco River (USFWS 1996a). The invasion of a new non-native plant, water trumpet (Cryptocoryne beckettii), was thought to create a new threat to Texas wild-rice. The plant, a native of southeast Asia, was introduced into the San Marcos River in (USFWS 2003b). The plant probably escaped into the river from a dumped aquarium as the plant is very popular in the aquarium trade. (Tu 2010). The plant has habitat preferences that are nearly identical to Texas wild-rice and established in the section of the San Marcos River from the A.E. Wood State Fish Hatchery to the confluence of the San Marcos and Blanco rivers. (USFWS 2003b). Since August of 2002, through a cooperative effort led by the USFWS NFHTC, this plant appears now to have been effectively removed from the San Marcos River. (Alexander 2008). The cultivation of Texas wild-rice in a controlled environment has been attempted with varying success. Replanting attempts have been made with cultured plants into Spring Lake with limited success. Emery was successful under controlled conditions in a spring-fed raceway at Texas State University at San Marcos, with seed storage and germination, seedling survival, pollination, and development of survival clones to the next generation. (Terrell et al. 1978). Efforts to grow Texas wild-rice outside the San Marcos River have been unsuccessful. (USFWS 1996b). The recovery plan lists disturbances to the environment and diminished springflow as the main threats to Texas wild-rice. (USFWS 1996a). In addition, impacts from recreationists (e.g., tubing), floating debris (aquatic vegetation cut at Spring Lake and by landowners), shade which reduces photosynthesis, or interference with pollination and seed maturation can damage the plants (Beaty 1975; Poole 1992). Herbivory by nutria (Myocastor coypus), the introduced giant rams-horn snail (Marisa cornuarietis), and waterfowl, as well as competition from aquatic plants are believed to be significant factors in reducing the size and vigor of stands of wild-rice (McKinney and Sharp 1995). Other threats include water quality degradation, waterborne contaminants, genetic erosion of the population, chemical spills, and siltation (Poole 1992; BMWD 1998). 3-65
125 3.5.8 San Marcos Gambusia (Gambusia georgei) The San Marcos gambusia (Gambusia georgei), a member of the family Poeciliidae, was first described by Hubbs and Peden in It is just one of three species of Gambusia native to the San Marcos River, the others being largespring gambusia (G. geiseri) and western mosquitofish (G. affinis) which have continually been found in greater numbers than the San Marcos gambusia (Hubbs and Peden 1969). This genus originated in Central America and contains more than 30 species of the live-bearing freshwater fishes. (USFWS 1996a). Gambusia is a well-defined genus and mature males have a thickened upper pectoral fin ray that distinguishes it from related genera (Rosen and Bailey 1963). In the United States, only a limited number of Gambusia are native, and of these, the San Marcos gambusia has one of the most restricted ranges. (USFWS 1996). As specimens were caught in the late 1800s and again in 1925, it is likely that the San Marcos gambusia have inhabited the area for some time (Hubbs and Peden 1969). San Marcos gambusia range in size from 1.0 to 1.5 inches, adult females being larger than males (Whiteside 1976). Their scales tend to be strongly crosshatched which is contrary to the less distinct scale markings of the western mosquitofish (USFWS 1996). San Marcos gambusia are usually plainly marked; however, behaviorally aggressive fish may develop a dark stripe on their dorsal fin, a black bar on their cheek, and a dark patch above their pectoral fin (Whiteside 1976). Under normal conditions, their coloring appears to be lemon yellow, bright yellowish orange, or bluish. (USFWS 1996a). The exact locations of early collections of San Marcos gambusia were only recorded as San Marcos Springs although they were probably collected near the headwaters of the springs. (USFWS 1996a). Over time, the distribution of the San Marcos gambusia appears to have been significantly altered. Only a few records show the fish occurring downstream of the headwaters of the San Marcos River although collections in this area were few prior to A single individual was taken during a 1953 collection effort below the dam at Rio Vista Park, and since that time, almost all specimens of the San Marcos gambusia have been taken in the vicinity of the IH-35 bridge downstream to Thompson s Island. The only exception to this was in 1974 when one individual was collected below the outfall of the San Marcos wastewater treatment plant (USFWS 1996a; Longley 1975). Historically, populations of San Marcos gambusia have been low, and were rare during collection efforts in 1978 and 1979 which yielded only 18 San Marcos gambusia from a total of 20,199 (0.09 percent). (Edwards et al. 1980). Populations decreased during a 1981 and 1982 collection effort (0.06 percent of all Gambusia collected) and sampling efforts between 1982 and 1995 have not yielded a single individual. (USFWS 1996a). Intensive collection efforts were conducted in 1990 with no San Marcos gambusia being collected (USFWS 1996a). San Marcos gambusia prefer quiet, shallow, thermally constant, open waters adjacent to areas of moving water. Historically, they have been found mostly in the upper portions of the San Marcos River on muddy substrates without silting and in areas of shade from overhanging vegetation or bridge structures (Edwards et al. 1980; Hubbs and Peden 1969). At some localities, the introduced aquatic vegetation elephant ear has been found in abundance. 3-66
126 Researchers suggest that this nonnative plant may have modified essential aspects of the San Marcos gambusia habitat. (USFWS 1996a). Critical habitat has been designated by the USFWS as the San Marcos River from the Highway 12 bridge downstream to just below the IH- 35 bridge (Id.). Very little is known about the food preferences of the San Marcos gambusia. It is thought that insect larvae and other invertebrates make up the majority of their diet, as in other poecillids (USFWS 1996a). The reproductive capabilities of this species are not known, although two individuals kept in laboratory aquaria produced clutches of 12, 30, and 60 young, with the largest having been aborted prior to full development. (Edwards et al. 1980). Hybridization of the San Marcos gambusia and the western mosquitofish has been going on since 1925 and was first recognized by Hubbs and Peden (1969). This went on for many years without the introduction of genetic material into either of the parental species; however, a series of collections from 1981 to 1983 indicated that hybrid individuals were becoming more abundant than the pure San Marcos gambusia. (USFWS 1996a). This may indicate that hybrid individuals are competing with the San Marcos gambusia and putting stress on native populations. Despite efforts to locate pure San Marcos gambusia, the last known sighting from the San Marcos River occurred in 1983 and the species is now thought to be extinct. (McKinney and Sharp 1995). 3.6 Species Warranted for Listing Covered by the Section 10(a)(1)(B) Permit, If Listed in the Future There are many species within the Plan Area that are proposed for listing as threatened or endangered. The Covered Species Work Group recommended coverage by this HCP for three species: Aquifer diving beetle (Haideoporus texanus), Texas troglobitic water slater (Lirceolus smithii), and Comal Springs salamander (Eurycea sp. 8), which have similar ranges, habitats, and threats as the listed species described above in Section 3.5. The following sections provides a brief summary of the locations, habitat requirements, and morphological descriptions of these species, for which a USFWS 90-day finding indicates that listing as threatened or endangered may be warranted. (74 FR 66,866 (Dec. 16, 2009)) Edwards Aquifer Diving Beetle (Haideoporus texanus) The Edwards Aquifer diving beetle, also known as Texas cave diving beetle, is a small (less than one half inch), elongate, oval-shaped and somewhat flattened member of the family Dytiscidae. This species is restricted to the subterranean waters of the Aquifer in Hays and Comal counties, where it has been collected from the Artesian Well and from Comal Springs (Bowles and Stanford 1997, Gibson et al. 2008). The Texas cave diving beetle was the first blind, unpigmented, aquifer-adapted water beetle known from North America. They have reduced nonfunctional eyes and a greater development of sensory setae (hairs) on their wings, legs, and mouth area. (Young and Longley 1975). The USFWS (2009) has declared that substantial information was presented in the petition to indicate that the listing of this species may be warranted due to the present or threatened 3-67
127 destruction, modification, or curtailment of its habitat or range resulting from water drawdown and loss of water quality due to development Texas Troglobitic Water Slater (Lirceolus smithii) Texas troglobitic water slater is one of six described species in the Lirceolus genus in Texas. (Lewis and Bowman 1996, Lewis 2001). Phylogeographic work on Lirceolus showed patterns of relatedness that follow surface river drainage basins (Krejca 2005). There are collections of unidentified material from across the state, and at least one locality, Barton Springs in Travis County, has sympatric species. Members of this genus are not commonly collected. They are extremely small compared to the widespread Texas asellid (Caecidotea reddelli). While no Lirceolus have formal protection, several of the species are endemic to small areas and a regional Habitat Conservation Plan in Hays County recognizes Lirceolus smithii as one that could become listed as threatened or endangered in the future (Loomis Partners, Inc. et al. 2009). This species is known from two localities in Hays County, San Marcos Springs (Diversion Springs) and the Artesian Well that is located very close to San Marcos Springs. The USFWS (2009) has declared that substantial information was presented in the petition to indicate that the listing of this species may be warranted due to the present or threatened destruction, modification, or curtailment of its habitat or range resulting from aquifer drawdowns and decreasing water quality Comal Springs Salamander (Eurycea sp.) A population of salamanders occurs at Comal Springs, and for the purposes of this HCP we use the common name Comal Springs Salamander that refers only to this population, in accordance with the federal listing petition for the species Eurycea sp. (USFWS 2009). This population was initially identified as E. nana (Sweet 1978), however Chippindale et al. (2000) confirmed these individuals were not E. nana but in fact a unique species. The morphology and genetics of this species is very similar to that of E. neotenes, and Bendik (2006) suggests that this "species" be synonomized with E. neotenes and the Comal collections be treated as a range extension. The USFWS (2009) has declared that substantial information was presented in the petition to indicate that the listing of this species may be warranted due to habitat loss or degradation resulting from numerous human factors including groundwater withdrawal and contamination. It is worthwhile to note that a second species of aquifer salamander also occurs at Comal Springs. Recent data suggest the characteristics of this aquifer salamander are consistent with it being Eurycea rathbuni. (Gluesenkamp 2011). 3-68
128 Page intentionally left blank. 3-69
129 Chapter 4 Covered Species Analysis 4.0 Introduction Issuance criteria under section 10(a) of the ESA require, among other things, that the incidental take resulting from the Covered Activities will not appreciably reduce the likelihood of the survival and recovery of the species in the wild. (16 U.S.C. 1539(1)(a)(1)(B)(iv)). Furthermore, because the ITP is an action authorized by a Federal agency, section 7(a)(2) of the ESA requires that the issuance of the permit is not likely to jeopardize the continued existence of any federally-listed species or to result in the destruction or adverse modification of designated critical habitat. (Id. at 1536(a)(2)). 1 FWS must make these determinations using the best scientific and commercial data available. Further, under USFWS s 5-Point policy, an applicant must clearly and consistently define the expected outcome (i.e., biological goal(s)) of the HCP. (65 FR at 35,250). These goals are intended to create parameters and benchmarks for developing conservation measures and determine the focus of the adaptive management strategy. (Id. at 32,250-51). The purpose of this chapter is to: (1) establish the biological goals and objectives for the HCP; (2) estimate the amount of incidental take that may result from the Covered Activities; and (3) evaluate the impact of that take on the likelihood of the survival and recovery of the Covered Species. 1 The term jeopardize the continued existence of means to engage in an action that reasonably would be expected, directly or indirectly, to reduce appreciably the likelihood of both the survival and recovery of the species in the wild by reducing the reproduction numbers, or distribution of that species. (50 C.F.R ). This standard is obviously very similar to the appreciable reduction issuance criterion. The jeopardy and critical habitat analysis will be done by USFWS as part of its Section 7(a)(2) Biological Opinion. Accordingly, the jeopardy and critical habitat analysis will not be specifically addressed in this chapter. 4-1
130 4.1 Long-Term Biological Goals and Objectives Biological Goals and Objectives The identification of biological goals and objectives is one of five components outlined in the HCP Handbook Addendum (USFWS and NMFS 2000), referred to as the "5-Point Policy. (See Section 1.6.4). Long-term biological goals are the rationale behind the minimization and mitigation strategies and, conversely, minimization and mitigation measures are the means for achieving the long-term biological goals and objectives. The purpose of Section 4.1 is to establish the biological goals and objectives for the HCP based on the best scientific and commercial data available. All long-term biological goals, accompanying management objectives, and flow-related objectives are subject to change under limited circumstances set out in the Funding and Management Agreement (FMA). Any such change will be based solely on the best scientific and commercial data available Comal Springs/River Ecosystem Fountain Darter Long-term Biological Goals The long-term biological goals for the fountain darter at Comal Springs are quantified as areal coverage of aquatic vegetation (habitat) within four representative reaches of the Comal system (Upper Spring run [upstream most portion of the system to Spring Island], Landa Lake [Spring Island to the outflow to Old and New channels], Old Channel, and New Channel) and fountain darter density (population measurement) per aquatic vegetation type. (Figure 4-1). The habitatbased and population measurement goals are presented in Table 4-1 and include proposed aquatic vegetation restoration efforts. The population measurement goal is to maintain the median densities of fountain darters observed per aquatic vegetation type per system at a level greater than or equal to that observed over the past 10 years in the EAA Variable Flow Study monitoring. 4-2
131 Figure 4-1. Representative Sample Reaches Comal Springs 4-3
132 TABLE 4-1 FOUNTAIN DARTER HABITAT (AQUATIC VEGETATION) IN METERS SQUARED (M 2 ) AND FOUNTAIN DARTER MEDIAN DENSITY (NUMBER/M 2 ) PER HABITAT TYPE Fountain darter habitat (aquatic vegetation) goal in meters squared (m 2 ) Study Reach Bryophytes Hygrophila Ludwigia Cabomba Fil. Algae Sagittaria Vallisneria Upper Spring Run Reach 1, Landa Lake 4, ,250 13,500 Old Channel New Channel 150 1, TOTAL 6,150 2,450 2, ,850 13,500 Fountain darter median density goal (number/m 2 ) Bryophytes Hygrophila Ludwigia Cabomba Fil. Algae Sagittaria Vallisneria
133 Key Management Objectives The long-term biological goals are accompanied by two key management objectives needed to achieve the long-term biological goals. The management objectives for the fountain darter in the Comal Springs/River Ecosystem are (in no particular order): Active native vegetation restoration and protection will be implemented in Landa Lake and the Old Channel. Restoration activities will extend beyond the study reaches in equal proportion to effort expended per study area in relation to the total area of Landa Lake and Old Channel. For example, if 50 percent of the Old Channel study reach was restored, 50 percent of the entire Old Channel would be subsequently restored. Surface water quality within the Comal River should not exceed a 10 percent deviation (daily average) from historically recorded water quality conditions (long-term average) as measured at the fifteen EAA Variable Flow Study water quality monitoring locations (Figure 4-1). This includes water quality constituents currently measured in the EAA Variable Flow Study except water temperature and dissolved oxygen. This objective assumes that a 10 percent deviation in average conditions would be acceptable; however, more extensive work to evaluate and assess water quality tolerances of the fountain darter will be addressed as part of the AMP. Water temperature and dissolved oxygen will be monitored and evaluated on an instantaneous basis within the four representative study reaches with established thresholds. Water temperatures <25 C will be maintained throughout the Comal system as to not inhibit fountain darter reproduction and recruitment over time. Dissolved oxygen concentrations > 4.0 mg/l will be maintained throughout fountain darter habitat. Flow-related Objectives The current level of uncertainty associated with the habitat-based long-term biological goals and the associated restoration and water quality management objectives necessitate the flowrelated objectives in Table 4-2. TABLE 4-2 LONG-TERM AVERAGE AND MINIMUM TOTAL COMAL DISCHARGE MANAGEMENT OBJECTIVES Description Total Comal Discharge (cfs) a Time-step Long-term average 225 Daily average Minimum 30 b Daily average a Assumes a minimum of a 50-year modeling period that includes the drought of record b Not to exceed six months in duration followed by 80 cfs (daily average) flows for 3 months. 4-5
134 To track progress towards the long-term goals and learn more about the cause-and-effect relationships responsible for the variability in the habitat and population measures, the Applicants will monitor key components (i.e., aquatic vegetation, the species themselves, water quality, non-native species, gill parasites, etc.) and conduct applied research and ecological modeling as part of the AMP. (See Section 6.3). The monitoring, applied research, and ecological modeling will be clearly described and defined as the AMP is further developed and implemented as any changes to the long-term biological goals will be based on the best available science. Historical and Present Day Perspective Aquatic vegetation and fountain darters have been routinely monitored within these four representative study reaches since fall The aquatic vegetation and subsequent fountain darter densities have varied over that period (BIO-WEST 2002a-2011a). An example of bryophytes areal coverage in the Upper Spring Run Reach and Landa Lake, and Hygrophila areal coverage in the Old and New channels over time is presented below in Table 4-3. TABLE 4-3 EXAMPLE OF BRYOPHYTES AREAL COVERAGE IN THE UPPER SPRING RUN REACH AND LANDA LAKE, AND HYGROPHILA AREAL COVERAGE IN THE OLD AND NEW CHANNELS OVER TIME Bryophytes (m 2 ) Hygrophila (m 2 ) Sampling Period Upper Spring Run Reach Landa Lake Old Channel New Channel Spring , ,158 Fall ,156 3, ,310 Spring ,476 4, ,011 Fall ,021 3, ,291 Spring ,859 1, ,300 Fall Spring ,386 2, Fall ,915 1,055 1, Spring ,850 2,114 1, Fall , , Spring ,358 2,779 1,373 1,
135 Fall ,407 2,601 1,519 1,300 Spring ,760 3,364 1,349 1,340 Fall , ,350 2,131 Spring ,068 2,789 1,526 1,991 Fall , Spring ,872 2,587 1, Fall , Long-term Average 1,526 2, ,401 Table 4-4 breaks out the current (spring and fall 2010) areal coverage of aquatic vegetation within each of the four reaches. (BIO-WEST 2011a). From review of these tables, it is evident that the aquatic vegetation in the Comal system can vary considerably (most notable in Upper Spring Run Reach and New Channel) within any given year. For example, in 2010, the considerable reduction in aquatic vegetation in the Upper Spring Run Reach and New Channel, as well as for bryophytes in Landa Lake was due to the intense flooding event experienced in June. For a more comprehensive description of aquatic vegetation in the Comal study reaches over the past decade see EARIP (2009) or BIO-WEST (2002a-2011a)). Methods and Discussion Data collected over the past 10 years for the EAA Variable Flow Study was used for this analysis. For this approach, the maximum amount of each aquatic vegetation type per study reach was selected independent of year and vegetation type. For instance, 2003 had the highest areal coverage of bryophytes in Landa Lake, but 2009 had the highest amount of Sagittaria. As a starting point, both maximums were used even though they did not occur concurrently. Table 4-5 shows the maximum areal coverage per vegetation type within each study reach over the ten-year study period. 4-7
136 TABLE 4-4 FOUNTAIN DARTER HABITAT IN COMAL SPRINGS ECOSYSTEMS (AQUATIC VEGETATION) (m 2 ) Study Reach Bryophytes Hygrophila Ludwigia Cabomba Fil. Algae Sagittaria Vallisneria SPRING 2010 Upper Spring Run Reach 1, Landa Lake 2, ,458 13,671 Old Channel 18 1, New Channel TOTAL 4,573 2, ,198 13,671 FALL 2010 Upper Spring Run Reach Landa Lake ,484 12,923 Old Channel 0 1, New Channel TOTAL 427 1, ,001 12,
137 Two assessments were made to transform the data in Table 4-5. First, the total area of each of these study reaches was evaluated and a determination made as to whether or not these maximum (but not concurrent) values could be supported within a given reach (or if there simply was not enough wetted area). For example, when you add up all the maximum vegetation coverage for the Upper Spring Run reach in Table 4-5, you get 4,542 m 2. However, only 4,312 m 2 of vegetative cover is physically possible in that reach. As the Upper Spring Run reach is subject to frequent disturbance, a 75 percent (3,234 m 2 ) goal of that total amount was set for this reach. The 3,234 m 2 was rounded to 3,250 m 2 and carried forward in the analysis. Based on the quality of habitat present and the risk of disturbance, Landa Lake was given a 95 percent goal, Old Channel a 90 percent goal, and the New Channel a 45 percent goal. Second, it is not appropriate to base long-term biological goals in key areas (Landa Lake and Old Channel) on non-native vegetation maximums. Accordingly, the effectiveness of restoration efforts to replace the majority of Hygrophila with Ludwigia were considered for Landa Lake and the Old Channel. (See Section 5.2.2) Approximately 35 percent of the total non-native Hygrophila was left as, realistically, it is likely not possible to remove all of it and it does provide a measure of habitat. To a much lesser degree, expansion of Cabomba in Landa Lake was incorporated beyond the maximum as was some restoration of Ludwigia at the Upper Spring Run Reach. The latter Ludwigia restoration needs to be done carefully (i.e., planting in areas protected by Sagittaria) or otherwise the routine flushing of this area will limit the effectiveness of that activity. A review of the Hardy (2010) fountain darter modeling shows that there would be sufficient quality and quantity of habitat in all four reaches at long-term average flows (i.e., 225 cfs) to support the long-term biological goals for the fountain darter in the Comal system. Both assessments resulted in adjustments to the areal coverage habitat goals. (Table 4-6). As part of the HCP long-term monitoring program, these reaches will continue to be monitored semi-annually over time. Additionally, to ensure the representative nature of each study reach to the Comal system, aquatic vegetation mapping of the entire system as well as stratified random fountain darter sampling within designated aquatic vegetation types throughout the entire system will be conducted every two years during Phase I. Comal Springs Riffle Beetle Long-term Biological Goals The long-term biological goals for the Comal Springs riffle beetle involve a qualitative habitat component and quantitative population measurement. As with the fountain darter, a representative reach approach was employed. From a habitat perspective, the goal is to maintain silt-free habitat conditions via continued springflow, riparian zone protection, and recreation control throughout each of the three sample reaches (Spring Run 3, Western shoreline, and Spring Island area). (Figure 4-2). Additionally, the population measurement goal is to maintain greater than or equal to the median densities observed over the past six years of EAA Variable Flow Study monitoring. 4-9
138 TABLE 4-5 MAXIMUM FOUNTAIN DARTER HABITAT (AQUATIC VEGETATION) (m 2 ) Study Reach Bryophytes Hygrophila Ludwigia Cabomba Fil. Algae Sagittaria Vallisneria Upper Spring Run Reach 2, Landa Lake 4, ,552 13,931 Old Channel 99 1, New Channel 353 3, TOTAL 7,402 6, , ,300 13,931 TABLE 4-6 GOALS FOUNTAIN DARTER HABITAT (AQUATIC VEGETATION) (m 2 ) Study Reach Bryophytes Hygrophila Ludwigia Cabomba Fil. Algae Sagittaria Vallisneria Upper Spring Run Reach 1, Landa Lake 4, ,250 13,500 Old Channel , New Channel 150 1, TOTAL 6,150 2,450 2, ,850 13,500 *Bold/italics indicate a restoration activity that deviates from the Maximum observed. 4-10
139 Figure 4-2. Comal Springs riffle beetle sample areas. Table 4-7 summarizes the two components of the long-term biological goal. TABLE 4-7 COMAL SPRINGS RIFFLE BEETLE LONG-TERM BIOLOGICAL GOALS Spring Run 3 Western Shoreline Spring Island Area Habitat Density (# of CSRB/ Silt-free gravel and cobble substrate 90% of each study area
140 Lure) Key Management Objectives The long-term biological goals are accompanied by two key management objectives needed to achieve the long-term biological goals. The management objectives for the Comal Springs riffle beetle in the Comal Springs/River Ecosystem are (in no particular order). Aquifer water quality should not exceed a 10 percent deviation (daily average) from historically recorded water quality conditions (long-term average) within the Edwards Aquifer as measured issuing from the spring openings at Comal Springs. This includes water quality constituents currently measured in the EAA Variable Flow Study. (See 5.7.2). This objective assumes that a 10 percent deviation would be acceptable. More extensive work to evaluate and assess water quality tolerances of the Comal Springs riffle beetle will be addressed as part of the AMP. Active restoration of riparian habitat adjacent to spring openings (Spring Run 3 and Western Shoreline) will be implemented to limit the sedimentation that is experienced following rainfall events. Flow-related Objectives The current level of uncertainty associated with the habitat-based long-term biological goals and the associated restoration and water quality management objectives necessitate the incorporation of flow-related objectives presented above in Table 4-2. Historical and Present Day Perspective As part of the EAA Variable Flow Study, the Comal Springs riffle beetle population is monitored at three spring upwelling reaches in and around Landa Lake. Riffle beetle monitoring occurs in spring seeps within Spring Run 3, in several springs along the western shoreline of Landa Lake, and near springs upstream of Spring Island. Table 4-8 below shows the total number of Comal Springs riffle beetles captured during each sampling event from 2004 through 2010 (BIO-WEST 2005a 2011a). Similar to fountain darter abundance data, this data is variable across sampling events. However, the riffle beetle data also suggests a relatively stable long-term trend in abundance. (BIO-WEST 2011a). 4-12
141 TABLE 4-8 NUMBER OF COMAL SPRINGS RIFFLE BEETLES CAPTURED DURING EACH SAMPLING EVENT VIA COTTON LURE METHODOLOGY FROM 2004 THROUGH 2010 Sample Period Spring Run 3 Western Shore Spring Island TOTAL May June August Nov Dec April Nov Dec May June Nov Dec May June Nov Dec May June Nov Dec May June Nov Dec May June Nov Dec TOTAL 2,370 2,182 1,979 6,531 Average Methods and Discussion Unlike for the fountain darter habitat, it is more complex to quantify the amount (or areal coverage) of high quality habitat for the riffle beetle. A major unknown is the beetle s use of subsurface habitat. As such, the habitat-based component of this goal involves maintaining siltfree substrates (gravels and cobbles) throughout the representative sample reaches. For the population measurement component, data collected over the past six years for the EAA Variable Flow Study was used for this analysis. The approach involved calculating the 4-13
142 minimum, 25 th, median, 75 th, and maximum densities of Comal Springs riffle beetles collected per lure within the three representative sample reaches. The results are shown in Table 4-9. TABLE 4-9 COMAL SPRINGS RIFFLE BEETLE DENSITY (#/LURE) Spring Run 3 Western Shoreline Spring Island Area Minimum th Median th Maximum As the recent six-year trend suggests a stable population of Comal Spring riffle beetles within the sample reaches, it was decided that the median density over the past six years would serve as starting point for a long-term biological goal. As with the other species, continued semi-annual monitoring will be conducted at each of the three representative study reaches as part of the AMP. (See Section 6.3.2). Comal Springs Dryopid Beetle and Peck s Cave Amphipod Long-term Biological Goal The Comal Springs dryopid beetle and Peck s Cave amphipod are subterranean species inhabiting the Comal system. The subterranean nature and restricted range of the Comal Springs dryopid beetle (to the headwaters of the springs and spring upwelling areas) suggests that it does not require substantial surface discharge from springs to survive and presumes that springflow (of sufficient water quality) that continually covers the spring orifice should prevent long-term detriment to the population. EARIP (2009). Similarly, the Peck s Cave amphipod requirements include sufficient springflow covering the spring orifices and adequate water quality to prevent long-term adverse impacts to the species. (Id.). As such, the long-term biological goal for these subterranean species focuses on Aquifer water quality as well as a springflow component. The water quality goal is: to not exceed a 10 percent deviation (daily average) from historically recorded water quality conditions (long-term average) within the Edwards Aquifer as measured issuing from the spring openings at Comal Springs. 4-14
143 This includes all water quality constituents currently measured in the EAA Variable Flow Study. This goal assumes that a 10 percent deviation would be acceptable; however, more extensive work to evaluate and assess water quality tolerances of these species will be addressed as part of the AMP. Flow-related Objectives The current level of uncertainty associated with the water quality long-term biological goal necessitates the incorporation of the flow-related objectives presented above in Table 4-2. Quantitative population measurements were considered for each species, but not established at this time for the following reasons. The Comal Springs dryopid beetle is infrequently captured and, thus, a population metric is not practicable with available data. Peck s Cave amphipods are collected in number, but a trend of increasing numbers of individuals with increased springflow is observed. The hypothesis is that as water movement through the Aquifer increases, more individuals are expelled through the spring openings and carried away from their livable habitat. A reduction in individuals expelling from the spring openings does not necessarily suggest a reduction in the quality of Aquifer habitat for this species. As such, semiannual drift net sampling for both species will be continued in the context of the AMP during Phase I, and this additional data will be evaluated with the intent of establishing population metrics for these species for Phase II of the HCP. Coupled with the water quality long-term biological goal, these flow conditions should provide habitat conditions and food supplies supportive of these Aquifer species San Marcos Springs Texas Wild-Rice Long-term Biological Goal The long-term biological goal for Texas wild-rice has been determined by an evaluation of: (1) the maximum occupied area of Texas wild-rice that has been present in the San Marcos system over time; (2) TPWD analysis of the Hardy (2010) physical habitat modeling; and (3) the 1996 USFWS recovery plan goals. The long-term biological goal for Texas wild-rice is presented in Table 4-10 and subsequent discussion. 4-15
144 TABLE 4-10 LONG-TERM BIOLOGICAL GOAL FOR TEXAS WILD-RICE River Segment Areal Coverage (m 2 ) Reach Percentage of Total Areal Coverage Spring Lake 1,000 1,500 n/a Spring Lake Dam to Rio Vista Dam 5,810 9, Rio Vista Dam to IH , Downstream of IH , TOTAL , Key Management Objectives The long-term biological goal is accompanied by three key management objectives needed to achieve the long-term biological goal. The management objectives for Texas wild-rice in the San Marcos Springs/River Ecosystem are (in no particular order): Minimum Texas wild-rice areal coverage per segment during drought of record-like conditions (Table 4-11). Recreation awareness throughout the whole river at all flows with designated control in the following high quality habitat areas below 100 cfs total San Marcos discharge (Table 4-12). Active restoration and Texas wild-rice expansion efforts and long-term monitoring focused on high-quality habitat areas. TABLE 4-11 MINIMUM TEXAS WILD-RICE AREAL COVERAGE PER SEGMENT DURING DROUGHT OF RECORD-LIKE CONDITIONS River Segment Areal coverage (m 2 ) Reach percentage of total areal coverage Spring Lake 500 n/a Spring Lake Dam to Rio Vista Dam 2, Rio Vista Dam to IH
145 Downstream of IH TOTAL 3, TABLE 4-12 RECREATION AWARENESS THROUGHOUT THE WHOLE RIVER AT ALL FLOWS WITH DESIGNATED CONTROL IN THE FOLLOWING HIGH QUALITY HABITAT AREAS WHEN FLOW IS BELOW 100 CFS TOTAL SAN MARCOS DISCHARGE Combined River Segment Spring Lake Dam to Rio Vista Dam Rio Vista Dam to IH-35 Downstream of IH-35 TPWD Individual Segments B, C F K Flow-related Objectives The long-term biological goals for Texas wild-rice are defined as areal coverage over a spatial extent of the San Marcos River (see Table 4-10). However, because of the uncertainty associated with the long-term biological goals, the associated management objectives necessitate the flow-related objectives presented above in Table TABLE 4-13 LONG-TERM AVERAGE AND MINIMUM TOTAL SAN MARCOS DISCHARGE OBJECTIVES Total San Marcos Description Discharge (cfs) a Time-step Long-term average 140 Daily average Minimum 45 b Daily average a Assumes a minimum of a 50-year modeling period that includes the drought of record b Not to exceed six months in duration followed by 80 cfs (daily average) flows for 3 months. Historical and Present Day Perspective Whole system monitoring for Texas wild-rice in the San Marcos River was initiated in 1976 and TPWD has conducted annual monitoring since (EARIP 2009). The TPWD 1976 to 2009 data set (EARIP 2009) was used for this analysis. During this time period the largest amount of Texas wild-rice in the San Marcos River was 4,277.5 m 2 measured in The areal coverage and percentage breakdown per combined river segment for the 2009 TPWD data is presented in Table
146 TABLE 4-14 TEXAS WILD RICE AREAL COVERAGE AND PERCENTAGE OF BREAKDOWN PER COMBINED RIVER SEGMENT FOR THE 2009 TPWD DATA River Segment 2009 Areal coverage (m 2 ) Reach % of total areal coverage Spring Lake Dam to Rio Vista Dam 3, Rio Vista Dam to IH Downstream of IH TOTAL 3, For a complete description of Texas wild-rice historical and present day conditions, see EARIP (2009) or BIO-WEST (2011b). Methods and Discussion The 1976 to 2009 data set (EARIP 2009) was used for this analysis. TPWD has divided the San Marcos River into 14 segments for their annual monitoring. To evaluate the potential for Texas wild-rice over time in each of these segments, the data set was used to select the largest total of Texas wild-rice in any segment regardless of year. Those totals and associated dates are presented in Table 4-15 below. 4-18
147 TPWD River Segment TABLE 4-15 FULL TPWD DATA SET: Areal Coverage (m 2 ) Year Experienced Combined River Segment Reach % of total areal coverage A B C D E F G Spring Lake Dam to Rio Vista Dam (A-D) 3, m Rio Vista Dam to IH-35 (E-G) m H I X J K Downstream of IH- 35 (H-M) m L M Using this approach, the hypothetical total Texas wild-rice areal coverage for the river would have been 4, m 2. A level of conservatism (buffer) was added to this hypothetical total. The level of conservatism selected was to multiply 4, by 1.5 for a new total of 7, m 2. The multiplier of 1.5 is considered a reasonable buffer in that it provides for nearly twice the areal coverage of Texas wild-rice that has actually been recorded since measurements were started nearly three decades ago. This total was then rounded up to 7,500 m 2 and divided by the combined river segment percentages (Table 4-15 above) to come up with the goals set out in Table
148 TABLE 4-16 RECOVERY 1.5 MULTIPLIER GOALS River Segment Areal coverage (m 2 ) Reach percentage of total areal coverage Spring Lake Dam to Rio Vista Dam 5, Rio Vista Dam to IH-35 1, Downstream of IH TOTAL 7, Upon initial evaluation of these goals, it was apparent that the 618 m 2 goal for the lower segment probably was unrealistic considering the affect that the 1998 flood has had on Texas wild-rice s potential for establishment in the lower segment. The greatest amount of Texas wildrice in this segment (combined) using all data (regardless of year) was m 2. The greatest amount observed since the 1998 flood is m 2. Since that 1998 flood event, this lower section has had 12 plus years to establish Texas wild-rice including several transplant efforts (under a variety of high, average, and low flow conditions) and yet it has not been able to sustain 200 m 2, and in 2009 only sustained m 2. Therefore, it was felt that a goal of 618 m 2 for this lower segment would likely not be obtainable without significant channel modification, which likely still left the reach exposed to future flooding impacts. As such, a subsequent analysis was conducted using the same methodology but only considering the post-1998 data which resulted in the data presented in Table 4-17: TABLE 4-17 POST 1998 FLOOD DATA* TPWD River Segment Areal Coverage (m 2 ) Year Experienced Combined River Segment Reach % of total areal coverage A B C D Spring Lake Dam to Rio Vista Dam (A-D) 3, m E Rio Vista Dam to
149 F I35 (E-G) m 2 G H I 0 Post-1998 X 0 Post-1998 J K Downstream of I35 (H-M) m L M 0 Post-1998 *Bold/italics indicates a change from the full data set to the post-1998 data set. Using the Post-1998 TPWD data and the same approach, the hypothetical total Texas wild-rice areal coverage for the river would have been 4, m 2. Taking that number times 1.5 results in m 2. That number was then rounded to 7,000 m 2 and used with the percentages to calculate the goals at the beginning of this section. The following table (Table 4-18) shows the comparison in total areal coverage per combined segment for the two respective data sets. TABLE 4-18 RECOVERY 1.5 MULTIPLIER GOALS POST 1998 DATA River Segment Post flood Areal Coverage (m 2 ) Full Data Set Areal Coverage (m 2 ) Difference (m 2 ) Spring Lake Dam to Rio Vista Dam 5,810 5, Rio Vista Dam to IH , Downstream of IH Total 7,000 7, Because of the inability of Texas wild-rice to re-establish in the lower reaches to the amounts recorded prior to that event under a full range of flow conditions, the Post-1998 data set was selected for use as the lower end of the long-term biological goal range (see Table 4-10). Even 4-21
150 such, the 280 m 2 may be difficult to establish in the lower reach during Phase I as it is a 345 percent increase from 2009 conditions. Second, a review of the Hardy (2010) Texas wild-rice modeling shows that there is enough quality (>0.75 suitable) Texas wild-rice potential habitat in each combined river segment to meet the long-term biological lower end goal (see Table 4-10) by the maximum amount plus multiplier methodology discussed above at the flow ranges considered (45 cfs and above). It needs to be emphasized that this is modeled suitable habitat and not occupied Texas wild-rice area. The current amounts of occupied Texas wild-rice areas within this modeled quality (>0.75 suitable) habitat is lower than the long-term biological goals at all flow ranges discussed (45 cfs and above). This again emphasizes the importance of Texas wild-rice restoration activities to meet the long-term biological goals. Subsequent to the Texas wild-rice analysis described above, TPWD reviewed an analysis conducted by the River Systems Institute based on the Hardy (2010) physical habitat model for Texas wild-rice. Its objective was to alleviate the concern regarding modeled versus occupied habitat and establish an upper end for the long-term biological goal range based on Texas wildrice habitat potential. For this analysis, TPWD evaluated the areal coverage (m 2 ) of non-native species occupying Texas wild-rice habitat in the San Marcos River downstream of Spring Lake Dam at >0.75 suitability in the Hardy (2010) model. The model predicts that approximately 17,140 m 2 of non-native plants occupy potential Texas wild-rice habitat (>0.75 suitability). Realizing that even with outstanding restoration results, establishing Texas wild-rice in all 17,140 m 2 is unlikely, it made the assumption that half of that area or 8,570 m 2 would be available for Texas wild-rice. To establish the upper end of the long-term biological goal range, TPWD then took this number (8,570 m 2 ) added it to their 2010 mapped areal coverage (5,382 m 2 ) for a total of 13,951 m 2. Based on professional judgment on the potential for Spring Lake, an additional 500 m 2 of potential habitat was added bringing the total to 14,451 m 2. This value was then broken down into combined river segments, rounded and entered as the upper end of the long-term biological goal presented in Table 4-10 above. Areal coverage of three times the 2010 coverage (highest amount in recorded history) will not likely be possible within Phase I of the program. However, since Phase I measures will be implemented for the entire HCP period, setting an upper end goal provides the incentive to continue to restore and enhance Texas wildrice within the San Marcos system during Phase II with the ultimate goal of recovery of the species. Finally, the USFWS Recovery Plan areal coverage for Texas wild-rice recommended a range of areal coverage for the species. (USFWS 1996a). Table 4-19 shows the comparison of Post data (maximum amount of Texas wild-rice areal coverage observed in each segment) and the USFWS (1996a) recommendations. 4-22
151 TABLE 4-19 USFWS TEXAS WILD RICE RECOVERY PLAN RECOMMENDATIONS TPWD River Segment Post-1998 Maximum Observed Areal Coverage (m 2 ) 1996 Recovery Plan Recommended Areal Coverage (m 2 )* Percent Difference Spring Lake Not measured 1,500 N/A A , B 2, , C , D E ,293 F G H I 0 30 N/A X 0 50 N/A J ,457 K L ,484 M N/A * Wild-rice plants should be present with at least the following areal coverage and distribution. (USFWS 1996) The areal coverage per segment was calculated to achieve an average cover of 75 percent of the potential wild-rice habitat believed to be present in each segment. This percent cover is typical of that found in healthy, vigorous stands of rice monitored over the last several years. USFWS (1996a) Table 4-20 compares the areal coverage summed over the three described river segments using the maximum amount methodology with and the USFWS recommendations (1996a). It is evident that the 1996 recovery goals are bracketed for each reach by the long-term biological goal recommendation (see Table 4-10) for Texas wild-rice. 4-23
152 Although no minimum goal is specified in the USFWS (1996) recovery plan, a minimum goal is included in the HCP. Fountain Darter Long-term Biological Goals The long-term biological goals for the fountain darter are quantified as areal coverage of habitat within three representative river reaches of the San Marcos system (Figure 4-3) and fountain darter density (population measurement) per aquatic vegetation type. These habitat-based and population measurement goals are presented in Table The population measurement goal is to maintain greater than or equal to the median densities observed per aquatic vegetation type per system over the past 10 years of EAA Variable Flow Study monitoring. 4-24
153 Figure 4-3. Representative Sample Reaches San Marcos Springs 4-25
154 TABLE 4-20 COMPARISON OF BIOLOGICAL GOALS USING DIFFERENT METHODOLOGIES USFWS (1996) Proposed Goals (Maximum Area Approach) Recommended Areal Coverage (no minimum goal specified) Long-term Goal Minimum Goal Long-term Goal* Areal coverage (m 2 ) Reach % of Total areal coverage Areal Coverage (m 2 ) Reach % of total areal coverage Areal coverage (m 2 ) Reach % of total areal coverage River Segment* Spring Lake Dam to Rio Vista Dam 5, ,490 83% 7, Rio Vista Dam to IH % 1, Downstream of IH % 1, Total 7, , % 10,430* 100 *USFWS (1996) also recommended 1,500 m 2 for Spring Lake bringing the overall total to 11,930 m 2. TABLE 4-21 FOUNTAIN DARTER HABITAT (AQUATIC VEGETATION) IN METERS SQUARED (m 2 ) AND FOUNTAIN DARTER MEDIAN DENSITY (NUMBER/M 2 ) PER HABITAT TYPE Fountain darter habitat (aquatic vegetation) in meters squared (m 2 ) Study Reach Hygrophila Ludwigia Cabomba Hydrilla Potamogeton Sagittaria Vallisneria Spring Lake Dam , City Park 200 1, , IH TOTAL 300 1, , Fountain darter median density (number/m 2 ) Hygrophila Ludwigia Cabomba Hydrilla Potamogeton Sagittaria Vallisneria
155 Key Management Objectives The long-term biological goals are accompanied by two key management objectives needed to achieve the long-term biological goals. The management objectives for the fountain darter in the San Marcos Springs/River Ecosystem are (in no particular order): Active native vegetation restoration and protection will be implemented in all three representative study reaches. Restoration activities will extend beyond the study reaches in equal proportion to effort expended per study reach in relation to the total river segment. For example, if 50 percent of the IH-35 study reach was restored, 50 percent of the area from Rio Vista Dam to IH-35 would be subsequently restored. Surface water quality within the San Marcos River should not exceed a 10 percent deviation (daily average) from historically recorded water quality conditions (long-term average) as measured at the water quality monitoring stations for the EAA Variable Flow Study (Figure 4-3). This includes water quality constituents currently measured in the EAA Variable Flow Study to be monitored per Section 5.7.2, excluding water temperature and dissolved oxygen. This objective assumes that a 10 percent deviation in average conditions would be acceptable, however, more extensive work to evaluate the validity of that assumption and to assess water quality tolerances of the fountain darter will be addressed as part of the AMP. Water temperature and dissolved oxygen will be monitored within the representative study reaches and evaluated on an instantaneous basis with established thresholds. Water temperatures <25 C will be maintained throughout the San Marcos system as to not inhibit fountain darter reproduction and recruitment over time. Dissolved oxygen concentrations >4.0 mg/l will be maintained throughout fountain darter habitat. Flow-related Objectives The current level of uncertainty associated with the habitat-based long-term biological goals and the associated restoration and water quality management objectives necessitate the incorporation of flow-related objectives in Table 4-13 above. Historical and Present Day Perspective Aquatic vegetation and fountain darters have been routinely monitored within the representative study reaches (Figure 4-3) since fall The aquatic vegetation and subsequent fountain darter densities have varied over that period (BIO-WEST 2002b-2011b). Table 4-22 breaks out the most current (spring and fall 2010) areal coverage of aquatic vegetation within each reach. (BIO-WEST 2011b). 4-27
156 TABLE 4-22 AREAL COVERAGE OF AQUATIC VEGETATION BY REACH FOUNTAIN DARTER HABITAT (AQUATIC VEGETATION) (m 2 ) Study Reach Hygrophila Ludwigia Cabomba Hydrilla Potamogeton Sagittaria Vallisneria SPRING 2010 Spring Lake Dam City Park 1, , IH TOTAL 1, , FALL 2010 Spring Lake Dam City Park 1, , IH TOTAL 1, ,
157 From review of BIO-WEST (2002b-2011b), it is evident that the aquatic vegetation in the San Marcos system can vary considerably within any given year. As such there are inherent complexities with using habitat measures as long-term goals and thus, they cannot be used independent of long-term monitoring to evaluate these cause-and-effect relationships. For a more comprehensive description of aquatic vegetation in the San Marcos study reaches over the past decade, see EARIP (2009) or BIO-WEST (2002b-2011b). Methods and Discussion Data collected over the past 10 years for the EAA Variable Flow Study was used for this analysis. (BIO-WEST 2002b-2011b). Similar to the Texas wild-rice approach, the maximum amount of each aquatic vegetation type per study reach was selected independent of sample event and vegetation type. For instance, the highest areal coverage of Cabomba in the IH-35 reach was fall 2006, while Spring 2007 had the highest amount of Sagittaria in that same reach. As a starting point, both maximums were used even though they did not occur concurrently. Table 4-23 shows the maximum areal coverage per vegetation type within each study reach over the 10-year study period. An exercise was then conducted to evaluate the total area of each of these study reaches and whether or not these maximum (but not concurrent) values could be supported within a given reach (or if there simply was not enough wetted area). Additionally, the long-term biological goals (areal coverage) for Texas wild-rice were incorporated into this evaluation and subtracted from the total available wetted area. This resulted in adjustments to the fountain darter biological goals for aquatic vegetation. Additionally, aquatic native vegetation restoration efforts were considered for each of the three reaches. For a recovery program, it did not seem appropriate to base long-term biological goals on non-native vegetation maximums. Approximately 20 percent of the non-native Hygrophila and Hydrilla was left in each area as, realistically, it probably is not possible to remove all of it and it does provide a measure of fountain darter habitat. In summary, the Maximum table (immediately above) was transformed into the goals (below in Table 4-24) based on these additional assessments. Finally, a review of the Hardy (2010) fountain darter modeling shows that there would be sufficient quality and quantity of habitat in these reaches at long-term average flows (140 cfs, in this example) to support the biological goals for the fountain darter in the San Marcos system. As part of the HCP long-term monitoring program, these reaches would continue to be monitored semi-annually over time with additional monitoring triggered by either high-flow or low-flow events as described in the EAA Variable Flow Study. Additionally, to ensure the representative nature of each study reach to the San Marcos system, aquatic vegetation mapping of the entire system as well as stratified random fountain darter sampling within designated aquatic vegetation types throughout the entire system will be conducted every two years during Phase I. 4-29
158 TABLE 4-23 MAXIMUM (m 2 ) FOUNTAIN DARTER HABITAT IN SAN MARCOS SPRINGS ECOSYSTEM (AQUATIC VEGETATION) Study Reach Hygrophila Ludwigia Cabomba Hydrilla Potamogeton Sagittaria Vallisneria Spring Lake Dam City Park 1, ,021 1, IH TOTAL 1, ,950 2, TABLE 4-24 PROPOSED GOALS (m 2 ) FOR FOUNTAIN DARTER HABITAT IN SAN MARCOS SPRINGS ECOSYSTEM (AQUATIC VEGETATION) Study Reach Hygrophila Ludwigia Cabomba Hydrilla Potamogeton Sagittaria Vallisneria Spring Lake Dam , City Park 200 1, IH TOTAL 300 1, , *Bold/italics indicates a restoration activity that deviates from the maximum observed. 4-30
159 San Marcos Salamander Long-term Biological Goals The long-term biological goals for the San Marcos salamander include a qualitative habitat component and a quantitative population measurement. As with the fountain darter and riffle beetle, a representative reach approach was employed. From a habitat perspective, the goal is to maintain silt-free habitat conditions via continued springflow, riparian zone protection, and recreation control throughout each of the three representative reaches (Hotel area, Riverbed area, and eastern spillway below Spring Lake Dam) (Figures 4-3, 4-4). Additionally, the population measurement goal is to maintain greater than or equal to the median densities observed over the past 10 years of monitoring. Table 4-25 summarizes long-term biological goals. TABLE 4-25 SAN MARCOS SALAMANDER LONG-TERM BIOLOGICAL GOALS Hotel Area (Spring Lake) Riverbed Area (Spring Lake) Eastern Spillway below Spring Lake Dam Habitat Density (# of salamanders/m 2 ) Silt-free gravel and cobble substrate 90% of each study area Key Management Objectives The long-term biological goals are accompanied by two key management objectives needed to achieve the long-term biological goals. The management objectives for the San Marcos salamander in the San Marcos Springs/River Ecosystem are (in no particular order): Aquatic gardening at similar capacity to what has occurred over the last 10 years in Spring Lake will be continued for the Riverbed Area. This is currently being coordinated and performed by Aquarena Springs personnel. (See Section ) Recreation control will be implemented in the eastern spillway below Spring Lake Dam, particularly at total San Marcos discharge of < 100cfs. (See Section 5.6.1). Flow-related Objectives The current level of uncertainty associated with the habitat-based long-term biological goals and the associated vegetation and recreation management objectives necessitate the incorporation of the flow-related objectives presented above in Table
160 Historical and Present Day Perspective As part of the EAA Variable Flow Study, San Marcos salamander is monitored at two locations within Spring Lake and just below Spring Lake dam. The monitoring occurs near the Hotel, within the Riverbed, and in the eastern spillway below Spring Lake Dam. Figure 4-4. San Marcos salamander sample areas. 4-32
161 Table 4-26 shows the total number of San Marcos salamanders observed at each representative study reach from (Spring and Fall comprehensive sampling). Similar to other species discussed, this data is quite variable across sampling events. TABLE 4-26 SAN MARCOS SALAMANDER DENSITY (#/M 2 ) Sampling Period Hotel Area Riverbed Eastern Spillway Fall Spring Fall Spring Fall Spring Fall Spring Fall Spring Fall Spring Spring Fall Spring Fall Spring Fall Spring Fall
162 Average Methods and Discussion Unlike for the fountain darter with aquatic vegetation, it is more complex to quantify the amount (or areal coverage) of high quality habitat for the San Marcos salamander. High quality habitat consists of a synergy of clean substrates, rock sizes, aquatic vegetation, filamentous algae, with the additional complexity of the salamander s use of subsurface habitat. Because of the almost endless combinations of those parameters and embedded complexity, we have simplified the habitat-based goals to the predominant factors of silt-free substrates, with large gravel and cobble substrates present. The habitat-based component of this goal involves maintaining siltfree substrates (gravels and cobbles) over greater than or equal to 90 percent of the fixed sampling reaches. The salamander sample reaches have predominantly fixed areas as follows: Hotel Area 31 m 2 Riverbed Area 62 m 2 Eastern Spillway 20 m 2 This fixed sample area with a known size allows one to assess the amount of total area that is sustaining high quality habitat conditions as specified in the goal. For the population measurement, data collected over the past decade for the EAA Variable Flow study was used for this analysis. (BIO-WEST 2002a-2011a). The approach involved calculating the minimum, 25 th, median, 75 th, and maximum densities of San Marcos salamanders within the three study sites. The results are shown in Table TABLE 4-27 SAN MARCOS SALAMANDER DENSITIES (#/M 2 ) (all sampling events included) Hotel Area Riverbed Eastern Spillway Minimum th Median th Maximum Professional judgment was employed to determine that the median density would serve as starting point for a long-term biological goal. The habitat and population goals must be met 4-34
163 concurrently to be deemed successful. For instance, should habitat quality degrade surrounding the study area, it is possible that clumping of salamanders into the study reach would occur inflating the densities. However, if habitat was degrading outside of the study area, and the reaches are representative, soon thereafter it would also start to degrade within the representative study area. In this example, for some period of time the density goal could be met while habitat-based requirement of silt-free substrate would have failed. Another example in the other direction is the habitat goal could be met with silt-free substrates, but because of recreational influences (dam and structure building using rocks suitable for salamander habitat), the densities of salamanders might not be attainable. As with the other species, these biological goals require a flexible long-term monitoring and adaptive management process. As such, continued semi-annual monitoring will be implemented at each of the three study areas as part of the HCP. Texas Blind Salamander Long-term Biological Goal Similar to the Comal Springs dryopid beetle and Peck s Cave amphipod, the Texas blind salamander is a subterranean species. An assumption of the HCP is that as subterranean species, mechanisms exist for these species to retreat into the Aquifer should springflows cease at the spring outlets at San Marcos Springs. As such, the long-term biological goal for this subterranean species relates to Aquifer water quality. The water quality goal for the Texas blind salamander is: Not to exceed a 10 percent deviation (daily average) from historically recorded water quality conditions (long-term average) within the Aquifer as measured issuing from the spring openings in Spring Lake. This includes water quality constituents currently measured in the EAA Variable Flow Study. (See Section 5.7.2). To be conservative, the long-term goal assumes that a 10 percent deviation would be acceptable; however, more extensive work to evaluate and assess the validity of that assumption and the water quality tolerances of the Texas blind salamander will be considered in the AMP. Flow-related Objectives The current level of uncertainty associated with the long-term biological goal necessitates the incorporation of the flow-related objectives presented above in Table Coupled with the water quality goal, these flow conditions should provide habitat conditions and food supplies supportive of this Aquifer species. Comal Springs Riffle Beetle Due to the paucity of data for this species in the San Marcos system, it is not possible to establish specific long-term habitat-based biological goals. As such, the HCP assumes that the 4-35
164 flow-related goals presented in Table 4-13 would be protective of this species, until such time as additional information is available. This is a reasonable assumption in that the Comal Springs riffle beetle inhabits similar areas to the San Marcos salamander with similar habitat requirements, and as such, protection of the salamander and its habitat coupled with water quality protection of the aquifer should similarly protect this species. As part of the HCP longterm monitoring program, Comal Springs riffle beetles at San Marcos Springs will be monitored semi-annually over time with additional monitoring triggered by either high-flow or low-flow events as described in the EAA Variable Flow Study. 4.2 Potential Impacts to and Incidental Take of Covered Species The HCP must provide information as to the impacts likely to result from the incidental take of Covered Species for which ITP coverage is requested. (16 U.S.C. 1539(a)(2)(A)(i)). As part of the review of the ITP application, the USFWS must find that the [incidental] taking will not appreciably reduce the likelihood of survival and recovery of the species in the wild. (16 U.S.C. 1539(a)(2)(B)(iv)). In addition, the USFWS in its biological opinion issued to address the incidental take must make the finding that the ITP is not likely to jeopardize listed species or result in destruction or adverse modification of their critical habitat. (16 U.S.C. 1536(a)(2)). Section 9 of the ESA prohibits the take of threatened and endangered species, including the attempt or action to harass, harm, pursue, hunt, shoot, wound, kill, trap, capture, or collect such species. (16 U.S.C. 1532). Habitat modification can result in take if either it actually kills or injures wildlife by significantly impairing essential behavioral patterns, including breeding, feeding or sheltering (See 50 C.F.R (definitions of the term harm )). As part of a February 1, 1993, Judgment (as amended on May 26, 1993) in the case of Sierra Club v. Babbitt (No. MO-91-CA-069, U.S. Dist. Ct., W.D. Texas), the Court ordered the USFWS to make, within 45-days, determinations relative to: (1) the springflow levels at which take of fountain darters and Texas blind salamanders begins at Comal and San Marcos springs, (2) springflows necessary to avoid appreciable diminution of the value of critical habitat of any listed species; (3) the springflow at which Texas wild-rice begins to be damaged or destroyed; (4) the minimum springflow to avoid jeopardy for the fountain darter, San Marcos gambusia, San Marcos salamander and Texas blind salamander; and (5) the springflow levels at which take of San Marcos gambusia and the San Marcos salamander begins at San Marcos Springs. Table 4-28 summarizes the USFWS determinations. 4-36
165 TABLE 4-28 USFWS 1993 DETERMINATION OF MINIMUM SPRINGFLOWS NEEDED TO PREVENT TAKE, JEOPARDY, OR ADVERSE MODIFICATION OF CRITICAL HABITAT Species Take Jeopardy Adv. Mod. Fountain darter in Comal Fountain darter in San Marcos 60 50* 150 San Marcos gambusia San Marcos salamander 50* N/A 100 Texas blind salamander N/A Damage and Destruction Texas wild-rice NOTE: All flow rates are given in cfs. * Refers to San Marcos springflow USFWS explained that, because its take evaluation was conducted with much less data than are normally available, it was forced to base its determination on its best professional judgment and that its determinations were conservative. (Sierra Club v. Babbitt, Springflow Determinations Regarding Take of Endangered and Threatened Species, April 15, 1993) at 2). It further explained that as more information becomes available, the numbers [it was providing] may change to more accurately reflect that best available scientific and commercial information. (Id.) With respect to jeopardy, USFWS reiterated its concern regarding the significant gaps in knowledge. (Sierra Club v. Babbitt, Springflow Determinations Regarding Survival and Recovery and Critical Habitat of Endangered and Threatened Species, June 15, 1993) at 1). It explained that these gaps resulted in a conservative approach regarding the flow estimates. (Id.) USFWS found that flow levels at Comal Springs could be reduced to 60 cfs for short time periods during certain times of the year without jeopardizing the continued existence of the fountain darter if a very effective program to control the giant rams-horn snail was in place and if there was the ability to control the timing and duration of low springflows. The Service also found that short-term reductions in flow levels below 100 cfs might avoid jeopardy for Texas wild-rice, if: (1) exotic species (e.g., nutria) could be effectively controlled, (2) an aquifer management plan is implemented to control timing and duration of lower flows, and (3) the distribution of the species is improved throughout its historic range. The USFWS, however, did not specify what flow levels might be acceptable if those conditions were satisfied. As discussed throughout the HCP and emphasized in EARIP (2008 and 2009), since the USFWS response to the Court s order in 1993, a wealth of information regarding the Covered Species has been collected and analyzed. The purpose of Section 4.3 is to use the best 4-37
166 available scientific information to: (1) estimate the amount of incidental take that may result from the Covered Activities; (2) evaluate the impact of that take on the survival and recovery of the Covered Species; and (3) evaluate the impacts of the Covered Activities, with the proposed minimization and mitigation measures, on the Covered Species Environmental Baseline and Incidental Take Analysis Framework To evaluate whether the incidental take resulting from Covered Activities will appreciably reduce the likelihood of the survival and recovery of the Covered Species, an environmental baseline must be established. The environmental baseline includes the past and present impacts of all Federal, State, or private actions and other human activities in the action area, the anticipated impacts of all proposed Federal projects in the action area that have already undergone formal or early section 7 consultation, and the impact of State or private actions which are contemporaneous with the consultation in process. 3 (50 C.F.R ). To determine whether the effects of the incidental take will appreciably reduce the likelihood of the survival and recovery of the Covered Species, the effects of the action and the cumulative effects 4 must be aggregated with the environmental baseline to see if together likelihood of survival and recovery is appreciably reduced. (Id. at 4-35) Elements of the Environmental Baseline for the HCP In 2010, the EARIP held workshops involving a multi-disciplinary team of biologists to develop influence diagrams regarding the impacts on fountain darters, Texas wild-rice, and the Comal Springs riffle beetle. (See Hardy 2010). These species were believed to be good indicator species for the impacts on other Covered Species. The meeting was facilitated by Ms. Jean Cochrane of the United States Geophysical Survey using Strategic Decision-Making principles. The influence diagrams were developed by consideration of both intrinsic and extrinsic factors affecting these species. Figures 4-5 a, b, and c are examples of the influence diagrams developed in the workshops on the factors related to direct mortality of the species. A full set of the diagrams can be found in Hardy The analysis of the impacts of take was conducted for each of the fish and wildlife Covered Species at Comal and San Marcos springs. As previously discussed in Section , Texas wild-rice does not require a take assessment under federal law as it is a plant species, but the impacts of the Covered Activities, with the minimization and mitigation measures that will be implemented, will be analyzed with respect to whether they are likely to jeopardize the continued existence of Texas wild-rice. Accordingly, information related to this analysis is presented in Section below. 3 The environmental baseline is a snapshot of a species health at a specified point in time. (USFWS and NMFS, 1998). It includes the effects of past and ongoing human and natural factors leading to the current status of the species. (Id.). 4 The term cumulative effects means those effects of future State or private activities, not involving Federal activities, that are reasonably certain to occur within the action area. (50 C.F.R ). 4-38
167 Water Quality (temp, DO, spills) Invasive Animals (snails) Water Quantity (velocity, depth) Invasive Animals (fish) (fish) Parasites & Diseases Total Fish Populations Invasive Vegetation Predation/ Competition Habitat Occupied Figure 4-5a: Direct mortality factors affecting the fountain darter and its habitat. Groundwater Recharge Pumping Point Pollution Non-Point Pollution Springflow Water Quantity Total Beetle Population Water Quality Invasive Species Habitat Occupied Figure 4-5b: Direct mortality factors affecting the Comal Springs riffle beetle and its habitat 4-39
168 Invasive Vegetation Invasive Animals Floating Mats Herbivory Recreation Trampling Water Quality Water Quantity Sediment Accumulation Habitat Occupied Figure 4-5c: Direct mortality factors affecting Texas wild-rice. From the influence diagrams and other studies, it appears that the principal impacts for purposes of the baseline are: water quantity, water quality, invasive animal and plant species, sediment accumulation, and recreational impacts. Water Quantity Recharge and pumping from the Aquifer are factors affecting water quantity (springflow). SB 3 allows up to 572,000 ac-ft of annual permitted withdrawals from the aquifer. These withdrawals are subject to Critical Period Management reductions. (See ). SB 3 was not effective until September 1, From 2008 through 2010, Initial Regular Permit withdrawals were 408,178 ac-ft, 377,255, ac-ft and 354,081 ac-ft. (EAA 2010b;, EAA (2011). Over the last 11 years ( ) total pumping has averaged 381,218 ac-ft, with a maximum total pumping of 456,500 ac-ft in 2006 and a minimum total pumping of 317,400 ac-ft in (EAA 2010; see Section ). The factors affecting water quantity also include Department of Defense (DoD) pumping and exempt withdrawals for domestic and livestock use. From 2000 through 2009, the domestic and livestock withdrawals averaged 13,600 ac-ft. (EAA 2010b). In 2009, unpermitted federal wells accounted for 6,907 ac-ft in withdrawals EAA 2009) and 5,128 ac-ft in 2010 (personal communication, Rick Illgner, EAA). These withdrawals are not subject to the EAA Critical Period Management reductions. 4-40
169 Data for 2009 from EAA s Hydrogeologic Data Report (2010) indicate an average annual groundwater recharge of 717,500 ac-ft for the period of record , and an even higher annual average of 965,400 ac-ft during the last ten year period (See Section ). Water Quality Water quality at San Marcos and Comal springs is influenced by both groundwater and surface water. Principal threats include stormwater runoff and releases of contaminants. Land use changes over the recharge area and/or watersheds adjacent to the springs can degrade the quality of stormwater runoff. The release of contaminants (point source and non-point source) in the recharge areas that potentially can be discharged or released to the springs, directly or indirectly, is another major threat. The groundwater of the Aquifer has historically been considered to be of high quality. (See Section 3.3.2). Each year the EAA monitors the quality of water in the Aquifer by sampling approximately 80 wells, eight surface water sites, and major spring groups across the region. Tests for the wells included measurements of temperature, ph, conductivity, alkalinity, major ions, minor elements (including heavy metals), total dissolved solids, nutrients, pesticides, herbicides, VOCs, and other analytes. This well sampling does not indicate contamination in the Aquifer. However, elevated nitrate detections (greater than two mg/l) were present in 16 of the 79 wells sampled. Metals were detected above a regulatory limit in several of the 79 wells sampled. Although the quality of the water in the Aquifer is generally good, man-made contaminants, such as pesticides and solvents, have been found in streams that recharge the Aquifer, and in the Aquifer itself. Most of the contaminants are found in urbanized areas, and most of them appear to be derived from non-point sources. Invasives Gill parasites, non-native plants, and invasive animal species also impact the Covered Species. A major concern in the Comal Springs ecosystem is the presence of an Asian trematode, Centrocestus formosanus. The parasite attaches to the fish s gill filaments causing extensive gill tissue proliferation and damage (Mitchell et al. 2000) with mortality in the wild being reported following the discovery in 1996 (Tom Brandt, personal communication). This trematode, which affects the gills of numerous fish species, including fountain darters, has been found at higher levels in fish from the Comal River than from the San Marcos River (Fuller and Brandt 1997). The parasite is present in the San Marcos River at low levels and is not currently considered as a threat to the fountain darter. The giant rams-horn snail, an aquarium species that was first discovered in the San Marcos River in 1983 and in Landa Lake in 1984 poses a potential threat to Covered Species in both the Comal and San Marcos rivers ecosystems. (McKinney and Sharp 1995). This snail grazes on aquatic plants and in the 1990s played a major role in reducing plant growth. (Horne et al. 1992). The snails thrive in low flow conditions, and could add significantly more stress on spring associated ecosystems in time of drought. The population of rams-horn snails in these systems has diminished since the mid-1990s, however the potential for a population resurgence and 4-41
170 alteration of the plant communities in these two systems remains, and could affect the habitat of the Covered Species. (McKinney and Sharp 1995). Studies have shown that many fishes (especially small fish) have very similar food habitats (Hubbs et al. 1978). If non-native species are added to the aquatic ecosystems, greater competition or overlap among species is possible as these non-native species may be able to acquire resources with greater efficiency than native species (USFWS 1984). Aquarium dumps and the use of non-native live bait have added species such as tilapia and the suckermouth catfish to both the Comal and San Marcos systems. Scouring due to floods and sustained high flows have allowed non-native plants to occupy habitat in both the San Marcos and Comal systems. Three non-native plant species, hydrilla (Hydrilla verticillata), West Indian hygrophila (Hygrophila polysperma), and elephant ear (Colocasia esculenta) have significantly altered both ecosystems. Vegetation mats interfere with Texas wild-rice by impeding flowering and reproduction, blocking sunlight, interfering with photosynthesis, and slowing current velocity. (Power 1996). Sediment Accumulation Sediment has accumulated in the two spring systems due to the installation of flood control dams, urbanization and natural processes. These accumulations have altered the river s morphology and natural flow patterns. In addition, deposition of sediments on or around Texas wild-rice stands causes direct mortality by smothering or burying stands. Recreational Impacts Recreation is a factor affecting Texas wild-rice due to trampling and physical removal ofthe plants. (Bradsby 1994; Breslin 1997). Fountain darters can be impacted by increasing turbidity and the physical destruction of their habitat. (EARIP 2009). Recreational activities such as tubing, boating, allowing pets in the water, diving and snorkeling can result in these impacts. The effect of these factors is greater at lower flows. (Id.). Recreation can also impact other Covered Species, such as the San Marcos salamander by physically disturbing their habitat. (Id.). The minimization and mitigation measures are expected to effectively reduce most of the impacts on habitat. The specific measures addressing each impact are illustrated in Figures 4-6 a-c below along with a citation to the relevant section of the HCP where the measures are described. 4-42
171 5.2.7 and 5.3.4: Prohibition of Hazardous Materials Transport Across the Comal and San Marcos Rivers 5.4.9: Management of Golf course and Grounds 5.7.1: Native Riparian Habitat Restoration 5.7.2: Expanded Water Quality Monitoring 5.7.3: Septic System Registration and Permitting Program 5.7.4: Minimizing Impacts of Contaminated Runoff 5.7.5: Management of Household Hazardous Wastes 5.7.6: Impervious Cover/Water Quality Protection 5.2.4: Decaying Vegetation Removal and Dissolved Oxygen Management 5.2.6: Non-Native Snail Removal Program and Gill Parasite Monitoring 5.1.2: VISPO 5.1.3: Regional Water Conservation Program, 5.1.4: Critical Period Management Stage V, 5.5.1: Use of the SAWS ASR for Springflow Protection 5.5.2: Phase II Expanded Use of the SAWS ASR and Water Resources Integration Program Pipeline 5.3.5, and : Reduction of Non-Native Species Introduction and Live Bait Prohibition, 5.25 and 5.3.9: Control of Harmful Non-Native and Predator Species, : Reduction of Non-Native Species Introduction Water Quality (temp, DO, spills) Invasive Animals (snails) Water Quantity (velocity, depth) Invasive Animals (fish) (fish) Parasites & Diseases Total Fish Populations Invasive Vegetation Predation/ Competition 5.2.2: Native Aquatic Vegetation Restoration and Maintenance 5.3.8: Control of Non- Native Plant Species 5.4.3: Management of Vegetation : Control of Non- Native Plant Species Habitat Occupied 5.3.5: Reduction of Non- Native Species Introduction 5.2.9: Reduction of Non- Native Species Introduction and Live Bait Prohibition : Control of Harmful Non-Native and Predator Species 5.2.1: Flow-Split Management in the Old and New Channel 5.2.2: Native Aquatic Vegetation Restoration and Maintenance 5.2.3: Management of Public Recreational Use of Comal Springs and River Ecosystems 5.3.7: Designation of Permanent Access Points/Bank Stabilization Figure 4-6a: Minimization and Mitigation Measures for fountain darter impacts
172 5.1.2: VISPO 5.1.3: Regional Water Conservation Program 5.5.1: Use of the SAWS ASR for Springflow Protection 5.5.2: Phase II Expanded Use of the SAWS ASR and Water Resources Integration Program Pipeline Groundwater Recharge Pumping 5.2.8: Native Riparian Habitat Restoration Point Pollution 5.2.3: Management of Public Recreation Use of Comal Springs and River Ecosystems, and 5.3.3: Litter Collection and Floating Vegetation Management, 5.3.2: Control of Recreation in Key Areas, 5.3.7: Designation of Permanent Access Points/Bank Stabilization, 5.4.9: Management of Golf Course and Grounds, 5.7.4: Minimizing Impacts of Contaminated Runoff 5.7.5: Management of Household Hazardous Wastes and 5.3.4: Prohibition of Hazardous Materials Transport Across the Comal and San Marcos Rivers 5.7.3: Septic System Registration and Permitting Program 5.7.6: Impervious Cover /Water Quality Protection 5.7.1: Native Riparian Habitat Restoration 5.2.4: Decaying Vegetation Removal and Dissolved Oxygen Management 5.7.2: Expanded Water Quality Monitoring Non-Point Pollution Springflow Water Quantity Total Beetle Population Water Quality Invasive Species Habitat Occupied 5.2.2: Native Aquatic Vegetation Restoration and Maintenance, 5.2.9: Reduction of Non-Native Species Introduction and Live Bait Prohibition and : Reduction of Non-Native Species Introduction and : Control of Non-Native Plant Species 5.3.5: Reduction of Non-Native Species Introduction, : Control of Harmful Non- Native and Predator Species Figure 4-6b: Minimization and Mitigation Measures For the Comal Springs riffle beetle impacts 4-44
173 5.3.1: Texas Wild-Rice Enhancement and Restoration and : Reduction of Non-Native Species Introduction and : Control of Non-Native Plant Species, 5.4.3: Management of Vegetation 5.7.1: Native Riparian Habitat Restoration Management of Aquatic Vegetation and Litter below Sewell Park : Management of Submerged and Floating Aquatic Vegetation in Spring Lake : Management of Aquatic Vegetation from Sewell Park to City Park 5.3.5: Reduction of Non-Native Species Introduction and : Control of Harmful Non-Native and Predator Species : Control of Harmful Non-Native and Predator Species Invasive Vegetation Floating Mats Herbivory and 5.4.2: Control of Recreation in Key Areas, 5.3.7: Designation of Permanent Access Points/ Bank Stabilization 5.4.7: Diving Classes in Spring Lake 5.4.8: Research Programs in Spring Lake, : Boating in Spring Lake and Sewell Park 5.6.1: State Scientific Areas Invasive Animals Recreation Trampling 5.3.4: Prohibition of Hazardous Materials Transport Across the San Marcos River and Its Tributaries 5.4.9: Management of Golf Course and Grounds 5.7.2: Expanded Water Quality Monitoring 5.7.3: Septic System Registration and Permitting Program 5.7.4: Minimizing Impacts of Contaminated Runoff 5.7.5: Management of Household Hazardous Wastes, 5.7.6: Impervious Cover/ Water Quality Protection Water Quality Water Quantity Sediment Accumulation 5.3.6: Sediment Removal below Sewell Park 5.4.4: Sediment Removal in Spring Lake and Sewell Park (upper and lower) 5.4.6: Sessom Creek Sand Bar Removal Habitat Occupied 5.1.2: VISPO, 5.1.3: Regional Water Conservation Program, 5.1.4: Critical Period Management - Stage V, 5.5.1: Use of the SAWS ASR for Springflow Protection 5.5.2: Phase II Expanded Use of the SAWS ASR and Water Resources Integration Program Pipeline Figure 4-6c: Minimization and Mitigation Measures for Texas wild-rice. 4-45
174 Because the minimization and mitigation Measures are new, additional measures designed to reduce existing adverse impacts on water quality, invasive animal and plant species, recreation, and sedimentation, the aspects of the baseline conditions addressed by those measures can reasonably be expected to improve relative to the existing conditions Role of the Environmental Baseline in the Appreciable Reduction Analysis Figure 4-7 is a depiction of a generic approach for the analytic process for the appreciable reduction in the likelihood of survival and recovery issuance criterion. To determine whether the effects of the incidental take will appreciably reduce the likelihood of the survival and recovery of the Covered Species, the effects of the Covered Activities and minimization and mitigation measures and the cumulative effects are aggregated with the environmental baseline. Figure (Adapted from presentation of Adam Zerrener, May 18, 2010). As discussed below, as a general matter, the characterization of a reasonable baseline is a key factor in such an analysis. The generic approach to this analysis works very well where a new proposed action is being added to the baseline. It is more difficult here where the current status of the Covered Species can fluctuate dramatically depending on the amount of recharge and pumping. Table 4-29 sets out the total withdrawals from the Aquifer from 2000 through In response to the Court s judgment in Sierra Club v. Lujan, in May 1993, the Texas Legislature directed EAA to cap the withdrawals authorized by permits to 450,000 ac-ft annually, but required EAA to 4-46
175 limit withdrawals to 400,000 ac-ft by December 31, 2007, by proportionally reducing issued permits or by purchasing and retiring issued permits. In 2007, the Texas Legislature raised the pumping cap to 572,000 ac-ft (effective September 1, 2007). YEAR Total Pumping (1000 ac-ft) Estimated Groundwater Recharge to the Edwards Aquifer (1000 ac-ft) Average Pumping and Recharge Table Total Withdrawals from the Aquifer (EAA 2010; personal communication, Rick Illgner, EAA (2010 data)). Total pumping from the Aquifer averaged 381,000 ac-ft from 2000 through In the eight years prior to SB 3 s enactment (2000 through 2007), total pumping averaged 374,500 ac-ft, with a maximum total pumping of 454,500 ac-ft in 2006 and a minimum total pumping of 317,400 ac-ft in (EAA 2009a). To analyze the effect of incidental take, the HCP will utilize two approaches with respect to water quantity aspects of the baseline: a no action and existing conditions baseline. The no action approach assumes that none of the flow protection measures in the HCP are being 5 Groundwater recharge between 1934 and 2009 averaged 717,500 ac-ft. (See Section 3.3.3). 4-47
176 implemented but that pumping at the full amount allowed by SB 3 (572,000 ac-ft) will occur subject to the existing critical period management requirements and that non-permitted exempt pumping will also occur. 6 The assumption of full pumping of the permitted amount does not reflect current pumping levels. In this respect, the No Action Baseline does not fall squarely within the definition of environmental baseline. While it is a past state action, the SB 3 withdrawal cap currently has had no impacts that can be evaluated in the baseline. (See 50 C.F.R (defining the environmental baseline as the past and present impacts of all Federal State and private actions and other human activities in the action area. )(emphasis added)) Further, the 572,000 ac-ft pumping cap neither contributes to a snapshot of the current health of the species nor is it a factor that [lead] to the current status of the species. (See, supra, n. 3). 7 To provide a comparison of the effects of the Covered Activities with the flow protection minimization and mitigation measures in place to a baseline that more realistically reflects the current impacts of past and present pumping, a second baseline, the Existing Baseline, was developed. This baseline assumes total pumping of 381,000 ac-ft, the average total level of pumping over the period from Comparisons of the Hydrographs of the No Action and Existing Baselines with the HCP Comal Springs Figure 4-8 compares the modeled, total monthly average springflow projected at Comal Springs for the time period for the No Action Baseline, Existing Baseline, and the Phase 1- Covered Activities with springflow protection measures. (HDR 2011). For comparison, the actual historical monthly average springflows at Comal Springs are also presented. The HCP Phase II results are not depicted in Figure 4-8 for the entire modeled period as they essentially mirror the Phase I results outside of the drought of record. 6 As discussed above in Section 1.6, this approach also is not a true no action alternative because EAA s enabling legislation requires it, by December 31, 2012, to implement and enforce management practices, procedures, and methods to ensure that, not later than December 31, 2012, the continuous minimum springflows of the Comal Springs and the San Marcos Springs are maintained to protect endangered and threatened species to the extent required by federal law. (EAA Act 1.14(h)). That deadline has not arrived, and the EAA has not made a specific determination as to how it would satisfy this requirement. Thus, it is difficult to substitute a flow number in the No Action Baseline as a surrogate for the continuous minimum flow requirement. (See Section 1.6). 7 As discussed further below, a simulation of the hydrograph of the historical record shows that with the No Action Baseline, the Covered Species, at least at Comal Springs, are likely to be extirpated because the springs cease to flow for approximately 38 months and will be significantly adversely affected, if not extirpated, at San Marcos Springs. Accordingly, almost any Covered Activities with minimization and mitigation measures which ensures minimum continuous springflow probably would not appreciably reduce the likelihood of the survival and recovery of the Covered Species even if the effects of those actions and measures would themselves jeopardize the survival and recovery of those species. 4-48
177 The most sensitive period for the Covered Species at Comal Springs occurs during the drought of record. Figure 4-9a compares the modeled, total monthly average springflow projected at Comal Springs for the time period for the No Action Baseline, Existing Baseline, and HCP (Phase I and II), along with the historically observed conditions. (HDR 2011). To assess daily average conditions, the monthly average springflows were converted to daily average flows. (Id.). HDR (2011) analyzed existing discharge data for Comal Springs and concluded that at a total Comal discharge below 100 cfs, a 15 cfs plus or minus adjustment is warranted to convert a monthly average to a daily average. For example, to achieve a 30 cfs daily average at Comal Springs, as specified in the Management Objectives (Table 4-2), a monthly average flow of 45 cfs would be necessary. 4-49
178 Jan-47 Jan-49 Jan-51 Jan-53 Jan-55 Jan-57 Jan-59 Jan-61 Jan-63 Jan-65 Jan-67 Jan-69 Jan-71 Jan-73 Jan-75 Jan-77 Jan-79 Jan-81 Jan-83 Jan-85 Jan-87 Jan-89 Jan-91 Jan-93 Jan-95 Jan-97 Jan-99 Springflow (cfs) 500 Comal Springs No Action Baseline Existing Baseline HCP Historical Figure 4-8. Modeled Comal Total Springflow for No Action Baseline, Existing Baseline, and HCP (Phase I) for model period 4-50
179 Jan-47 Jul-47 Jan-48 Jul-48 Jan-49 Jul-49 Jan-50 Jul-50 Jan-51 Jul-51 Jan-52 Jul-52 Jan-53 Jul-53 Jan-54 Jul-54 Jan-55 Jul-55 Jan-56 Jul-56 Jan-57 Jul-57 Springflow (cfs) 500 Comal Springs No Action Baseline Existing Baseline HCP - Phase I Phase II Historical Figure 4-9a. Modeled Comal Total Springflow for No Action Baseline, Existing Baseline, and HCP (Phase I and II) for model period 4-51
180 Table 4-30 summarizes springflow statistics from Figure 4-9(a) that are relevant to the analysis of the flows relative to the Comal flow-related management objectives described in Table 4-2. TABLE 4-30 COMAL SPRINGS TOTAL DISCHARGE STATISTICS FOR THE MODELED NO ACTION BASELINE, EXISTING BASELINE, AND HCP (PHASE I and II) ALONG WITH THE HISTORICALLY OBSERVED DISCHARGE FROM SPRINGFLOW STATISTICS (Evaluated for ) No Action Baseline Existing Baseline SCENARIO HCP Phase I Phase II Historical Minimum Monthly (cfs) Minimum Rolling 6 month Average (cfs) Long-term Average (cfs) cfs cfs Number of Months below 80 cfs cfs cfs cfs cfs 3,510 2,850 2,760 2,760 1,063 Largest Consecutive number of Days below (approximated for modeled monthly flows) 120 cfs 2,790 2,760 2,370 2, cfs 1,650 1, cfs 1,230 1, cfs cfs Green shaded boxes represent Phase II minimum flow improvements over Phase I. 4-52
181 0 cfs Continuous Minimum Springflow The minimum monthly springflow projected for the HCP Phase 1 is 27 cfs 9 and is one of only two months that is projected to fall below 30 cfs on a monthly average. (Table 4-30). By comparison, the No Action Baseline and Existing Baseline are both projected to go to zero flow for over three years. The projection that the Phase I package will maintain continuous minimum springflow is a key factor in the assessment that Covered Activities and springflow protection measures offered by the HCP will provide a significant benefit to the Covered Species at Comal Springs. The HCP during Phase I, however, falls short of achieving the minimum Comal Springs flow objective of 30 cfs daily average. Figure 4-9b highlights when the shortfalls are predicted to occur. 9 The City of New Braunfels has a diversion used for irrigation water for its Landa Park Golf Course. (See Section 2.3.3). The total diversion rate allowed is 2 cfs. (Id.). Thus, the minimum flows could be 2 cfs less than the projected 27 cfs during a repeat of the drought of record. Taking the Phase I lowest modeled monthly flow of 27 cfs and subtracting the daily average adjustment factor of 15 cfs leaves 12 cfs in the Comal system. At this total discharge level, the flow-split management would send all 12 cfs Old Channel for the protection of fountain darter habitat within the ERPA and downstream. The potential impacts of such a low flow is minimized because the diversion is well downstream of the Old Channel ERPA and habitat and water temperature impacts would be limited in these downstream areas. 4-53

182 Figure 4-9b. Modeled HCP Phase I Comal Total Discharge relative to the flow-related management objective. During drought of record-like conditions with Phase I flow-related measures implemented, summer periods for three years would fall just short of the 45 cfs monthly average (converted from the management objective of 30 cfs daily average). Additionally, the higher flows (management objective of 80 cfs daily average converted to 95 cfs monthly average for Figure 4-9b) for three months following any six month minimum period would also fall short as depicted in Figure 4-9b. By comparison, Phase II achieves the minimum Comal Springs flow management objective of 30 cfs daily average but is not projected to meet the 80 cfs higher flows for 3 months following the lower flow periods (Figure 4-9c). 4-54

183 Figure 4-9c. Modeled HCP Phase II Comal Total Discharge relative to the minimum flow management objective. During the historical conditions, the fountain darter was extirpated from the Comal system but the other Covered Species were not. The shortfalls described in Figures 4-9b and 4-9c are not considered to be a detriment to the Comal Springs dryopid beetle, Edwards Aquifer diving beetle, Peck s Cave amphipod, or Comal Springs salamander. A key reason for the 80 cfs higher flow periods following extended minimum conditions is to provide surface flow in Spring Run 3 and break up the periods of extended low flows in the system. As discussed in the longterm average section below, the results of this flow management objective shortfall (Figures 4-9b and 4-9c) is currently unknown relative to the Comal Springs riffle beetle spring run populations. However, the improvement of minimum flows relative to historical conditions and the overall projected habitat remaining along the western shoreline and around Spring Island (see Section ) is considered sufficient to support the survival of the Comal Springs riffle beetle in the Comal system during Phase I AMP activities. Relative to the fountain darter, the high quality habitat to be maintained in the Old Channel ERPA and in Landa Lake during this three year period will be adequate to support seasonal reproduction and survival of the fountain darter. Further, the documented ability for fountain darter habitat to recover quickly with a return to more normal discharge conditions was a key factor in determining the potential for recovery. An additional factor is that within the seven years of Phase I, it is not possible to have multiple, extended drought of record-like conditions. Long-Term Average Flows 4-55
184 Although the minimum flows should not be a concern, the overall health of the system going into those periods needs further evaluation before such a conclusion can be reached with respect to the projected long-term average flows. The flow-related measures in the HCP (Phase I and II) are projected to achieve a long-term average of 196 cfs compared to the current Management Objective of 225 cfs for a long-term average at Comal Springs. (Table 4-2). At this time, it is uncertain whether 196 cfs as a long-term average would be supportive of the conditions necessary to rejuvenate the system to the degree that would be necessary to prepare the system for repeated low-flow periods or extended low-flow periods. This rejuvenation of habitat is important not only to the fountain darter, but to all Covered Species at Comal Springs. This question will be examined in the AMP. In addition, the projected extended periods of consecutive days below 150 cfs, 120 cfs, and 80 cfs for the HCP will require additional evaluation during the Phase I AMP. Each of those three flow levels is a take threshold. At 150 cfs, take for the fountain darter starts to occur in the Upper Spring Run reach. At 120 cfs, Spring Runs 1 and 2 start to constrict and go subsurface, and below 80 cfs Spring Run 3 also constricts and goes subsurface. Relative to the fountain darter, during the drought of record the system was below 150 cfs for 1,063 straight days (nearly 3 years). With the Phase I and Phase II flow-related measures in the HCP, the consecutive period below 150 cfs is projected to be approximately 2,760 days (or over 7.5 years). That is longer than the Phase I period itself, and approximately 3 times the life span of a fountain darter in the wild. With respect to the Comal Springs riffle beetle, during the drought of record, springflow in the Spring Runs 1 and 2 were below 120 cfs for 750 consecutive days (just over 2 years straight) and the riffle beetle as well as the other Covered invertebrate species survived. However, even with the flow-related measures (Phase I and II), flows below 120 cfs are projected for approximately 2,400 consecutive days (over 6.5 years). During Phase I, applied research on the effects of low flows on the species and their habitat will be conducted, mechanistic ecological models with be developed and applied, and the MODFLOW model used to simulate the effects of the Phase I package will be improved. Until the Phase I AMP decision-making process is complete, it will not be known what durations might be acceptable or the amount of additional flows that might be needed. To address the need now to demonstrate the ability to achieve the current Comal System minimum flow objective, the Applicants have committed to implement a presumptive action that, when combined with the Phase I activities, is adequate to achieve the current minimum flow Objective if such an action is needed. In summary, incidental take of the Covered Species at Comal Springs will occur under the HCP and uncertainty regarding extended periods of low-flow is present should a repeat of drought of record-like conditions occur for the entire Phase I period. However, considering the low risk of that occurrence and the improvements over baseline that the HCP provides regarding minimum flows, the Phase I package is not anticipated to appreciably reduce the likelihood of survival of the Covered Species at Comal Springs or affect their potential for recovery. With the AMP activities scheduled during Phase I and the presumptive action to meet the minimum flow objective during Phase II, incidental take will continue to occur during Phase II, but should not 4-56
185 appreciably reduce the likelihood of survival of the Covered Species at Comal Springs or affect their potential for recovery. San Marcos Springs Figure 4-10a depicts the modeled, total monthly average springflow projected at San Marcos Springs for the time period for the No Action Baseline, Existing Baseline and the HCP (Phase I - springflow protection measures). (See HDR 2011). For comparison the actual observed monthly average springflows at San Marcos Springs are also presented. The HCP Phase II results are not depicted in Figure 4-10a for the entire modeled period as they essentially mirror the Phase I results outside of the drought of record. The most critical period for the Covered Species at San Marcos Springs occurs during the modeled condition surrounding the drought of record. Figure 4-10b compares the modeled, total monthly average springflow projected at San Marcos Springs for the time period for the No Action Baseline, Existing Baseline, and HCP (Phase I and II), along with the historically observed conditions. (Id.). To assess daily average conditions, the monthly average springflows were converted to daily average flows. (Id.). A detailed analysis of existing discharge data for San Marcos Springs concluded that at Total San Marcos Discharge below 100 cfs, a 7 cfs plus or minus adjustment is warranted relative to converting a monthly average to a daily average. HDR (2011). For example, to achieve a 45 cfs daily average as specified in the Flow-Related Management Objectives (Table 4-13), a monthly average flow of 52 cfs would be necessary. 4-57
186 Jan-47 Jan-49 Jan-51 Jan-53 Jan-55 Jan-57 Jan-59 Jan-61 Jan-63 Jan-65 Jan-67 Jan-69 Jan-71 Jan-73 Jan-75 Jan-77 Jan-79 Jan-81 Jan-83 Jan-85 Jan-87 Jan-89 Jan-91 Jan-93 Jan-95 Jan-97 Jan-99 Springflow (cfs) 500 San Marcos Springs No Action Baseline Existing Baseline HCP Historical Figure 4-10a. Modeled San Marcos Total Springflow for No Action Baseline, Existing Baseline, and HCP (Phase I) for model period. (Historical record starts in summer 1956 following gage installation) 4-58
187 Jan-47 Jul-47 Jan-48 Jul-48 Jan-49 Jul-49 Jan-50 Jul-50 Jan-51 Jul-51 Jan-52 Jul-52 Jan-53 Jul-53 Jan-54 Jul-54 Jan-55 Jul-55 Jan-56 Jul-56 Jan-57 Jul-57 Springflow (cfs) 250 San Marcos Springs No Action Baseline Existing Baseline HCP - Phase I Phase II Historical Figure 4-10b. Modeled San Marcos Total Springflow for the No Action Baseline, Existing Baseline, and HCP (Phase I and II) for model period. (Historical record starts in summer 1956 following gage installation) 4-59
188 Table 4-31 summarizes certain springflow statistics from Figure 10a that are relevant to the Total San Marcos Discharge Management Objectives described in Table TABLE 4-31 SAN MARCOS SPRINGS TOTAL DISCHARGE STATISTICS FOR THE MODELED NO ACTION BASELINE, EXISTING BASELINE, AND HCP (PHASE I and II) ALONG WITH THE HISTORICALLY OBSERVED DISCHARGE FROM SPRINGFLOW STATISTICS (Evaluated for ) No Action Baseline Existing Baseline SCENARIO HCP Phase I Phase II Historical Minimum Monthly (cfs) Minimum Rolling 6 month Average (cfs) Long-term Average (cfs) cfs * Number of Months below 80 cfs * 50 cfs * 30 cfs * 10 cfs * Largest Consecutive number of Days below (approximated for modeled monthly flows) 100 cfs 1,215 1,215 1,125 1,125 * 80 cfs 1,020 1, * 50 cfs * 30 cfs * 10 cfs * 0 cfs * * Not an equal comparison to calculate the number of months below or longest consecutive days for the observed springflows as the gage was not active until May 1956 when the greatest number of months below and longest consecutive days for all modeled runs occurs from 1954 through
189 Continuous Minimum Springflow The minimum monthly springflow projected for the Phase I Package is 50.5 cfs and is one of only two months that is projected to fall below the Management Objective of 52 cfs on a monthly average (50.5 and 51.5 cfs monthly averages). By comparison, the No Action Baseline and Existing Baseline are projected to decline to a 2 and 5 cfs monthly average, respectively. The HCP Phase I is not projected to have a monthly average less than 50 cfs, while the No Action Baseline projects 19 months below 50 cfs and the Existing Baseline projects 17 months below 50 cfs. Phase II provides an improvement over Phase I in that no months fall below the 52 cfs San Marcos minimum flow management objective. 10 That the projected springflow closely approximates the minimum flow objective is a key factor in the impact assessment in that Covered Activities and springflow protection measures offered by the HCP will provide a significant benefit to the Covered Species at San Marcos Springs from a minimum flow perspective. Although Phase II meets the minimum flow management objective, neither Phase I or Phase II meet the higher flows (management objective of 80 cfs daily average converted to 87 cfs monthly average for Figure 4-10c) for three months following any six month minimum period. Figure 4-10c highlights when the shortfalls are predicted to occur. 10 Under TCEQ Certificates and , Texas State University s total diversion rate from the headwaters of the San Marcos River for consumptive use is limited to 8.1 cfs. (See Section 2.5.5). The total diversion rate from Spring Lake is limited to 4.88 cfs; the total diversion rate from the San Marcos River at Sewell Park is limited to 3.22 cfs. (Section and respectively). Texas State will reduce the rate of diversion by 2 cfs at flows of 80 and 60 cfs and suspend the diversion of water entirely at 45 cfs based on a daily average. (See Section 4.5.4). Thus, Texas State s diversions will not affect the projection that the flows at San Marcos during Phase I will not fall below the minimum flow management objective. 4-61
190 Figure 4-10c. Modeled HCP Phase I and Phase II San Marcos Total Discharge relative to the higher flows component of the minimum flow objective. A discussion of the potential effects of not achieving this component of the management objective is discussed in the long-term average section below. Long-Term Average Springflow Unlike for the Comal System where the long-term average Flow Management Objective is not met by the HCP, the 154 cfs long-term average projected for the HCP at San Marcos is greater than the Management Objective of 140 cfs. Therefore, the overall health of the system going into these limited minimum flow conditions should be protected by springflow and additional mitigation and minimization measures and subsequently, the ability of the system to rejuvenate quickly following said events will also be benefited by a long-term average of greater than the Management Objective. Although the projected long-term average flows are not concerns, the extended periods of consecutive daily average flows under 100 cfs and 80 cfs were examined. At 100 cfs, take for the fountain darter and impacts to Texas wild-rice have been documented. At 80 cfs, take is anticipated for the San Marcos salamander. Unfortunately, there is not a duration factor (i.e, memory) incorporated into any of the basic habitat modeling conducted for the incidental take analysis presented below. As such, a future evaluation of these potential impacts will be addressed with Phase I applied research and mechanistic ecological modeling. In the interim, 4-62
191 the amount of high quality habitat predicted by Hardy (2011) for the fountain darter at flows between 50 and 100 cfs coupled with recreation control in key areas provides comfort that the fountain darter will tolerate these extended periods of flows in this range. The majority of San Marcos salamander habitat is in Spring Lake and thus, the assessment of 50 to 100 cfs applies mainly to the small area of salamander habitat below Spring Lake Dam. As for the fountain darter, the habitat projected for the San Marcos salamander below Spring Lake Dam between 50 and 100 cfs coupled with recreation control in that area provides comfort that extended periods of flows in these ranges would be tolerated by this species. Texas wild-rice is the one Covered Species that would be adversely affected if extended periods of flows below 100 and/or 80 cfs would occur under current conditions. For instance, the HCP scenario projects, during drought of record-like conditions, approximately 1,125 consecutive days (just over 3 years) of springflow below 100 cfs, and approximately 960 consecutive days (just over 2.5 years) below 80 cfs. During 2009, total San Marcos discharge was below 100 cfs for 243 days; this is the second highest number of days under 100 cfs during the period of record for the San Marcos River. During that period in 2009, reduced springflow and intense recreational pressure resulted in nearly a 17 percent reduction in overall coverage of Texas wild-rice in the San Marcos River. (BIO-WEST 2010a). As such extensive mitigation and minimization measures directed specifically at Texas wild-rice are included in the HCP. These measures include recreational control in key areas during low-flow periods, the development of state scientific protection areas, sediment and non-native vegetation removal, and Texas wildrice restoration throughout the river in high quality habitat areas. The protection of minimum continuous springflows and long-term average flows coupled with the minimization and mitigation measures was determined to be protective of Texas wild-rice in the San Marcos River relative to the long-term biological goals and management objectives. As discussed for Comal Springs, during Phase I, applied research on the effects of low flows on the Covered Species and their habitat at San Marcos Springs will be conducted, mechanistic ecological models with be developed and applied, and the MODFLOW model used to simulate the effects of the Phase I Package will be improved. Until the Phase I AMP decision-making is complete, it is not known whether additional flow protection measures might be necessary or what duration might be acceptable, or amount of additional flows that might be needed. In summary, incidental take of the Covered Species at San Marcos Springs will occur under the HCP but is not anticipated to appreciably reduce the likelihood of survival of the Covered Species at San Marcos Springs or affect their potential for recovery. With the AMP activities scheduled during Phase I and the presumptive measure to meet the minimum flow objective during Phase II, incidental take will continue to occur during Phase II, but should not appreciably reduce the likelihood of survival of the Covered Species at San Marcos Springs or affect their potential for recovery Impacts of Incidental Take on Individual Covered Species 4-63
192 The following sections describe the individual species analysis that was conducted for the HCP. As a result of the Science Subcommittee s deliberations and flow-regime development process, the subsequent independent analysis of protective flow-regimes by the HCP-team and by Dr. Hardy in conjunction with potential HCP conservation measures, and the development of the long-term biological goals for the HCP, a wealth of data has been compiled, condensed, and evaluated. This incidental take analysis builds on the work from those efforts. To compare the impacts of incidental take for the No Action and Existing Baselines with the HCP measures a set of Current Conditions was developed. These conditions include the range of conditions experienced over approximately the last decade (2000 to 2009) under realtime pumping conditions, aquifer management, and ongoing activities in the action area. It incorporates biological and water quality monitoring data, Variable Flow Study data, along with the hydraulic/habitat and water quality modeling conducted by Dr. Hardy into a model to make the comparison. The format of the incidental take assessment includes a description of the approach employed for a specific species, followed by the results of comparative scenarios for the Phase I package as well as the No Action and Existing baselines. It quickly becomes evident that the extended period of zero springflow projected for the No Action Baseline and Existing Baseline (Figure 4-9a) would extirpate the fountain darter at Comal Springs. It is likely that the covered invertebrate species would also encounter this same fate at Comal Springs under the No Action and Existing Baselines. These results will be discussed in the respective Effects of Action Added to the Environmental Baseline sections for each Covered Species Comal Springs/River Ecosystem For the incidental take analysis at Comal Springs the most important system-wide assumptions regarding the minimization and mitigation measures include: Restoration of aquatic vegetation in the Old Channel with designated measures to protect high quality habitat at all predicted flow levels (termed Old Channel ERPA ) (Section ) Flow-split management (Section 5.2.1). Other necessary measures include: Restoration of aquatic vegetation in Landa Lake (Section 5.2.2). Decaying aquatic vegetation removal and dissolved oxygen management in Landa Lake (Section 5.2.4). Protection of aquifer water quality (Sections 5.7.2, 5.7.4, 5.7.6, and 5.7.7). Control of gill parasites, non-native species (plant and animal), and predation and competition (native and non-native species) (Sections 5.2.6, 5.2.5, and 5.2.9). 4-64
193 In addition to these system-wide assumptions, there are several species-specific assumptions that will be highlighted and comparisons made with and without those measures will be provided. Fountain Darter As discussed in Chapter 3, fountain darters were collected for the first time in the Comal River in 1891, with the last collection of fountain darters in the Comal River before its apparent extirpation in (EARIP 2009). From February 1975 through March 1976, 457 adult fountain darters collected from the San Marcos River were released into the Comal system. (Schenck and Whiteside 1976). A reproducing population has been reestablished and is now found throughout the entire Comal aquatic ecosystem from the headwaters of Landa Lake to near the confluence with the Guadalupe River. Habitat Requirements and Current Conditions Habitat requirements for the fountain darter are summarized in Chapter 3 and described in detail in EARIP (2008 and 2009). On-going research and monitoring continues to confirm the importance of aquatic vegetation to the fountain darter. The type and quality of the aquatic vegetation greatly affects the density of fountain darters in an area and in aggregate. Beyond aquatic vegetation, physical habitat and water temperature have been identified as important habitat components for the fountain darter in the Comal system. The USFWS in conjunction with Utah State University conducted a study in the early 1990s to determine the amount of habitat available to the fountain darter under various streamflow conditions in the Comal Springs ecosystem. This is the same study reviewed and presented in Hardy (2009). Dr. Hardy updated both the hydraulic/habitat model and water quality model for the Comal system and analyzed a Phase I package minimum flow regime (Hardy 2010). In addition to physical habitat, four checkpoint temperature ranges have been identified as critical to the fountain darter life cycle: at and above 77 to 79 F there is reduction in fountain darter larval production; between 79 and 82 ( F) and above there is a reduction in egg production, and at approximately 91 ( F) and 94 ( F) larval and adult, respectively, thermal death can be expected based on laboratory studies (Brandt et al. 1993, Bonner et al. 1998, McDonald et al. 2007). The specification of a range indicates some uncertainty in the study results about precisely where in the range the effects begin. Comprehensive biological monitoring conducted over the past decade (BIO-WEST 2002a 2011a) has focused on four reaches of the Comal System: Upper Spring Run (upstream most portion of the system to Spring Island), Landa Lake (Spring Island to the outflow to Old and New channels), Old Channel, and New Channel. (See Figure 4-1). Landa Lake supports the highest quality fountain darter habitat in the system at all monitored flows to date, as it maintains a diverse aquatic vegetation community, supports year round reproduction of fountain darters, and exhibits exceptional water quality conditions. (BIO-WEST 2002a 2011a). These factors contribute to the continuance of large populations of fountain darters within Landa Lake. Prior to 2004, the Old Channel of the Comal River also supported similar conditions. However, the construction of a new culvert system on the Old Channel coupled with an extended period of 4-65
194 high flow conditions (facilitated by the new culvert system) led to a scouring of the native filamentous algae from this reach, which was subsequently repopulated with mostly non-native vegetation. (BIO-WEST 2007c). As a result, habitat quality and resulting population numbers have both decreased within the Old Channel. Fountain darter reproduction in recent times in the Old Channel has shifted to primarily seasonal (spring time) peaks, reflecting the lesser quality habitat conditions (BIO-WEST 2008a, 2009a, 2010a) as compared with Landa Lake. The Upper Spring Run and New Channel in the Comal River have variable habitat conditions for fountain darters relative to spring discharge (BIO-WEST 2002a 2010a). The Upper Spring Run maintains high quality fountain darter habitat during moderate to higher flow (greater than 200 cfs total Comal System discharge) conditions because of the expansion of bryophytes during these periods and subsequent use by fountain darters. Periodic pulses coming down Blieders Creek scour out the bryophytes and make this reach less suitable for darters than it might otherwise be. Additionally, lower flows (less than 200 cfs total Comal System discharge) limit the amount of spring upwelling in this reach, which limits the amount of carbon dioxide (CO 2 ) in the water column. This limitation also causes a decline in the CO 2 obligate bryophytes leading to lesser quality habitat for fountain darters. The New Channel reach acts somewhat in an opposite fashion to the Upper Spring Run reach. The New Channel supports higher quality habitat at below average flow (~250 cfs total Comal System discharge) conditions because at these flows the establishment of aquatic vegetation is possible throughout much of the reach (Id.). More aquatic vegetation leads to higher quality fountain darter habitat in the New Channel. Total Comal System discharge greater than 350 cfs or high flow pulses coming down Dry Comal Creek cause a combination of factors that lead to lesser quality habitat in this reach. First, high flow pulses or sustained high flows scour out the aquatic vegetation in this highly altered reach. Second, higher flow conditions (resulting in greater depths) coupled with recreational use (which causes more turbidity) collectively cause less light penetration to sustain aquatic vegetation growth. Ultimately these conditions lead to reductions in aquatic vegetation and quality of fountain darter habitat. Over the past ten years of monitoring (BIO-WEST 2002a 2011a), total Comal System discharge greater than 225 cfs has been shown to provide high quality fountain darter habitat throughout most of its range, not considering short-term high flow events. Considerable habitat alteration has occurred several times over the years as a result of high flow pulses (heavy localized rain events) scouring out extensive areas of aquatic vegetation. These time periods are generally short-lived (hours to days) and the aquatic vegetation typically recovered and/or expanded in one to six months. In most cases these represent flow events that have direct impacts on fountain darter habitat but only on a temporary time scale. BIO-WEST (2007c). One exception was the long-term impact of non-native vegetation that replaced native vegetation after sustained high flow conditions in the Old Channel resulting in lower quality habitat. Take Thresholds Relative to Springflow Reduced springflow decreases both the quantity and quality of aquatic vegetation and physical parameters (fountain darter habitat), or causes limitations to the larval success of the fountain darter, both of which are classified as take by USFWS. The difficulty is in accurately assessing 4-66
195 the point at which take first occurs. Since the USFWS first identified a critical discharge value at which it believed take occurs, (see Table 4-28), there has been a wealth of data collected and habitat and water quality modeling conducted to better inform this determination. As discussed above, fountain darter habitat quality varies throughout the Comal Springs/River ecosystem and the HCP designates two categories, prime and less than optimal habitat. Prime habitat areas include Landa Lake and the Old Channel. The upper-most reach of Landa Lake above Spring Island (Upper Spring Run) and the entire new channel are considered less than optimal habitat. This distinction is important for guiding management response plans that attempt to maximize the suitability and availability of the highest quality habitat. Observations made during the EAA Variable Flow Study suggest that the area where habitat would first decrease in quantity and quality is in the upper-most reach of Landa Lake near the confluence of Blieders Creek (Upper Spring Run) and the critical discharge value at which this begins to occur is approximately 150 cfs. At 150 cfs, total Comal River discharge (observed in the summer of 2000), Spring Runs 4 and 5 (less than optimal habitat near Blieders Creek) ceased flowing and the amount of upwelling flow in the immediate area was also considerably reduced. Under those flow conditions, there is potential for loss of aquatic vegetation quantity and quality and for increases in water temperature in the immediate area. Observations from the Variable Flow Study show that prime habitat areas (Landa Lake and Old Channel) as well as less than optimal habitat throughout the New Channel are maintained at springflows of 150 cfs total Comal River discharge, suggesting that impacts to the fountain darter are minimal in those areas under such conditions. Based on physical habitat modeling and water quality modeling (Hardy 2010), the Phase I package includes a level of 60 cfs for triggering additional management response. (See Section ). As total Comal springflow approaches 60 cfs, there is potential for considerable take to the fountain darter population through loss of substantial areas of less than optimal habitat in the Upper Spring Run reach and New Channel. Additionally, risk is increased in some areas of prime habitat (Landa Lake and Old Channel). Hardy (2010) documents that at 60 cfs, over 85 percent of the available fountain darter habitat is maintained in Landa Lake. At that flow level, some areas in the lake do exceed the temperature checkpoints for reduced larval success and egg production during portions of the day for fountain darters. However, no area in Landa Lake exceeds temperatures required for juvenile or adult survival. At 60 cfs total Comal Springflow, under the Phase I package, 40 cfs will be directed down the Old Channel via flow-split management. At 40 cfs in the Old Channel, over 80 percent of the available fountain darter habitat is maintained throughout the Old Channel. None of the temperature checkpoints are exceeded in the portion of the Old Channel above Elizabeth Street, with no portion of the Old Channel experiencing temperatures high enough to cause juvenile or adult darter mortality at this flow level. Therefore, at 60 cfs total Comal discharge, considerable take is likely within marginal habitat areas with take also occurring at a more modest level within prime habitat. At 30 cfs daily average total Comal discharge (with 20 cfs directed down the Old Channel and 10 cfs down the New Channel), physical habitat in Landa Lake is predicted to be maintained at over 75 percent of the maximum available habitat. However, water temperatures increase considerably and start to pose greater risks relative to increased larval mortality and impacts on 4-67
196 egg production. No predicted water temperatures in Landa Lake exceed the mortality values for juvenile or adult fountain darters at this discharge. As discussed in Hardy (2010), 20 cfs in the Old Channel will provide approximately 75 percent of the maximum available fountain darter habitat in the Old Channel from a physical habitat perspective. At 20 cfs, under the extreme ambient temperature conditions modeled in Hardy (2010), the Old Channel ERPA area (Landa Lake to Golf Course Road) will maintain water temperature that does not exceed any water temperature threshold. Downstream of the ERPA, the Old Channel is predicted to have water temperatures that cause adverse impacts to larval success rate and egg production. However, it should be reiterated that even at this flow, nowhere in the Old Channel during the extreme conditions modeled, are water temperatures predicted to exceed levels necessary for adult or juvenile survival. At 30 cfs total Comal discharge, considerable take is likely within less than optimal habitat areas with greater amounts of take occurring in prime habitat as compared to 60 cfs total Comal discharge. Additional concerns that are heightened during these low-flow periods include the impacts from exotic plant and animal species, gill parasite, aquatic vegetation decay, predation and competition, and recreation which all have consequences on the fountain darter populations and habitat in the Comal Springs/River ecosystem. Therefore, measures to reduce impacts from these threats are included in the Covered Activities and described further in Chapter 5. Finally, since low-flow data and habitat responses are not available at this time, the applied research and ecological modeling discussed in Section 6.3 will be essential to better understand the impacts to this species over the life of the ITP. Take Analysis Methodology (Assumptions, Model Development, Status) Fountain Darter Specific Assumptions Relative to the Covered Activities, take from recreation, shoreline management, etc. can occur to varying extents regardless of springflow level. Take associated with pumping is most directly tied to springflow reductions which can decrease the quantity and quality of fountain darter habitat. This is first evident in the upper most reach of Landa Lake near the confluence of Blieders Creek (Upper Spring Run) and the critical discharge value at which this begins to occur is approximately 150 cfs total Comal springflow. As total Comal springflows decline below 150 cfs, additional areas are affected and differing levels of take (both discussed above) start to occur. Similar to the long-term biological goals (Section 4.2.1), the fountain darter incidental take assessment centers on a habitat-based approach within representative reaches of the Comal system. The four reaches include the Upper Spring Run Reach, Landa Lake, Old Channel, and New Channel as described in the previous section (Figure 4-1). In addition to the system-wide assumptions stated above, the following fountain darter specific assumptions apply to this approach: Fountain darter movement away from adverse conditions does not occur (i.e., when vegetation decreases, fountain darters automatically die) 4-68
197 Fountain darter recruitment is maintained at all flows (i.e., reduction in recruitment is not incorporated into the take analysis) The former assumption is conservative as fountain darter movement does occur would when a reduction in aquatic vegetation occurs. However, without a mechanistic ecological model to describe all the complexities that these movements would likely cause (e.g., crowding which could limit reproduction, limit growth rate, increase predation and competition) this assumption is in place to simplify a current unknown. The latter assumption regarding recruitment is thought to be true based on the water temperature modeling results presented by Dr. Hardy. However, even if recruitment does continue, recruitment rates will no doubt be affected by changing habitat conditions and the duration of periods of altered springflow. At the present time, there is not a modeling tool available to assess all the potential effects of the Phase I package on fountain darter recruitment. The approach used for the fountain darter take analysis focuses on the following components: Dominant aquatic vegetation changes with flow and time Fountain darter density variability with flow and time Aquatic vegetation quality adjustments relative to flow Includes the effect of recreation, flooding, and springflow Fountain darter habitat suitability adjustments relative to flow Aquatic vegetation to fountain darter linkage with flow and time Application of a fountain darter Stella model Physical habitat and water quality modeling (Hardy 2010), along with EAA Variable Flow Study actual observations (BIO-WEST 2002a 2011a), and professional judgment were used to quantify the levels of take relative to the HCP phased approach and HCP conservation measures. This was done by incorporating best available scientific information into a fountain darter habitat model. Fountain Darter Habitat and Population Model Development A fountain darter and aquatic vegetation linkage model within each of the four representative sample reaches described above was developed using Stella 9.1 (Figure 4-11). The model includes actual field collected data for aquatic vegetation and fountain darters over a nine year period via the EAA Variable Flow Study. Both the spring and fall sampling periods over that nine year span were incorporated into the model. The model was set up on a six-month time step so that aquatic vegetation measured during the Spring event of a given year would be the base vegetation used versus flow until the Fall aquatic vegetation mapping that same year, at which time that new measurement would be the base vegetation used until the following spring. Each dominant aquatic vegetation type was then evaluated versus flow to establish a habitat quality condition (0 to 1.0 with 1.0 being the best achievable). This exercise was based on Dr. 4-69
198 Hardy s habitat model as well as from EAA Variable Flow Study observations over the past decade. For instance, bryophytes in the Upper Spring Run reach received a 1.0 ranking from 210 to 280 cfs total Comal springflow. (Figure 4-11). Therefore, when these flows occur, the full amount of bryophytes measured at a given time step was used in the model. 4-70

199 Figure Stella Model Interface for Fountain Darter Habitat Model at Comal Springs. 4-71
, bryophtes were given a 0 (unsuitable) ranking as the Upper Spring Run reach stops significant surface flow at these total springflow levels")
200 Figure Habitat quality relationship for bryophytes versus Total Comal springflow in the Upper Spring Run reach. At total Comal springflow less than 140 cfs (Figure 4-12), bryophtes were given a 0 (unsuitable) ranking as the Upper Spring Run reach stops significant surface flow at these total springflow levels and bryophytes quickly disappear. So, when total Comal springflow is less than 140 cfs, the amount of bryophytes that was mapped for a given event in the Upper Spring Run reach is nullified in this exercise as no bryophytes are predicted to be present. A reduction in bryophyte quality is also projected at high total Comal springflows as the scouring effect of elevated flows also has an adverse impact on these non-rooted mosses. The second component entered into the model is the fountain darter density values recorded per dominant vegetation type in the Comal system over the same nine year period. Table 4-32 shows the minimum, 25 th, median, 75 th, and maximum densities recorded for fountain darters per aquatic vegetation type in the Comal system. 4-72
201 TABLE 4-32 FOUNTAIN DARTER DENSITIES PER AQUATIC VEGETATION TYPE IN THE COMAL SYSTEM OVER TIME Algae Bryophytes Cabomba Ceratopteris Hygrophila Ludwigia Open Sagittaria Vallisneria MIN th MEDIAN th MAX A habitat quality ranking for fountain darter density was then generated based on EAA Variable Flow Study data and from observations in the system. (Table 4-33). A ranking system was incorporated into the model as follows: TABLE 4-33 HABITAT QUALITY RANKING FOR FOUNTAIN DARTER DENSITIES Description Ranking Value for Model Density Value from Table 4-7 Unsuitable 1 Minimum Density Low quality 2 25 th Moderate quality 3 Median High quality 4 75 th The habitat quality ranking per fountain darter density was then incorporated into the model per respective reach relative to the total Comal springflow condition. For example, at total flows of less than 140 cfs, a 1, unsuitable, was assigned to the Upper Spring Run reach. As previously described, flows at this level in this reach would not support any bryophytes, yet they would support other vegetation types (e.g., Hygrophila, Saggitaria). However, the ranking of 1 for habitat quality fountain darter indicates no potential for any darters in that reach because a ranking of 1 in Table 4-32 is associated with the minimum values in Table 4-31, which for all vegetation types is 0. Therefore, the model predicts that below 140 cfs, the Upper Spring Run reach does not support fountain darters. As flows go above 140 cfs in the Upper Spring Run reach, the habitat quality is adjusted to 2, which does indicate support of some darters in the reach, and as flows get back to above average conditions, the habitat quality index is adjusted to 3 to reflect typical conditions under average total Comal springflow conditions. Fountain Darter Species Status To document a Current Condition of what the approximate fountain darter population has been within the representative reaches in the Comal system from 2002 through 2010, the actual hydrology from that time period was incorporated into the model. Additionally, four constant flows levels (30, 150, 225, and 300 cfs) were incorporated into the model to examine population variability relative to aquatic vegetation conditions experienced over this nine year period. 4-73
202 Total Comal Springflow (cfs) Figure 4-13 shows the comparison of current hydrology for that period with each constant flow condition Total Springflow Evaluation Current 30 cfs 150 cfs 225 cfs 300 cfs Time (months) Figure Total Comal Springflow scenarios evaluated in Stella. Current pumping is the actual Total Comal Springflow from Other springflows were held constant. Figures 4-14 and 4-15 (along with embedded tables with the figure) show the Stella model results for fountain darter numbers within the representative reaches for the Current Conditions (same in both figures) and the No Old Channel ERPA (see Figure 4-13) and With Old Channel ERPA (see Figure 4-14) scenarios. As discussed throughout the HCP, a key component of the minimization and mitigation measures is the Old Channel ERPA at Comal Springs. The Old Channel ERPA encompasses the EAA Variable Flow Study reach, extending from below Elizabeth Street upstream to the culverts feeding the Old Channel from Landa Lake. Within this reach, non-native vegetation will be removed, native vegetation restored, and some limited channel modification will be undertaken to enhance fountain darter habitat in select areas. To protect this enhanced habitat, the ERPA will have protection measures including flow-split management between the New and Old Channels using the existing culvert structures and the ability to divert more of the flow during wet periods down the New Channel via dam improvements currently underway by the City of New Braunfels to reduce scouring effects in the Old Channel. A concern noted in Hardy (2011) is that at 30 cfs total Comal springflow, there is the potential for cool water inflows from springs along the western margin of Landa Lake flowing down the New Channel instead of entering the Old Channel. This could affect water quality in the Old Channel and the success of the proposed ERPA, and, thus, this flow pattern is proposed for study during Phase I. 4-74
203 For the Current Conditions scenario, no habitat quality adjustments for aquatic vegetation were made for restoration or protection activities and as the flows over this time period were relatively average or above, the habitat quality index (fountain darter density) for each reach was set to 3. For the No ERPA alternative, habitat quality adjustments were made based on flow alone (see Figure 4-14 embedded table in upper right corner), while the With ERPA scenario included both adjustments for flow and for restoration and protection activities in the Old Channel. (See Figure 4-15 embedded table in upper right corner.) 4-75
204 Total Fountain Darters Time Constant Flow Flow Habitat Quality Ranking - Comal Reaches step Current 30 cfs 150 cfs 225 cfs 300 cfs USR LL OCR NCR 30 cfs ,574 5, , , , cfs ,986 5, , , , cfs ,358 5, , , , cfs ,464 4,291 92, , ,983 Existing ,854 2,958 68, , , ,396 1,504 40,302 69,548 66, ,171 3,971 83, , , ,988 2,056 49,021 88,796 83, ,623 3,319 70, ,434 97, ,078 1,840 46,344 87,004 81, ,794 3,989 85, , , ,052 3,845 83, , , ,911 4,674 98, , , , ,412 71,331 68, ,346 3,994 86, , , ,127 1,219 33,691 54,984 52, ,984 3,802 80, , , ,829 1,132 30,861 33,769 33,717 Min 32, ,861 33,769 33,717 Avg 100,475 3,290 72, , ,198 Max 147,358 5, , , ,484 Total Fountain Darters in Representative Reaches - No ERPA 30 cfs 150 cfs 225 cfs 300 cfs Current 200, , , , , ,000 Figure Total Fountain Darters within Representative Reaches Comal System: Habitat Quality Adjusted by Reach NO OLD CHANNEL ERPA - Current = flows over 18 timesteps; Constant flows of 30, 150, 225, and 300cfs for all 18 timesteps. 80,000 60,000 40,000 20, month timesteps 4-76
205 Total Fountain Darters Time Constant Flow Flow Habitat Quality Ranking - Comal Reaches step Current 30 cfs 150 cfs 225 cfs 300 cfs USR LL OCR NCR 30 cfs ,574 6, , , , cfs ,986 5, , , , cfs ,358 5, , , , cfs ,464 5, , , ,030 Existing ,854 5,719 85, , , ,396 4,265 56,052 75,926 72, ,171 6, , , , ,988 6,332 71,675 98,129 92, ,623 7,881 88, , , ,078 5,321 67,034 94,606 89, ,794 8, , , , ,052 7, , , , ,911 8, , , , ,022 4,636 52,874 79,760 76, ,346 8, , , , ,127 5,648 51,388 64,884 62, ,984 7,942 99, , , ,829 4,629 39,850 41,431 41,565 Min 32,829 4,265 39,850 41,431 41,565 Avg 100,475 6,374 91, , ,797 Max 147,358 8, , , , , , , , , ,000 80,000 60,000 40,000 20,000 Figure Total Fountain Darters within Representative Reaches Comal System: Habitat Quality Adjusted by Reach WITH OLD CHANNEL ERPA - Current = flows over 18 timesteps; Constant flows of 30, 150, 225, and 300cfs for all 18 timesteps. 0 Total Fountain Darters in Representative Reaches - with ERPA 30 cfs 150 cfs 225 cfs 300 cfs Current month timesteps 4-77
206 Although not exactly an apples-to-apples comparison, as the Current Conditions scenario has different flows over the 18 6 month time steps versus the assumed constant flows over this nineyear period, it is a helpful illustration of the range of variability observed in the system. The variability is reflected in the changes in aquatic vegetation that have been experienced since Over this time period, the number of total fountain darters predicted within the representative reaches ranged from approximately 33,000 to 147,000 individuals (see Figure 4-13). As previously noted, this population estimate is an approximation based on the assumptions stated above. It refers to populations only within the representative reaches. These assumptions add uncertainty regarding the actual number of fountain darters present in the system and as projected by this modeling exercise. However, for this take analysis, this approach provides a level of consistency amongst scenarios that allows for a meaningful comparison across different modeled flow scenarios. In Figure 4-14, the 225 cfs and 300 cfs modeled results for constant flows are fairly similar, while the 150 cfs results are lower, with the 30 cfs result projecting large reductions in the fountain darter populations within the representative reaches. Figure 4-13 shows the 30 cfs constant flow scenario to maintain between approximately 900 and 5,000 total darters within the representative reaches. With restoration and high-flow protection activities implemented for the Old Channel, a habitat quality adjustment from 3 to 4 was made for the With ERPA scenario. This adjustment was based on a 4 being above average habitat (note that an optimal habitat ranking of 5 was not used in any of the analysis) and the fact that a flow level of 40 cfs in the Old Channel has been observed over time and found to provide high quality fountain darter habitat under current conditions. The assumption embedded in the analysis is that added restoration and protection within the ERPA would allow a reduction in flow below 40 cfs while maintaining an above average habitat quality condition within the ERPA during periods of extreme drought. Figure 4-14 again shows the same overall trend of fountain darter numbers versus springflow. However, with the habitat quality adjustment for the ERPA, the 30 cfs constant flow results are considerably higher (@4,000 to 8,000 darters). This analysis should not be taken out of context at this point, as it is only presented for perspective and is not a representation of what the Phase I package produces. Hardy s analyses (2010) do not support long-term conditions of flows as low as 30 cfs and, in fact, recommend, as the minimum flow, a period of no longer than six months at 30 cfs daily average, followed by two-to three months of higher flows at 80 cfs or greater. Evaluation of Effects of Action and Environmental Baseline Versus Current Condition To assess the Phase I package and No Action and Existing baselines, monthly Comal Springs flow data provided by HDR was used. For the Phase I package, a running 9-year average was calculated from to be consistent with the nine years of EAA Variable Flow Study data used in the analysis. The lowest nine-year average was 81 cfs (January 1949 December 1957), the average 9-year rolling average was 202 cfs (January 1966 December 1974) and the highest 9-year rolling average was 272 cfs (January 1986 December 1994). For the No Action and Existing baselines, the same time periods were chosen for an equal comparison and modeled flow data from HDR for those time periods based on associated pumping were used. Figures
207 Total Comal Springflow (cfs) through 4-18 show the total Comal springflow for each of the respective nine-year periods for oth the HCP, No Action Baseline, Existing Baseline, and historical conditions. For the take analysis, these three flow sequences were converted into 6-month time steps to be consistent with the aquatic vegetation data and entered into the Stella model. Table 4-34 shows the model results for all three springflow conditions over the 18 6 month time steps for each modeled scenario and historical conditions. The most notable result is that the No Action and Existing baselines both result in 0 fountain darters in the representative reaches during a repeat of conditions similar to the drought of record. This would most likely translate to the entire system and cause extirpation of the fountain darter from the Comal system "Low-Flow" Representative Period (January December 1957) HCP - Phase I No Action Baseline Existing Baseline Historically Observed month Timestep Figure Low-Flow representative nine-year rolling average (Total Comal Springflow) for the Phase I package, No Action Baseline, and Existing Baseline modeled scenarios and historically observed. 11 The model predicts 300 darters (Table 4-34) for the historical condition when in fact the fountain darter was extirpated from the Comal System during those conditions. This is reflective of the six month time-step not actually showing a 0 flow result in Figure This highlights the limitations in using this type of modeling for exact numbers rather than just to compare alternatives. 4-79
208 Total Comal Springflow (cfs) "Moderate-Flow" Representative Period (January December 1974) HCP - Phase I No Action Baseline Existing Baseline Historically Observed month Timestep Figure Moderate-Flow representative nine-year rolling averages (Total Comal Springflow) for the Phase I package, No Action Baseline, and Existing Baseline modeled scenarios and historically observed. 4-80
209 Total Comal Springflow (cfs) 500 "High-Flow" Representative Period (January December 1994) HCP - Phase I No Action Baseline Existing Baseline Historically Observed month Timestep Figure High-Flow representative nine-year rolling averages (Total Comal Springflow) for Phase I package, No Action Baseline, and Existing Baseline modeled scenarios and historically observed. 4-81
210 Table Total Fountain Darters within Representative Reaches for the Phase I package (with and without ERPA), No Action Baseline, Existing Baseline, and Historical Conditions Comal System: Habitat Quality Adjusted by Reach Low, Moderate, High represent 9-year model run periods generated for each alternative. Time step HCP - HCP - No Action Existing with ERPA NO ERPA Baseline Baseline Historical HCP - HCP - No Action Existing with ERPA NO ERPA Baseline Baseline Historical HCP - HCP - No Action Existing with ERPA NO ERPA Baseline Baseline Historical LOW-Flow Representative Period MODERATE -Flow Representative Period HIGH-Flow Representative Period 1 45,311 39,498 36,331 40,554 40, , , , , , , , , , , ,440 26,053 16,669 20,270 39,171 99,493 98,553 57,914 71, , , , , , , ,941 40,463 31,048 37,694 40, , , , , , , , , , , ,847 14,628 7,930 9,023 32,523 60,093 57,804 33,925 40, , , , , , , ,557 12,873 10,173 11,541 20,995 93,439 87,757 78,374 85,759 89, ,535 99,854 99,854 99, , ,870 4,161 1,449 1,850 9,820 62,712 56,739 47,331 55,982 68,809 76,010 69,574 69,539 58,464 76, ,556 12,170 7,907 8,745 28, , , , , , , , , , , ,656 5,530 1,288 1,519 13,186 64,075 56,027 45,195 56,558 97,139 73,308 64,905 57,279 88,804 44, ,698 13,014 9,003 9,978 22, , ,724 95, ,724 97, ,971 94,497 90, ,434 97, ,268 4, ,016 11,874 76,984 69,828 60,210 79,211 90,195 68,114 61,367 51,410 85,717 93, ,571 12,145 6,613 7,201 28, , , , , , , , , , , ,575 7, ,118 96,815 89,289 76,108 92, , ,439 99,751 87, , , ,833 10,626 2,756 3,363 23, , , , , , , , , , , ,919 1, ,342 66,828 58,526 51,014 59,225 63,311 68,624 59,999 61,866 59,999 68, ,693 7, , , , , , , , , , , , ,441 1, ,565 54,466 54,403 49,300 53,984 65,253 55,127 55,110 44,502 54, ,586 8, , , , ,548 94, , , , ,181 94, , ,549 5,776 1,750 1,898 6,510 40,457 32,773 32,743 32,684 39,671 41,213 33,669 33,332 33,764 41,652 Min 7,919 1, ,457 32,773 32,743 32,684 39,671 41,213 33,669 33,332 33,764 41,652 Average 20,184 12,729 7,438 8,607 20,075 96,311 90,050 80,636 87, , , , , , ,796 Max 45,311 40,463 36,331 40,554 40, , , , , , , , , , ,
211 Not surprisingly, the second notable result is the increase in the total number of fountain darters with the Old Channel ERPA to 45,000) under the low-flow scenario relative to the NO ERPA scenario to 40,000). Table 4-35 shows that most alternatives are fairly similar to each other and historical conditions during moderate and higher flow conditions, including the with and without ERPA scenario. As a rough calculation, the aquatic vegetation mapped within the representative reaches in Fall 2009 (EAA Variable Flow Study) represented between 3 and 33 percent of the total aquatic vegetation mapped in the entire Comal System (Hardy 2010) during that same time period. Taking the average of those values (19 percent) as a crude conversion factor for the total system and assuming a one-to-one relationship of aquatic vegetation and fountain darters, one can use the total fountain darter numbers generated in Table 4-34 and divide by 0.19 to get a rough estimate of the total fountain darter population in the system. Using this approach, the calculated result is (with all the caveats applicable to this analysis) that the number of total fountain darters in the Comal system from 2002 to 2010 ranged from approximately 170,000 to 775,000. Table 4-36 shows the calculation results for system-wide darters, as converted from the representative reach values in Table TABLE 4-35 TOTAL FOUNTAIN DARTERS IN THE COMAL SYSTEM BASED ON A CONVERSION FACTOR OF 0.19 RELATIVE TO MODELED RESULTS FROM THE REPRESENTATIVE REACHES FOR THE PHASE I PACKAGE WITH AND WITHOUT AN OLD CHANNEL ERPA Scenario CURRENT ( ) HCP No ERPA Range of Total Fountain Darters in the Comal System Minimum Average Maximum 172, , ,567 Low 8,901 66, ,963 Moderate 172, , ,948 High 177, , ,006 HCP ERPA Low 41, , ,477 Moderate 212, , ,668 High 216, , ,
212 Effects of Action Added to the Environmental Baseline Based on the fountain darter habitat and population model results, it is evident that the No Action and Existing baselines will cause incidental take during average to above average springflow conditions, but likely within the range of variability experienced during the Current Conditions. More notably, both the No Action Baseline and Existing Baseline will cause extirpation of the fountain darter from Comal Springs during a repeat of conditions similar to the drought of record. The HCP-Phase I package will similarly result in incidental take during periods of average to above average springflow conditions (again within the range of variability experienced during the current condition), but is not projected to cause extirpation of the fountain darter at Comal Springs. It is evident that a large amount of incidental take will be experienced with the Phase I package (with or without ERPA) relative to the current ( ) conditions under flow conditions similar to the drought of record. During extreme drought of record-like conditions, with all HCP conservation measures other than protection of habitat in the Old Channel (No ERPA), there is the potential for a 95 to 99 percent reduction in fountain darters in the Comal system relative to Current Conditions. This translates into the potential incidental take of approximately 165,000 to 765,000 fountain darters during a repeat of conditions similar to the drought of record, with the potential for approximately 9,000 fountain darters remaining in the system. This modeled population projection probably is not realistic considering all the unknowns regarding the system and assumptions required to conduct this analysis. A projected population of 9,000 darters at Comal Springs may not be enough to protect the population even though the current population of fountain darters in the Comal system got its origin from 457 individuals restocked in the 1970 s (See Schenck and Whiteside 1976). The concern lies not in the absolute number of darters necessary to repopulate the system, but in the uncertainty associated with the predictions resulting in the 9,000 number. During extreme drought of record-like conditions with all HCP conservation measures including an Old Channel ERPA, there is still the potential for a 76 to 95 percent reduction in fountain darters in the Comal system relative to current conditions. This translates into the potential take of approximately 130,000 to 735,000 fountain darters during a repeat of conditions similar to the drought of record. However, under this scenario, approximately 40,000 darters are projected to remain in the system. Long-term monitoring, applied research, and mechanistic ecological modeling are all necessary as the HCP moves forward considering the uncertainty surrounding this analysis. At this time, it is impossible to predict the actual level of fountain darter take (in terms of habitat quantities or fountain darter numbers) over the 15-year term of the ITP as natural variability of the population of this species is large, but more importantly, actual conditions regarding use of existing water rights, future hydrology (i.e., rainfall), success of HCP conservation measures, etc. are impossible to predict. As such, a very conservative scenario based on the best available science was presented above. Should water rights not be fully utilized in the 15-year term of the ITP; hydrology remain fairly average; and the conservation measures be nominally successful, then the amount of incidental take will be very low. Conversely, should full utilization of water rights start at the effective date of the ITP in 2013; followed by a 10-year drought similar in nature to the drought of record; in conjunction with the HCP conservation measures not having a chance to be fully tested or implemented, then the potential for take of 735,000 or more darters is possible. 4-84
213 Effects of the Covered Action would be added to the environmental baseline and the condition would typically get slightly worse. Mitigation and minimization strategies would then be employed to offset declines in the overall condition. However, the Phase I package results in an improvement from both the No Action Baseline and Existing Baseline presented here based on springflow protection alone. To describe this improvement, a 15-year hydrograph was created. The hydrograph was developed to be within the range of potential conditions that could be observed. For instance, the best case scenario or upper bracket of the range would be average or above average springflows over the entire 15-year HCP period which would result in minimal take for the HCP, No Action Baseline, and Existing Baseline. On the opposite end of the spectrum or lower bracket, a near worst-case example would involve drought of record-like springflows for the entire 15-year HCP period which would result in extirpation of the Covered Species for the No Action Baseline and Existing Baseline and very large take and potential extirpation of the Covered Species under the Phase I package. The hydrograph created for illustrative purposes includes the following high (above average), moderate (average), and low (drought of record-like) flow years: Years 1-3 High total springflows Years 4-6 Moderate total springflows Years 7-11 Low or drought of record-like total springflows Years Moderate total springflows Years High total springflows The analysis is relative to the total system fountain darter numbers generated in Table 3-35 for the HCP alternative and the total system darters for the No Action Baseline converted from Table A review of Table 4-34 shows that the projected Existing Baseline fountain darter results are very similar to the No Action Baseline and thus, only one example baseline was carried forward in the example. Although endless hydrograph scenarios can be created and evaluated, the goal of this example was to include a 5-year period similar to drought of record conditions in the middle of the HCP period to evaluate how the fountain darter population (as modeled with existing tools) would respond. As shown in Figure 4-19, there is an across the board improvement for both the EARIP with ERPA and without ERPA scenarios relative to the No Action Baseline. As such, relative to the No Action Baseline, no appreciable reduction in the fountain darter population would occur from the Phase I package. Although true relative to the No Action Baseline, incidental take from pumping will occur during the ITP relative to a no pumping alternative or the Current Conditions described above. Additionally, as this is a recovery program, the Phase I package does not stop at simply improving upon the No Action Baseline based on springflow protection alone. As discussed throughout this HCP, numerous minimization and mitigation measures are proposed for habitat enhancement, water quality protection, and public education, as well as ecological modeling, applied research, and longterm monitoring. Figure 4-20 shows the projected benefits of the Phase I package relative to the No Action Baseline, but also acknowledges the potential take of fountain darter relative to the Current Condition. 4-85
214 Fountain Darter estimated population Comal Springs Fountain Darter current condition (blue box) and projected (color lines) population over the 15-year HCP period using an example hydrograph. 1 2 Current Condition ( ) No Action Baseline HCP (No ERPA) HCP (with ERPA) 1,000, , , , , , , , , , Time (years) Figure Modeled Fountain Darter population at Comal Springs over the HCP period for the HCP (with and without ERPA) and No Action Baseline using an example 15-year hydrograph as described in the text. 1 No Action Baseline causes extirpation of the fountain darter at Comal Springs following year 8 (in this example). 2 HCP (No ERPA) is in danger of causing extirpation of the fountain darter (approximately 9,000 individuals) at Comal Springs from year 8 to 11 (in this example). 4-86
215 Fountain Darter estimated population Comal Springs Fountain Darter current condition (blue box) and projected (color lines) population over the 15-year HCP period using an example hydrograph. 1 Current Condition ( ) No Action Baseline HCP (with ERPA) 1,000, , , , , , , , , , Time (years) Figure Modeled Fountain Darter population at Comal Springs over the ITP for the HCP - Phase I package and No Action Baseline using an example 15-year hydrograph as described in the text. 1 No Action Baseline causes extirpation of the fountain darter at Comal Springs following year 8 (in this example). Arrows added to highlight benefits of the HCP relative to the No Action baseline (Green Arrows) and potential reductions (Brown Arrows) from the range of Current Conditions. 4-87
216 Figure 4-20 is a hypothetical example of HCP impacts to the fountain darter over the life of the ITP. Impacts in the example are very dependent on the hydrology as will be future impacts over the course of the ITP. With the presumptive action to achieve the Minimum Flow-related Management Objective in Phase II, the purple line (Figure 4-20) would be higher across the chart with considerable improvement during the low-flow periods. To summarize the scientific findings (Hardy 2011), at a daily average of 30 cfs total Comal springflow (20 cfs Old Channel, 10 cfs New Channel), physical habitat and water quality conditions throughout Landa Lake proper, the Old Channel and New Channel are sufficient to support adult and juvenile fountain darters and recruitment in key but limited areas. At 80 cfs, which are the flows prescribed for a few months following a maximum 6-month period of 30 cfs minimum daily flows, suitable conditions are extended into the spring runs and farther downstream in the Old and New Channels (Hardy 2011). Three main concerns noted in Hardy (2011) regarding this flow regime were 1) the potential for aquatic vegetation die-off and subsequent dissolved oxygen (DO) problems in Landa Lake, 2) the reduction in larval production of fountain darters that would likely be experienced, and 3) the potential for cool water inflows from springs along the western margin of Landa Lake flowing down the New Channel instead of entering the Old Channel, which could result in water quality impacts, including higher temperatures, greater than currently predicted in the Old Channel. Regarding the first concern, the aquatic vegetation question remains unanswered and assessing aquatic vegetation dynamics relative to springflow is a critical applied research component in the AMP. Additionally, mitigation measures are proposed to remove dying vegetation in an attempt to alleviate any DO concerns in Landa Lake. (See Section 5.2.4). Regarding the second concern, the reduction in larval production has been thoroughly documented in laboratory studies (Bonner et al. 1998, McDonald et al. 2007) and can be assumed to occur at these flow conditions in the wild based on temperature modeling (as no actual water quality data is available at 30 cfs total Comal springflow). Therefore, based on the temperature modeling, at a daily average of 30 cfs total Comal springflow, only the upper portion of the Old Channel and possibly pockets of cooler water along the bottom of Landa Lake (Hardy 2011) are projected to remain below three of the four temperature threshold ranges at all times. At this flow level, reduction in fountain darter larval production is possible in these cooler areas during portions of the day while all other areas of the system are projected to experience temperature conditions resulting in reductions in fountain darter larval and egg production. (Hardy 2011). At these flow levels, temperatures throughout most all of the Comal system are still below conditions necessary for survival of adult and juvenile fountain darters and a reduction in larval production within the threshold range (77 to 79 F) does not translate to total larval mortality. McDonald et al projects reductions in larval production of up to 63 percent within these temperature ranges. The third concern is directly related to uncertainty associated with the temperature modeling and will require additional hydrodynamic modeling with follow-up water temperature modeling in addition to intensified spatial monitoring during low-flow events, which are proposed HCP research components. Through 10 years of monitoring conducted for the EAA Variable Flow Study, the ecological response of the Comal Springs ecosystem has been documented several times following 4-88
217 extensive flooding or relatively short drought periods experienced during the study period. The response/recovery typically starts with the reestablishment or expansion of aquatic vegetation within the system. This typically occurs within six months of the disturbance upon return to springflows between 200 and 400 cfs coupled with more stable flow conditions. Concurrent with the recovery of aquatic vegetation is the reestablishment of invertebrates (darter food source) within the vegetation. Subsequent to the aquatic vegetation and food source recovery, fountain darters quickly move back into these recovered habitat areas. It is difficult to predict the recovery of habitat from conditions similar to the drought of record, but one can assume it would be slower than witnessed following the less extreme drought conditions experienced during the past 10 years. It can also be assumed that recovery following an extreme drought would be slower than recovery following a massive flood event. Although extreme floods may cause the same amount or more destruction of aquatic vegetation relative to overall areal coverage, the key difference is that during an extreme flood event, the entire system maintains water and thus connectivity which should enhance the potential for reestablishment of both plant and invertebrate communities. In contrast, during an extreme drought, areas of the Comal system will be dry or stagnant for extended periods of time which will limit the connectivity and likely cause longer recovery periods. With longer recovery periods necessary, repeat occurrences of these types of events could provide cumulative impacts beyond what is projected by the analysis presented herein. This is the basis behind the aquatic vegetation restoration and protection efforts included in the HCP conservation measures and applied research activities and ecological modeling proposed for Phase I. The best available scientific data supports a finding that a flow regime with a minimum flow of 30 cfs daily average total Comal springflow (with a flow split) for a period not to exceed six months followed by flows of 80 cfs for two to three months would be protective of the fountain darter in the Comal system during conditions similar to a repeat of the drought of record. However, the HCP during Phase I does achieve that exact flow regime, at this time. A monthly average flow of 25 cfs, which might result in a minimum daily average flow of about 10 cfs, is projected to occur during Phase I with conditions similar to a repeat of the drought of record. In addition, the full level of 80 cfs for two-to-three months following the lowest flow occurrence is not achieved under that same scenario. (See Figure 4-9b). As shown in Table 4-31, when modeled under drought of record conditions, only two months with flows as low as 27 cfs monthly average are projected during the 10 year drought of record period with increased flows beyond the lowest levels projected in subsequent months. This represents a near worst case drought scenario modeled and also assumes full pumping of 593,000 ac-ft. The duration of Phase I is only seven years and, thus, multiple months of 27 cfs monthly average total Comal springflows or multiple years of less than 80 cfs for two to three months following the lowest levels is not possible relative to the near worst-case modeled condition. This modeled condition is based on the assumption that all flow protection measures will be fully implemented and effective during Phase I. As discussed in Section , the analysis supports the determination that with only two months of 27 cfs monthly average total Comal springflow and slight shortage of higher flows (relative to the Management Objectives) in subsequent months 4-89
218 (See Figure 4-9b) the Phase I package should not appreciably reduce the likelihood of survival of the fountain darter at Comal Springs or affect its potential for recovery. The Phase I package does not satisfy the long-term Flow-Related Management Objective of 225 cfs total Comal springflow as a long-term daily average flow condition. As such, the Phase I package activities (minimization and mitigation measures, applied research, ecological modeling, and long-term monitoring) will guide the continued assessment of the long-term Key- Management and Flow-Related Objectives and assessment of the full HCP period. This additional work will be instrumental in finalizing a determination of what is necessary for longterm protection and the overall long-term recovery of the fountain darter at Comal Springs. Furthermore, as discussed in Chapter 5, additional flow protection strategies will also be investigated as part of the AMP to ensure compliance with the Management Objectives or future determined objectives. Comal Springs Riffle Beetle Similar to the fountain darter, assessing take for the Comal Springs riffle beetle is subject to the many habitat and population parameters that potentially affect the population dynamics, but the limited amount of available life history information adds additional complexity. Although considerable contributions to the Comal Springs riffle beetle knowledge base have been made through field and laboratory evaluations associated with the EAA Variable Flow Study, many ecological data gaps still exist for this species. Habitat Requirements and Current Conditions In the Comal system, Comal Springs riffle beetles are found in areas where springflow is evident around Landa Lake which includes spring Runs 1, 2, and 3 and spring openings associated with the Western shoreline of Landa Lake, upwelling areas surrounding Spring Island, and deeper water within the lake (EARIP 2009). The primary requirements for Comal Springs riffle beetles relate to high-quality springflow and maintenance of physical habitat (Bowles et al. 2002). BIOWEST (2004a 2011a) has documented the affinity for clear flowing water either horizontally or via upwelling. Primary constituent elements for critical habitat of the Comal Springs riffle beetle are (1) highquality water with pollutant levels of soaps, detergents, heavy metals, pesticides, fertilizer nutrients, petroleum hydrocarbons, and semi-volatile compounds such as industrial cleaning agents no greater than those documented to currently exist and including: (a) low salinity with total dissolved solids that generally range from 307 to 368 mg/l; (b) low turbidity that generally is less than 5 nephelometric turbidity units (NTUs); (c) aquifer water temperatures that range from approximately 68 to 75 o F (20 to 24 o C); and (d) a hydrologic regime with turbulent flows that provide Adequate levels of dissolved oxygen in the general range of 4.0 to 10.0 mg/l for respiration of the Comal Springs riffle beetle; (2) food supply for the Comal Springs riffle beetle that includes, but is not limited to, detritus (decomposed materials), leaf litter, and decaying roots; and (3) bottom substrate in surface water habitat of the Comal Springs riffle beetle that is composed of sediment-free gravel and cobble ranging in size from 0.3 to 5.0 inches (8 to 128 millimeters)(usfws 2007). 4-90
219 Comal Springs riffle beetles (adults and larvae) have been collected at least semi-annually over the past six years via a cotton lure methodology employed for the EAA Variable Flow Study. The details of the sampling protocol and results can be found in BIO-WEST 2005a 2011a). In summary, three main areas are sampled in the Comal Springs system including Spring Run 3, a portion of the western shoreline of Landa Lake, and the Spring Island Area (Figure 4-4). Table 4-37 shows the total number of Comal Springs riffle beetles (adult and larvae) collected per event over this time period and the consistency among sample locations. A qualification in that consistency is that the area sampled along the western shoreline and Spring Island area are smaller areas in proportion to the total available habitat in those areas, as compared to the proportion of sample area to total available habitat in Spring Run 3. TABLE 4-36 TOTAL NUMBER OF COMAL SPRINGS RIFFLE BEETLES (HETERELMIS COMALENSIS) COLLECTED WITH COTTON LURES (ADULTS AND LARVAE) FOR EACH EAA VARIABLE FLOW SAMPLING DATE Sample Period Spring Run 3 Western Shore Spring Island TOTAL May June August Nov Dec April Nov Dec May June Nov Dec May June Nov Dec May June Nov Dec May June Nov Dec May June Nov Dec TOTAL 2,370 2,182 1,979 6,531 AVERAGE A closer look at the lower flow period experienced in 2009 shows fewer riffle beetles were collected at Spring Run 3 and the Western Shoreline in December, when daily average flows were about 300 cfs, as compared to June, when daily average flows were about 200 cfs, but more riffle beetles were collected at Spring Island in December compared to June. One explanation might be that the riffle beetle population fluctuates with total springflow. Most of the springs sampled in the Spring Island area are upwellings on the lake bottom and possibly less susceptible to the effects of drought than seeps along the margins of the lake, some of which had no measurable flow in June. However, many Comal Springs riffle beetles were collected on 4-91
220 the lures along the Western Shoreline in June Another possible explanation is that riffle beetles in edge habitat retreat further into the Lake or Spring Run or go subsurface during lower flow conditions. This would also explain fewer numbers recorded during lower flow conditions. During 2010, increases in Comal Springs riffle beetle densities were recorded at all sites as flows returned to above historical average conditions. Take Thresholds Relative to Springflow One of the main flow-related questions is associated with the survival of Comal Springs riffle beetle during the prolonged drought of the 1950s which included approximately five months of zero flow. Hypotheses regarding their survival include the persistence of a few individuals in Landa Lake and subsequent redistribution to spring run habitats, a localized retreat into the spring heads or subsurface areas of flow, or aestivation carried out in a specific life stage. (Bowles et al. 2002; BIO-WEST 2002d). One of the hypotheses, the use of the hyporheos (subsurface habitat) during drought conditions, was tested under laboratory conditions with the findings of that study suggesting that Comal Springs riffle beetle associate strongly with springflow and move down into the substrate in response to upwelling. (BIO-WEST 2002d). The study showed Comal Springs riffle beetle response to a shift in springflow direction and intensity (individuals tended to move downward toward the source of water flow). This would support the hypothesis that the species retreats into spring heads or subsurface habitats with flow during drought and possibly at other times. EARIP (2009) describes examples of a similar taxon of riffle beetle using this behavior, and concludes that this response in a similar taxon and research suggesting movement toward the source of water flow (downward) raises uncertainty about the proportion of the population that may be found below the upper layer of rocks that have been primarily sampled for the species. In the absence of sufficient data, take and increased risk conditions were evaluated based only upon surface habitat availability. This is likely a conservative approach considering the potential that this species may regularly occupy subsurface habitat or be able to use such habitat for extended periods as a mechanism for drought survival. It is believed that take associated with the reduction of this surface habitat begins to occur at approximately 120 cfs as a daily average at the main spring runs. It has been documented (mostly anecdotally) that during the late 1980s and mid-1990s the spring runs at Comal started to lose wetted area at approximately 120 cfs. Hardy (2009) also documents that wetted area in the spring runs decreases at daily average flows between 150 and 100 cfs. Hardy (2009) results show there are greater reductions predicted in surface habitat in all three spring runs below 100 cfs. Additionally, there is no surface habitat predicted for Spring Runs 2 or 3 at 30 cfs total discharge as a daily average (Hardy 2009). Although the modeling of surface habitat addresses changing conditions within the three main spring runs, it is important to reiterate that a large proportion of Comal Springs riffle beetle habitat exists along the Western Shoreline of Landa Lake and at upwellings around Spring Island. None of these additional habitats were evaluated in that original exercise. The importance of subsurface habitat was also not considered in that original modeling exercise. Figure 4-21 shows that the Spring Island portions of Landa Lake and the Western Shoreline will remain inundated at 30 cfs whereas Spring Run 3 would likely go subsurface except for near the terminus into Landa Lake. 4-92
221 Figure Modeled wetted area along western shoreline of Landa Lake and Spring Island at total daily average Comal discharge of 30 cfs* *Water surface elevation at 30 cfs is set to maximum elevation. Take Analysis Methodology (Assumptions, Model Development, Status) Comal Springs Riffle Beetle Specific Assumptions As discussed in the fountain darter section above, take is occurring at all times. Specific to the riffle beetle and Covered Activities, take from recreation, shoreline management, etc. occur today at varying levels regardless of springflow level. Take associated with pumping is most 4-93
222 directly tied to decreases in quantity and quality of habitat because of springflow reductions. This is first evident in Spring Run 3 and the critical discharge value at which this begins to occur is approximately 120 cfs total Comal springflow as a daily average. As total Comal springflows decline below 120 cfs, additional areas (spring runs and lake) are affected and differing levels of take start to occur. Similar to the long-term biological goals, the Comal Springs riffle beetle take assessment centers on a habitat-based approach within three main sample reaches in the Comal system. The three sample reaches include Spring Run 3, Western Shoreline of Landa Lake, and Spring Island area. In addition to the system-wide assumptions stated in , the following Comal Springs riffle beetle specific assumptions apply to this approach: Comal Springs riffle beetle analysis does not include subsurface habitat area. Comal Springs riffle beetle recruitment is maintained when wetted surface area is available. The former assumption is conservative because riffle beetles do use subsurface habitats. However, without a mechanistic ecological model to describe all the complexities that subsurface movement and habitat usage presents, this assumption is used to simplify a current unknown. The assumption regarding recruitment is thought to be true based on the empirical data. However, even if recruitment does continue, recruitment rates will likely be adversely affected by changing habitat conditions and the duration of periods of altered springflow. At the present time, there is not a modeling tool available to the HCP team to assess the potential effects of the Phase I package on Comal Springs riffle beetle recruitment. The Comal Springs riffle beetle take analysis focuses on the following components: Comal Springs riffle beetle density variability with flow and time Habitat quantity adjustments (recreation at Spring Island) relative to flow Comal Springs riffle beetle habitat quality adjustments relative to flow Physical habitat (Hardy 2009) and water quality modeling (Hardy 2010), along with actual observations (BIO-WEST 2002a 2011a) were used to estimate the levels of take relative to the HCP phased approach and HCP conservation measures. This was done by incorporating best available scientific information into the development of a Comal Springs riffle beetle habitat model. Comal Springs Riffle Beetle Habitat and Population Model Development A Comal Springs riffle beetle habitat model within each of the three sample reaches described above was developed using Stella 9.1 (Figure 4-22). The model includes actual field collected data for Comal Springs riffle beetles from 2004 to Both the spring and fall sampling periods over that six year span were incorporated into the model. The model was set up on a six-month time step to be consistent with the fountain darter models developed for the take analysis. 4-94
223 Each sample area was then evaluated to develop a wetted area to flow relationship (0 to 1.0 with 1.0 being the best). This exercise was based on Dr. Hardy s habitat model as well as from EAA Variable Flow Study observations over the past decade. For example, at daily average springflows of 60 cfs or less, Spring Run 3 is predicted to lose all surface flow for the portions of the spring run considered quality riffle beetle habitat. As such, flows less than 60 cfs were deemed unsuitable (Figure 4-23). Flows above 120 cfs ( Figure 4-22) were considered to provide the maximum quantity of wetted area for quality riffle beetle habitat in the spring Run. The western shoreline area was considered unsuitable at 20 cfs or less, while the Spring Island area was considered 0.25 suitable at 30 cfs and unsuitable at 0 cfs. The distinction between 20 cfs being unsuitable at the western shoreline, but still maintaining a small fraction of suitable habitat within the Spring Island area is because of the elevation of the springs and susceptibility of sedimentation along the western shoreline. However, with no springflow (0 cfs total Comal springflow as measured downstream at the USGS gage), it is assumed that vertical upwelling flow in the Spring Island area would be extremely minimal and thus, sedimentation of these remaining spring orifices would occur. 4-95

224 Figure Stella Model Interface for Comal Springs riffle beetle Habitat Model at Comal Springs. 4-96

225 Figure Wetted area to flow relationship for Spring Run 3 sample area. The second component entered into the model is the Comal Springs riffle beetle density values recorded per cotton lure in the Comal system over the six year sample period. Table 4-37 shows the minimum, 25 th, median, 75 th, and maximum densities recorded for Comal Springs riffle beetles per cotton lure. For the take analysis, it was assumed that riffle beetles were attracted to the lures from a distance of 3 m 2 surrounding the lure. The model is set up to allow for adjustments in this assumption if other interpretations are determined to be appropriate. However, for consistency and equal comparison among the scenarios, the 3 m 2 assumption was used. TABLE 4-37 COMAL SPRINGS RIFFLE BEETLE DENSITIES PER COTTON LURE PER SAMPLE AREA IN THE COMAL SYSTEM OVER TIME ( ) Spring Run 3 Western Shoreline Spring Island MIN th MEDIAN th MAX
226 A habitat quality ranking for riffle beetle density was then generated based on EAA variable flow data and professional experience from observations in the system. A ranking system (Table 4-38) was incorporated into the model as follows: TABLE 4-38 HABITAT QUALITY RANKING FOR COMAL SPRINGS RIFFLE BEETLE DENSITIES Density value from Description Ranking Value for Model Table 4-36 Unsuitable 1 Minimum Density Low quality 2 25 th Moderate quality 3 Median High quality 4 75th The habitat quality ranking based on riffle beetle density was then incorporated into the model for Spring Run 3 relative to the total Comal springflow condition (see Figure 4-21 lower left box labeled Relationship of Flow to Habitat Quality ). This adjustment was not included for the western shoreline or Spring Island sample areas in order to overestimate the effect of springflow. Since habitat quality in these two areas is primarily controlled by upwelling springs, it was determined that a quality adjustment based directly on the change in wetted area would be sufficient. However, Spring Run 3 has considerable horizontal springflow and as such it was given a quality factor associated with a change in springflow beyond just the change attributed to a reduction in wetted area. For example, from 120 to 190 cfs, the wetted area of Spring Run 3 receives a habitat quality of 3 and a horizontal springflow habitat quality of 3. However, between 200 and 320 cfs (total Comal springflow), the wetted area habitat quality remains a 3, but the springflow habitat quality is adjusted to a 4 to account for the assumed added benefit of horizontal springflow within this spring run. Above 320 cfs, the springflow habitat quality returns to a 3 to account for the undesirably high velocities generated at these discharges. Again, this analysis and the broad assumptions embedded in it highlight the need for the applied research and mechanistic ecological modeling outlined in Section 6.3. Two additional factors were included in the Comal Springs riffle beetle model. The first is an adjustment for recreation at Spring Island. (BIO-WEST 2006a). As the wetted area changes very little in this area as springflow declines, the wetted area adjustment is small. However, as this area can experience high levels of recreation, an adjustment factor was incorporated at this sample area to reflect the impact that recreation might have on habitat quality. Second, a Spring Run 3 extinction factor was built into the model. As is, the model consists of 18, 6-month time steps but the time steps are not connected with memory. As such, a total Comal Springflow of 30 cfs at time step 9 would create no surface flow in Spring Run 3 and the model subsequently predicts no riffle beetle habitat and accordingly, no beetles. However, if time step 10 involved springflow greater than 60 cfs, which would mean restored surface flow to Spring Run 3, the site would again contain habitat as well as a model generated riffle beetle 4-98
227 Total Comal Springflow (cfs) population. The extinction factor overrides that aspect of the step 10 calculation to zero out the model generated population based on the assumption that the loss of surface flow extirpated the population and that re-colonization did not occur. It can easily be argued that this is overly conservative as we know subsurface habitat is used by the beetles, and they did survive the 1950s drought of record with extended periods of zero surface flow. (BIO-WEST 202b). However, this analysis is not meant to revisit that discussion, but rather provide a worst-case scenario in which all Spring Run 3 riffle beetle habitat was lost and beetles were unable to recolonize. Comal Springs Riffle Beetle Species Status To establish a Current Conditions of what the approximate Comal Springs riffle beetle population has been within the sample reaches in the Comal system from 2002 through 2010, the actual hydrology from that time period (Figure 4-24) was incorporated into the model. Additionally, constant flows from 10 to 450 cfs (in 10 cfs increments) were modeled to evaluate the model response to total Comal springflow Total Springflow Evaluation Current Time (months) Figure Total Comal springflow current scenario ( ) evaluated in Stella. Figure 4-25 shows the Stella model results for total Comal Springs riffle beetles within the sample areas. For all model runs, the springflow dependent habitat quality adjustment for Spring Run 3 was used. Additionally, the recreation toggle for Spring Island was activated. The riffle beetle habitat model differs from the fountain darter model in that there is not an aquatic vegetation input that changes over time regardless of flow level. As such, each independent flow level will produce one habitat estimate which in turn calculates the corresponding population number. This difference in the model is of no consequence because the riffle beetle does not use aquatic vegetation as its habitat. Further the detritus that the riffle 4-99
228 Comal Springs riffle beetles beetle use as a food source is not from aquatic vegetation but from leaf litter from the riparian areas. Springflows exhibited during the existing period ranged from 150 cfs to 800 cfs which results in a modeled population estimate of between approximately 25,000 and 30,000 riffle beetles. The population estimate is only for the sample areas and clearly is an approximation based on the assumptions stated above. These assumptions add uncertainty regarding the actual number of Comal Springs riffle beetles present in the system and as projected by this modeling exercise. However, for this take analysis, this approach provides a level of consistency for scenarios that allows for a meaningful comparison across different modeled flow regimes. 35,000 30,000 Comal Springs riffle beetles (within sample areas) versus Springflow as predicted by Stella Habitat Model 25,000 20,000 15,000 10,000 Range of predicted Existing ( ) Riffle Beetle population in sample areas 5, Springflow (cfs) Figure Comal Springs riffle beetles (within sample areas) predicted by Stella model (blue line). Shaded area is the predicted range of current ( ) population within sample areas. Evaluation of Effects of Action and Environmental Baseline Versus Current Condition To assess the Phase I package, No Action Baseline, and Existing Baseline, the monthly flow data provided by HDR and presented in Section was used. (See Figure 4-8). Figures 4-16 through 4-18 show the total predicted Comal springflow for each of the respective nineyear periods assuming different flow conditions for each scenario. For the take analysis, these three flow sequences were converted into 6-month time steps and entered into the Stella riffle beetle model. Table 4-39 shows the model results for all three springflow conditions over the 18 6 month time steps. The most notable result is that the No 4-100
229 Action and Existing baselines both result in zero Comal Springs riffle beetles in the sample reaches during, and following, a repeat of conditions similar to the drought of record. This would most likely translate to the entire system and result in extirpation of the species. Figure 4-26 graphically depicts the differences between the HCP, No Action Baseline, Existing Baseline, and Historical model during the low-flow period and Current Conditions ( ). The loss of riffle beetles during the No Action and Existing baselines low flow scenarios is visually evident in Figure 4-26, while the HCP low flow scenario still maintains an overall population of riffle beetles. However, neither Table 4-39 or Figure 4-26 illustrate individual sample area breakout. The model predicts the habitat and population estimates for each individual sample area and those results are shown in Table 4-40 which presents the breakdown of Comal Springs riffle beetles per sample area for Current Conditions, and modeled results during the low-flow representative period for the HCP, No Action Baseline, Existing Baseline, and Historical model scenarios. From this breakout, it is evident that using the Spring Run 3 extinction function in the model, riffle beetles in Spring Run 3 could be lost during the HCP-Phase I package low flow scenario. Again, this function assumes the elimination of the potential for beetle occurrences when wetted surface area is no longer present. It does not allow for subsurface movement or re-colonization from surrounding surface water habitats. This is likely somewhat of a worst-case scenario, as historically the entire system quit flowing for 144 consecutive days and the Comal Springs riffle beetle survived. Under the Phase I package lowflow scenario, monthly springflow estimates for the entire system do not fall below 27 cfs (monthly average), and that occurs for only two months. Regardless, if overly conservative or not, the point is to highlight the potential for impact and be consistent across analysis to allow the USFWS the ability to make a determination on appreciable reduction issuance criterion for the Comal Springs riffle beetle with the Phase I package
230 Table Total Comal Springs riffle beetles within Sample Reaches for the Phase I package, No Action Baseline, Existing Baseline, and Historical Conditions Comal System: Habitat Quality Adjusted by Sample Reach Low, Moderate, High represent 9- year model run periods generated for each alternative. Time step HCP - No Action Existing Phase 1 Baseline Baseline Historical HCP - No Action Existing Phase 1 Baseline Baseline Historical HCP - No Action Existing Historical Phase 1 Baseline Baseline LOW-Flow Representative Period MODERATE-Flow Representative Period HIGH-Flow Representative Period 1 24,765 24,765 24,765 29,974 24,765 24,765 24,765 29,974 29,974 29,974 29,974 29, ,715 15,316 21,197 29,974 24,765 20,778 23,296 29,974 29,974 24,765 29,974 29, ,765 24,765 24,765 29,974 24,765 24,765 24,765 24,765 24,765 24,765 24,765 24, ,109 6,155 7,225 29,974 22,666 12,027 14,126 24,765 24,765 24,765 24,765 24, ,456 15,158 21,197 29,974 24,765 24,765 24,765 24,765 24,765 24,765 24,765 29, ,214 2,854 3,591 24,765 24,765 24,765 24,765 29,974 29,974 29,974 24,765 29, ,721 6,477 11,269 24,765 29,974 24,765 29,974 29,974 29,974 29,974 24,765 29, ,400 1,863 2,193 24,765 24,765 24,765 24,765 29,974 24,765 24,765 29,974 22, ,617 12,937 13,889 29,974 29,974 24,765 29,974 29,974 24,765 24,765 29,974 24, ,027 1,211 1,583 24,765 24,765 24,765 29,974 29,974 24,765 24,765 29,974 24, ,919 5,404 5,941 24,765 24,765 24,765 29,974 29,974 29,974 24,765 29,974 29, , ,617 24,765 24,765 24,765 29,974 24,765 24,765 29,974 29, ,027 1,677 2,083 24,135 29,974 29,974 29,974 29,974 24,765 29,974 24,765 24, , ,987 29,974 24,765 29,974 29,974 24,765 24,765 24,765 24, , ,726 29,974 29,974 29,974 24,765 24,765 24,765 24,765 24, , ,974 29,974 29,974 24,765 29,974 29,974 24,765 24, , ,430 29,974 29,974 24,765 24,765 29,974 29,974 24,765 24, ,521 4,331 4,760 22,521 29,974 29,974 29,974 24,765 29,974 24,765 29,974 29,974 Min 4, ,666 12,027 14,126 24,765 24,765 24,765 24,765 22,456 Average 14,884 6,834 8,036 22,591 26,963 25,283 26,697 27,948 27,080 26,501 27,080 26,952 Max 24,765 24,765 24,765 29,974 29,974 29,974 29,974 29,974 29,974 29,974 29,974 29,
231 Total Riffle Beetles 35,000 Predicted Total Comal Springs Riffle Beetles within Sample Areas - during "LOW-Flow" Representative Period HCP - Phase 1 No Action Baseline Existing Baseline Historical 30,000 25,000 20,000 15,000 10,000 5, month timesteps Figure Total Comal Springs riffle beetles within sample areas predicted during the Low-flow representative period for the Phase 1 Package, No Action Baseline, Existing Baseline, and Historical Conditions Comal System: Habitat Quality Adjusted by sample area 4-103
232 Table Total Comal Springs riffle beetles per sample area for Current Conditions, Phase I package, No Action Baseline, Existing Baseline, and Historical model scenarios for the Low-Flow representative period. Scenario Range of Comal Springs Riffle Beetles in Sample Areas of the Comal System Minimum Average Maximum CURRENT (Total) 24,765 26,791 29,974 Spring Run 3 2,244 2,424 2,706 Western Shoreline 1,764 2,058 2,520 Spring Island 20,757 22,309 24,748 HCP Phase 1 (Total) 4,116 14,884 24,765 Spring Run ,244 Western Shoreline 298 1,208 1,764 Spring Island 3,819 12,910 20,757 No Action Baseline (Total) 0 6,834 24,765 Spring Run ,244 Western Shoreline ,764 Spring Island 0 6,005 20,757 Existing Baseline (Total) 0 8,036 24,765 Spring Run ,244 Western Shoreline ,764 Spring Island 0 6,972 20,757 Historical Model (Total) ,591 29,974 Spring Run 3 0 1,751 2,706 Western Shoreline 0 1,776 2,
233 Spring Island ,065 24,748 Unlike for the fountain darter, there is not presently a way to translate the riffle beetle population estimates per sample area to the total Comal system. Table 4-41 presents the size of each Comal Springs riffle beetle sample area and the percentage of total sample area it represents. Using just the sizes of the sample areas, if the Spring Run 3 sample area habitat was completely lost during the Phase I package low-flow scenario, approximately seven percent of the total sample area would be lost. Assuming some areas within the Western Shoreline and Spring Island sample areas would be unsuitable during 30 cfs total Comal springflow as a daily average, approximately 70 to 80 percent of these three main (sampled) areas would likely sustain riffle beetle habitat. Considering Spring Runs 1 and 2 also host Comal Springs riffle beetles and would be dry at similar times to Spring Run 3, this percentage would decrease if they were included in the overall assessment and same assumptions maintained. However, because the same level of long-term data for these other spring runs and for other upwelling areas within Landa Lake where beetles have also been found is lacking, no attempt was made to translate the populations found in the three sample areas to the entire system. Table sample area. Size (m 2 ) of three Comal Springs riffle beetle sample areas and percentage of total SAMPLE AREA SIZE (m 2 ) Percentage of Total Spring Run % Western shoreline of Landa Lake 378 7% Spring Island 4,790 86% Effects of Action Added to the Environmental Baseline Based on the Comal Springs riffle beetle habitat and population model results, it is evident that the No Action Baseline and Existing Baseline will both cause incidental take during average to above average springflow conditions, but likely within the range of variability experienced during the Current Conditions. More notably, modeling shows that both baseline might cause extirpation of the Comal Springs riffle beetle from Comal Springs during a repeat of conditions similar to the drought of record. The word might is used for the riffle beetle versus the use of will for the fountain darter in Section because of the uncertainty surrounding subsurface habitat use by the beetles. All modeling activities were based on a surface habitat assessment alone. The Phase I package will similarly result in incidental take during periods of average to above average springflow conditions (again within the range of variability experienced during the Current Conditions). However, even based on an assumption of use of surface habitat alone, the Phase I package is not projected to result in extirpation of the riffle beetle at Comal Springs. A large amount of incidental take may be experienced with the Phase I package relative to the Current Conditions under flow conditions similar to the drought of record. During these extreme conditions, with all HCP conservation measures, there is the potential for a 100 percent reduction in surface habitat in Spring 4-105
234 Run 3, and approximately an 80 percent reduction of surface habitat at the Western Shoreline and Spring Island sample areas. Compared to Current Conditions observed over the past nine years and based on the sample areas alone, this translates to potential take of up to approximately 20,000 Comal Springs riffle beetles during these extreme drought conditions, which could potentially leave approximately 4,000 beetles within these sample areas. At this time, it is impossible to predict the actual level of Comal Springs riffle beetle take (in terms of habitat quantity or Comal Springs riffle beetle numbers) over the 15-year HCP period as natural variability of the population of this species is large. As such, a conservative, near worst case, scenario based on the best science available currently is presented above. Should flows remain fairly average; and the HCP conservation measures be nominally successful, then the amount of take will likely be very low. Conversely, should full utilization of permitted pumping rights start in 2013; followed by a 10-year drought similar in nature to the drought of record; in conjunction with the HCP conservation measures not having a chance to be fully tested or implemented, then the potential for take of 80 percent or more of the current population is possible. It is critical that long-term monitoring, applied research, and mechanistic ecological models are performed and developed for this species as the HCP moves forward considering the uncertainty surrounding this analysis. A major factor that has the potential to dramatically change this take analysis is achieving a better understanding of riffle beetle use of subsurface habitat. As discussed above for the fountain darter, when added to the No Action or Existing Baseline, the Phase I package results in an improvement for the Comal Springs riffle beetle based on springflow protection alone. This is highlighted in Figure 4-26 (black line [HCP] versus red or blue line [No Action Baseline and Existing Baseline, respectively]). Thus, compared to either baseline, the HCP should not appreciably reduce the likelihood of the survival and recovery of the Comal Springs riffle beetle even through a repeat of conditions similar to the drought of record. Factors supporting this conclusion include the projected remaining surface habitat and associated modeled population numbers within the sample areas, empirical data of the survival of this species during the drought of record (in which conditions were considerably worse than even the worse-case scenario modeled for the Phase I package), and the additional HCP conservation measures included with the Phase I package. Applied research and modeling conducted during Phase I are anticipated to provide valuable information on the low-flow requirements and subsurface habitat use of the Comal Springs riffle beetle, which will inform any Phase I and Phase II adjustments that may be necessary. (See, e.g., Section ). From the statistical flow analysis presented in Table 4-30 it is evident that periods of low-flow will be extended for the HCP alternative compared to what was historically observed. As discussed in Section , this along with the long-term average flow management objective will need to be evaluated during Phase I activities. Comal Springs Dryopid Beetle and Peck s Cave Amphipod The Comal Springs dryopid beetle and Peck s Cave amphipod are subterranean species inhabiting the Comal system
235 Habitat Requirements and Current Conditions The habitat requirements of the Comal Springs dryopid beetle are: (1) high-quality water with pollutant levels of soaps, detergents, heavy metals, pesticides, fertilizer nutrients, petroleum hydrocarbons, and semi-volatile compounds such as industrial cleaning agents no greater than those documented to currently exist and including: (a) low salinity with total dissolved solids that generally range from 307 to 368 mg/l; (b) low turbidity that generally is less than 5 NTUs; (c) aquifer water temperatures that range from approximately 68 to 75 o F (20 to 24 o C); and (d) a hydrologic regime with turbulent flows that provide adequate levels of dissolved oxygen in the general range of 4.0 to 10.0 mg/l for respiration of the Comal Springs dryopid beetle; and (2) food supply for the Comal Springs dryopid beetle that includes, but is not limited to, detritus (decomposed materials), leaf litter, and decaying roots. (72 FR 39,248 (July 17, 2007)). The habitat requirements of the Peck s cave amphipod are: (1) high-quality water with pollutant levels of soaps, detergents, heavy metals, pesticides, fertilizer nutrients, petroleum hydrocarbons, and semivolatile compounds such as industrial cleaning agents no greater than those documented to currently exist and including: (a) low salinity with total dissolved solids that generally range from 307 to 368 mg/l; (b) low turbidity that generally is less than 5 NTUs; and (c) aquifer water temperatures that range from approximately 68 to 75 o F (20 to 24 o C); and (2) food supply for the Peck s cave amphipod that includes, but is not limited to, detritus (decomposed materials), leaf litter, and decaying roots. (Id. at 39,254) Peck s cave amphipods and Comal Spring dryopid beetles have been collected at least semi-annually over the past 10 years via drift netting over spring orifices employed for the EAA Variable Flow Study. The details of the sampling protocol and results can be found in BIO-WEST 2002a 2011a). Take Thresholds Relative to Springflow The subterranean nature and restricted range of the Comal Springs dryopid beetle (to the headwaters of the springs and spring upwelling areas) suggests that it does not require substantial surface discharge from springs to survive and presumes that springflow (of sufficient water quality) that continually covers the spring orifices should prevent harm to the population. EARIP (2009). Similarly, EARIP (2009) concludes that the Peck s Cave amphipod requirements include sufficient springflow covering the spring orifices and adequate water quality to prevent harm to the species. An assumption carried forward in the HCP is that as subterranean species, mechanisms exist for these species to retreat into the Edwards Aquifer should spring flows cease at the spring outlets at Comal Springs. With that assumption, a modest amount of springflow should be sufficient to protect habitat for these species. Therefore, take is considered to start for the Comal Springs dryopid beetle and Peck s Cave amphipod at the time spring orifices become exposed which is predicted to be around 120 cfs for Spring Runs 1 and 2. At a daily average flow of 30 cfs total discharge in the Comal River, several springs remain flowing and provide habitat for the subterranean species up to the spring openings. As some spring orifices are exposed at this total discharge, management responses discussed in Chapter 6 are recommended below 30 cfs total Comal discharge. The potential for risk greatly increases as flows decrease to near zero flow. Take Analysis Methodology (Assumptions, Model Development, Status) 4-107
236 The sparse amount of data for these species did not support the development of a Stella habitat or population model at this time. The limited existing data and inability to model these species led to a qualitative assessment of take for these two subterranean species. For surface dwelling species, take can be quantified relative to amounts of and disturbance to surface habitats. However, for subterranean species, the assessment is very different with the focus shifting to providing continuous springflow and protection of water quality. Evaluation of Effects of Action and Environmental Baseline Versus Current Condition Although a considerable number of Peck s cave amphipods have been expelled from the aquifer and collected in drift nets over the years, it is difficult to describe the current population within the aquifer with any confidence. Additionally, there is insufficient data for the Comal Springs dryopid beetle to even attempt this exercise. As such, no attempt was made to quantitatively describe a known Current Condition to compare against. A concern identified, during these low-flow periods which will require further research includes the impacts to the energy flow regime in the Aquifer and near the springs. Aquifer species do not typically use live green plants as their primary nutrient source, but instead rely on carbon sources that are carried through the Aquifer in conduits. Organic carbon is measured in terms of POC/DOC (Particulate/Dissolved Organic Carbon), FBOC/CBOC (Fine/Coarse Benthic Organic Carbon), and in other ways. The natural flow of this carbon through the Aquifer may be altered during times of drought, when fewer rain events are pushing material through recharge features and pumping is removing disproportionately large volumes from wells. The natural energy flow allows for nutrients to remain in the system until the flow reaches the downstream most point (the spring), while this altered regime could interrupt that system and potentially impact the species. Other carbon sources include native terrestrial vegetation along the banks of the spring and spring runs that provides habitat and food sources for the parts of the populations that occur at the spring orifice. Rootlets extend directly into the water and terrestrial plant material falls into the water and is the source of organic carbon that is part of the food chain for many aquatic invertebrates. Finally, the importance of dissolved organic matter from other sources within the Aquifer (e.g., geomicrobial) to these spring and Aquifer species is also not well understood. However carbon by-products from these chemolithoautotrophs are recognized as the base of the food chain for deep Aquifer species, and their presence at spring openings suggests they may play a significant role in the food chain of spring species
237 Effects of Action Added to the Environmental Baseline For subterranean species, average to above average springflow conditions projected for both the Covered Activities and No Action Baseline (Figure 4-22) would likely have only minimal take associated with Covered Activities. During conditions similar to a repeat of a drought of record, neither the No Action Baseline, nor Existing Baseline are projected to maintain continuous springflows whereas the Phase I package does maintain such flows. (Figure 4-9a). The complete cessation of springflow for either Baseline would likely lead to considerable take and possibly jeopardize the continued existence of one or both species. Compared to average and above springflows, the springflows projected during a repeat of conditions similar to the drought of record for the Covered Activities and Phase I package would lead to additional take as spring orifices in the main spring runs would cease flowing for short periods of time. However, this increase in take would not approach that expected under the No Action or Existing baseline scenarios. There is uncertainty regarding this qualitative analysis, which again highlights the necessity of applied research, expanded biological and water quality monitoring, and ecological modeling. As discussed for the other Comal species, when added to the No Action Baseline or Existing Baseline, the Phase I package results in an improvement for the likelihood of the survival and recovery of both the Peck s cave amphipod and Comal Springs dryopid beetle based on springflow protection alone. The Phase I package is protective of these subterranean species through a repeat of conditions similar to the drought of record during the initial phase of the permit because of the continuous springflow and resulting habitats throughout upwelling areas in the Landa Lake, empirical data of the survival of these species during the drought of record (in which conditions were considerably worse than even the worse-case scenario modeled for the Proposed Action), and the additional minimization and mitigation measures included with the Phase I package. The hydrology associated with the Phase I package and hydraulic modeling shows that during conditions similar to those experienced during the drought of record, the main spring runs will not maintain surface flow and thus, habitat will be impacted. However, hydraulic modeling (Hardy 2010) projects that upwelling areas along the western shoreline of Landa Lake and near Spring Island will be maintained. Although impact to habitat is likely in areas of decreased or diminished surface flow during extreme conditions, continuous springflow should be sufficient to maintain the subsurface physical habitat necessary to prevent destruction or adverse modification to critical habitat. As these are subterranean species, the larger threat to the primary constituents of critical habitat is contamination of aquifer water quality. However, as described in Chapter 5, specific HCP conservation measures will be implemented to protect aquifer water quality and to expand the existing water quality monitoring network at Comal Springs. Edwards Aquifer Diving Beetle Habitat Requirements and Current Conditions The Edwards Aquifer Diving Beetle is a subterranean species in the family Dytiscidae, and occurs both at Comal Springs and in the Artesian Well in the San Marcos Springs area. To prevent duplication, impacts to the species in both systems will be addressed in this subsection. The species 4-109
238 is not currently listed, but may be listed in the future due to a positive 90-day finding to a petition (USFWS 2009a and 2009b). 12 The state of knowledge of this species is similar to the Comal Springs dryopid beetle although this species has not previously been included in any species-specific monitoring during the EAA Variable Flow Study. Take Thresholds Relative to Springflow The subterranean nature of this species suggests that it does not require substantial surface discharge from springs to survive and presumes that springflow (of sufficient water quality) that continually covers the spring orifices should prevent harm to the population related to habitat loss from dewatering. Given that assumption, take is considered to start for the Edwards Aquifer diving beetle at the Comal Spring system at the time spring orifices become exposed, which is predicted to be around 120 cfs as a daily average flow. (Hardy 2010) At 30 cfs as daily average for total discharge in the Comal River system, several springs remain flowing and provide habitat for the subterranean species up to the spring openings. As some spring orifices are exposed at this total discharge, management responses (i.e., additional monitoring and potentially off-site refugia) discussed in Chapter 6 are recommended below a daily average of 30 cfs total Comal discharge. The potential for risk greatly increases as flows decrease to near zero flow. In the San Marcos Spring system, a conservative measure for take for the Edwards Aquifer diving beetle is a daily average of 50 cfs total discharge in the San Marcos River. As the flows decline below 30 cfs, the potential for risk increases and management responses are included as a component of the AMP and described in Chapter 6. Take Analysis Methodology (Assumptions, Model Development, Status) The sparse amount of data for this species did not support the development of a Stella habitat or population model at this time. The limited existing data and inability to model this species led to a qualitative assessment of take described below with the focus on providing continuous springflow and protection of water quality. Evaluation of Effects of Action and Environmental Baseline versus Current Condition As there is insufficient data for the Edwards Aquifer diving beetle, no attempt was made to quantitatively describe a known Current Condition against which to compare. As with the Comal Springs dryopid beetle and the Peck s Cave amphipod, the details of the Aquifer food chain are not well understood and additional concerns beyond the preservation of habitat related to springflow include the maintenance of a natural flow of carbon through the system. This carbon flow may be disrupted with combined drought and high levels of pumping. 12 The concept of take applies only to listed species, and, thus, does not directly apply to species such the Edwards Aquifer Diving Beetle. However, non-listed species included as Covered Species are to be treated as though they were listed. Accordingly, take is used here to describe impacts to those species
239 Effects of Action Added to the Environmental Baseline An informal qualitative take assessment was attempted but the sparse amount of data for this species limited that evaluation. As with the listed Comal subterranean species, take of this species is anticipated to occur with the drying of surface habitat near spring orifices during periods of extreme drought. As a subterranean species, the larger threat is likely contamination of aquifer water quality. As such, specific HCP conservation measures will be implemented to protect aquifer water quality and to expand the existing water quality monitoring network at Comal and San Marcos springs. As discussed for the other Comal species, when added to the No Action Baseline or Existing Baseline, the Phase I package results in an improvement for the Edwards Aquifer diving beetle based on springflow protection alone. Following the same rationale as described above for the listed Comal subterranean species, it is expected that the HCP conservation measures relative to aquifer water quality described in Chapter 5 addressing issues such as impervious cover, low impact development, minimizing the impacts of contaminated runoff, and increased monitoring will be sufficient to minimize and mitigate the impacts of any cumulative effects from increased development. Thus, the Phase I activities should not appreciably reduce the likelihood of the survival and recovery of the species during the initial period of the permit and contribute to attaining the long-term biological goals for the species. Comal Springs Salamander A population of salamanders occurs at Comal Springs, and for the purposes of this HCP we use the common name Comal Springs Salamander that refers only to this population, in accordance with the federal listing petition for the species Eurycea sp. 8 (USFWS 2009a and USFWS 2009b). The species is not currently listed as endangered, but may be listed in the future as FWS has made a positive 90- day finding in response to the petition. Habitat Requirements and Current Conditions The EAA Variable Flow Study has been collecting data on the Comal Springs salamander since fall (BIO-WEST 2002a-2011a). The range and locations of habitat in the Comal system is similar to that of the Comal Springs riffle beetle but with somewhat larger areas and an extension upstream of Spring Island. Generally the habitat needs are similar to the San Marcos salamander which includes preference for silt-free rocks for cover, aquatic vegetation for cover and the support of invertebrate prey items, and a natural quantity and quality of water from the springs. Take Thresholds Relative to Springflow Similar to the Comal Springs riffle beetle, it is believed that take of Comal Springs salamander surface habitat begins to occur at approximately 120 cfs as a daily average at the main spring runs. Hardy (2009) documents that wetted area in the spring runs decreases between 150 and 100 cfs. Hardy (2009) predicts greater reductions in surface habitat in all three spring runs below 100 cfs. Additionally, there is no surface habitat predicted for Spring Runs 2 or 3 at a daily average of 30 cfs total discharge. (Hardy 2009). Although the modeling of surface habitat addresses changing conditions within the three main spring runs, it is important to reiterate that a large proportion of Comal Springs salamander habitat exists along the Western Shoreline of Landa Lake and at upwellings within Landa Lake. Figure 4-21 shows that the spring upwelling areas in Landa Lake and the Western 4-111
240 Shoreline will remain inundated at 30 cfs whereas Spring Run 3 would likely go subsurface except for near the terminus into Landa Lake. Take Analysis Methodology (Assumptions, Model Development, Status) As this salamander is not presently a listed species, the development of a Stella habitat or population model was not conducted. Rather a qualitative assessment of take was conducted for the Comal Springs salamander. As discussed previously, take is an on-going reality for surface dwelling species at Comal Springs from both Covered Activities and ongoing activities outside the purview of the HCP. Evaluation of Effects of Action and Environmental Baseline versus Current Condition As this salamander is not presently listed, and a quantitative modeling approach was not employed, there was no attempt to quantitatively describe a known Current Condition for which to compare against. Rather, based on the overlap of Comal Springs salamander and Comal Springs riffle beetle populations, a qualitative assessment of salamander take was conducted based partially on the quantitative assessment of riffle beetle habitat discussed above. Effects of Action Added to the Environmental Baseline Based on the underpinnings (hydraulic modeling of surface habitat) of the Comal Springs riffle beetle assessment, it is likely that the No Action Baseline and Existing Baseline will cause incidental take of Comal Springs salamanders during average to above average springflow conditions. More notably, habitat modeling for the riffle beetle suggests that the No Action Baseline and Existing Baseline might cause extirpation of the Comal Springs salamander from Comal Springs during a repeat of conditions similar to the drought of record. The word might for the salamander is used here because of the uncertainty surrounding subsurface habitat use by the salamander and the fact this assessment is based in part on surrogate modeling efforts. The Phase I package will similarly cause incidental take during periods of average to above average springflow conditions. However, even based on surface habitat alone, the Phase I package is not projected to cause extirpation of the Comal Springs salamander at Comal Springs. Similar to the riffle beetle, it is likely that a large amount of incidental take (habitat and salamanders) could be experienced with the Phase I package relative to the Current Condition under flow conditions similar to the drought of record. During these extreme conditions, with all HCP conservation measures, there is the potential for a 100% reduction in Spring Run 3 surface habitat. As discussed for the riffle beetle, when aggregated with the No Action Baseline or Existing Baseline, the Phase I package results in an improvement for the Comal Springs salamander based on springflow protection alone. Thus, similar to the riffle beetle, the Phase I package should be protective of the Comal Springs salamander in the Comal System through a repeat of conditions similar to the drought of record because of the projected remaining surface habitat, empirical data of the survival of this species during the drought of record, and the additional HCP conservation measures included with the Phase I package
241 San Marcos Springs/River Ecosystem The following sections describe the individual species analysis that was conducted for the HCP. As a result of the EARIP EARIP deliberations and flow-regime development process, the subsequent HCP team s and Dr. Hardy s independent analysis of protective flow-regimes in conjunction with potential minimization and mitigation measures, and the development of the long-term biological goals for the HCP, a wealth of data has been compiled, condensed, and evaluated. This take analysis builds on the work from those efforts, with the EAA Variable Flow Study data collected over the past decade, along with the hydraulic/habitat and water quality modeling conducted by Dr. Hardy. However, even with this level of data and analysis, a complete interactive analysis is not possible with the existing tools available. As such, a mechanistic ecological model will be developed during Phase I of the HCP. For the take analysis at San Marcos Springs several system-wide assumptions are embedded. These assumed management actions include: Restoration of native aquatic vegetation in select segments of the San Marcos River (Section 5.3.8). Sediment removal in the San Marcos River within Sewell Park (Section 5.3.6). Re-establishment of Texas wild-rice in key habitat areas throughout the river (Section 5.3.1). Protection of aquifer water quality (Sections 5.72, 5.74, and 5.7.6) Control of gill parasites, non-native species (plant and animal), and predation and competition (native and non-native species) (Sections and 5.3.9). In addition to these system-wide assumptions, there are several species-specific assumptions that will be highlighted in their respective sections below. The format of the incidental take assessment includes a description of the approach employed for a specific species, followed by the results of comparative scenarios for the Phase I package as well as the No Action Baseline. For the Comal System, there was a considerable difference in the modeled discharge for Comal Springs relative to the No Action Baseline and Existing Baseline (Figure 4-8 and 4-9a). Those considerable differences led to an independent analysis of impacts associated with the Environmental Baseline for Comal Springs. However, as evident in Figures 4-10a and 4-10b there is essentially no difference in the modeled No Action Baseline and Existing Baseline hydrographs at San Marcos Springs. Slight differences are evident in the Table 4-31 breakdown but these are not large enough to result in any meaningful difference in the impact assessment as conducted for this take analysis. Therefore, throughout the San Marcos Covered Species assessments, only the No Action Baseline was carried forward. In the event where achievement of species-specific assumptions is essential for the protection of the species, they are highlighted and a comparison with and without those assumptions is provided. As with Comal Springs, the San Marcos Springs assessment is complicated by the extremely low flows projected by the No Action Baseline and Existing Baseline during conditions similar to the drought of 4-113
242 record. It is possible that those springflow levels would extirpate the fountain darter at San Marcos Springs. It is likely that other covered species at San Marcos Springs might also suffer the same fate under the No Action Baseline and Existing Baseline. This will be discussed in the respective Effects of Action Added to the Environmental Baseline sections for each covered species. Fountain Darter Fountain darters were first collected in the San Marcos River in 1884 from immediately below the confluence with the Blanco River and have a current distribution in the San Marcos River from Spring Lake to an area between the San Marcos wastewater treatment plant outfall and the confluence with the Blanco River. (See EARIP 2009). Biological monitoring for fountain darters conducted over the past ten years (BIOWEST 2002b b) has focused on three main reaches of the San Marcos Springs system: Spring Lake (adjacent to the old hotel/current TPWD offices), City Park (near Lions Club tube rental), and Interstate 35 (below Cheatham Street to near IH-35). (See Figure 4-2). Habitat Requirements and Current Conditions Data collected from the EAA Variable Flow Study since 2002 suggest that the highest quality fountain darter habitat is located within Spring Lake. Spring Lake maintains exceptional water quality conditions, a diverse aquatic vegetation community, and supports year round reproduction of fountain darters which contributes to the continuance of large populations of fountain darters in the lake (EARIP 2009). The City Park and IH-35 reaches both maintain more variable habitat conditions for fountain darters that are related to total San Marcos River discharge (BIO-WEST 2002b 2011b) with seasonal fountain darter reproduction peaking during the spring. Compared to Spring Lake or Landa Lake of the Comal Springs system, the habitat in these downstream reaches is of lesser quality to fountain darters due to swifter currents, vegetation types, and recreational activities. As such, Spring Lake is considered prime habitat with downstream habitat being considered less that optimal with decreasing quality extending downstream. Flow conditions and recreation, both of which influence the aquatic vegetation community within the San Marcos river are the key contributors to why downstream habitat in the San Marcos River is considered less than optimal compared to prime habitat in Spring Lake. Monitoring since 2002 (BIO-WEST 2002b 2011b) shows a total San Marcos Springs System discharge of greater than 125 cfs provides high quality fountain darter habitat throughout most of its range, excluding periods of high flow pulses. Indirect impacts associated with recreational activities in City Park occur each year regardless of flow condition but are magnified during lower flows as described in EARIP (2009). Considerable habitat alteration has occurred several times since 2000 as a result of high flow pulses (heavy localized rain events) scouring out extensive areas of aquatic vegetation. These time periods are generally short-lived (hours to days) and the aquatic vegetation typically recovered and/or expanded in one to six months. (EARIP 2009). BIO-WEST (2007c) has concluded that these represent flow events that have direct impacts on fountain darter habitat, but only on a temporary time scale. On-going monitoring continues to confirm the importance of aquatic vegetation to the fountain darter. The type and quality of the aquatic vegetation in the system appears to be a primary factor affecting 4-114
243 the density of darters in the San Marcos Springs/River ecosystem. Therefore, take as defined by the USFWS is triggered at the level at which aquatic vegetation declines or adverse temperature effects are possible as a result of reduced springflow. For the San Marcos Springs/River ecosystem, this potential for decline first occurs in the downstream-most areas of fountain darter habitat because of increasing water temperatures and potential impacts on aquatic vegetation. Take Thresholds Relative to Springflow The focus of this assessment is on the incidental take associated with Covered Activities with emphasis on springflow reductions and recreation. It is clear that reduced springflow decreases both the quantity and quality of aquatic vegetation and physical parameters (fountain darter habitat), or causes limitations to the larval recruitment success of the fountain darter. The difficulty is in accurately assessing the point at which this first occurs. Since the time when the USFWS first identified a critical discharge value at which take is believed to occur, there has been a wealth of data collected and habitat and water quality modeling conducted to help inform this decision. Based on data collected over the past decade, it appears that the combination of sedimentation, low water levels, and recreation first cause take in the form of fountain darter habitat impacts as total discharge declines to approximately a daily average of 100 cfs in the system. At this total discharge level, conditions within Spring Lake remain relatively unchanged; however, conditions within Sewell Park and City Park start showing reductions in aquatic vegetation (EARIP 2009). For the San Marcos River (downstream of Spring Lake), approximately 90, 80, and 75 percent of the available weighted usable area predicted at average San Marcos River total discharge remains at 100, 50, and 30 cfs total San Marcos River discharge, respectively. Hardy (2010). Hardy (2010) water temperature modeling shows that, at a 80 cfs daily average total discharge, Spring Lake and the river downstream through Sewell Park remain suitable for fountain darter reproduction at all times. From City Park downstream, as a result of temperature increases during portions of each day (under worst case modeled conditions), increased larval mortality and reduced egg production are indicated. However, at no location in the river does water temperature exceed conditions for juvenile or adult fountain darter survival. At a daily average flow of 45 cfs, water temperature in Spring Lake habitats does not exceed any of the aforementioned water quality checkpoints (Hardy 2010). At 45 cfs, the San Marcos River from Spring Lake dam to the extent of fountain darter habitat from City Park downstream is predicted to have portions of each day (under worst case modeled conditions) with water temperatures high enough to cause increased larval mortality and reduced egg production. However, as noted for 80 cfs, a daily average flow of 45 cfs does not result in any locations in the river where water temperatures are predicted to exceed conditions for juvenile or adult fountain darter survival. Although take is first evident at 100 cfs in the river, considering that Spring Lake harbors a large amount of high quality habitat and large fountain darter population, considerable take for the fountain darter relative to the total population is not anticipated in the San Marcos system until around 50 cfs total San Marcos discharge. Gill parasites, the presence of exotic species (primarily suckermouth catfishes and ramshorn snails), water quality degradation, and recreation all have consequences on the fountain darter populations. One additional factor for the San Marcos Springs/River ecosystem relevant to fountain darters is increased sedimentation. (EARIP 2009). Minimization and mitigation measures to reduce impacts 4-115
244 from these threats are included in the HCP (Chapter 5), and integral to the protection of fountain darters. Finally, since low-flow data and habitat responses are not available at this time, the applied research and ecological modeling discussed in Section 6.3 will be essential to better project impacts to this species over the life of the ITP. Take Analysis Methodology (Assumptions, Model Development, Status) Fountain Darter Specific Assumptions Relative to the Covered Activities, take from recreation, shoreline management, etc. can occur at varying levels regardless of springflow level. Take associated with springflow reductions is first evident in the San Marcos River at a daily average flow of approximately 100 cfs total San Marcos springflow. As total San Marcos springflows decline below 100 cfs, additional areas are affected and differing levels of take (both in the river and Spring Lake) start to occur. Similar to the long-term biological goals, the fountain darter take assessment centers on a habitat-based approach within representative reaches of the San Marcos system. The three reaches include the Spring Lake Dam Reach, City Park Reach, and IH-35 Reach. Further descriptions of these reaches are presented in BIO-WEST (2002b-2011b). In addition to the system-wide assumptions stated above, the following fountain darter specific assumptions apply to this approach: Fountain darter movement away from adverse conditions does not occur (i.e., when vegetation decreases, fountain darters automatically die) (movement is not incorporated into the take analysis) Fountain darter recruitment is maintained at all flows (i.e., reduction in recruitment is not incorporated into the take analysis) The former assumption is conservative as darter movement does occur and would be expected when a reduction in aquatic vegetation would occur. However, without a mechanistic ecological model to describe all the complexities that these movements would likely cause (e.g., crowding which could limit reproduction, limit growth rate, increase predation and competition, etc.) this assumption is in place to simplify a current unknown. The latter assumption regarding recruitment is thought to be true, and does not affect the analysis, because the temperature and habitat is supportive of fountain darter reproduction for all flows assumed for the HCP in Phase I and II. (Hardy 2010). However, even if recruitment does continue, recruitment rates will no doubt be affected by changing habitat conditions and the duration of periods of altered springflow. There is not a modeling tool available to assess all the potential effects of the Phase I package on fountain darter recruitment. An additional major assumption embedded in the San Marcos analysis is that the fountain darter population in Spring Lake will not be severely impacted by springflows predicted to occur with the Phase I package. As monthly springflows are predicted to stay above 50 cfs (Figures 10a and 4-10b), which is anticipated to result in daily average flows no lower than 43 cfs, historical and empirical data 4-116
245 along with modeled temperature results support this assumption. However, this assumption does not hold for the No Action Baseline or Existing Baseline scenarios where monthly flows fall below 10 cfs (Figure 4-10b). Major impacts to habitat and population would be expected for the fountain darter in Spring Lake under the No Action Baseline and Existing Baseline scenarios. An evaluation of potential mechanistic or alternative ecological modeling of Spring Lake will also be conducted as part of the AMP to assess the potential impacts of springflows lower than 50 cfs in the event model predictions regarding hydrology are inaccurate. Therefore, the fountain darter take analysis focuses on the San Marcos River below Spring Lake Dam and is based on the following components: Dominant aquatic vegetation changes with flow and time Fountain darter density variability with flow and time Aquatic vegetation quality adjustments relative to flow Fountain darter habitat suitability adjustments relative to flow Aquatic vegetation to fountain darter linkage with flow and time Application of a fountain darter Stella model Physical habitat and water quality modeling (Hardy 2010), along with EAA Variable Flow Study actual observations (BIO-WEST 2002b 2011b), were used to estimate the levels of take relative to the HCP phased approach and HCP conservation measures. This was done by incorporating best available scientific information into the development of a fountain darter habitat model for the San Marcos system. Fountain darter habitat and population model development A fountain darter and aquatic vegetation linkage model within each of the three representative sample reaches described above was developed using Stella 9.1 (Figure 4-27). The model includes actual field collected data for aquatic vegetation and fountain darters over a nine year period via the EAA Variable Flow Study. Both the spring and fall sampling periods over that nine year span were incorporated into the model. The model was set up on a six-month time step so that aquatic vegetation measured during the Spring event of a given year would be the base vegetation used versus flow until the Fall aquatic vegetation mapping that same year, at which time the results of the Fall mapping would become the base vegetation used until the following spring. Each dominant aquatic vegetation type was then evaluated versus flow to establish a habitat quality condition (0 to 1.0 with 1.0 being the best). This exercise was based on Dr. Hardy s habitat model as well as from EAA Variable Flow Study observations over the past decade. For instance, Cabomba in the City Park reach received a 1.0 ranking for the range from 105 to 245 cfs, as a daily average, total San Marcos springflow (Figure 4-28). Therefore, when these flows occur, the full amount of Cabomba measured at a given time step was used in the model. At total San Marcos springflow less than 105 cfs (see Figure 4-28), the suitability ranking was lowered for Cabomba. A reduction in Cabomba 4-117
246 quality is also projected at high total San Marcos springflows above 245 cfs as the scouring effect of elevated flows also has an adverse impact on these plants. The second component entered into the model is the fountain darter density values recorded per dominant vegetation type in the San Marcos system over the same nine year period. Table 4-43 shows the minimum, 25 th, median, 75 th, and maximum densities recorded for fountain darters per dominant aquatic vegetation type in the San Marcos system. TABLE 4-42 FOUNTAIN DARTER DENSITIES PER AQUATIC VEGETATION TYPE IN THE SAN MARCOS SYSTEM OVER TIME (POT/HYG = POTAMOGETON/HYGROPHILA) Cabomba Hydrilla Hygrophila Open Pot/Hyg Potamogeton MIN th MEDIAN th MAX

247 Figure 4-27 Stella Model Interface for Fountain Darter Habitat Model at San Marcos Springs
 based on EAA variable flow data and professional experience from observations in the system.")
248 Figure Habitat quality relationship for Cabomba versus Total San Marcos springflow, as a daily average, in the City Park reach. A habitat quality ranking for fountain darter density was then generated (Table 4-43) based on EAA variable flow data and professional experience from observations in the system. A ranking system was incorporated into the model as follows: TABLE 4-43 HABITAT QUALITY RANKING FOR FOUNTAIN DARTER DENSITIES Description Ranking Value for Model Density Value from Table 4-42 Unsuitable 1 Minimum Density Low quality 2 25 th Moderate quality 3 Median High quality 4 75th The habitat quality ranking for fountain darter density was then incorporated into the model per respective reach relative to the total San Marcos springflow condition (Figure 4-27 lower left box labeled Springflow Dependent Habitat Quality ). For example at a daily average flow of 30 cfs or lower, all reaches were assigned a habitat quality ranking for fountain darter density of
249 Total San Marcos Springflow (cfs) or unsuitable habitat. A low quality (2) habitat ranking was assigned for flows from 30 to 100 cfs for the Spring Lake Dam reach and 30 to 120 cfs for the City Park and IH-35 reaches. Moderate (3) and high quality (4) habitat ranges were different for each reach based on empirical data and observations over the EAA study period and accordingly applied as such. Each representative reach has differing habitat conditions related to flow because of flow conditions and recreational activities that occur within each reach. Fountain Darter Species Status To establish a representative baseline of what the approximate fountain darter population has been within the representative reaches in the San Marcos system from 2002 through 2010, the actual hydrology from that time period was incorporated into the model. Additionally, four constant flows (50, 100, 150, and 200 cfs) were incorporated into the model to examine population variability relative to aquatic vegetation conditions experienced over this nine year period. Figure 4-29 shows the comparison of existing hydrology with each constant flow condition Total Springflow Evaluation Current 50 cfs 100 cfs 150 cfs 225 cfs Time (months) Figure Total San Marcos Springflow scenarios evaluated in Stella. Current is the actual Total San Marcos Springflow from Other springflows were assumed to be held constant. All values shown are daily average flows. Figure 4-30 (along with embedded tables with the figure) show the Stella model results for fountain darter numbers within the representative reaches. For all scenarios, the springflow dependent habitat quality adjustments in the model were used
250 Total Fountain Darters Timestep Current 50 cfs 100 cfs 150 cfs 200 cfs 1 51,845 6,150 11,513 30,181 61, ,608 5,647 10,610 28,165 56, ,249 4,784 8,929 24,207 47, ,601 4,099 7,599 20,577 39, ,772 3,975 7,651 20,773 39, ,991 4,146 7,662 20,122 39, ,571 3,586 6,759 17,114 34, ,890 3,677 6,853 17,651 35, ,523 3,876 7,232 17,795 37, ,317 4,051 7,356 19,209 38, ,232 3,904 7,200 18,993 34, ,672 3,858 7,058 18,119 37, ,486 3,983 7,375 19,486 40, ,803 3,750 6,862 17,756 35, ,442 3,530 6,583 17,196 34, ,026 2,736 4,816 13,011 23, ,795 3,741 6,927 18,929 36, ,503 3,229 5,965 15,524 30,503 65,000 60,000 55,000 50,000 45,000 40,000 35,000 30,000 25,000 20,000 15,000 10,000 5,000 0 Total Fountain Darters in Representative Reaches - San Marcos River month timesteps 50 cfs 100 cfs 150 cfs 200 cfs Current Min 6,442 2,736 4,816 13,011 23,793 Average 19,963 4,040 7,497 19,712 39,053 Max 51,845 6,150 11,513 30,181 61,005 Figure Total Fountain Darters within Representative Reaches San Marcos System: Habitat Quality Adjusted by Reach - Current = flows over 18 timesteps; Constant flows of 50, 100, 150, and 200cfs for all 18 timesteps. All flow values shown are daily average flows
251 Although not exactly an apples-to-apples comparison, as the current scenario has different flows over the 18 6 month time steps versus constant flows over this nine-year period, it is a helpful illustration of the range of variability observed in the system. The variability is reflected in the changes in aquatic vegetation that has been experienced since Over this time period the number of total fountain darters within the representative reaches ranged from approximately 6,400 to 52,000 individuals. (Figure 4-30). As previously noted, it is reemphasized that the population estimate is an approximation based on the assumptions stated above. It is acknowledged that these assumptions add uncertainty regarding the actual number of fountain darters present in the system and as projected by this modeling exercise. However, for this take analysis, this approach provides a level of consistency that allows for a meaningful comparison across different modeled flow scenarios. In Figure 4-30, the 150 cfs (constant) modeled results are fairly similar to the Current Conditions result over time, although with less variability, while the 200 cfs results are higher, and the 100 and 50 cfs results considerably lower as expected. Figure 4-31 shows the 50 cfs scenario to maintain between approximately 2,700 and 6,000 total darters within the representative reaches. These low numbers and the lower numbers resulting from the 100 cfs constant scenario emphasize the importance of the long-term average springflow criteria embedded in the long-term Flow-Related Objectives for the fountain darter in the San Marcos River. Any constant flow, but particularly springflows less than 100 cfs would not be supportive of maintaining fountain darter populations in the San Marcos River over time. Neither the HCP team s nor Dr. Hardy s analyses support maintaining long-term conditions at 50 cfs. In fact, the recommendation for an acceptable minimum flow is a period of no longer than six months at no lower than 45 cfs (daily average), with two-to-three months of pulse flows at 80 cfs (daily average) or greater. Evaluation of Effects of Action and Environmental Baseline Versus Current Condition To assess the Phase I package and No Action Baseline (as discussed above, the No Action serves as a surrogate for the Existing Baseline for San Marcos Springs), the project team used the monthly flow data provided by HDR. To be consistent with the nine-year biological data set, a running nine-year springflow average was calculated from for the HCP. The lowest nine-year average was 86 cfs (July 1948 June 1956), the average 9-year rolling average was 152 cfs (January 1966 December 1974) and the highest nine-year rolling average was 189 cfs (June 1987 May 1995). For the No Action baseline, the same time periods were chosen for an equal comparison. Figures 4-31 and 4-32 show the total San Marcos springflow for each of the respective nine-year periods for both the HCP and No Action Baseline. For the take analysis, these three flow sequences were converted into six-month time steps to be consistent with the aquatic vegetation data and entered into the Stella model. Table 4-44 and Figure 4-33 shows the model results for all three springflow conditions over the 18 6 month time steps. The most notable result is that the No Action Baseline results in less than 100 fountain darters in the representative reaches during a repeat of conditions similar to the drought of record. Although the flow level is not zero as projected for the No Action Baseline at Comal Springs, this low number in the San Marcos River is not considered protective
252 Total San Marcos Springflow (cfs) Total San Marcos Springflow (cfs) HCP Representative Flow Periods Low Moderate High Time (Months) No Action Baseline Representative Flow Periods Low Moderate High Time (Months) Figure 4-31 and Low, Moderate, and High nine-year rolling averages (Total San Marcos springflow) for Phase I package (Top) and No Action baseline (bottom) modeled scenarios
253 Table Total Fountain Darters within Representative Reaches for both the Phase I package and No Action baseline San Marcos System: Habitat Quality Adjusted by Reach Low, Moderate, High represent nine-year model run representative periods generated for each alternative. Time step No Action HCP Baseline Low-Flow Representative Period No Action HCP Baseline Moderate-Flow Representative Period No Action HCP Baseline High-Flow Representative Period 1 11,258 11,258 32,020 32,020 22,723 22, ,961 9,961 28,165 28,165 16,081 16, ,580 10,549 10,549 10,487 47,091 47, ,976 6,976 7,516 7,475 20,577 20, ,436 7,393 20,773 20,773 9,557 14, ,038 6,997 20,122 20,122 9,140 9, ,818 5,742 17,114 17,114 7,837 7, ,720 5,720 17,651 17,651 17,651 17, ,679 6,442 17,795 17,795 19,080 19, ,513 7,474 22,110 19,209 22,110 22, ,240 7,077 13,657 13,657 8,140 8, ,946 6,871 8,032 8,009 10,525 10, ,401 5,873 19,486 19,486 40,256 40, ,752 4,651 17,756 17,756 17,756 17, ,825 2,732 17,196 17,196 7,831 7, , ,793 23,793 10,123 10, , ,929 18,929 18,929 18, ,966 6,031 15,524 15,524 12,640 12,640 Min 3, ,516 7,475 7,831 7,809 Average 6,926 6,222 18,233 18,065 17,669 17,975 Max 11,258 11,258 32,020 32,020 47,091 47,
254 Total Fountain Darters 60,000 55,000 50,000 45,000 40,000 35,000 30,000 25,000 20,000 15,000 10,000 5,000 0 Total Fountain Darters within Representative Reaches - San Marcos River HCP - Low HCP - High No Action Baseline - Low month timesteps HCP - Moderate Current Figure Total Fountain Darters within Representative Reaches for the HCP - Phase I package San Marcos System: Habitat Quality Adjusted by Reach Low, Moderate, and High represent 9-year model run periods generated for the HCP and Low for the No Action baseline; Current = flows over 18 6 month time steps
255 As a rough calculation, the aquatic vegetation mapped within the representative reaches in Fall 2009 (EAA Variable Flow Study) represented between 8 and 18 percent of the total aquatic vegetation mapped in the entire San Marcos System by Hardy (2010) during that same time period. Taking the average of 11 percent as a crude conversion factor for the total system and assuming a one to one relationship of aquatic vegetation and fountain darters, it is possible to use the total fountain darter numbers generated in Table 4-44 and divide those values by 0.11 to get a rough estimate of the total fountain darter population in the San Marcos River (excluding Spring Lake) at that snapshot in time. Using this approach results in a calculation (with all the caveats of this analysis) that the number of total fountain darters in the San Marcos River (again excluding Spring Lake) from 2002 to 2010 ranged from approximately 58,000 to 470,000. Table 4-45 shows the calculations for system-wide darters converted from Table TABLE 4-45 TOTAL FOUNTAIN DARTERS IN THE SAN MARCOS RIVER (EXCLUDING SPRING LAKE) BASED ON A CONVERSION FACTOR OF 0.11 RELATIVE TO MODELED RESULTS FROM THE REPRESENTATIVE REACHES FOR THE PHASE I PACKAGE Range of Total Fountain Darters in the San Marcos River (excluding Scenario Spring Lake) Minimum Average Maximum CURRENT 58, , ,315 HCP Low 29,046 62, ,343 Moderate 68, , ,094 High 71, , ,103 Effects of Action Added to the Environmental Baseline Based on the fountain darter habitat and population model results, it is evident that the No Action Baseline and Existing Baseline will cause incidental take during average to above average springflow conditions, but likely within the range of variability experienced during the Current Conditions. More notably, modeling shows that the No Action Baseline and Existing Baseline might cause extirpation of the fountain darter during a repeat of conditions similar to the drought of record which could jeopardize the continued existence of the species. The word might for the fountain darter at San Marcos Springs versus will for the fountain darter at Comal Springs is used here because of the uncertainty surrounding fountain darter habitat within Spring Lake during those extreme conditions. Because almost all quantitative fountain 4-127
256 darter data has been collected in the river over the years, all modeling activities for the take assessment were based on a fountain darter habitat in only the San Marcos River. The Phase I package will similarly result in incidental take during periods of average to above average springflow conditions (again within the range of variability experienced during the Current Condition), but is not projected to cause or even approach extirpation of the fountain darter at San Marcos Springs. It is evident that a large amount of incidental take (habitat and fountain darters) will be experienced in the river with the Phase I package relative to the Current Conditions under flow conditions similar to the drought of record. During extreme drought of record-like conditions, with all HCP conservation measures, there is the potential for a 50 to 94 percent reduction in fountain darters relative to the Current Conditions in the San Marcos River. Based on Current Conditions observed over the past nine years, this translates into the potential take of approximately 30,000 to 450,000 fountain darters from the San Marcos River, exclusive of Spring Lake, during a repeat of conditions similar to the drought of record, with the potential for approximately 30,000 fountain darters remaining in the San Marcos River. Although under this worst case modeled scenario only 30,000 fountain darters would remain in the river, a significant number of fountain darters are anticipated to survive within Spring Lake under the Phase I package. At this time, it is impossible to predict the actual level of fountain darter take (in terms of habitat quantities or fountain darter numbers) over the 15-year term of the ITP as natural variability of the population of this species is large, but more importantly assumptions regarding: (1) use of existing water rights, (2) future hydrology, and (3) success of HCP conservation measures, etc. are impossible to predict. As such, a near worst case scenario based on the best available science was presented above. Should water rights not be fully utilized in the 15-year term of the ITP; hydrology remain fairly average; and the conservation measures be nominally successful, then the amount of take will be very low. Conversely, should full utilization of water rights start at the effective date of the ITP in 2013; followed by a 10-year drought similar in nature to the drought of record; in conjunction with the HCP conservation measures not having a chance to be fully tested or implemented, then the potential for take of 450,000 or more darters does exist. Additionally, some take would be anticipated to occur in Spring Lake during these extreme conditions, but it is not possible to quantify at this time with available data and existing modeling tools. For this HCP, the Phase I package of minimization and mitigation measures results in a significant improvement from the No Action Baseline and Existing Baseline based on the springflow protection alone. This is highlighted in Figure 4-33 (green line [HCP] versus dashed red line [No Action Baseline]). To further emphasize this point, a detailed documentation of the improvements of the Phase I springflow protection package for the fountain darter at Comal Springs is presented in Section with an example hydrograph. That exercise was not repeated here as it reaches the same conclusion, just on a smaller scale as the No Action Baseline springflows at San Marcos Springs are not nearly as low or extended as at Comal Springs
257 In addition to springflow, on-going research and monitoring continues to confirm the importance of aquatic vegetation. (EARIP 2008 and 2009). Four checkpoint water temperature ranges have also been identified as critical to the fountain darter life cycle. The fountain darter habitat model developed for the take analysis examined the effects of the Phase I package springflow regime specifically on aquatic vegetation in the representative reaches as described above. Those habitat areas were then converted to population numbers to assess the ability of the regime to support a viable population of fountain darters in the San Marcos system. From that analysis, it is evident that during periods of extended low-flow, which is predicted with the Phase 1 package upon conditions similar to those experienced during the drought of record, critical habitat will be impacted and fountain darter populations reduced. However, this analysis shows that during periods of average and higher flows, very minimal impacts to fountain darter critical habitat are projected. Further, as described in Chapter 5, the Applicants will implement significant minimization and mitigation measures that will restore and maintain habitat, remove exotic species, control nonnative animal species, control recreation, and limit access points to the Spring system and river. In addition, specific HCP conservation measures will be implemented to protect aquifer water quality (addressing issues such as impervious cover, low impact development, minimizing the impacts of contaminated runoff, and increased monitoring) which will help mitigate the impacts of cumulative effects including development. Thus, the Phase I measures should appreciably improve the likelihood of the survival and recovery of the fountain darter in the San Marcos system through a repeat of conditions similar to the drought of record during the initial phase of the ITP and contribute significantly towards attaining the long term biological goals. San Marcos Salamander Habitat Requirements and Current Conditions As with the fountain darter, on-going research and monitoring continues to confirm the importance of suitable habitat to the San Marcos salamander. Suitable habitat for the San Marcos salamander is defined as silt-free rocks ranging in size from one to eight inches (2.5 to 20 cm) diameter with surrounding aquatic vegetation and floating mats of algae in the headwaters of the San Marcos River (primarily Spring Lake). (EARIP 2009). The quality and quantity of this habitat in the system are the most important factors determining the density of salamanders in the San Marcos Springs/River ecosystem. Detailed information on habitat requirements and Current Conditions can be found in EARIP (2009), EARIP (2010), and BIO- WEST (2002b-2011b). Take Thresholds Relative to Springflow Any reduction in the quantity and quality of suitable habitat would likely take place first in the downstream-most portion of the San Marcos salamander range: the spillways below Spring Lake Dam. Direct observations suggest that take directly associated with decline in discharge begins approximately when flows decline to a level of 80 cfs, as a daily average, discharge in 4-129
258 the San Marcos River (BIO-WEST 2010b). At this flow, a small proportion of wetted area along the channel is lost. As flow in the San Marcos Springs/River ecosystem declines below 50 cfs, the potential for take increases. Take Analysis Methodology (Assumptions, Model Development, Status) San Marcos Salamander Specific Assumptions Similar to the long-term biological goals (Table 4-25), the take assessment for the San Marcos salamander centers on a habitat-based approach within three main sample areas in the San Marcos system. The three sample areas include the Hotel area and Riverbed area both within Spring Lake, and the area of the eastern spillway below Spring Lake Dam (Figure 4-3). In addition to the system-wide assumptions stated above, the following San Marcos specific assumptions apply to this approach: San Marcos salamander analysis does not include subsurface habitat area. San Marcos salamander recruitment is fully maintained when wetted surface area is available. The former assumption is conservative as salamanders use subsurface habitats. However, without a mechanistic ecological model to describe all the complexities that subsurface movement and habitat usage presents, this assumption is in place to simplify a current unknown. The latter assumption regarding recruitment is thought to be true based on the empirical data at total springflows greater than 80 cfs, but is untested at lower springflow conditions. However, even if it is true that recruitment continues, recruitment rates will likely be adversely affected by changing habitat conditions and the duration of periods of altered springflow. At present time, there is not a modeling tool available to the HCP team to assess all the potential effects of the HCP alternative on San Marcos salamander recruitment. The San Marcos salamander take analysis focuses on the following components: San Marcos salamander density variability with flow and time Habitat quantity adjustments (recreation in Eastern spillway) relative to flow Salamander habitat quality adjustments relative to flow Physical habitat and water quality modeling (Hardy 2010), along with EAA Variable Flow Study actual observations (BIO-WEST 2002b 2011b), and professional judgment were used to quantify the levels of take relative to the Phase I package and HCP conservation measures. This was done by incorporating best available scientific information into the development of a San Marcos salamander model for the San Marcos system. San Marcos Salamander Habitat and Population Model Development 4-130
259 A San Marcos salamander habitat model within each of the three sample areas described above was developed using Stella 9.1. (Figure 4-34). The model includes actual field collected data for San Marcos salamanders from 2002 to Both the spring and fall sampling periods over that nine year span were incorporated into the model. The model was set up on a sixmonth time step to be consistent with the fountain darter models developed for the take analysis. The eastern spillway sample area was further evaluated to develop a wetted area to flow relationship (0 to 1.0 with 1.0 being the best). This exercise was based on Dr. Hardy s habitat model as well as professional experience from EAA Variable Flow Study observations over the past decade. For example, at springflows of 20 cfs or less as a daily average, wetted area of adequate salamander surface habitat within the eastern spillway is predicted to be scarce. Based on the habitat modeling noted above and professional judgment, total San Marcos springflows less than 20 cfs were deemed unsuitable (0, Figure 4-35). Flows above 120 cfs (Figure 4-35) were considered to provide the maximum quantity of wetted area for quality salamander habitat in the eastern spillway. For the two Spring Lake sample areas, because some level of springflow is provided by all scenarios evaluated, no wetted area to flow relationship was developed

260 Figure Stella Model Interface for San Marcos Salamander Habitat Model at San Marcos Springs

261 Figure Wetted area to flow relationship for Eastern Spillway sample area. The second component entered into the model is the San Marcos salamander density values recorded in the San Marcos system over the nine year sample period. Table 4-46 shows the minimum, 25 th, median, 75 th, and maximum densities recorded for San Marcos salamanders. TABLE 4-46 SAN MARCOS SALAMANDER DENSITIES PER SAMPLE AREA IN THE SAN MARCOS SYSTEM OVER TIME ( ) Hotel Riverbed Eastern Spillway MIN th MEDIAN th MAX
262 A habitat quality ranking for San Marcos salamander density was then generated based on EAA Variable Flow Study data and from observations in the system. A ranking system (Table 4-47) was incorporated into the model as follows: TABLE 4-47 HABITAT QUALITY RANKING FOR SAN MARCOS SALAMANDER DENSITIES Description Ranking Value for Model Density Value from Table 4-45 Unsuitable 1 Minimum Density Low quality 2 25 th Moderate quality 3 Median High quality 4 75th The habitat quality ranking per salamander density was then incorporated into the model for each sample area relative to the total San Marcos springflow condition (Figure 4-34 lower left box labeled Relationship of Flow to Habitat Quality ). For example, total San Marcos springflow below 50 cfs, as a daily average, received a habitat quality ranking of 1; cfs and greater than 300 cfs received a 2; cfs and cfs received a 3; and cfs received a 4. The peak range for habitat quality was set between 140 and 190 cfs. Higher total springflow rates are projected to cause declining surface habitat conditions because of the high velocities generated at these discharges below Spring Lake Dam and also the clearing of filamentous algae and bryophytes from the lake bottom sample areas when discharge is considerably greater than average. This does not imply that higher flows are not important, as they clearly are from an ecological standpoint. Again, as with each species evaluated, the take analysis for the San Marcos salamander and assumptions embedded within highlight the need for the applied research and mechanistic ecological modeling outlined in Section 6.3. One additional factor, recreation in the Eastern Spillway, was included in the San Marcos salamander model. With recreation turned on, an adjustment factor to wetted area was applied for this sample area to reflect the adverse impact that recreation might have on habitat quality. Recreational Impacts in this area are typically caused by the physical manipulation of habitat (e.g., moving large rocks around to form dams and swimming areas) and trampling from extensive wading. Including that function in the model also allows for future comparisons of the benefit potentially achieved should recreational impacts be removed from the eastern spillway area immediately below the dam. San Marcos Salamander Species Status To establish a representative baseline of what the approximate San Marcos salamander population has been within the sample reaches in the San Marcos system from 2002 through 2010, the actual hydrology from that time period (Figure 4-36) was incorporated into the model. Additionally, constant flows from 10 to 360 cfs (in 20 cfs increments) were modeled to evaluate the model response to total San Marcos springflow
263 San Marcos salamanders Total San Marcos Springflow (cfs) Total Springflow Evaluation Current ( ) Time (months) Figure Total San Marcos Springflow (daily average) current scenario ( ) evaluated in Stella. Figure 4-37 shows the Stella model results for total San Marcos salamanders within the sample reaches. For all runs, the springflow dependent habitat quality adjustment was used. Additionally, the recreation toggle for the Eastern Spillway was activated. 1,800 1,600 San Marcos salamanders (within sample areas) versus Springflow as predicted by Stella Habitat Model 1,400 1,200 1, Springflow (cfs) Range of predicted Current ( ) San Marcos salamander population in sample areas 4-135
264 Figure San Marcos salamander (within sample areas) predicted by Stella model (blue line). Shaded area is the predicted range of current ( ) population within sample areas. Flows shown are daily average values. The salamander model is similar to the riffle beetle habitat model in that it does not have a habitat (e.g., aquatic vegetation) input that changes over time regardless of flow. As such, each independent flow level will produce one habitat estimate which in turn calculates one population number. Springflows observed during the existing period ranged from approximately 95 cfs to 400 cfs which, when modeled, translated to a population range of approximately 800 to 1,600 salamanders within the three sample areas. It must be emphasized that the population estimate is only for the sample areas and clearly an approximation based on the assumptions stated above. These assumptions add uncertainty regarding the actual number of San Marcos salamanders as projected by this modeling exercise. However, for this take analysis, this approach provides a level of consistency that allows for a meaningful comparison across different modeled flow scenarios. Evaluation of Effects of Action and Environmental Baseline Versus Current Condition To assess the Phase I package and No Action Baseline, the project team used the monthly flow data provided by HDR. Again, Figures 4-10a and 4-10b show that projected springflows resulting from the Existing Baseline are nearly identical to the No Action Baseline, and thus impacts would be very similar for either baseline as presented in this section. Figures 4-31 and 4-32 show the total San Marcos springflow for each of the respective nine-year periods for both the HCP and No Action Baseline. For the take analysis, these three flow sequences were converted into six-month time steps and entered into the Stella San Marcos salamander model. Table 4-48 shows the model results for all three springflow conditions over the 18 6 month time steps. A notable result is the reduction in salamanders for both the HCP Low and No Action Baseline Low scenarios relative to the Moderate and High scenarios. A second notable result is the relative similarity of the moderate and high flow scenarios between the HCP and No Action Baseline scenarios as the projected springflows are nearly identical. Figure 4-38 graphically depicts the differences between No Action Baseline and HCP during the low-flow period along with depicting the HCP moderate and high flow period and Current Conditions ( ). The loss of salamanders during both low flow scenarios is visually evident. However, not evident in Table 4-48 or Figure 4-38 is the individual sample area breakout. The model predicts the habitat and population estimates for each individual sample area. Those results are depicted in Table 4-49 showing the breakdown of San Marcos salamanders per sample area for the Current Conditions and the HCP Low, and No Action Baseline Low scenarios. From this breakout, it is evident that with the recreation function turned on in the model under the No Action Baseline low-flow scenario, salamanders are projected to be temporarily extirpated from the Eastern Spillway sample area. Again, the salamander model simply includes surface habitat within the sample area. As the model does not allow for subsurface movement, this is likely somewhat of a worst-case scenario, but highlights the potential for considerable reductions in salamander surface habitat and resulting populations within the sample areas under both the No Action baseline and HCP low-flow scenarios. Regardless if overly conservative or not, the point is to highlight the 4-136
265 potential for impact and be consistent across analyses to allow the USFWS the ability to make a determination on the potential impacts on survival and recovery of the San Marcos salamander under the HCP. Table Total San Marcos salamanders within Sample Reaches for both the HCP and No Action Baseline San Marcos System: Habitat Quality Adjusted by Sample Reach Low, Moderate, High represent nine-year model run representative periods generated for each alternative. Time step No Action HCP Baseline Low-Flow Representative Period No Action HCP Baseline Moderate-Flow Representative Period No Action HCP Baseline High-Flow Representative Period ,531 1,531 1,207 1, ,207 1, ,205 1,205 1,205 1,204 1,531 1, ,531 1, ,531 1,531 1,207 1, ,531 1,531 1,207 1, ,207 1,207 1,207 1, ,531 1,531 1,207 1, ,531 1,531 1,531 1, ,531 1,531 1,531 1, ,207 1, ,205 1, ,207 1,207 1,207 1, ,531 1,531 1,207 1, ,531 1,531 1,207 1, ,207 1,207 1,207 1, ,531 1,531 1,531 1, , ,531 1,531 1,207 1,207 Min Average ,368 1,367 1,241 1,241 Max 1,207 1,205 1,531 1,531 1,531 1,
266 Total Salamanders Total San Marcos Salamanders within Sample Areas 2,000 1,800 HCP - Low HCP - Moderate HCP - High No Action Baseline - Low Current 1,600 1,400 1,200 1, month timesteps Figure Total San Marcos salamanders for the HCP San Marcos System: Habitat Quality Adjusted by area Low, Moderate, and High represent nine-year model run periods generated for the HCP and Low for the No Action Baseline; Current = flows over 18 6 month time steps
267 Table Total San Marcos salamanders within samples areas predicted for Current, HCP, and No Action Baseline scenarios. Scenario Range of San Marcos salamanders within sample areas Minimum Average Maximum Current (Total) 862 1,203 1,531 Hotel Riverbed Eastern Spillway HCP (Total) : Low-Flow Representative Period ,207 Hotel Riverbed Eastern Spillway No Action Baseline (Total): Low- Flow Representative Period ,207 Hotel Riverbed Eastern Spillway Similar to the Comal Springs riffle beetle, there is not presently a way to translate the San Marcos salamander population estimates per sample area to the total San Marcos system. However, based on observations over the past decade, the Comal Springs riffle beetle sample areas constitute a large portion of the overall system habitat, whereas the San Marcos salamander areas represent only a small portion of the overall habitat available in Spring Lake. A focus of the Phase I bio-monitoring will be to better understand the system-wide, available salamander habitat and further describe the representative nature of the existing sample areas. Effects of Action Added to the Environmental Baseline Based on the San Marcos habitat and population model results, it is evident that the No Action Baseline, Existing Baseline, and HCP will cause incidental take during average to above average springflow conditions, but likely within the range of variability experienced during the Current Condition. More notably, modeling shows that the No Action Baseline, Existing Baseline, and Phase I package might cause extirpation of the San Marcos salamander in the Eastern Spillway during a repeat of conditions similar to the drought of record. At this time, it is impossible to predict the actual level of San Marcos salamander take (in terms of habitat quantities or San Marcos salamander numbers) over the 15-year HCP period as natural variability of the population of this species is large, but more importantly assumptions regarding future flows and the success of HCP conservation measures, etc. are impossible to predict. As such, a near worst case scenario based on the best available science was presented above. Should flows remain fairly average; and the HCP conservation measures be nominally successful, then the amount of take will likely be very low. Conversely, should full utilization of water rights start at the effective date of the ITP in 2013; followed by a 10-year 4-139
268 drought similar in nature to the drought of record; in conjunction with the HCP conservation measures not having a chance to be fully tested or implemented, then the potential for take of a considerable portion of the current population is possible. In the case of the San Marcos salamander, when aggregated with the No Action Baseline, the Phase I package results in only a slight improvement based on springflow protection. Although springflows are improved, current information does not indicate a large improvement in physical habitat conditions for the San Marcos salamander. This is highlighted in Figure 4-38 (green line [HCP] versus purple line [No Action Baseline]). There should be considerable improvements based on water quality protection in the Phase I package but modeling tools to incorporate those parameters into the analysis are not available at this time. Whereas other species at Comal and San Marcos springs showed greater improvements with the HCP when compared to the No Action Baseline, the San Marcos salamander only showed slight improvements because conditions below the Dam were similar with extirpation or near extirpation in that area during extreme conditions. An assumption was made that a minimum number of salamanders would survive in Spring Lake as long as some springflow was provided. Siltation around spring openings will likely be the biggest detriment to the salamander population in Spring Lake at extremely low flows. It has been observed in Landa Lake (Comal system) that as upwelling springs in the Upper Spring Run area cease flowing, siltation ensues and salamanders retreat from those areas. Although observed at Comal Springs, flows have not reached a level over the past decade at San Marcos Springs to cause a similar condition in Spring Lake, and as such this assumption is currently unfounded. Similarly, establishing a cutoff point on habitat suitability within Spring Lake would be equally unfounded at this time. This again highlights the importance of the applied research and mechanistic ecological modeling to be developed for this species as part of the AMP. Based on the habitat modeling conducted, during these extreme conditions, with all HCP conservation measures in place, there is the potential for a 90 percent reduction in salamanders located in the Eastern Spillway sample area, and approximately a 60 percent reduction in population at the Hotel and Riverbed sample areas in Spring Lake. However, even with these potential reductions considering this near worst-case scenario based on the best available scientific data, the remaining habitat provided by Spring Lake and the historical survival of the San Marcos salamander during the historical drought of record supports a determination that the HCP with all measures should be protective of the continued existence of the San Marcos salamander in the San Marcos System through a repeat of conditions similar to the drought of record. Further, recreation below Spring Lake Dam plays a major role regarding impacts on salamander critical habitat, especially during low-flows. As such, recreational impacts are being addressed via HCP conservation measures including a State Scientific Area that includes the Eastern Spillway limiting impacts from recreation at low flows
269 Texas Blind Salamander The Texas blind salamander was first collected in 1895 from the NFHTC in San Marcos, Texas, when they were expelled from an artesian well drilled to supply the hatchery with water. (See Longley 1978). Habitat Requirements and Current Conditions Texas blind salamanders have been well documented from the subterranean waters of the San Marcos area of the Aquifer in Hays County. They have been observed, in caves with access to the water table, traveling along submerged ledges within the Aquifer and swimming small distances before spreading their legs and settling to the bottom. It is likely that they are sensitive to changes in water temperatures, preferring the thermally constant temperatures of the Aquifer, although more research is needed to determine critical thermal minima and maxima for their various life stages (Longley 1978; Berkhouse and Fries 1995). Take Thresholds Relative to Springflow An assumption throughout the HCP (and supported by EARIP 2008; EARIP 2009) is that as subterranean species, mechanisms exist for these species to retreat into the Edwards Aquifer should springflows cease at the spring outlets at San Marcos Springs. With that assumption, a conservative measure for take for the Texas blind salamander, which includes potential indirect habitat loss associated with springflow reductions, is that take begins when flows are reduced to 50 cfs, as a daily average, total discharge in the San Marcos River. As total flow for the San Marcos Springs/River ecosystem declines below 30 cfs, the potential risk increases. Take Analysis Methodology (Assumptions, Model Development, Status) The sparse amount of data for this species did not support the development of a Stella habitat or population model at this time. The limited existing data and inability to model this species led to a qualitative assessment of take with the focus on providing continuous springflow and protection of water quality. There is uncertainty regarding this qualitative analysis, which again highlights the necessity of applied research, expanded biological and water quality monitoring, and ecological modeling. Evaluation of Effects of Action and Environmental Baseline Versus Current Condition As a quantitative modeling approach was not employed, no attempt was made to quantitatively describe a known Current Condition against which to make comparisons. As for the Comal subterranean species, the details of the Aquifer food chain at San Marcos Springs are not well understood and additional concerns beyond the preservation of habitat related to springflow include the maintenance of a natural flow of carbon through the system. This carbon flow may be disrupted with combined drought and high levels of pumping. Effects of Action Added to the Environmental Baseline An informal qualitative take assessment was attempted but the sparse amount of data for this species limited that evaluation. The springflows projected for the No Action Baseline and Existing Baseline could result in the drying of surface habitat near spring orifices during extreme drought that might adversely impact the salamander. However, this is not the case for the HCP 4-141
270 springflow protection as springflow is not projected to fall below 50 cfs on a monthly time step. As a subterranean species, the larger threat is likely contamination of aquifer water quality. As set out in Chapter 5, specific HCP conservation measures will be implemented to protect aquifer water quality and to expand the existing water quality monitoring network at San Marcos Springs. As discussed for the other San Marcos species, when added to the No Action Baseline or Existing Baseline, the HCP results in an improvement for the Texas blind salamander based primarily on added springflow protection during the extreme drought conditions. Following the same rationale as described above for the listed Comal subterranean species, it is expected that the HCP conservation measures relative to protection of continuous springflow and aquifer water quality are sufficient to ensure that the San Marcos salamander will survive a repeat of the drought of record with an adequate potential for recovery. Texas Wild-Rice Texas wild-rice was first collected in the San Marcos River in 1892 and currently occurs in the upper 2.4 kilometers of the San Marcos River, above the confluence with the Blanco River (EARIP 2009). Habitat Requirements and Current Conditions A wealth of monitoring data exists for Texas wild-rice as TPWD has been monitoring this species annually since the early 1980 s and the EAA Variable Flow study has collected data annually for the past 10 years with several additional monitoring periods following high flow and low flow events. Detailed information on habitat requirements and Current Conditions can be found in EARIP (2009), EARIP (2010), and BIO-WEST (2002b-2011b). Adverse Impact Thresholds Relative to Springflow As previously discussed, adverse impacts are an ongoing reality in the San Marcos River relative to recreation, in many cases regardless of springflow level. However, lower springflows have been documented to facilitate greater amounts of adverse impact by supporting wading access to more areas of the river. Over the past decade of EAA variable flow monitoring, as springflows decline below 120 cfs, as a daily average, adverse impact relative to springflow through loss of water depth or wetted area starts to occur. Low flows experienced in 2006 and 2009 provided additional insight on Texas wild-rice responses during drought and subsequent recovery. (EARIP 2009). Total discharge in the San Marcos dropped below 100 cfs during the summer of 2006 and for an extended period during Monitoring data collected during those periods clearly illustrates that as flows approach 100 cfs, as a daily average, total discharge, impacts to Texas wild-rice become more pronounced (EARIP 2009). The durational component experienced in 2009 must also be considered in an evaluation of adverse impact. In 2006, the lower flow conditions were only experienced for approximately three months, whereas in 2009 the low flow conditions were experienced for greater than one year, which resulted in a greater impact to the overall population of Texas wild-rice (EARIP 2009). Saunders et al. (2001) shows that approximately 10 percent and 20 percent of weighted usable area would be lost when springflow drops from 140 cfs, as a daily average, to 80 cfs and 50 cfs, respectively. Using only high quality habitat (> 0.75 suitability) as an indicator, Hardy (2010) 4-142
271 shows that over 90 percent of the maximum available area is sustained at a daily average flows of 80 cfs, over 75 percent of the maximum available area is maintained at 50 cfs; and over 55 percent of the maximum available area is preserved at 30 cfs total San Marcos discharge. Impact Analysis Methodology (Assumptions, Model Development, Status) Two main factors led the HCP team not to quantify potential reductions in areal coverage of Texas wild-rice from Phase I package covered activities. The first is that an aggressive Texas wild-rice restoration and enhancement program is included within the HCP conservation measures. Second is that TPWD intends to create State Scientific Areas to help protect at least 1000 m 2 of wild-rice from recreational impacts. These areas will provide for the exclusion of recreational activities for prime Texas wild-rice habitat during flows of 100 cfs or less. Evaluation of Effects of Action and Environmental Baseline versus Current Conditions As flows have not been observed at levels nearer to historical minimums, several modeling efforts have been conducted to evaluate the potential for impacts to Texas wild-rice at lower flow conditions (Saunders et al. 2001, Hardy 2009, Hardy 2010). A combination of existing data (TPWD unpublished and BIO-WEST 2002b-2011b), physical habitat modeling (Saunders et al. 2001; Hardy 2010), and professional judgment were used to assess the survival and recovery of Texas wild-rice at San Marcos Springs relative to the Phase I package. Additionally, although springflow is unquestionably important to Texas wild-rice, management of certain other potential impacts to Texas wild-rice can also prove beneficial to the species. For instance, the build-up of aquatic vegetation mats on Texas wild-rice and other vegetation creates sub-optimal conditions. Similarly, recreational activity in the immediate vicinity of plants that are in vulnerable (shallow) areas can have negative impacts. Both of these impacts can be reduced by specific management activities. Therefore, mitigation measures will be implemented for both recreation control and vegetative mat removal during low flow periods. Hardy (2010) also described the potential addition of Texas wild-rice habitat that might be achieved with the removal of non-native aquatic vegetation (Hydrilla verticillata and Hygrophila polysperma) within predicted optimum areas of occupied Texas wild-rice habitat and within a 2 m buffer around occupied optimal Texas wild-rice areas. Hardy (2010) shows that the removal of H. verticillata and H. polysperma within Texas wild-rice patches and including a 2 meter buffer around those patches would provide over 1,000 m 2 of additional optimum Texas wild-rice habitat area over the entire flow range (45 to 80 cfs) simulated. Hardy (2010) concludes that the simulated optimal habitat for Texas wild-rice over a range of discharges between 45 and 80 cfs, as a daily average, strongly suggests that proactive planting and conservative non-native vegetation removal has a high potential for increasing existing Texas wild-rice occupied area that would remain hydraulically suitable at these modeled flow levels. As such, Chapter 5 describes Texas wild-rice enhancement measures designed at accomplishing this objective. Effects of Action Added to the Environmental Baseline As discussed for the other San Marcos covered species, when added to the No Action Baseline or Existing Baseline, the HCP results in an improvement for Texas wild-rice based on springflow protection alone. The hydraulic and habitat modeling conducted by Dr. Hardy and subsequent analysis by the EARIP and HCP team shows that Texas wild-rice will be impacted by the HCP 4-143
272 flow regime, but that flows of 50 cfs or more monthly average will be maintained during a repeat of the drought of record-like conditions. Texas Troglobitic Water Slater Habitat Requirements and Current Conditions The Texas troglobitic water slater is known from two localities in Hays County, San Marcos Springs (Diversion Springs) and the Artesian Well that is located very close to San Marcos Springs. The species is not currently listed as threatened or endangered, but has some likelihood of being listed in the future due to a positive 90-day finding to a petition (USFWS 2009a and 2009b). The state of knowledge of this species is similar to that for the Edwards Aquifer diving beetle. There has not been any species-specific monitoring during the EAA Variable Flow Study. Take Thresholds Relative to Springflow The subterranean nature of this species suggests that it does not require substantial surface discharge from springs to survive and presumes that springflow (of sufficient water quality) that continually covers the spring orifice should prevent harm to the population related to habitat loss from dewatering. Given that assumption, at San Marcos Springs, a conservative measure for establishing when take occurs for this species is 50 cfs, as a daily average, total discharge from the San Marcos Spring system. As the flows decline below 30 cfs, the potential for risk increases. Take Analysis Methodology (Assumptions, Model Development, Status) The sparse amount of data for this species did not support the development of a Stella habitat or population model at this time. The limited existing data and inability to model this species led to a qualitative assessment of take with the focus on providing continuous springflow and protection of water quality. Evaluation of Effects of Action and Environmental Baseline versus Current Condition As there is insufficient data regarding the Texas troglobitic water slater to inform the analyses, no attempt was made to quantitatively describe known Current Conditions to compare against. As with the Comal Springs subterranean species, the details of the Aquifer food chain at San Marcos Springs are not well understood and additional concerns beyond the preservation of habitat related to springflow include the maintenance of a natural flow of carbon through the system. This carbon flow may be disrupted with combined drought and high levels of pumping. Effects of Action Added to the Environmental Baseline An informal qualitative take assessment was attempted but the sparse amount of data for this species limited that evaluation. As with the Texas blind salamander, take of this species is anticipated to occur with the drying of surface habitat near spring orifices during periods of extreme drought. Similar to the Texas blind salamander, the larger threat is likely contamination of aquifer water quality. As such, specific HCP conservation measures will be implemented to protect aquifer water quality and to expand the existing water quality monitoring network at San Marcos Springs
273 As discussed for the Texas blind salamander, when aggregated with the No Action Baseline or Existing Baseline, the HCP results in an immediate improvement for the Texas troglobitic water slater based on springflow protection alone. Following the same rationale as described above for the Texas blind salamander, it is expected that the HCP conservation measures relative to protection of continuous springflow and aquifer water quality are sufficient to avoid reducing appreciably the likelihood of survival and recovery of this species during the ITP Downstream and Other Spring Systems Two Edwards Aquifer springs other than Comal and San Marcos Springs in the area provide aquatic habitats for Covered Species. Hueco Springs, located approximately 4 kilometers north of Comal Springs near the Guadalupe River in Comal County, is a group of smaller springs known as habitat for the Peck s Cave amphipod, also found in Comal Springs. Fern Bank Springs is located in Hays County along the bank of the Blanco River, approximately 13 miles north-northwest of San Marcos Springs, and serves as habitat for the Comal Springs dryopid beetle, which also is found in Comal Springs (Figure 4-39). The Peck s cave amphipod at Hueco Springs will likely benefit from the minimization and mitigation measures in the HCP because of the hydrogeologic setting of the springs is similar to that of Comal Springs. The springs have been identified within part of the central Comal flowpath by Otero (2007), which also feeds Comal Springs. This flowpath is characterized to lie within a set of fault blocks bounded on the northwest by the Hueco Springs fault and to the southeast by the Comal Springs fault. The hydrographs of Hueco and Comal Springs are compared in Figures 4-40 and The general flow trends display similar patterns to Comal Springs as comparison of hydrographs from the two springs shows. The flow at Hueco Springs is on average an order of magnitude lower than Comal Springs (Figure 3-21). Hueco Springs tends to drop more rapidly from higher flow rates (> 50 cfs) as dry conditions persist, as in the 2006 and 2008 droughts. As Comal Springs approaches lower discharge values of 200 cfs and below, the flow at Hueco Springs nears zero. Hueco Springs have been documented to cease flowing several times in the past 90 years, and the amphipod has re-emerged from the Aquifer following these periods of drought. Accordingly, the measures implemented to maintain sufficient springflow and water quality at Comal Springs should maintain adequate habitat associated with Hueco Springs. Fern Bank Springs, Critical Habitat for the Comal Springs riffle beetle, Comal Springs dryopid beetle, and Peck s cave amphipod (72 FR 39,247 (July 17, 2007), flows from a significantly different hydrogeologic setting than that of Comal and San Marcos Springs. The elevation of Fern Bank Springs is significantly higher than the other two springs, and it drains a relatively thin portion of the lower members of the Kainer Formation under unconfined conditions. Recent dye traces to Fern Bank Springs confirm that groundwater recharged south of the Blanco River in the Kainer Formation feeds the spring (EAA 2010a). The significant topographic high south of the springs likely produces a local groundwater divide from water feeding San Marcos Springs to the southeast. Although Covered Activities of the HCP will not negatively impact quantity and quality of water flowing from Fern Bank Springs, it is unlikely that conservation measures 4-145
274 included in the HCP to protect conditions at Comal and San Marcos Springs will guarantee water will continue to flow at Fern Bank Springs. Localized pumping increases near Fern Bank Springs, which would not be protected as Covered Activities, that would have little effect on Comal or San Marcos Springs could potentially intercept and stop water from emerging from the spring. Since water flows through a stream passage cave in vadose/water table conditions, and this is the habitat for the Comal Springs dryopid beetle at Fern Bank Springs, such localized pumping could produce detrimental conditions to the beetle population here
275 Figure Location and geology surrounding springs 4-147
276 Figure Hydrographs of Comal and Hueco Springs, 2002 to
277 Figure Crossplot of Comal and Hueco springflows 4-149
278 Page Left Intentionally Blank 4-150
279 Chapter 5 Minimization and Mitigation Measures; Measures Specifically Intended to Contribute to Recovery The ESA requires the HCP to specify what steps the applicants will take to minimize and mitigate the impacts which will likely result from the anticipated incidental take associated with the Covered Activities. (16 U.S.C. 1539(a)(2)(A)). In order to issue an incidental take permit, USFWS must find that the applicants will, to the maximum extent practicable, minimize and mitigate the impacts of such taking. (Id. at 1539(a)(2)(A)(B)(ii)). This chapter describes the measures that the Applicants commit to carry out to minimize and mitigate the incidental take resulting from the Covered Activities to the maximum extent practicable. Additionally, some measures identified in the Sections below go beyond the minimize and mitigate standard and actually contribute to the recovery of the Covered Species. This chapter identifies the impact of the anticipated incidental take to be addressed by each measure and how that measure positively addresses that impact. The overall management of the implementation of these measures is set out in Chapter Approach to the Implementation of the Minimization and Mitigation Measures The HCP will be implemented in two phases. In the first phase of the HCP, habitat minimization and mitigation measures and measures to maintain continuous minimum springflow during a repeat of the drought of record (see Table 5-1) will be put into place promptly on issuance of the ITP. This Phase I package will be implemented throughout the permit term unless modified by the AMP. Other components of Phase I will include implementation of measures designed to contribute to recovery of the species, and a robust AMP. Information developed in the AMP during Phase I will inform decisions regarding whether it is necessary to implement any flow protection measures during Phase II of the HCP beyond those implemented in Phase I. 5-1
280 TABLE 5-1 SUMMARY OF MINIMIZATION AND MITIGATION MEASURES INCLUDED IN THE PHASE I PACKAGE Emergency Stage V Critical Period Management Reductions Flow Protection Measures SAWS ASR Trade Off Regional Water Conservation Program Voluntary Irrigation Suspension Program Option Measures to Reduce the Impacts of Drought and Enhance the Viability of the Listed Species at San Marcos Springs Habitat Protection Measures Measures to Reduce the Impacts of Drought and Enhance the Viability of the Listed Species at Comal Springs Environmental Restoration and Protection Area at Comal Springs Gill Parasite Control Wild Rice Restoration and Maintenance at San Marcos Springs Riparian Habitat Restoration Other Measures Household Hazardous Waste Programs Water Quality Protection and Monitoring NFHTC Refugia ASR = Aquifer Storage and Recovery SAWS = San Antonio Water System NFHTC = National Fish Hatchery and Technology Center LID = Low Impact Development In Phase II, the Applicants will implement the specified additional measures (see Section 5.5.2) if needed to ensure the springflows necessary to foster achievement of the biological goals and objectives as well as implementing any further adjustments to improve the effectiveness of the measures implemented in Phase I. The decision as to the Phase II actions and any ongoing necessary adjustments will be made through the AMP as set out in Chapter 6 and, more specifically, in Article 7 of the FMA. Until the AMP decision-making process is complete, it is not known whether additional flow protection measures are required. To address the ability and commitment to achieve the existing flow 5-2
281 objectives, while recognizing the uncertainty associated with those objectives, Applicants commit to implement a presumptive measure that is adequate to achieve the flow-related objectives for attaining the biological goals. If needed, the use of the expanded capacity of the SAWS ASR will be the presumptive additional measure to meet the biological objectives with critical period reductions in Stage V beyond those in Phase I, if necessary. (See Section 5.5.2). Applicants will include in the Annual Report a description of the status of implementation of the minimization and mitigation measures and an evaluation of the effectiveness of those measures. 5.1 Edwards Aquifer Authority San Marcos National Fish Hatchery and Technology Center, Uvalde National Fish Hatchery, and Inks Dam National Fish Hatchery Refugia The EAA will support and coordinate with the USFWS on the work relating to the San Marcos NFHTC s operation and maintenance of a series of off-site refugia at USFWS s San Marcos, Uvalde, and Inks Dam facilities. (See Section 6.4). The limited geographic distribution of these species leaves the populations vulnerable to extirpation throughout all or a significant part of their range. A series of refugia, with back-up populations at other facilities, will preserve the capacity for these species to be re-established in the event of the loss of population due to a catastrophic event such as the unexpected loss of springflow or a chemical spill. The support of the refugia will augment the existing financial and physical resources of these facilities, and provide supplementary resources for appropriate research activities, as necessary, to house and protect adequate populations of Covered Species and expanded knowledge of their biology, life histories, and effective reintroduction techniques. The use of this support will be limited to the Covered Species in this HCP Voluntary Irrigation Suspension Program Option The EAA will administer the Voluntary Irrigation Suspension Program Option (VISPO) program. As discussed below in Section 5.8, VISPO is intended to minimize and mitigate the impacts of incidental take from low springflows by suspending the use of Aquifer water for irrigation purposes during drought. The use of Aquifer water for irrigation accounts for over 30 percent of the annual pumping. This use typically occurs between January and July. The concentrated use of the Aquifer can contribute to substantial drawdown in Aquifer levels. This measure will require EAA irrigation permit-holders who voluntarily participate in the program to suspend the use of Aquifer water for irrigation purposes during drought to maintain springflow Target Volume, Distribution & Eligible Permits The volume goal for the VISPO program is 40,000 ac-ft/yr. Irrigation permit-holders in Atascosa, Bexar, Comal, and Hays counties will be approached for enrollment in the program first because these counties are closest to the springs where temporarily suspending pumping is 5-3
282 likely to be most effective. It is hoped that at least 10,000 ac-ft can be enrolled in these counties. Assuming that this goal can be obtained, the goal is to enroll 15,000 ac-ft/yr each in Medina and Uvalde counties. The EAA anticipates that base irrigation groundwater permits will be the primary permits enrolled; however, all permitted irrigation water rights (base and unrestricted) will be accepted in the program. If an irrigation permit-holder desires to enroll less than its full permitted volume, their withdrawals will be monitored by real time automated meters installed by the EAA Program Trigger The suspension of pumping by the participants in the program will be triggered if the J-17 index well in Bexar County is at or below 635 ft-msl on the annual trigger date of October 1. This date provides irrigators, and businesses affected by the decisions made by irrigators, ample time to make crop planting and other business decisions. Announcing implementation of the program on that date will result in a complete suspension of withdrawals of the enrolled water for each program participant for the following calendar year beginning on January Program Term Irrigators will be offered the option of committing to the program for either five- or ten-year programs. The payment structure is designed to encourage the longer commitment. Five-year program: A standby fee of $50/acre-foot that increases 1.5 percent per year will be paid to the enrollee every year of the term, regardless of Aquifer conditions; and A fee of $150/acre-foot that increases 1.5 percent per year will be paid for each year when temporary pumping suspensions are required. Ten-year program: A standby fee of $57.50/acre-foot for years 1-5 and $70.20/acre-foot for years 6-10 will be paid to the enrollee every year of the term, regardless of Aquifer conditions; and A fee of $172.50/acre-foot for years 1-5 and $ for years 6-10 will be paid for each year when temporary pumping suspensions are required Full Subscription to VISPO Program Is Reasonably Certain to Occur The VISPO Work Group sent letters to all EAA irrigators in November 2010 explaining the VISPO and inviting them to informational meetings to learn more. Two informational meetings 5-4
283 were held, one in Uvalde, Texas, on December 6, 2010, and one in Castroville, Texas, on December 7, Approximately 150 persons attended the meetings (approximately 35 in Uvalde and approximately 115 in Castroville). Following the meetings, all irrigators were contacted again in January 2011 with a letter of inquiry, a list of Frequently Asked Questions and a schedule of payments for the five- and tenyear program options. (Attachment O) Irrigators were asked to indicate whether they were interested in participating in the VISPO program and, if so, whether they were likely to opt for the 5- or 10-year program. The EARIP received positive written expressions of interest from irrigators in enrolling 17,226 ac-ft of water as indicated in Table 5-2. This level of response is higher than what has been received for similar surveys, particularly when the responses were solicited so far in advance of a commitment to go forward with the VISPO. Additionally, other irrigators contacted the EAA after the requested response deadline to express interest in the program. The positive responses indicate a reasonable likelihood of enrolling the full volume of permits once funding is available and contracted enrollment begins. TABLE 5-2 ACRE-FEET OF INTEREST IN VISPO BY COUNTY Atascosa County Comal County Bexar County Acre-feet of interest Medina County Uvalde County Total 5-Yr. Base , ,258 8,819 5-Yr. Unrestricted ,664 3, Yr. Base , , Yr. Unrestricted TOTAL ,332 5,197 8,815 17,226 0 Based on the responses and public input and the financial incentives offered to enrollees, the Applicants believe that: (1) the 40,000 ac-ft will be fully subscribed; and (2) the irrigators who initially opt for the five-year option will continue their participation in the program and that the full 40,000 feet will be subscribed over the requested 15-year term of the ITP. To the extent that the program is not fully subscribed, the Adaptive Management Process will be used to identify alternative measures, perhaps additional pumping cuts, achieve the full springflow protection anticipated from the VISPO program and those measures will be implemented Regional Water Conservation Program Some communities and industries in the Edwards Aquifer region have demonstrated a commitment to water conservation. However, water conservation programs have not been implemented across the region or developed to target exempt domestic wells. The Regional Water Conservation Program will minimize and mitigate the impacts of pumping from the 5-5
284 Aquifer by building on the expertise of the successful programs to realize savings throughout the Edwards Aquifer region. The goal of the Regional Water Conservation Program is to conserve 20,000 ac-ft/yr of permitted or exempt Edwards Aquifer withdrawals. In exchange for technical assistance and incentives for implementing the various measures, one-half of the conserved water (10,000 acft) will be committed to remain in the Aquifer unpumped, but still owned by participating permitholders, for 15 years to benefit springflow levels and contribute to species protection. The other one-half of the conserved water will remain available to the participating entity. To ensure that the benefit from this program is reasonably certain to be realized, SAWS and certain municipal purveyors will initially commit not to use an amount equal to 10,000 ac-ft/yr of permitted Edwards Aquifer water for municipal use immediately upon implementation of this measure, which will not be utilized, but will still be owned and controlled by the purveyor Administration The EAA will administer the Regional Water Conservation Program targeting municipal water users and owners of exempt domestic wells. In this role, the EAA will seek out local program implementation entities, such as water purveyors and other governing or civic groups, to deliver the anticipated services (see Section ) to Edwards Aquifer municipal permit-holders and domestic well-owners. The EAA, county governments, or a contractor may take responsibility for program delivery in areas where a water purveyor does not have a presence or otherwise chooses not to operate the program itself. The EAA will keep a record of committed water amounts and monitor water use by the implementing entity to ensure compliance. The EAA will develop a set of forms and procedures for use by the local implementing entity. Technical assistance will also be provided or coordinated by the EAA. The EAA will recruit water purveyors and other entities to implement the Regional Water Conservation Program in their jurisdiction. Contracts will be negotiated and completed between the EAA as the coordinating entity and the local implementing agencies or groups. The EAA will organize a Regional Conservation Monitoring Committee to be initially comprised of one representative knowledgeable in water conservation from SAWS, the City of San Marcos, the City of New Braunfels, the Bexar Metropolitan Water District, or its successor if that successor entity is not already represented on the Committee, and a small water purveyor which utilizes the Edwards Aquifer. The Regional Conservation Monitoring Committee will provide technical input and expertise, and seek any additional funding from other funding sources such as foundations, state agencies and private sector firms as opportunities arise. The Regional Conservation Monitoring Committee will also: Rank proposed activities in order of efficiency based on water saved/cost; Comment on the potential of each activity to achieve its goal for the term of the HCP; 5-6
285 Make specific recommendations on adjustments that should be made to each proposed activity with the expected result; and Prepare periodic statements to demonstrate that the program goals 20,000 ac-ft saved and 10,000 ac-ft committed to the Aquifer for 15 years will be achieved by the 10th year of operation Services, Techniques, Measures, and Technical Assistance The Regional Water Conservation Program will focus on implementation of incentive programs encouraging: (1) reduction of lost water through leak detection; (2) installation of highefficiency plumbing fixtures and high-efficiency toilets; (3) large-scale commercial/industrial retrofit rebate; and (4) water reclamation for efficient water use Lost Water & Leak Detection Many municipal water purveyors in the Edwards Aquifer region provide water services to expansive suburban or rural service areas, resulting in extensive lengths of pipe and other transmission and distribution infrastructure systems in areas that are not frequently visited, leaving many water leaks undetected. Even if detected, many smaller purveyors lack the financial means or technical expertise to address the issue in a pro-active manner. The lost water technical assistance program is meant to help identify the sources of water lost from the distribution systems of these purveyors and marshal resources to assist in repair. Where a water purveyor has estimated a total volume or percentage of water produced that is lost in transmission and identified where the loss is most likely occurring, the purveyor may submit an application to the EAA with a plan to reduce the lost water and a request for technical assistance. If the purveyor agrees to commit half of the saved water to remain unutilized for 15 years, then a one-time assistance of $500 for each ac-ft saved will be provided. The EAA will also seek to identify funding sources available to small water purveyors to help enhance or supplant any financial assistance provided by the EAA under this measure, or to organize other funding. Where purveyors have the capability to identify or estimate water lost in the distribution system, the EAA will enter into contracts with SAWS, the City of San Marcos, the City of New Braunfels, or other interested parties or contractors to provide assistance with a distribution system leak detection and lost water survey for the participating purveyor. The EAA, recipient purveyor, and appropriate expert staff from the surveying entity, as appropriate, will use the gathered data to prepare a lost water analysis and improvement plan for the targeted purveyors. These purveyors would then request assistance from the EAA with this plan to reduce water lost during transmission. 5-7
286 High-Efficiency Plumbing Fixtures & Toilet Distribution Program Many new homes and businesses have been built in the Edwards Aquifer region since 1992, when enhanced requirements for high-efficiency toilet and other fixtures became effective. However, many structures remain from prior to 1992 that still utilize older, high-flow toilets and plumbing fixtures. These relatively simple replacements rapidly conserve water each old toilet replaced conserves 12,500 gallons per year, while a typical household that replaces plumbing fixtures saves 10,500 gallons per year. Even more water is saved when old toilets and fixtures in commercial and institutional settings are replaced. Some water purveyors may decide to lead the initiative to recruit its customers in the replacement of older high-flow toilets with a new Caroma, two-volume, high-efficiency toilet (or another high-efficiency toilet). During this effort, high-efficiency faucets and shower-heads may also be provided. The purveyor then organizes the distribution of the toilets to customers who are interested in participating. The old toilet is collected to verify that the new toilet is installed. Partnerships with area plumbers, non-profits, and civic groups have proven to be effective means of ensuring the new fixtures and high-efficiency toilets are distributed and installed. In other instances, the EAA or subcontractor, such as a county government, will make the toilets and high efficiency plumbing fixtures available to Edwards pumpers with exempt wells. The toilets will be distributed in the same manner as water-purveyor-led initiatives, or a central depot can be established that is staffed at specified times. The EAA or the subcontractor will obtain the commitment in the form of a contract with the recipient to replace a high flow toilet using Aquifer water. It would also require a commitment to proper maintenance in the contract. Plumbers and/or non-profits may be utilized for this task as well Commercial/Industrial Retrofit Rebate Commercial and industrial processes are often large users of water. Many processes which use water as an input or as part of the production practice in the past have alternative water-saving means available today. The type of business or industrial activity that may be updated with water-saving equipment or process varies widely, and each interested participant will require unique consideration of the individual circumstance, goal, and capacity. The EAA will provide a full or part-time staff person to make the contacts and complete the planning and process implementation. Invoices from the participating commercial or industrial concern are to be sent to the EAA. For example, a comparable SAWS program pays for 50 percent of the cost of the technological change or $400 per ac-ft of water saved over 10 years, whichever is less. The Regional Water Conservation Program will be modeled on this SAWS program. SAWS staff will provide training and perhaps ongoing technical assistance for the EAA staff as needed. One of every two ac-ft saved will have to be left unutilized by the sponsoring entity for the duration of the ITP. 5-8
287 Water Reclamation for Efficient Water Use This portion of the Regional Water Conservation Program will be operated by the EAA and target exempt well owners. Staff person(s) involved will be technically proficient in a number of related technologies including condensate collection, gray water use, rainwater collection, xeriscaping, self-contained water systems, and drip irrigation. Her/his goal would be to identify rural residents that were willing to implement these technologies with a small subsidy from the sponsoring entity. The subsidy of $300 or $400 per ac-ft saved is the same as that for the other conservation programs but is unlikely to cover a significant portion of the total cost of the technology. Nevertheless, people regularly approach various water conservation information events throughout the region inquiring about these practices. A participant will have to commit to leaving 50 percent of the water savings in the Aquifer for 15 years. In an urban setting, opportunities for this activity are mostly confined to new construction or large scale rehabilitations or conversions. In such a setting, the EAA will require a commitment by the appropriate water purveyor to leave one-half of the savings unutilized for the permit term Initial Commitment Municipal water purveyors which utilize the Aquifer and have had success at implementing water conservation measures will initially commit an amount approximating 10,000 ac-ft/yr of permitted Aquifer water for municipal use immediately upon implementation of this measure, which will not be utilized, but will still be owned and controlled by the purveyor, as follows: San Antonio Water System: 8,000 ac-ft/yr TBD: 2,000 ac-ft/yr As participating water purveyors and exempt well-owners achieve new water savings, the volume of conserved water committed by the new participants will be off-set against the initial commitment, allowing the initial commitment to revert to the control of the original permit-holder proportionally until the Regional Water Conservation Program achieves 20,000 ac-ft of savings, 10,000 ac-ft of which would remain unutilized by the new participating entities during the term of the HCP Critical Period Management Stage V Stage V Emergency Withdrawal Reductions By December 31, 2012, EAA will amend its Critical Period Management Program to add a new emergency Stage V reduction of 44 percent applicable in both the San Antonio and Uvalde pools. Stage V is designed to be triggered only when other measures have not proven sufficiently effective in maintaining springflow during drought conditions. For the San Antonio Pool, Stage V would be triggered by a combination of monthly average J-17 levels below 625 feet or springflows of either 45 cfs based on a ten-day rolling average at Comal Springs or
288 cfs based on a three-day rolling average. The Uvalde Pool would trigger Stage V using the Uvalde County Index Well (J-27) water level of 840 ft-msl Stage V Emergency Water Supply It is anticipated that during Stage V, all outdoor use of groundwater withdrawn from the Aquifer will be prohibited, except for limited circumstances, such as foundation watering, watering from a hand held hose, and emergency uses such as firefighting. It is possible that some of the smaller municipal water providers who are entirely dependent on the Aquifer may not have sufficient water supplies to meet public health and safety needs with Stage V critical period reductions. In such cases, municipal water providers will not be denied the use of groundwater from the Aquifer to meet public health and safety needs, but they will incur substantial fines and penalties as determined by the EAA pursuant to its enforcement rules and policies if they do not achieve the reductions. With such fines or penalties for overuse, it is anticipated that it would be more cost effective for small municipal providers who are entirely dependent to ensure that they have sufficient supplies available through lease arrangements than to pay the penalties for overuse during Stage V reductions. To facilitate the leasing of water under these types of emergency situations, the Applicants may, with the support of the EARIP, seek a legislative amendment of 1.34 of the EAA Act to allow irrigation permit holders to lease Base Irrigation Groundwater to municipal and irrigation users within the same county as the place of use for the irrigation permit during severe drought conditions. 5.2 City of New Braunfels Flow-Split Management in the Old and New Channel Presently, the culverts governing flow from Landa Lake into the Old Channel are inoperable. As a result, a constant level of springflow proceeds through the culverts and into the Old Channel. Over time, this has led to the scouring of preferred native vegetation types for fountain darters, and the establishment and eventual dominance by non-native non-preferred aquatic vegetation. Flow-split management is intended to complement the ecological restoration of aquatic vegetation in the Old Channel, by reducing long-duration high flows and allowing for more seasonal variability to be maintained, mimicking a more natural flow pattern. To minimize and mitigate the impacts of low flows, the City of New Braunfels staff will manipulate at least once monthly the valves and culverts to the Old Channel and New Channel of the Comal River for the protection of existing and restored native aquatic vegetation in the river, based on EAA s real-time flow gauges in these channels and as often as appropriate for the maintenance of a beneficial hydrologic condition of the Old Channel habitat. Prior to this, the City of New Braunfels will replace and repair existing gates and control mechanisms to restore the operability of all four water paths to the Old Channel from Landa Lake: the two small 1 See also Section
289 culverts, the one large culvert, and the Springfed Pool inlet. This repair will allow for the manipulation of water flow per the flow split strategy in Table 5-3 and the prevention of sustained high flows in the Old Channel that resulted in scouring. A second objective is to maximize the quality of habitat in the Old Channel. This will be accomplished by: (1) providing an appropriate level of flow variability during average to high flow conditions; and (2) allowing proportionally more water to flow through the Old Channel versus the New Channel during periods of critically low-flow with the ultimate goal of preserving high quality fountain darter habitat within the Old Channel as long as possible. A detailed description of flow-split management is described in BIO-WEST (2011c). Based on the analysis conducted to date, the desired goal for maximizing fountain darter habitat in upper portions of the Old Channel at all times is to maintain cfs. Extremely uniform suitable habitat is present in the New Channel under modeled ( cfs) flows (Hardy 2011). Table 5-3 describes the flow-split for total Comal springflow conditions. During average to high flow conditions the focus is on a seasonal flow split in order to optimize habitat conditions in the Old Channel over time. Slightly higher flows during the fall and winter will provide some channel maintenance benefit while not hindering overall fountain darter habitat. Optimal habitat conditions are proposed for spring and summer to provide the best opportunity for fountain darter recruitment. TABLE 5-3 FLOW-SPLIT MANAGEMENT FOR OLD AND NEW CHANNELS Total Comal Old Channel (cfs) New Channel (cfs) Springflow (cfs) Fall, Winter Spring, Summer Fall, Winter Spring, Summer When total Comal springflow flows drop to 150 cfs, the flow split will be shifted to protecting the maximum amount of habitat within the Old Channel year-round, while continuing to provide flow in the New Channel at all times (see Table 5-3). Additionally, when total Comal springflow drops below 100 cfs, if necessary, the City of New Braunfels staff will manipulate the valves and culverts more frequently to maintain the flow split ratio as detailed in Table
290 As discussed in Hardy (2011), 20 cfs in the Old Channel will provide approximately 75 percent of the maximum available fountain darter habitat in the Old Channel from a physical habitat perspective. In addition to physical habitat, four checkpoint temperature ranges have been identified as critical to the fountain darter life cycle: at and above 77 to 79 F there is reduction in fountain darter larval production; between 79 F and 82 F and above there is a reduction in egg production, and at approximately 91 F and 94 F larval and adult thermal death can be expected based on laboratory studies (Brandt et al. 1993, Bonner et al. 1998, McDonald et al. 2007). At 20 cfs, under the extreme ambient temperature conditions modeled in Hardy (2011), the Old Channel area between Landa Lake and Golf Course Road [Model Segment 18; Hardy 2011]) is projected to maintain water temperature below three of the four temperature threshold ranges at all times. Reduced larval production (up to 63 percent) has the potential to occur for portions of the day based on laboratory results from McDonald et al. (2007). Hardy (2011) shows that the lower portion of the next modeled segment downstream (Reach 19 Old Channel above Elizabeth Street) is projected to have water temperatures high enough during portions of the day to cause reduction in egg production as well. All subsequent downstream Old Channel segments also are projected to have temperatures at least as high for short periods of time. However, it should be reiterated that even at 20 cfs, nowhere in the Old Channel during the extreme conditions modeled, are water temperatures projected to exceed levels necessary for adult or juvenile survival. (Hardy 2011). Additionally, it should be noted that the City of New Braunfels is in the process of restoring the functionality of the Landa Lake Spillway and Landa Lake Dam. This repair and restoration project will protect the Old Channel from scouring in less severe rainfall events and reduce sedimentation effects in the Old Channel. This repair is contingent upon receiving permits from the Army Corp of Engineers and the USFWS Native Aquatic Vegetation Restoration and Maintenance It has been documented over the past decade (BIO-WEST 2002a 2011a) that native aquatic vegetation plays a key role in supporting the native fish assemblages, including the fountain darter. To minimize and mitigate the impacts of incidental take from low-flow events by providing better habitat conditions for the ecological community, the City of New Braunfels will undertake a program of native aquatic vegetation restoration within key, sustainable reaches of the Comal River by planting native vegetation in unoccupied areas and in areas previously occupied by non-native aquatic vegetation, with the latter preceded by non-native vegetation removal. The amounts and types of vegetation removed and restored in this program will be established by Table 4-5 and 4-6 respectively. Two-dimensional hydraulic models will be used to evaluate the potential for success of the native vegetation restoration. This evaluation will consider the depth, velocity, and substrate conditions present in the proposed areas along with what nonnative vegetation is thriving in these areas. In areas that are bare of vegetation, the reason vegetation is absent (e.g., recent flood scour, or unsuitable depth, velocity or substrate conditions) will be evaluated prior to restoration. Following an evaluation of the physical habitat model, an evaluation of water quality conditions will also be conducted. In particular, the CO
291 need of the native aquatic plant being considered for establishment and the CO 2 concentrations in the water column under varying flow conditions at the proposed restoration locations will be evaluated. Additionally, restoration will involve acquiring local, disease- and pathogen-free plant material. The material will be removed from adjacent habitat, propagated off-site (e.g., at the NFHTC) using plant material removed from the Comal system. Alternatively, it may be purchased from vendors who meet locality and disease free criteria. When non-native species are removed, they will be disposed of properly. The focus of native vegetation restoration will be on Landa Lake downstream of Spring Run 3 but above the New Channel USGS weir and on the portions of the Old Channel bordered on both sides by City of New Braunfels property, including the Old Channel ERPA. Restoration efforts will also include establishing additional Cabomba along the eastern shoreline of Landa Lake and along the New Braunfels golf course property to create valuable fountain darter habitat Old Channel Environmental Restoration and Protection Area (Old Channel ERPA) To minimize and mitigate the impacts of recreation and pumping during periods of low flow, the City of New Braunfels will remove problematic non-native vegetation, restore native habitat (per Table 4-6), undertake limited channel modification to enhance fountain darter habitat, and remove a small sediment island. The Old Channel Environmental Restoration and Protection Area (ERPA) includes the EAA Variable Flow Study reach below Elizabeth Street upstream to the culverts feeding the Old Channel from Landa Lake where the preferred native aquatic vegetation of the fountain darter has been scoured and replaced over time with less-preferred non-native aquatic vegetation. This measure does not include an experimental channel or recirculation in Landa Park. As additional research is conducted and new data established, the City of New Braunfels will consider additional measures to protect habitat in this stretch of the Old Channel, see BIO- WEST (2011c), based on the protocols set forth in the FMA for determination of AMP measures and their implementation. One specific area of targeted sediment removal is a small island that has formed just behind the Springfed Pool and immediately downstream of Landa Lake. This sediment island continues to grow, has established destructive non-native cane, and has displaced/destroyed fountain darter habitat Comal River Restoration Upon final determination of locations suitable fountain darter habitat for restoration in the Comal River proper (below the USGS gauging weir, aka Stinky Falls), the City of New Braunfels will conduct native vegetation restoration and yearly maintenance to establish additional fountain darter habitat. Areas for targeted restoration preferred by the City of New Braunfels include the 5-13
292 portion of the Comal River between Last Tubers Exit and the confluence of the Guadalupe River and portions of the Comal River that allow for protection on one side of the river and safe passage of recreators on the other side of the river. Once the habitat has been established, TPWD will pursue creation of State Scientific Areas to protect fountain darter habitat Native Aquatic Vegetation Maintenance Restoring native vegetation within the Comal system will benefit the Covered Species, but will be unsuccessful or likely very limited in success if it is not monitored and protected over time. One-time restoration contradicts the purpose for these activities which is to provide better habitat conditions for the ecological community over time and in particular, upon entering into critical low-flow periods. To sustain these conditions prior to entering into low-flow periods, the City of New Braunfels will conduct yearly maintenance of native aquatic vegetation restoration sites in Landa Lake and the Old Channel, and the flow-split management discussed above in Section Native aquatic vegetation maintenance consists of actively monitoring and maintaining planted stands of native vegetation. Temporal monitoring will incorporate some form of quantitative measurement system to assess whether plantings are increasing, decreasing, or remaining stable. Additionally, intensive non-native vegetation control in the adjacent areas will be implemented until the native vegetation is well-established. It will include additional activities following natural disturbances such as floods, periods of limited recharge, and/or herbivory, as well as anthropogenic disturbances such as recreation or vandalism. Anytime a disturbance is observed, the monitoring/maintenance schedule will be modified temporarily in order to provide the stability for the native vegetation re-establishment Management of Public Recreational Use of Comal Springs and River Ecosystems To minimize and mitigate the impacts of recreation, the City of New Braunfels will manage recreational use of the Comal Springs and Comal River Ecosystem through two methods: 1) The City of New Braunfels will not reduce current protections provided by City Ordinance or Policy and will continue to enforce these regulations, including: a. Limiting recreation on Landa Lake to Paddle Boats b. Prohibiting recreational access to the Spring Runs in Landa Park to the Wading Pool in Spring Run 2. c. Prohibiting water recreation on the Old Channel; with the exception of Schlitterbahn operations within its present location. 2) Pursuant to Section 9.2 of the IA, the City of New Braunfels will issue Certificates of Inclusion (COIs) to those commercial outfitting businesses that facilitate recreational activities on the Comal River (Outfitters) that comply with the requirements of the COI program established in this section. Outfitters that opt into the COI program and receive a COI will receive incidental take coverage during the term of the COI, which 5-14
293 shall not extend beyond the Permit term. The City of New Braunfels is not required to regulate the recreational activities of those Outfitters that choose not to participate through the COI process beyond the minimization and mitigation activities the City of New Braunfels has committed to undertake in this HCP. Outfitters can apply for a COI when the ITP is issued and every two years thereafter. For those Outfitters that voluntarily participate in order to obtain incidental take coverage for their recreational activities, the COI will contractually require t h o s e O u t f i t t e r s to comply with and implement listed minimum standards set out below. The City of New Braunfels will not reduce or eliminate any of the listed minimum standards during the 15-year ITP term but reserves the right to add additional standards in the future. COIs from the City of New Braunfels will be issued for a twoyear term; so that every two years conditions of the COI may be re-evaluated and increased if necessary to further promote mitigation activities, reflect changes in New Braunfels policy or ordinance as related to protection of habitat or address new information established through the best science available as related to the species. The City will provide each year to the Program Manager for incorporation into the An n ual Re p ort a copy of all COIs issued during that year and information regarding the Outfitters compliance with the minimum standards. Minimum COI Outfitter Standards a. Provide litter bags to all customers b. Sponsor one Comal River Cleanup annually. Outfitters may sponsor an existing river cleanup or may organize their own. Services and resources provided as a sponsor must exceed $1,000 in direct payment or in-kind service. c. Provide at point of purchase at place of business, educational signage about the endangered species, their Critical Habitat, and efforts to promote the Covered Species (largely HCP initiatives and Critical Period Management information). Design and artwork will be produced and supplied by the City of New Braunfels. Signage must be at a minimum 3 x 6. d. Require all businesses, at their respective business locations, to support and assist the City of New Braunfels enforcement of laws that relate to the Covered Species and their habitat. Specifically, this applies to, but is not limited to, litter prevention and habitat protection. e. Outfitters must submit a yearly report to the City of New Braunfels by January 1 of each year, detailing activities related to the COI for the previous year. f. If established, Outfitters shall provide at point of purchase at place of business, a map and educational sign about the State Scientific Areas. Design and artwork will be produced and supplied by the City of New Braunfels. Combined map and sign must be at a minimum 3 x
294 g. Assist the City of New Braunfels with implementation of additional recreational management measures and controls at flows below 100 cfs to reduce habitat effects, water quality degradation, and other determined negative effects. h. Stencil all outfitter rented recreational equipment with an anti-litter message. The City of New Braunfels will design and supply the stencil to be used. If an Outfitter is in violation of any standard, the City of New Braunfels may suspend or revoke the Outfitter s COI after providing notice, an opportunity to come into full compliance, and a hearing Decaying Vegetation Removal and Dissolved Oxygen Management The largest uncertainty noted in the Hardy (2011) report is the potential effect of extended lowflow periods on aquatic vegetation dynamics within the Comal system as neither the hydraulic and habitat modeling, nor water quality modeling conducted addresses this issue. The main concern is that under extremely low-flow conditions, aquatic vegetation may start to die, and subsequently decay, consuming a large amount of dissolved oxygen (DO) during the decay process. This in turn could cause large swings in the DO concentration within Landa Lake, which depending on the severity, could affect the biological community including the fountain darter. The concern is probably limited to the lake portions of the system as the culverts and weirs present at the uppermost portions of the Old and New Channels would likely provide sufficient re-aeration to compensate for most events. However, within the lake environment, problems could occur. To minimize and mitigate the impact of incidental take from low-flow events, upon receipt of DO data indicating a water quality concern created by decaying vegetation and the total Comal springflow drops below 80 cfs, the City of New Braunfels will implement a dissolved oxygen management program. The program will be focused on ensuring adequate DO levels for the ecosystem. Techniques to accomplish this objective may include artificial aeration of areas of Landa Lake or other solutions. If appropriate, the program may include removal of decaying vegetation. Removal techniques for decaying vegetation, if necessary, may include using rakes/pitch forks and a jon boat to transfer material to the banks for subsequent disposal. In this way, greater dissolved oxygen will remain available for the living aquatic ecology, rather than be consumed in the decay process Control of Harmful Non-Native Animal Species To minimize and mitigate the impacts of low flows, the City of New Braunfels will conduct nonnative animal species control on an annual basis. Initial control efforts will be intense and take place during the winter s first freeze, with continued control every winter. Control of non-natives will include annual maintenance and monitoring and non-natives will be disposed of out of the 5-16
295 floodplain. The non-native animal species that will be addressed include the suckermouth catfish, tilapia, nutria, and ramshorn snail. Potential control methods are discussed below. Studies have shown that many fishes (especially small fish) have very similar food habitats (Hubbs et al. 1978). If non-native species are added to the aquatic ecosystems, greater competition or overlap among species is possible as these non-native species may be able to acquire resources with greater efficiency than native species (USFWS 1984). Suckermouth catfishes (Loricariidae) are a non-native fish species that has become established in the waters of Texas including the Comal River. (Howells 2005). Suckermouth catfishes prefer to feed on periphyton and algae (Hoover et al. 2004). The fountain darter lays eggs on algae and loss of spawning habitat and possibly egg predation are potential threats from suckermouth catfish (SSC 2009). There is some concern that excessive numbers of suckermouth catfishes could cause direct (potential displacement) and indirect effects (disruption of food supply) to the fountain darter in the Comal River (SSC 2009). Suckermouth catfishes also burrow into the river banks, destabilizing them and causing the introduction of additional sediment load into the habitat. Tilapia is another non-native fish species that can impact fountain darter habitat. Tilapia destroys vegetation by making bare ground nests. During times of low flow and drought this could further reduce already limited habitat for the fountain darter. Tilapia is a tropical species that will congregate in winter near spring openings and other warm water sources. When tilapia congregate this creates the opportunity to use seines, gill nets, cast nets, or other methods to remove large quantities with minimal impact to the habitat. Artificial heating could be one method used to congregate fish in areas away from springs and endangered species to minimize the impacts from collection efforts. Similarly, tilapia tend to congregate in backwater pools during summer months. This may afford another opportunity for effective removal of the fish. A non-native gastropod (giant ramshorn snail [Marisa cornuarietis]) also poses a threat to the Comal Springs ecosystem. The giant ramshorn snail, a species in the aquarium trade, was first discovered in Landa Lake in (McKinney and Sharp 1995). This snail grazes on aquatic plants and in the 1990s played a major role in reducing plant biomass in Landa Lake. This snail prefers clear streams and pools with temperatures of at least 66 F (19 C). When exposed to lower temperatures, the snails withdraw into their shells and only survive for short periods. The warmest temperature that the giant ramshorn snail can withstand is 102 F (39 C). Although the population has diminished since the mid-1990s, the potential for future alteration of plant communities by the Ramshorn in the Comal ecosystems remains. (McKinney and Sharp 1995; BIO-WEST 2007c). The strong preference of fountain darters for aquatic vegetation highlights the concern posed by the grazing activities of the giant ramshorn snail (BIO-WEST 2004a). This species will be monitored closely to assure that it does not significantly reduce the available fountain darter habitat. 5-17
296 5.2.6 Monitoring and Reduction of Gill Parasites A major concern in the Comal Springs ecosystem is the continued presence of an Asian trematode, Centrocestus formosanus. This parasite was first discovered on fountain darters in the Comal River during October The parasite attaches to the fish s gill filaments causing extensive gill tissue proliferation and damage (Mitchell et al. 2000) with mortality in the wild being reported following the discovery in 1996 (Tom Brandt, personal communication). A non-native snail, Melanoides tuberculatus, that has been in central Texas since 1964 (Mitchell et al. 2005) has been confirmed as C. formosanus central Texas first intermediate host (Mitchell et al. 2000). Parasite monitoring via examination of presence on fountain darter gills to determine C. formosanus levels in the Comal River has been ongoing since the late 1990s by the USFWS, Texas State University, and BIO-WEST (EAA Variable Flow Study). In 2010, USFWS and BIO-WEST conducted a pilot study for the EARIP to determine the effectiveness of Melanoides tuberculatus removal on lowering drifting gill parasite numbers in the Comal River. (USFWS NFHTC and BIO-WEST 2011). The study confirmed that removing M. tuberculatus from the Comal River will result in a decrease in C. formosanus cercariae in the water column. It also recommended adaptive management studies to better determine the magnitude and duration of the benefits from snail removal. To minimize and mitigate for the impact of low flows, the City of New Braunfels will retain and oversee the work of a contractor to establish a gill parasite monitoring and reduction program. The program may consist of non-native snail removal based on the pilot study conducted by USFWS and BIO-WEST (Id.). However, additional research on the most effective means of gill parasite removal will be conducted as part of the AMP as discussed in Section to determine the method of gill parasite control that will actually be implemented Prohibition of Hazardous Materials Transport Across the Comal River and Its Tributaries Hazardous materials transported by vehicles across the watershed of the Comal River and its tributaries present the possibility of accidental spills or releases into the environment. The limited geographic distribution of the Covered Species at Comal Springs could cause the species to be highly impacted by such a spill. The City of New Braunfels will coordinate with the Texas Department of Transportation (TDOT) to prohibit transportation of hazardous materials on routes that cross the Comal River and its tributaries. This effort may include legislation, City of New Braunfels ordinances, additional signage, and TDOT approval Native Riparian Habitat Restoration To minimize and mitigate the impacts of low flow, the City of New Braunfels will restore native riparian zones, where appropriate, to benefit the Comal Springs riffle beetle by increasing the amount of usable habitat and food sources (i.e., root structures and associated biofilms). The method of riparian zone establishment will include the removal of non-natives and replanting of native vegetation representative of a healthy, functioning riparian zone. Trees and plants with 5-18
297 extensive root systems will be given preference to create the maximum beetle habitat. Fine sediment covering exposed roots and springs will also be removed. The riparian zone will be monitored (at least annually) for continued success and removal of reestablished non-natives. Riparian zones will be protected until the preferred riparian zone is established. Riparian habitat zones will be created along both sides of Spring Run 3 and along the portion of the western shoreline that is owned by City of New Braunfels. In addition, riparian restoration also benefits the system through bank stabilization and nutrient and sediment processes. The City of New Braunfels will develop a program to incentivize private landowners on the Comal River and its tributaries to establish riparian zones along the western shoreline Reduction of Non-Native Species Introduction and Live Bait Prohibition Introducing non-native species into the Comal Springs and River results in predators and competitors for the Covered Species in the ecosystem. To mitigate the impacts of recreation and pumping from the Aquifer during drought, the City of New Braunfels will undertake measures to stop or substantially reduce the introduction of non-native species from aquarium dumps and prohibit the use of live bait species. The City of New Braunfels will prohibit by Ordinance introductions of domestic and non-native aquatic organisms, targeting specifically bait species and aquarium trade species into the Comal system. This action will include signage at key entrance points to parks on Landa Lake and the Comal River Litter Collection and Floating Vegetation Management To minimize and mitigate the impacts of recreation and pumping during low flow periods, the City of New Braunfels will clean litter and debris from and manage floating vegetation in the Comal Springs, Landa Lake, and Old and New Channels of the Comal River. Litter and debris collection both flood-related and routine, will utilize self-contained underwater breathing apparatus (SCUBA). Debris removal also includes the removal of litter from floating vegetation mats before dislodging the vegetation mat and allowing it to continue downstream. Vegetation mats shade out native vegetation and create die off of vegetation if the mats are allowed to collect and grow in size. By dislodging the floating vegetation mats, fountain darter habitat is maintained and protected Management of Golf Course Diversions and Operations Historically, the City of New Braunfels Golf Course has not used its full permitted surface water rights for irrigating the Golf Course. From 2006 through 2010, an average of ac-ft/yr of water was diverted under both permits for golf course irrigation compared to the full permitted amount of 300 ac-ft/yr. To reduce use of Comal River water further, the City of New Braunfels 5-19
298 is working with New Braunfels Utilities under a grant received by the Texas Water Development Board to develop and implement a reuse water system that will be used to maintain the golf course by supplementing or, to the extent feasible, replacing the surface diversions used for irrigation purposes. The design process has been started for the reuse system. The City of New Braunfels will develop a golf course management plan that will document current practices and include an Integrated Pest Management Plan (IPMP). The golf course management plan and IPMP will incorporate environmentally sensitive techniques to minimize chemical application, improve water quality, and reduce negative effects to the Covered Species. Any chemicals used will be applied by a licensed applicator in a manner consistent with the label directions. Expanded water quality sampling targeted at Golf Course operations will be conducted per Section of of the HCP. Changes in golf course management will be addressed through the AMP as set out in Article 7 of the FMA. 5.3 City of San Marcos Texas Wild-Rice Enhancement and Restoration Hardy (2011) describes the potential addition of Texas wild-rice habitat that might be achieved with the removal of non-native aquatic vegetation (Hydrilla verticillata and Hygrophila polysperma). Hardy (2011) shows that the removal of H. verticillata and H. polysperma within Texas wild-rice patches and including a 2-meter buffer around those patches could potentially provide over 1,000 m 2 of additional optimum Texas wild-rice habitat area over the entire simulated flow range (45 to 80 cfs). Proactive planting and conservative non-native vegetation removal has a high potential for increasing existing Texas wild-rice occupied area that would remain hydraulically suitable at these modeled flow levels. (Hardy (2011). Based on BIO-WEST and TPWD monitoring data collected over the past decade and Hardy (2011) model results, the City of San Marcos, in partnership with Texas State University, will implement a Texas wild-rice enhancement and restoration program. Model results will be used to identify restoration/enhancement areas for Texas wild-rice that have a high probability of success (i.e., optimal habitat). In mixed (Texas wild-rice and non-native vegetation) stand areas, the non-natives will be removed and the original Texas wild-rice stand monitored for expansion. Similarly, for Texas wild-rice occupied optimal areas with adjacent non-native vegetation, the non-native plants will be removed and the Texas wild-rice stand monitored for expansion. Finally, in optimal areas for Texas wild-rice that are unoccupied by Texas wild-rice, non-native vegetation will removed and Texas wild-rice plants planted and monitored to assess the potential success of transplants. As described in Hardy (2011), the specific areas chosen for field trials will first consider only optimal habitat areas that remain suitable over the full range of discharges between the long-term average and lower flows. Initial field experiments associated with Texas wild-rice enhancement will be initiated early in the first phase of the AMP. 2 Figure 5-1 displays the areas where minimization and mitigation measures will be implemented by the City of San Marcos. 5-20
299 Figure 5-1. Areas where the City of San Marcos will implement Minimization and Mitigation Measures 5-21
300 5.3.2 Management of Recreation in Key Areas Recreation plays an integral part in what makes the San Marcos River such an attractive resource. San Marcos is expected to double in population to over 94,000 people by 2030 with the Austin-San Antonio corridor increasing at the same rate. This is expected to lead to increased recreation, especially as the San Marcos River is reaching its capacity. The most prominent recreation feature of the river downstream of Sewell Park is the Noon Day Lion s Club Toob Rental which is housed in the City s recreation hall in City Park. Tubes are rented for a fee with proceeds gifted back to the community through the Lion s Club. There are several other small businesses which rent tubes but these are minor contributors to the overall number of rentals. Parking around the river is limited to City Park and at Rio Vista Park. No new parking is planned. A major concern regarding Texas wild-rice is recreational activity in high-quality habitat areas of the San Marcos River. Several types of recreation occur traditionally on the San Marcos River, including swimming, snorkeling, scuba, non-motorized boating, tubing, wading, fishing, and recreating with dogs. All these activities impact Covered Species and their habitat, some to a greater degree than others. While exact impacts are unknown, as discharge decreases, a greater percentage of plants are exposed to potential negative consequences. Damage to wildrice stands by recreationists, particularly dogs, through direct contact was documented by Breslin (1997). Wild-rice is further impacted through fragmentation of other vegetation which then floats downstream eventually collecting on wild-rice stands. Fountain darters are potentially impacted through increased turbidity and accidental contact. While there are hardscaped access points throughout City parks, numerous desire trails exist and contribute to bank erosion where recreationists enter and exit at whim. Recreation control is not meant to curtail recreation for large stretches of the river, but simply within key high quality habitat areas for Texas wild-rice to limit unnecessary impacts during lowflow conditions. To minimize the impacts from recreation, the City of San Marcos will establish permanent river access points. Permanent access will be located at Dog Beach, Lion s Club Tube Rental, Bicentennial Park, Rio Vista Park, the Wildlife Annex, and potentially other areas (as determined through the AMP). Areas between access points will be densely planted with vegetation that discourages streamside access. Additionally, TPWD will pursue the creation of State Scientific Areas by limiting recreation in these specified areas during low flow conditions. With the exception of the eastern spillway immediately below Spring Lake dam, none of the protected areas would extend across the entire river channel in order to allow longitudinal connectivity for reasonable recreation throughout the river. The City of San Marcos will install kiosks showing access points, exclusion zones, and associated educational components at key locations. 5-22
301 Management of Public Recreational Use of San Marcos Springs and River Ecosystem Public recreational use of the San Marcos Spring and River ecosystems include, but are not limited to swimming, wading, tubing, boating, canoeing, kayaking, golfing, scuba diving, snorkeling, and fishing. To minimize the impacts of incidental take resulting from recreation, the City of San Marcos will implement the Recreation Mitigation Measures adopted by the San Marcos City Council on February 1, 2011 (Resolution ) (Appendix N) Some of the measures adopted by the City Council are described elsewhere in this Section. Those not described elsewhere include: 1. Trespassing Enforcement. The public is accessing the river via private property without the permission of the property owners. Private property owners have requested City assistance through signage to enforce trespassing laws. 2. Buffer zones. Create an appropriate buffer zone by location to keep picnic tables, pop-up tents, shelters, and portable grills away from the river. Pushing these amenities farther away from the river will reduce litter getting into the river and decrease bank compaction/erosion. 3. Education of the river user and the community. Suggestions include: a. Signage. Post signage at the City Park tube rental facility, Rio Vista Falls and at proposed hard access points along the river. Signage will be simple, natural, and when possible the existing sign locations will be used (trying to avoid too many signs). Signs will have the same template and coloration so they are recognized up and down the river. Signs will cover the rules of the river and educate the public on the importance of the resource. All signs will be bilingual. b. Video Loop at City Park offering information about the river and safety rules while people are waiting for shuttle or tubes. Possibly also at Rio Vista Falls. c. Posted maps showing trail, access points, fishing access and other amenities. Include a map at Stokes Park to help inform about the San Marcos River/Blanco confluence. d. Recreation information at hotels/restaurants, bed and breakfast facilities, Chamber of Commerce, Visitor s Center, City of San Marcos internet site, etc. could include information on restrictions so river users are prepared prior to entering the river. e. Park Rangers. Include a section on river biology in the training of the park rangers so they can help disseminate the information. f. School Outreach. Implement an outreach program for San Marcos Consolidated Independent School District (SMCISD) so this information can be relayed to youth in San Marcos and indirectly to the parents. g. Overall Interpretation Plan. This would pull all the informational ideas together for conformity, continuity, and implementation. 5-23
302 h. Lecture series at Texas State University. i. Stencils on rented tubes. 4. Reduce turbidity and sedimentation through the establishment of watershed management strategies. This will decrease erosion and subsequent sedimentation and filter runoff to enhance water quality. Remove silt and accumulated sediment from designated areas within the river to more closely match historical conditions. 5. The development of a partnership between the City and the University to enforce suggested measures and educate river users, and the use of officers dedicated to enforcing environmental regulations working both in and along the river. Pursuant to Section 9.2 of the IA, the City of San Marcos will issue Certificates of Inclusion (COIs) to those commercial outfitting businesses (businesses and nonprofit entities that rent tubes, canoes, kayaks, or similar equipment to facilitate recreational activities on the San Marcos River) (Outfitters) that comply with the requirements of the COI program established in this section. Outfitters that opt into the COI program and receive a COI will receive incidental take coverage during the term of the COI, which shall not extend beyond the Permit term. The City is not required to regulate the recreational activities of those Outfitters that choose not to participate through the COI process beyond the minimization and mitigation activities the City of San Marcos has committed to undertake in this HCP. Outfitters can apply for a COI when the ITP is issued and every two years thereafter. For those Outfitters that voluntarily participate in order to obtain incidental take coverage for their recreational activities, the COI will contractually require t h o s e O u t f i t t e r s to comply with and implement listed minimum standards set out below. The City of San Marcos will not reduce or eliminate any of the listed minimum standards during the 15-year ITP term but reserves the right to add additional standards in the future. COIs from the City will be issued based on a two-year term; so that every two years conditions of the COI may be increased if necessary to further promote mitigation activities, San Marcos policy or ordinance as related to protection of habitat or address new information established through the best science available as related to the species. The City will provide each year to the Program Manager for incorporation int o the An n u a l Report a copy of all COIs issued during that year and information regarding the Outfitters compliance with the minimum standards. COI Outfitter Standards 1) Provide litter bags to all customers 2) Sponsor at least one San Marcos River Cleanup annually. An Outfitter may sponsor an existing river cleanup or may organize its own. Services and resources provided as a sponsor must exceed $1,000 in direct payments or in-kind services. 5-24
303 3) Provide at point of purchase at each place of business of the Outfitter, educational signage about the Covered Species, their Critical Habitat, and efforts to protect the Covered Species (largely Applicant initiatives and CPM information). Design and artwork will be produced and supplied by the City. Signage must be at a minimum 3 x 6. 4) Require each Outfitter, at each of its business locations, to support and assist the City s enforcement of laws that relate to the Covered Species and their habitat. Specifically, this applies to, but is not limited to, litter prevention and habitat protection. 5) If one or more State Scientific Areas are established in the City, each Outfitter must provide at point of purchase at each place of business, a map and educational sign about the areas. Design and artwork will be produced and supplied by the City. Combined map and sign must be at a minimum 3 x 6. 6) Assist the City with implementation of additional recreational management measures and controls at flows below 100 cfs to reduce habitat effects, water quality degradation, and other negative effects. 7) Stencil all Outfitter-rented recreational equipment with an anti-litter message. The City will design and supply the stencils to be used. Each Outfitter must submit a report to the City by January 31 st of each year, detailing its activities related to the COI for the previous year. If an Outfitter is in violation of any standard, the City of San Marcos may suspend or revoke the Outfitter s COI after providing notice, an opportunity to come fully into compliance, and a hearing Management of Aquatic Vegetation and Litter below Sewell Park The San Marcos River is heavily used for recreation from Sewell Park to IH-35. To minimize the impacts of recreation on Texas wild-rice and other Covered Species, the City of San Marcos will perform activities to manage floating vegetation and litter to enhance habitats for Covered Species. Management activities will include removal of vegetation mats that form on top of the water surface as well as on top of Texas wild-rice plants, particularly during low flows, and removal of litter. Vegetation mats interfere with Texas wild-rice by impeding flowering and reproduction, blocking sunlight, interfering with photosynthesis, and slowing current velocity (Power 1996). The City of San Marcos will push floating vegetation downstream of any Texas wild-rice stands. The City will monitor downstream Texas wild-rice stands to keep the stands clear of drifting vegetation. Inorganic litter will be removed from the San Marcos River from City Park to IH-35 during the recreational season (May through September) and less often during offseason. Litter in or around Texas wild-rice stands will not be removed. 5-25
304 5.3.4 Prohibition of Hazardous Materials Transport Across the San Marcos River and Its Tributaries Hazardous materials transported by truck across the watershed of the San Marcos River and its tributaries presents the possibility of accidental spills or releases into the environment. The limited geographic distribution of the endangered species at San Marcos Springs could cause the species to be highly impacted by such a spill. The City of San Marcos will coordinate with the Texas Department of Transportation to designate hazardous materials routes which minimize the potential for spills entering the San Marcos River. This effort will include legislation, if necessary, and additional signage Reduction of Non-Native Species Introduction Introducing non-native species into the San Marcos Springs and River results in predators and competitors for the listed species in the ecosystem. To mitigate the impacts of recreation and pumping from the aquifer during drought, the City of San Marcos will stop or substantially reduce the introduction of non-native species from aquarium dumps. Dumping aquariums into the San Marcos River and its tributaries will be minimized through education, including signage and brochures, and offering alternative disposal to citizens wanting to get rid of unwanted aquatic pets. The City of San Marcos will partner with the River Systems Institute, Texas State University, and local citizen groups to help distribute educational materials. Partnerships with the school districts will also be considered. Educational materials will also be provided to local pet shops Sediment Removal below Sewell Park The City of San Marcos will remove sediment from the river bottom at various locations from City Park to IH-35. These areas include but are not limited to reaches of the river in City Park, Veramendi Park, Bicentennial Park, Rio Vista Park, and Ramon Lucio Park. Sediment has accumulated at these locations due to the installation of flood control dams, urbanization, and natural processes. These accumulations have altered the river s morphology and natural flow patterns. In addition, deposition of sediments on or around Texas wild-rice stands causes direct mortality by smothering or burying strands. To minimize and mitigate the impacts of incidental take from recreation and pumping during low flow periods, the City of San Marcos will remove sediment from key areas of Texas wild-rice habitat below Sewell Park. Hydrosuction will be used to remove accumulations of sediment. The silt will be vacuumed using a hose that has screen to prevent suctioning biota greater than 0.25 inch in diameter. The divers doing the hydrosuctioning will take the following measures to minimize loss/harm of biota in the area. Divers will fin the area to be suctioned to encourage the darters and other biota to move out of the area. Divers will be trained to recognize all stages of listed species from larval to adult. The nozzle of the vacuum will be kept down in the soil and not allowed to swing through the water column during the operation. In addition, placement of stakes around the area to be suctioned will keep divers away from stands of Texas wild-rice. An observer will be on the 5-26
305 bank to monitor the effluent for presence of listed species and all other biota, as well as for the safety of the diver. Sediment samples will be sent to TCEQ for contaminant testing per TCEQ requirements Designation of Permanent Access Points/Bank Stabilization To minimize the impacts of recreation, permanent access points will be combined with bank stabilization at various locations. They will serve as entry and exit ways that could be used by canoeists, tubers, swimmers, etc., while stabilizing highly eroded banks. In these areas, the bank is eroding generally due to the clearing of riparian vegetation and specifically due to intense recreational use. The City of San Marcos will stabilize banks in eroded areas, to include City Park, Hopkins Street Underpass, Bicentennial Park, Rio Vista Park, Ramon Lucio Park, and Cheatham Street underpass. Natural rock will be used to create a stone terrace for access and bank stabilization with the bank on either side restored with riparian vegetation. Native riparian vegetation will be planted in areas adjacent to the access/stabilization areas in order to discourage river users from entering the river in places other than the access point. Prior to each construction period, the area will be swept clean of darters and enclosures will be put into place to keep darters out of the construction area. No work outside this area will occur. If additional areas along the river require stabilization, the City of San Marcos will submit a scope of work for consideration through the AMP. The City of San Marcos will establish permanent river access points. Permanent access will be located at dog beach, Lion's Club Tube Rental, Bicentennial Park, Rio Vista Park, the Wildlife Annex, and potentially other areas (as determined during the Adaptive Management Process). Areas between access points will be planted with vegetation that discourages streamside access (e.g., prickly pear and acacia) Control of Non-Native Plant Species The City will partner with Texas State University to implement an on-going non-native plant replacement program for the recreational corridor from Spring Lake to city limits. Non-native species of aquatic, littoral, and riparian plants will be replaced with native species to enhance Covered Species habitat. The divers that will be conducting sediment control will first remove non-native aquatic plant species from the area to be worked that day. Removal will initially focus on hydrilla (Hydrilla verticillata) as this species causes sediment deposition and adds turbidity to the water column when disturbed. The non-native aquatic plants will be shaken and bagged for removal from the system in the same manner described in Section Areas will be weeded until the natives become established at the site. The riparian zone will be restored to at least 15 meters in width where possible. Areas will be planted at a ratio of three hard mast trees to one soft mast tree, with 20 percent of the vegetation consisting of fruit-bearing shrubs. Vegetation such as big bluestem, switchgrass, Indian grass, live oak, Texas red oak, bur oak, pecan, bald cypress, American beautyberry, and 5-27
306 buttonbush will be used. Fencing may be required for the first two years to allow for the establishment of the species Control of Harmful Non-Native and Predator Species Studies have shown that many fishes (especially small fish) have very similar food habitats (Hubbs et al. 1978). If non-native species are added to the aquatic ecosystems, greater competition or overlap among species is possible as these non-native species may be able to acquire resources with greater efficiency than native species (USFWS 1984). Suckermouth catfishes (Loricariidae) are a non-native fish species that has become established in the waters of Texas including the San Marcos River. (Howells 2005). Suckermouth catfishes prefer to feed on periphyton and algae. (Hoover et al. 2004). The fountain darter lays eggs on algae and loss of spawning habitat and possibly egg predation are potential threats from suckermouth catfish (SSC 2009). There is some concern that excessive numbers of suckermouth catfishes could cause direct (potential displacement) and indirect effects (disruption of food supply) to the fountain darter. (SSC 2009). Suckermouth catfishes also burrow into the river banks, destabilizing them and causing the introduction of additional sediment load into the habitats. Tilapia is another non-native fish species that can impact fountain darter habitat. Tilapia destroys vegetation by making bare ground nests. During times of low flow and drought this could further reduce already limited habitat for the fountain darter. Tilapia is a tropical species that will congregate in winter near spring openings and other warm water sources. When Tilapia congregate this creates the opportunity to use seines, gill nets, cast nets, or other methods to remove large quantities with minimal impact to the habitat. Artificial heating could be one method used to congregate fish in areas away from springs and endangered species to minimize the impacts from collection efforts. A non-native gastropod (giant ramshorn snail [Marisa cornuarietis]) also poses a threat to the San Marcos Springs ecosystem. The giant ramshorn snail, a species in the aquarium trade, was first discovered in Spring Lake in 1984 (McKinney and Sharp 1995). This snail grazes on aquatic plants and in the 1990s played a major role in reducing plant biomass in Spring Lake. This snail prefers clear streams and pools with temperatures of at least 66 F (19 C). When exposed to lower temperatures, the snails withdraw into their shells and only survive for short periods. The warmest temperature that the giant ramshorn snail can withstand is 102 F (39 C). Although the population has diminished since the mid-1990s, the potential for future alteration of plant communities in these two ecosystems remains and could affect endangered species (McKinney and Sharp 1995; BIO-WEST 2007c). The strong preference of fountain darters for aquatic vegetation highlights the concern posed by the grazing activities of the giant ramshorn snail (BIO-WEST 2004a). To mitigate the impacts of incidental take by pumping and recreational activities, the City of San Marcos, in partnership with Texas State University, will implement non-native and predator species control for the San Marcos River on a periodic basis with expanded effort of control, if needed, at low flows. The species include suckermouth catfish, tilapia, and Melanoides and Marisa snails. 5-28
307 The Pterygoplichthys disjunctivus vermiculated (sailfin catfish) adults are concentrated in Spring Lake and Hypostomus plecostomus (suckermouth catfish) are found downstream of Spring Lake. Currently, the most effective method of removal for both species is to hunt with a gig or similar multi-pronged spear. Other technologies, such as the heat box, fish-specific disease, and daughter-less technology require further research for their applicability to these species in the San Marcos River. Additionally, incentives, such as bounty for capture, could be established to encourage fishing for catfish. With respect to tilapia, the adults are concentrated in the slough arm of Spring Lake. The use of gill nets during their reproductive season (Jan May) provides an effective method of removal. Using a large mesh net along with frequent checks will prevent capture of fountain darters and other desirable species. Additionally, incentives, such as bounty for capture, could be established to encourage fishing for tilapia. Melanoides snails and the gill parasite (Centrocestus formosanus) have been present in the San Marcos system, but at low levels. Controls will not be implemented initially. However, Melanoides snails and the gill parasite (Centrocestus formosanus) will be monitored and any appropriate measures implemented through the Adaptive Management process. Melanoides tuberculata is located throughout the upper reach of the San Marcos River. If necessary, effective removal can be accomplished by determining the locations of highest snail density and use dip nets to remove the snails weekly. (See Section 6.36) Marisa cornuarietus is found sporadically in the upper reach of the San Marcos River. This snail vertically migrates at night and is easily spotted with a flashlight. The species will be controlled by diving several hours after sunset to hand-pick the snails from the submergent vegetation. All personnel implementing any portion of the HCP for the City of San Marcos will undergo an orientation at the NFHTC to ensure awareness of the listed species and safe procedures while working in and along the San Marcos River. 5.4 Texas State University Texas Wild-Rice Enhancement and Restoration Texas State University will partner with the City of San Marcos to undertake a program of Texas wild-rice enhancement and restoration in Spring Lake and the San Marcos River within the University s campus boundaries as described in Section above Management of Recreation in Key Areas Texas State University will partner with the City of San Marcos to control recreation in Spring Lake and the San Marcos River within Texas State University campus boundaries. To minimize the impacts from recreation, Texas State University will establish permanent access points on the east and west banks of the San Marcos River between Spring Lake dam and the Aquarena Drive bridge, and other areas as determined during the AMP. These areas will serve as entry and exit ways that could be used by canoeists, tubers, swimmers, etc. Areas between access points will be planted with vegetation that discourages streamside access (e.g., prickly pear and acacia). 5-29
308 Additionally, TPWD will pursue creation of State Scientific Areas in the San Marcos Springs ecosystem and River that would limit recreation in these areas during low flow conditions. (See Section 5.6.1). With the exception of the eastern spillway immediately below Spring Lake Dam, none of the protected areas would extend across the entire river channel which would allow longitudinal connectivity throughout the river. Kiosks showing access points, exclusion zones, and associated educational components will be installed at key locations Management of Vegetation Management of Submerged and Floating Aquatic Vegetation in Spring Lake To mitigate the impacts of incidental take on Covered Species from recreation, Texas State University will manage aquatic vegetation in Spring Lake through use of its harvester boat and through hand cutting of vegetation by divers authorized to dive in Spring Lake. Each week about five springs will be cut, thus returning to cut the same springs every two to three weeks. During summer algal blooms, the springs will be managed more frequently (up to four springs per day), but mostly to remove algae. Texas State employees and supervised volunteers will fin the area around the springs to remove accumulated sediment, and then clear a 1.5-meter radius around each spring opening in Spring Lake with a scythe. Over the next 1.5- meter radius around the spring opening, they will shear vegetation to a height of 30 cm, and then to one meter over the following three meter radius. Plant material will not be collected, but carried away by the current. Cumulatively, about six meters of vegetation around each spring opening will be modified. Mosses will not be cut. The volume of plant material to be removed will vary by the amount of time between cuttings, and season. The harvester boat will remove a range of 15-to-20 boatloads of plant material a month from Spring Lake. The harvester will clear the top meter of the water column, cutting vegetation from sections one, two, and three once a week. (See Figure 5.2). The harvested vegetation will be visually checked by driver for fauna caught in the vegetation. If the driver observes fauna, he/she will stop work and put the animal(s) back into Spring Lake if appropriate. Texas State employees and supervised volunteers are trained to recognize the Covered Species through the Diving for Science program (Section ), and avoid contact with them. Vegetation mats will be removed from zones four and five on an as-needed basis. (Figure 5-2). The total area cut will equal about nine surface acres. One permanent full-time person (Spring Lake Area Supervisor) is responsible for running the harvester and managing the removal of vegetation around the spring openings. The Spring Lake Area Supervisor also schedules cleanup of nuisance floating species such as water hyacinth and water lettuce from Spring Lake. The floating plants will be collected by hand and shaken prior to removal from the river to dislodge any aquatic species caught in the plant. The plants will be deposited into dump trucks and taken to the River System Institute compost area. 5-30
309 Management of Aquatic Vegetation from Sewell Park to City Park To mitigate the impacts of incidental take from recreational activities, Texas State University will push floating vegetation downstream of any Texas wild-rice stands. Inorganic litter will be picked up weekly from the San Marcos River from Sewell Park to City Park during the recreational season (Memorial Day to Labor Day) and monthly during offseason. Texas State University will monitor downstream Texas wild-rice stands to keep the stands clear of drifting vegetation. Divers will not pick up litter in or around Texas wild-rice stands. University employees or others will be trained by the TPWD to recognize Texas wild-rice and to protect the plant stand while removing the accumulated floating plant material. On Texas wildrice stands, Texas State University employees will lift (not push) the floating material from the top of the Texas wild-rice stands and allow it to float downstream. Downstream accumulations of plant material will be removed by the City of San Marcos to avoid impacts to Texas wild-rice further downstream. 5-31
310 Zone 1_Headwater Springs; Crater Bottom, Salt and Pepper 1&2, Weissmuller Zone 2_ Boat Path; Diversion, Cream of Wheat, Ossified Forest Zone 3_Boat Path; River Bed, Catfish Hotel, Deep Hole, Harvester Channel Zone 4_Boat Path; Archeology Site, Kettleman s, University Seminar Boat Path and Dock Zone 5_ Sink Creek/slough channel Figure 5.2: Aquatic Harvester Zones 5-32
311 5.4.4 Sediment Removal in Spring Lake and from Spring Lake Dam to City Park Monitoring of the San Marcos River since 1990 reveals that sediment production has increased from 160 m 3 /yr to 920 m 3 /yr due to a combination of upstream flood control dams and sediment inflow increases (Earl and Wood 2002). Deposition of sediments on or around Texas wild-rice stands causes direct mortality by smothering or burying stands. Texas State University will mitigate the impacts of incidental take from diving activities, research activities, recreation and pumping during low flow periods by removing sediment from key areas of Texas wild-rice habitat in Spring Lake and from Spring Lake Dam to City Park. Hydrosuction will be used to remove accumulations of sediment. The silt will be vacuumed using a hose that has an end piece covered by a 0.25-inch mesh screen to prevent suctioning biota greater than 0.25 inch in diameter. The divers doing the hydrosuctioning will take the following measures to minimize loss/harm of biota in the area. Vegetation will be finned before turning on the pump. Finning will encourage the darters and other biota to move out of the area. Divers will be trained to recognize all stages of listed species from larval to adult. The nozzle of the vacuum will be kept down in the soil and not allowed to swing through the water column during the operation. In addition, placement of stakes around the area to be suctioned will keep divers away from stands of Texas wild-rice. An observer will be on the bank to monitor the effluent for presence of listed species and all other biota, as well as for the safety of the diver. Sediment samples will be sent to TCEQ for contaminant testing per TCEQ requirements Diversion of Surface Water Under TCEQ Certificates and , Texas State University s total diversion rate from the headwaters of the San Marcos River for consumptive use is limited to 8.1 cfs. (See Section 2.5.5). The total diversion rate from Spring Lake is limited to 4.88 cfs; the total diversion rate from the San Marcos River at Sewell Park is limited to 3.22 cfs. (See Section and respectively). To minimize the impacts of these diversions, when flow at the USGS gauge at the University Bridge reaches 80 cfs, Texas State University will reduce the total rate of surface water diversion by 2 cfs, i.e., to a total of approximately 6.1 cfs. This reduction in pumping will occur at the pump just below Spring Lake Dam in order to maximize the benefits to salamanders, Texas wild-rice, and other aquatic resources in the San Marcos River below Spring Lake Dam. The University will reduce the total rate of surface water diversion by an additional 2 cfs when the USGS gauge reaches 60 cfs. The additional 2 cfs reduction will be made from the pumps located in the slough arm of Spring Lake, and, therefore, maximize the benefits to the aquatic resources within the main stem San Marcos River below Spring Lake Dam. When the USGS gauge reaches 49 cfs, Texas State University will reduce the total diversion rate to 1 cfs. This further reduction will be made by restricting the pumps located in the Sewell Park reach. The diversion of water will be suspended when the springflow reaches 45 cfs. 5-33
312 Figure 5-3. Texas State University Surface Water Diversions. The diversions are identified with stick pins. The diversions at the pump house (slough arm of Spring Lake) and industrial cooling towers are permitted under TCEQ Certificate The 513 ac-ft/yr municipal water right has not been exercised, and no diversion for this right currently exists. The diversions at Sewell Park and the ponds are permitted under TCEQ Certificate (See Sections and respectively). The reductions in Texas State University s total diversion rate for consumptive use is summarized in Table 5-4 below: 5-34
313 Streamflow (cfs) Spring Lake Diversions (cfs) Cert. No San Marcos River Diversions (cfs) Cert. No Total Diversion Rate (cfs) > < Table 5-4. Reductions in Surface Water Diversion Rates during Low Flow Conditions under Texas State University s TCEQ Certificates and Texas State University uses a 0.25-inch mesh screen to cover the intake for surface water diversions. These screens are routinely inspected and cleaned. Fountain darters have not been observed when the screen is cleaned; however, there is a possibility for capture of adults against the screen, but not pulled into the pipeline. To avoid or minimize the impacts of the surface water diversions, the University will routinely monitor the screens to determine if any entrainment occurs and will make any necessary modifications to the screens to minimize any incident take from the operation of the diversions Sessom Creek Sand Bar Removal For decades, a sand and gravel bar has been building with each major rain event at the confluence of Sessom Creek and the San Marcos River. The bar is about two-thirds meter deep, 7 meters wide, and 21 meters long (98.5 m 3 ). Over time it has widened, deepened, and constricted the river channel; furthermore, the continued expansion has covered a stand of Texas wild-rice. The bar has become vegetated with both littoral and terrestrial plants, and is used heavily by recreationists as it provides a shallow swimming area. To minimize and mitigate the impacts of incidental take from recreation, Texas State University and the City of San Marcos will conduct a study of sediment removal options to determine the best procedure to remove this sand and gravel bar that minimizes impacts to listed species. Texas State University will submit the study for review though the AMP and implement the actions coming out of that process. A separate sediment retention pond has been constructed to minimize additional deposition to this area and will be maintained to maintain an effective level of performance Diving Classes in Spring Lake The Diving for Science Program To minimize the impacts of the Diving for Science Program that trains and authorizes individuals to dive in Spring Lake, individuals authorized through this program must demonstrate a knowledge of listed species found in the lake and their habitat, laws and regulations impacting 5-35
314 these species, good buoyancy control, the ability to avoid contact with listed species, the ability to avoid disturbing critical habitat, and the ability to stay off the bottom of the lake. The program is taught as a two-day class with a maximum class size of 20 and is taught in the Dive Training Area. The program averages 350 trainees per year. Upon completion of this class, divers are allowed anywhere in Spring Lake to perform specific volunteer tasks such as finning spring areas covered with algae, and picking up litter. Projects are structured to minimize contact with listed species in an effort to ensure protection of listed species and their habitat. The Diving Supervisor coordinates and supervises all volunteer diving. No more than sixteen volunteer divers will be allowed in the lake per day, with no more than eight at one time. Any individual diving outside of the Dive Training Area has to have completed the Diving for Science Program Texas State University Continuing Education Texas State University Continuing Education classes for check-out dives will be conducted in the Dive Training Area. To minimize the impacts of these classes, class size will be limited to 12 students and no more than three classes will be conducted per day Texas State SCUBA Classes Texas State SCUBA classes will be conducted in the Dive Training Area. To minimize the impacts of these classes, class size will be limited to 12 students and no more than three classes will be conducted per day Research Programs in Spring Lake To minimize the impacts of its research programs, all proposals to conduct research in Spring Lake will be reviewed by the River Systems Institute to ensure there is no impact on Covered Species or their habitat. If incidental take cannot be avoided, it will be minimized by educating the researchers as to the area where the listed species are located and by requiring measures to minimize any potential impacts. All diving in support of a research study will be provided by individuals who have completed the Diving for Science program. Nothing herein is intended to obviate the need for individual research projects to obtain a permit under 16 U.S.C. 1539(a)(1) Management of Golf Course and Grounds To minimize any impacts of the use of fertilizers and pesticides to maintain the golf course and grounds, Texas State University will develop a golf course management plan that will document current practices and include an Integrated Pest Management Plan (IPMP). The golf course management plan and IPMP will incorporate environmentally sensitive techniques to minimize chemical application, improve water quality, and reduce negative effects to the ecosystem. Any chemicals used will be applied by a licensed applicator in a manner consistent with the label instructions. Expanded water quality sampling targeted at Golf Course operations will be conducted as described in Section of of the HCP. Changes in golf course management will be addressed through the AMP as set out in Article 7 of the FMA. 5-36
315 Boating in Spring Lake and Sewell Park To minimize the impacts of boating on the Covered Species habitat in Spring Lake, boats in Spring Lake will be confined to areas that are mowed by the harvester, thereby not impacting vegetation and specifically avoiding Texas wild-rice stands. Individuals will enter and exit boats at specified access points to avoid impacting the flora and fauna along the bank. All boats launched into Spring Lake will undergo a USFWS-approved process for cleaning. Further, canoeing/kayaking classes in the lake will be limited to no more than 2 classes per day and each class will be in the water no more than 1 hour. Classes will have a maximum of 20 students in 10 canoes. All classes will be supervised. To minimize the impacts of boating on the Covered Species habitat in Sewell Park, canoeing/kayaking classes in Sewell Park will be confined to the region between Sewell Park and Rio Vista dam. Students will enter/exit canoes/kayaks at specified access points to avoid impacting the flora and fauna along the bank. Classes will be no longer than two hours and up to three classes will be held per day. Classes will have a maximum of 20 students in 10 canoes. All classes will be supervised Reduction of Non-Native Species Introduction Texas State University will limit introductions of non-native species by aquarium dumps. Dumping aquariums into the San Marcos River and its tributaries will be minimized through education, including signage and brochures, and offering alternative disposal to citizens wanting to get rid of unwanted aquatic pets. Texas State University will partner with the City of San Marcos and local citizen groups to help distribute educational materials. Partnerships with the school districts will also be considered. Educational materials will also be provided to local pet shops Control of Non-Native Plant Species Texas State University will partner with the City of San Marcos to implement a non-native plant replacement program for Spring Lake and the San Marcos River within the University s campus boundaries as described in Section above Control of Harmful Non-Native and Predator Species Texas State University will partner with the City of San Marcos to undertake a program of nonnative and predator species control for Spring Lake and the San Marcos River within the University s campus boundaries as described in Section above. 5.5 San Antonio Water System Use of the SAWS ASR for Springflow Protection The capacity and capabilities of the SAWS ASR can be used to meet SAWS ratepayer expectations and to play a significant role in maintaining a protective level of springflow in Comal and San Marcos Springs including during a repeat of a drought of record-like event. As discussed in section 5.8, this measure to minimize the impacts of incidental take from extended drought is the third element in the package of springflow protection measures (following the 5-37
316 VISPO and municipal conservation layers). It utilizes the SAWS ASR facility for storage and delivery of Aquifer water leased by the EAA. When triggers are reached, as described below, SAWS will use water stored in the ASR to serve as a baseload supply in its service area near to the springs. As described below, an amount equivalent to the water recovered from the ASR will be used to offset SAWS s Edwards demand. EAA will acquire through lease and option 50,000 ac-ft/yr of EAA-issued Final Initial Regular Permits. The EAA may use SAWS as its agent for this purpose. The leases and options will be acquired by EAA to fill, idle, and maintain a portion of the capacity of the SAWS ASR Project for subsequent use to protect springflows during identified drought-of-record conditions as described below. The lease program is comprised of three components. The first one-third, approximating 16,667 acre-feet of permits, will be leased for immediate storage in the ASR. The remaining pumping rights will be placed under a lease option. One-third (16,667 ac/ft) of the total will be options exercised in the year after the 10-year moving annual average of Edwards recharge falls below 572,000 ac-ft/yr, as determined by the EAA (see Section 6.2.3), and is likely to continue to decrease. The last one-third will be options exercised when the 10-year moving recharge average is less than 472,000 ac-ft/yr, as determined by the EAA (see Section 6.2.3). When the leases are in place, this water will either be pumped to fill the SAWS ASR or not pumped for any reason. When the ASR is in recovery mode (i.e., when water is being returned from the ASR), the leased water will not be pumped. The water to fill SAWS ASR is generally provided by SAWS from their existing Edwards supplies and the first one-third of the regional leases water (16,667 ac-ft) which will be maintained at all times throughout the HCP duration. SAWS will store its own unused Edwards permits in addition to the HCP leases and lease-options in the ASR when possible. SAWS, with the assistance of the Regional Advisory Group will describe in the Annual Report the storage and recovery activities. Trigger levels for implementation of ASR management in accordance with the HCP will be 630 ft-msl at the J-17 index well during an identified repeat of drought conditions similar to the drought of record as indicated by the ten-year rolling average of Edwards recharge of 500,000 ac-ft, as determined by the EAA. When triggered, the ASR or other supplies capable of utilizing shared infrastructure will be activated to deliver up to 60 million gallons per day to SAWS distribution system during a repeat of drought of record-like conditions. When the monthly average groundwater levels at J-17 are below 630 ft-msl and the ten-year rolling average of Aquifer recharge is 500,000 ac-ft or less, pumping of selected wells on the northeast side of SAWS water distribution system will be reduced in an amount that on a monthly basis equals the amount of water returned from the ASR only to the extent of the Aquifer water provided by the EAA for storage in the ASR. SAWS will use up to 100 percent of the conveyance capacity of existing SAWS ASR facilities to off-set SAWS Edwards Aquifer demand. SAWS will attempt, to the extent practicable, to mimic the pattern of delivery developed by HDR Engineering (HDR 2011). That pattern of delivery, however, was intended to represent how the water in the ASR would have been managed in the drought of record in the 1950s. Future droughts of similar duration and magnitude undoubted will differ in the timing and pattern of 5-38
317 recharge in a given year. Thus, the actual pattern of delivery of water from the ASR may differ from that HDR used in its modeling simulations depending on the actual course of the drought. (See HDR 2011). Decisions as to the actual pattern of delivery will be determined by SAWS in conjunction with the Regional Advisory Group described below. The use of the SAWS ASR is predicated on an assumption informed by HDR Engineers groundwater modeling that the SAWS ASR will be utilized to deliver approximately 126,000 ac-ft of water to SAWS distribution system during a decadal drought similar to the drought of record. It is further predicated on the assumption from HDR 2011 that the maximum amount of HCP water that will be delivered in a given year is 46,300 ac-ft. The management of the ASR to protect spring flow necessarily involves some judgment and flexibility. SAWS will make the day-to-day decisions necessary to fulfill the ASR commitment. A 12-person Regional Advisory Group consisting of four representatives of SAWS, the Program Manager, and one representative each from EAA, EAA permit holder for irrigation purposes, small municipal pumpers, the Spring cities, environmental (including Texas Parks and Wildlife), industrial pumpers, and downstream interests will provide advice to SAWS regarding the implementation of the program. The Advisory Group will meet as needed but no less than quarterly. SAWS will organize and facilitate the Advisory Group. Future droughts may not mimic the historic drought of record. SAWS, in consultation with the Regional Advisory Committee, will address future drought situations by reviewing the rollingaverage recharge triggers which may result in potentially accelerating the activation of the lease-options, based on relevant indicators Phase II Expanded Use of the SAWS ASR and Water Resources Integration Program Pipeline Based on the best available science currently available, the management objectives required to foster achievement of the biological goals include maintain daily average flows of no lower than 30 cfs (45 cfs monthly average) for no longer than a period of 6 months at a time at Comal Springs and daily average flows of no lower than 45 cfs (52 cfs monthly average) for no longer than 6 months at a time at San Marcos Springs. (See Section 4.2). During Phase I, additional studies on the effects of low flows on the species and their habitat will be conducted and the MODFLOW model used to simulate the effects of the Phase I Package will be improved and a new model developed. (See Section 6.4). Until the AMP decision-making process is complete, it is not known whether additional flow protection measures are required. Similarly, the duration and amount of additional flows that might be needed are equally unknown. To address the need now to demonstrate the ability and commitment to achieve the existing long-term biological objectives while recognizing the uncertainty associated with those objectives, the Applicants commit to implement a presumptive action that, when combined with the Phase I activities, is adequate to achieve the current biological objectives if such an action is needed. (See FMA 7.14). The presumptive action for Phase II of the HCP involves the use of the SAWS ASR with a planned construction of the WRIP Pipeline that is currently in the design stages and is 5-39
318 scheduled for completion by The WRIP consists of approximately 45 miles of water transmission pipeline and a pump station that will convey water from the SAWS ASR, Carrizo, and Brackish Desalination programs located at the Twin Oaks Facility property in south Bexar County to new and existing facilities in western and northwestern Bexar County. The pipeline generally follows a north-northwest alignment from south Bexar County, through the far west portions of Bexar County to SAWS' Anderson Pump Station near the intersection of Loop 1604 and Highway 151. The WRIP will link the existing facilities and new water supplies located at the ASR site in southern Bexar County with the southwestern and western portions of San Antonio. SAWS ability to expand the use of the ASR as a presumptive Phase II measure, if required, assumes that: (1) no additional water beyond those required for the Phase I use of the ASR will need to be stored; (2) the total amount of water to be returned from the ASR over the term of the permit will not exceed 126,000 ac-ft during the drought and 46,300 ac-ft in the worst year; and (3) no more than 40 percent of the capacity of the WRIP distribution system will be utilized at any time for HCP purposes. To the extent that such a project cannot actually be designed and implemented to achieve the goals within the above-described assumptions, additional springflow protection will be obtained through additional CPM pumping cuts in Stage V or other measures that provide an equivalent measure of springflow protection to the Covered Species. The current science suggests that Stage V pumping cuts of 47 percent would be required along with the presumptive measure. (See Section 5.8.2). 5.6 Texas Parks and Wildlife Department State Scientific Areas A major concern regarding Texas wild-rice is recreational activity in high-quality habitat areas of the San Marcos River. Several types of recreation occur traditionally on the San Marcos River, including swimming, snorkeling, scuba, boating, tubing, wading, fishing, and recreating with dogs. All these activities can impact Covered Species and their habitat, some to a greater degree than others and while exact impacts are unknown, as discharge decreases, a greater percentage of plants are exposed to potential negative consequences. Texas Parks and Wildlife Department (TPWD) has the authority to establish state scientific areas for the purposes of education, scientific research, and preservation of flora and fauna of scientific or educational value. (TPW Code ). To minimize the impacts of recreation, TPWD has created a two mile segment of the public waters of the San Marcos River as a State Scientific Area in the San Marcos Springs ecosystem. (30 TAC ). This scientific area is designed to protect Texas wild-rice by restricting recreation in these areas during flow conditions below 120 cfs. The rule makes it unlawful for any person (1) to move, deface alter, or destroy any sign, bouy, boom or other such marking delineating the boundaries of the area; (2) uproot Texas wild-rice within the area; and (3) enter an area that is marked. The regulations are intended to preserve at least 1,000 m 2 of Texas wild-rice. 5-40
319 With the exception of the eastern spillway immediately below Spring Lake Dam, none of the protected areas extend across the entire river channel; thus, allowing longitudinal connectivity for recreation and access to be maintained downstream throughout the river. The City of San Marcos and Texas State University will install kiosks at key locations showing access points, exclusion zones, and associated educational components. Interlocal agreements between the City of San Marcos and TPWD and Texas State University and TPWD will be used to allow for local in-water enforcement of the protected zones. In order to protect existing and restored fountain darter habitat, TPWD will pursue creation of state scientific areas in the Comal Springs ecosystem. (See Section ). The goal of the regulations will be to minimize impacts to habitat from recreation activities. An interlocal agreement between the City of New Braunfels and TPWD will be used to allow for local in-water enforcement of the protected zones. 5.7 Measures that Specifically Contribute to Recovery All of the measures described above will not only minimize and mitigate the impacts of any incidental take, but will also contribute to the likelihood of the survival and recovery of the Covered Species. The EARIP, however, was established as a recovery implementation program. As such, the Applicants committed to implement measures that are specifically intended to contribute to the recovery of the Covered Species. The following sets out those specific measures Native Riparian Habitat Restoration The City of San Marcos will undertake a program to increase the area of the riparian zone on public lands from City Park to IH-35 using native vegetation. As plans take shape for the reestablishment of the riparian zone, private landowners will be asked to participate in the plan. Reimbursement for the price of native plants will be provided to private landowners. Criteria to qualify for reimbursement will be established along with a list of preferred natives to replant. Texas State University will undertake a similar program to restore the riparian zone with native vegetation in upper Sewell Park. The City of New Braunfels will undertake a program to increase the area of the riparian zone along the Old Channel, the golf course and in the vicinity of Clemens Dam. As plans take shape for the reestablishment of the riparian zone, private landowners will be asked to participate in the plan. Reimbursement for the price of native plants will be provided to private landowners. Criteria to qualify for reimbursement will be established along with a list of preferred natives to replant Expanded Water Quality Monitoring Early detection of water quality impairments that may negatively impact the listed species will contribute to protecting the Covered Species by allowing for investigation and adoption of any 5-41
320 necessary measures through the AMP to address the source(s) of the concerning indicators. Such measures may include stormwater detention and water quality basins, rain gardens, storm sewer filters, or constructed wetland filters as appropriate to the indicator of concern and physical setting of the respective system. In the event that certain constituents of concern are detected at levels indicating the potential for adverse effects, Best Management Practices (BMPs) will be evaluated to reduce and/or eliminate the constituent of concern if potential sources can be identified. Examples of constituents that could lead to BMP implementation and/or modifications include, but are not limited to, polycyclic aromatic hydrocarbons (PAHs), pesticides, ash, herbicides, turbidity, fertilizers, and bacteria from human and animal/pet waste. The EAA and its predecessor agency have conducted a program of water quality data collection since (EAA 2010b). The EAA maintains a network of groundwater and surface water monitoring sites, including sites in the Comal and San Marcos springs. Each year EAA monitors the quality of water in the Aquifer by sampling approximately 80 wells, eight surface water sites and major spring groups across the region. Under this mitigation measure, EAA will expand its monitoring program to examine stormwater runoff, including additional surface and groundwater monitoring near the Comal and San Marcos springs. Water samples are routinely analyzed in the field for selected water quality parameters (i.e., temperature, ph, conductivity, and alkalinity) and in the laboratory for common major ions, metals, total dissolved solids, hardness, bacteria and nutrients. Many of the samples are also analyzed for semivolatile organic compounds and volatile organic compounds as well as pesticides, herbicides, and polychlorinated biphenyls. EAA will manage and oversee the expanded monitoring of water quality around Landa Lake and the Comal River, and Spring Lake and the San Marcos River to include stormwater sampling and additional groundwater and surface water sampling as necessary. Particular focus will be placed on point and non-point sources. Areas that are to be targeted include, but are not limited to, large areas of impervious cover, golf courses, swimming pools, and industrial runoff areas. EAA will consult with the cities of New Braunfels and San Marcos regarding sampling locations within their respective jurisdictions. More thorough and frequent water quality monitoring (surface, storm water, and groundwater) that takes into consideration the location, time of day, day of week, time of year, and all chemical water quality parameters believed to be significant will be established through the AMP. Sampling criteria will be developed based on need and relevance to each spring and River system s differing characteristics and setting Septic System Registration and Permitting Program The City of San Marcos will undertake an aerobic and anaerobic septic system registration, evaluation, and permitting program to prevent subsurface pollutant loadings from potentially being introduced to the San Marcos Springs ecosystem within city limits Minimizing Impacts of Contaminated Runoff The City of San Marcos will construct two sedimentation ponds along the river to help reduce the amount of contaminated materials that enters the river as a result of rain events. The ponds 5-42
321 will also reduce runoff velocity which will help to reduce bank erosion, and subsequently the amount of sediment that enters the river. The sedimentation ponds will be constructed by excavating and stabilizing a specified area, and building a controlled-release structure. Water source for the ponds is solely runoff from rain events. Specific details for all ponds will be submitted through the AMP as each pond is contracted for design. Each construction area will be surrounded by silt fence/rock berm to minimize runoff. Sediment controls will be monitored daily during construction and the construction area will be covered with a tarp in the event of rain. The first pond will be located in Veramendi Park beside Hopkins Street bridge. This area receives a large amount of street runoff from three different storm drains. The first pond will be designed to remove sediment and street pollutants from runoff prior to entering the river. The size, shape, and depth will be determined based on an analysis of the volume of water discharging from the storm drains. The City of San Marcos will detain as much as possible for treatment purposes. The City of San Marcos will undertake required maintenance of the sedimentation ponds on a regular basis. The area is easily accessible and sediment will be dredged and carried to the City of San Marcos s existing composting site at the Wastewater Treatment Plant. The second pond will be created by widening of drainage ditches that run alongside Hopkins Street and cut directly to the San Marcos River. Widened areas will be designed to store water for a short period of time, but long enough to collect sediments and associated pollutants from roadway runoff Management of Household Hazardous Wastes To date, water quality in the Aquifer and at the spring openings remains very good. However, as levels of development continue to increase over the recharge zone, transition zone, and even the contributing zone, the threats to water quality will increase. To reduce the potential for future water quality problems, the City of New Braunfels will initiate a hazardous household waste (HHW) program that will include accepting prescription drugs and Freon, through the TCEQ and/or the waste disposal division of the City of New Braunfels. The City of New Braunfels will establish a four-times-a-year program that could be recognized in the City's anticipated MS4 compliance and storm water permit as a contributing activity. The City of San Marcos also will maintain a HHW program that involves the periodic collection of HHW and its disposal Impervious Cover/Water Quality Protection Most potential water quality problems are linked to nonpoint source pollution such as fertilizer runoff and chemicals washed in from adjacent streets; however, spills and leaks from industrial and municipal infrastructure also present hazards. The potential for accidents and nonpoint source pollution to affect the Covered Species may be exacerbated during below average flows since chemicals and nutrients would be less diluted when a lower volume of water is present. Runoff and spills originating even at long distances from the spring openings also can affect water quality at the springs. 5-43
322 The City of New Braunfels will establish criteria related to desired impervious cover and provide incentives to reduce existing impervious cover on public and private property in New Braunfels. The City of New Braunfels will establish criteria and incentives for the program based upon the low impact development (LID)/Water Quality Work Group Final Report (Appendix Q) recommendations for Implementation Strategies and best management practices (BMPs). The City of San Marcos will establish a program to protect water quality and reduce the impacts of impervious cover (such as through LID). The City of San Marcos will develop criteria and incentives for the program based upon the LID/Water Quality Work Group Final Report (Appendix Q) recommendations for Implementation Strategies and BMPs. The EAA will put together materials regarding the value of a ban on the use of coal tar sealants and work with local governments to explore and encourage their consideration of such a ban. 5.8 HDR s Analysis of the Springflow Protection Measures Modeled Springflow with the Phase I Package The flow protection measures included in the Phase I package are detailed in Sections (VISPO), (Conservation Program); (SAWS ASR), and (Stage V Emergency Withdrawal Reductions). Each element in the package is intended to contribute to maintaining an adequate level of continuous springflows during a repeat of the drought of record conditions. The elements are intended to work in a cumulative manner to provide sufficient springflow protection during a repeat of the drought of record conditions during Phase I. To evaluate the effectiveness of the flow protection measures, the EARIP retained HDR Engineering, Inc. and Todd Engineers (collectively HDR) to simulate the springflows at Comal and San Marcos springs during a recurrence of drought of record conditions under baseline conditions and with sequential addition of each flow protection element of the Phase I measures to the baseline conditions. HDR used the U.S. Geological Survey s MODFLOW groundwater model (Lindgren et al. 2004) in the simulations. The details of the model and the simulation results are set out in HDR, Inc. and Todd Engineers, Evaluation of Water Management Programs and Alternatives for Springflow Protection of Endangered Species at Comal and San Marcos Springs, October 2011 (HDR 2011). The baseline scenario used in that simulation assumes that all of the Initial Regular Permits are being fully pumped (573,037 ac-ft) and all of the projected exempt domestic and livestock wells (13,296 ac-ft) and unpermitted federal wells (6,907 ac-ft) are being pumped to the maximum extent, subject to applicable critical period management rules. (HDR 2011). This assumption results in a projected theoretical maximum pumping of 593,240 ac-ft in each year. (Id.) The baseline simulations also assume that the critical period management pumping restrictions set out in SB 3 are in place, but do not assume that the continuous minimum springflow requirement of state law is implemented. The assumption regarding the annual pumping level probably is conservative. The highest actual recorded annual level of pumping was 542,400 ac-ft, which occurred in 1989 before the 5-44
323 creation of the Edwards Aquifer Authority. Moreover, over the last 10 years ( ) total pumping has averaged 381,000 ac-ft, with a maximum total pumping level of 456,500 ac-ft in 2006 and a minimum total pumping level of 317,600 ac-ft in Under that baseline scenario, simulated springflow ceases at Comal Springs for 38 months during a repeat of the drought of record. Springflow at Comal Springs falls below 30 cfs (monthly average) for 54 months. At San Marcos Springs, for the baseline scenario, springflow remains above zero during a repeat of drought of record conditions. It falls below 52 cfs (monthly average) for 20 months during a repeat of drought of record conditions. The minimum simulated springflow is two cfs (monthly average). When the VISPO program is superimposed on that baseline, the simulated number of months in which the springflow ceases decreases by 12 months at Comal Springs (i.e., goes from 38 to 26 months). The number of months in which springflow was below 30 cfs (monthly average) improved by 18 months (i.e., went from 54 to 36 months). At San Marcos Springs, the number of months in which springflow falls below 52 cfs (monthly average) is reduced by 6 months (i.e., from 20 to 14 months) during a repeat of the drought of record. The minimum springflow is 16 cfs (monthly average). When the Regional Water Conservation Program is added to the package (baseline + VISPO + Conservation) the number of months during a repeat of drought of record conditions in which springflow at Comal Springs was below zero improved by 5 months for Comal Springs (i.e., goes from 26 to 21 months). The number of months in which springflow was below 30 cfs improved by two months (i.e., went from 36 to 34 months). At San Marcos Springs, springflow below 52 cfs (monthly average) is reduced by two months (i.e., goes from 14 to 12 months) during a repeat of the drought of record. The minimum springflow improves to 19 cfs (monthly average). When the use of the Phase I SAWS ASR is added to the package (baseline + VISPO + Conservation + SAWS ASR), simulated springflow at Comal Springs is always above zero cfs. The minimum springflow is 15 cfs (monthly average). The number of months in which springflow was below 30 cfs improved by 32 months (i.e., went from 34 to 2 months). At San Marcos Springs, with the addition of the Phase I SAWS ASR element to the package, the number of months that springflow falls below 52 cfs (monthly average) is reduced by nine months (i.e., goes from 12 to 3 months) during a repeat of drought of record conditions. The minimum springflow improves to 49 cfs (monthly average). When the Stage V pumping reduction is added to the package (baseline + VISPO + Conservation + SAWS ASR + Stage V), the minimum springflow at Comal Springs is 27 cfs (monthly average). The number of months in which springflow was below 30 cfs remained at two months. 5-45
324 At San Marcos Springs with the addition of the Stage V element to the package, the number of months that springflow falls below 52 cfs (monthly average) is reduced from three to two months during a repeat of the drought of record. The minimum springflow is 51 cfs (monthly average). These results are summarized in Tables 5-5 and 5-6 and Figures 5-4 and 5-5. TABLE 5-5 NUMBER OF OCCURRENCES OF SPRINGFLOW BELOW SELECTED THRESHOLDS ( ) 3 Spring Comal San Marcos Threshold (cfs) Number of Months VISPO + Conservation + SAWS ASR VISPO + Conservation + SAWS ASR + Stage V Baseline VISPO VISPO + Conservation HDR Flow values are monthly average flows. 5-46
325 Jan-47 Jan-48 Jan-49 Jan-50 Jan-51 Jan-52 Jan-53 Jan-54 Jan-55 Jan-56 Jan-57 Jan-58 Jan-59 Jan-60 Springflow (cfs) TABLE 5-6 MONTHLY AVERAGE SPRINGFLOW FOR SELECTED STATISTICS ( ) Spring Comal Statistic Baseline (340K+) VISPO VISPO + Conservation VISPO + Conservation + SAWS ASR VISPO + Conservation + SAWS ASR + Stage V Minimum Month Minimum 6-Month Moving Average Long-Term Average Minimum Month San Marcos Minimum 6-Month Moving Average Long-Term Average Comal Springs VISPO + Conservation + SAWS ASR + Stage V VISPO + Conservation + SAWS ASR VISPO + Conservation VISPO Baseline (340K+) Figure 5-4. Simulated Monthly Average Springflow at Comal Springs ( ) 5-47
326 Jan-47 Jan-48 Jan-49 Jan-50 Jan-51 Jan-52 Jan-53 Jan-54 Jan-55 Jan-56 Jan-57 Jan-58 Jan-59 Jan-60 Springflow (cfs) 300 San Marcos Springs VISPO + Conservation + SAWS ASR + Stage V VISPO + Conservation + SAWS ASR VISPO + Conservation VISPO Baseline (340K+) Figure 5-5. Simulated Monthly Average Springflow at San Marcos Springs ( ) Modeled Springflow with the Phase I Package and the Presumptive Phase II Measure The presumptive action for Phase II of the HCP, should it be determined to be necessary after completion of the strategic AMP, involves the continuation of the Phase I measures including the use of the SAWS ASR with the addition of the WRIP Pipeline that is currently in the design stages and is scheduled for completion by The WRIP will link the existing facilities and new water supplies located at the ASR site in southern Bexar County with the southwestern and western portions of San Antonio. Currently, the 60-inch pipeline from the ASR constrains the ability of the ASR Trade-Off element in the Phase I package to enhance springflow at the worst part of a repeat of a drought of record-like event (i.e., 1955 and 1956). The WRIP pipeline extension will add capacity to the ASR distribution system that will allow more water to be returned from the ASR in a given time period and expand the geographic distribution served by the ASR. Simply removing the existing capacity bottleneck may enable the SAWS ASR Trade Off element to provide the necessary additional springflow to meet the current minimum flow objectives (45 cfs minimum monthly average at Comal Springs and 52 cfs minimum monthly average at San Marcos Springs). If 5-48
327 removing the bottleneck of the ASR, under the operating assumptions set out below, is unable to fully meet the modeled necessary additional springflow to meet the current minimum flow objectives, the balance will be obtained through alterations to the conservation measures outlined in Chapter 5 including an increase in Stage V withdrawal reductions, if necessary. SAWS ability to expand the use of the ASR as a presumptive Phase II measures, if required, assumes that: (1) no additional water will need to be stored; (2) the total amount of water to be returned from the ASR over the term of the permit will not exceed 126,000 ac-ft and 46,300 ac-ft in the worst year; and (3) the maximum annual utilization of the WRIP will be no more than 40 percent of the capacity of the WRIP distribution system at any time. HDR simulated the hydrograph of the flow protection elements in the Phase I Package with the addition of the WRIP Pipeline during a drought of record-like event. Using the current hydrological model, the current minimum flow objective cannot be met at the Comal Springs, with the above-stated assumptions, without additional Stage V cutbacks. Using the three assumptions set out above, to achieve the current minimum flow objective at Comal Springs, an additional 3 percent increase was required in the Stage V withdrawal reductions over that required in Phase I, i.e., the withdrawal cutback in Stage V would be 47 percent rather than 44 percent. Using the three assumptions and an additional three percent Stage V cutback, the minimum monthly average springflow at Comal Springs is 47 cfs. The number of months in which the flows fall below 60 cfs (monthly average) decreases from 73 months under the No Action Baseline to 17 months. (See also Section 4.2.) The minimum monthly average springflow at San Marcos Springs is 52 cfs. This simulated minimum springflow occurs for one month during The required Stage V withdrawal reductions are based on the best available aquifer model existing at this time. Based on this model s known limitations and the biological uncertainties that will be addressed during Phase I, the three percent increase in the Stage V cutback may prove unnecessary to meet the current minimum flow objectives. These results are summarized in Tables 5-7 and 5-8 and Figures 5-6 and
328 Table 5-7. Springflow occurrences below selected thresholds with Phase I and II Measures ( ) Spring Comal San Marcos Springflow Occurrences below Selected Thresholds ( ) Threshold (cfs) Baseline (340K+) VISPO Number of Months VISPO + Conservatio n VISPO + Conservatio n + SAWS ASR VISPO + Conservatio n + SAWS ASR + Stage V
329 Table 5-8. Springflow for selected conditions with Phase I and II Measures ( ) Spring Comal San Marcos Statistic Minimum Month Minimum 6-Month Moving Average Long- Term Average Minimum Month Minimum 6-Month Moving Average Long- Term Average Springflow for Selected Conditions ( ) Units: cfs Baseline (340K+) VISPO VISPO + Conservation VISPO + Conservation + SAWS ASR VISPO + Conservation + SAWS ASR + Stage V
330 Figure 5-6. Simulated monthly average springflow at Comal Springs ( ) with the specified Phase II Presumptive Measure 5-52
331 Figure 5-7. Simulated monthly average springflow at San Marcos Springs ( ) with the specified Phase II Presumptive Measure 5-53
332 5.8.3 The Impacts of Incidental Take Are Minimized and Mitigated to the Maximum Extent Practicable One of the ITP issuance criteria prescribed in 50 C.F.R (b)(2), 50 CFR 17.32(b)(2) and Section 10(a)(2)(B) is that the impacts of the incidental take be minimized and mitigated to the maximum extent practicable. This finding typically requires consideration of two factors: adequacy of the minimization and mitigation program, and whether it is the maximum that can be practically implemented by the applicant. To the extent that the minimization and mitigation program can be demonstrated to provide substantial benefits to the species, less emphasis can be placed on the second factor. (USFWS 1996c) The Minimization and Mitigation Measures Provide Substantial Benefits to the Covered Species As detailed above, the Phase I package of springflow protection measures provides substantial benefit to the Covered Species. (See Section 5.8.1). Under No Action Baseline conditions, Comal Springs is simulated to cease to flow for 38 months during a repeat of drought of record conditions, and the springflows are predicted to be below 30 cfs (monthly average) for 54 months. At San Marcos Springs, in the simulation of a repeat of the drought of record, the minimum flow will be 2 cfs, and springflows will be below 52 cfs (monthly average) for 20 months. By contrast, with the Phase I springflow protection measures, Comal Springs is predicted to have continuous springflow during a repeat of drought of record conditions. Indeed, springflow will only fall below 30 cfs 4 for 2 months, with the simulated minimum monthly average flow during that time of 27 cfs. At San Marcos Springs, springflow will only fall below 52 cfs for two months, with the simulated minimum monthly average flow of 50 cfs. Hardy (2011) found that these springflows will not appreciably reduce the likelihood of survival of these species and recovery during a one time repeat of drought of record conditions during Phase I so long as all recommended measures are implemented to restore and protect the habitat of the Covered Species. Currently available information indicates that the presumptive Phase II measures, if implemented, will provide the necessary additional springflow to meet the currently defined minimum flow objectives necessary to attain the biological goals. (See Section 5.8.2) In addition to protecting springflow, the minimization and mitigation measures will markedly diminish the impacts of recreation during low flows. A major concern regarding Texas wild-rice is recreational activity in high-quality habitat areas of the San Marcos River. The creation of state scientific areas in the spring and river ecosystem will establish a mechanism to exclude recreation from these areas during low flows. Similar state scientific areas will be established in the Comal River to protect restored fountain darter habitat. These measures to address 4 Except where specifically expressed as a daily average flows, the springflows in this section are set out as monthly average springflows. 5-54
333 recreational impacts will be augmented by limiting access points for recreational activities, sediment removal, and educational programs. The gill parasite is a significant stressor of the fountain darter in the Comal ecosystem the effects of which may be exacerbated by low flows. The City of New Braunfels will implement a gill parasite control program to minimize this impact The Applicants will also implement other minimization and mitigation measures to limit the impacts of low flows on the Covered Species and their habitat. These include, but are not limited to, removal of non-native plants and replacing them with native vegetation favored by the Covered Species, maintenance of dissolved oxygen through removal of decaying aquatic vegetation during low flows, and programs to limit the impacts of predation and competition. The Applicants have committed to a wide-range of minimization and mitigation measures, developed using the best available, peer-reviewed science, to reduce and mitigate the impacts from these threats. In addition, the Applicants will also implement measures that will contribute to the recovery of the Covered Species including measures to protect water quality and to restore riparian zones. Further, the Applicants will develop a predictive ecological model and conduct applied research to evaluate potential adverse ecological effects from Covered Activities, fill important data gaps, and put forward alternative conservation approaches or mitigation strategies to better benefit the Covered Species The Minimization and Mitigation Measures Represent Compliance with the Maximum Extent Practicable Requirement The Applicants estimate the costs for implementation of the Phase I package alone will average approximately $17.5 million over the duration of the permit and over $18.6 million over the first seven years of the permit. (See Table 7-1). The costs cannot be measured entirely by money. SAWS will, for example, be sacrificing capacity in its ASR. Smaller municipalities may have to obtain additional water supplies to be able to meet the Stage V Critical Period Management reductions. (See Section ). The costs of the minimization and mitigation measures will be borne primarily by the holders of municipal and industrial permits issued by the EAA to withdraw groundwater from the Aquifer through increased Aquifer Management Fees (AMF). Irrigators will not contribute to funding the costs despite being major users of the Aquifer. (See Section ). Irrigators fees are capped by the EAA Act at $2/acre-foot of water pumped each year and these payments are already consumed in paying for the administrative costs of existing EAA operations. (See EAA Act 1.29(e)). It is estimated that, as a result of the HCP, the AMFs for municipal and industrial pumpers, may increase from the current $39/acre-foot of permitted withdrawals to between $88 to $116/acre-foot of permitted withdrawals. These costs will create greater costs for water users which cannot be easily absorbed throughout the region at this time. During the development of the HCP, the Applicants also considered numerous alternative minimization and mitigation measures (see Section 1.7) designed to ensure springflows during 5-55
334 extended periods of drought. A single strategy that would rely only on restricting pumping at a level that would assure springflows considered protective of the listed species would create serious adverse impacts to human health and safety. Other programs for establishing alternative water supply sources for use in recharge augmentation or displacement of pumping were evaluated. The preliminary cost estimates associated with these programs were considered to be impractical due to costs ranging into the many hundreds of millions of dollars and potential regulatory, technical, or political impediments to their implementation. Based on the predicted effectiveness of the springflow protection measures and other conservation measures, the substantial financial commitment required of municipal and industrial pumpers, and the excessive cost of alternate approaches identified, the Applicants believe that minimization and mitigation measures in this HCP satisfy the maximum extent practicable requirement for issuance of the ITP. 5.9 EAA s Authority to Implement Measures to Maintain Springflow Prior to the Complete Implementation of the Phase I Package The Plan Area at the time of the preparation of this HCP is experiencing drought conditions. While the Applicants at this time are unable to identify the exact nature, extent, or severity of the drought conditions, the potential exists that on the effective date of the Permit (in the event the Service approves the ITP application), the Plan Area will be in drought conditions of sufficient magnitude that immediate actions are required prior to the time that the Applicants are able to fully implement the minimization and mitigation measures described in Chapter 5. If so, EAA has the authority to take appropriate actions to protect the Covered Species while the Applicants are taking steps to fully implement their respective minimization and minimization measures under Chapter 5. The EAA is a conservation and reclamation district created pursuant to Article XVI, Section 59 of the Texas Constitution. As such, the EAA is a political subdivision which has those powers expressly granted by statute and those necessarily implied as incident to its express powers. The EAA Act grants express power to the Authority to take action to protect the Covered Species and their habitat outside of the context of the HCP. Section 1.14(h) of the EAA Act provides that the EAA through a program, shall implement and enforce water management practices, procedures, and methods to ensure that, not later than December 31, 2012, the continuous minimum springflows of the Comal Springs and the San Marcos Springs are maintained to protect endangered and threatened species to the extent required by federal law and to achieve other purposes provided by Subsection (a) of this section.... The relevant parts of subsections (a)(6) and (7) of Section 1.14 provide that the EAA is to, among other things, protect aquatic and wildlife habitat, and listed threatened or endangered species. In support of this broad authority to protect species, Section 1.115(e) of the EAA Regulations provides that the Board of Directors of the EAA may adopt emergency rules in anticipation of imminent harm to human health, safety, or welfare, or if compliance with [normal rulemaking] procedures... would prevent an effective response to emergency aquifer or springflow 5-56
335 conditions. Emergency rules may be adopted after five days notice and are effective immediately on adoption for a period of 120 days and may be renewed once for not more than 60 days. Thus, EAA has broad authority and an independent state-law based mandate to take actions necessary to protect the Covered Species in the event the Plan Area is in severe drought on the effective date of the Permit and in advance of the ability of the Applicants to fully implement their respective minimization and mitigation measures. The scope and nature of any such measures would depend on the extent and severity of the drought conditions and their potential impact on the Covered Species. 5-57
336 This page intentionally left blank 5-58
337 Chapter 6 Adaptive Management 6.1 Adaptive Management Process The adaptive management process (AMP) is designed to enhance the effectiveness of the HCP by addressing uncertainty in the conservation of a species by an HCP. 65 FR 35,242, 35,252 (June 1, 2000). The AMP proactively addresses the level of uncertainty that often exists in the management of natural resources through a process of experimentation and verification. Specifically, the AMP envisioned in the HCP is a process for examining alternative strategies for meeting the biological goals and objectives, and then, if necessary adjusting the minimization and mitigation measures in Chapter 5 according to what has been learned through the AMP. USFWS 5-Point Policy regarding HCPs addresses five issues: (1) biological goals and objectives; (2) adaptive management; (3) monitoring; (4) permit duration; and (5) public participation. (Id. at 32, ) The AMP described in this chapter covers the elements of adaptive management in USFWS 5-Point Policy: (1) upfront identification of the uncertainty for a particular species, biological goal or objective, or efficacy of a minimization or mitigation measure; (2) the identification and incorporation of a possible range of alternatives for addressing the uncertainty; (3) implementation of a monitoring program to evaluate the probable success of the alternatives; and (4) providing for an interactive decision-making process based on the results of the monitoring program from which changes or adjustments should be made, if necessary, to the existing minimization and mitigation measures that are initially implemented. (65 FR at 35,252). It is not the intent of the Applicants that the AMP should substitute for the implementation of minimization and mitigation measures reasonably expected to meet the long-term biological goals and objectives in Section 4.1 of the HCP, or to delay addressing difficult or intractable issues. On the contrary, the minimization and mitigation measures have undergone considerable scrutiny and evaluation. The measures will, based on the best scientific evidence available at the time of the issuance of the ITP, result in minimization and mitigation of impacts of the incidental take stemming from the Covered Activities to the maximum extent practicable, and will appreciably increase the likelihood of the survival and recovery of the Covered Species in the wild. The details of the AMP for the HCP and its governance are found in Article Seven of the Funding and Management Agreement (FMA) that is attached hereto and incorporated herein for all purposes at Attachment R. 6.2 Monitoring The Applicants and the USFWS will develop and oversee a monitoring program designed to identify and assess potential impacts from Covered Activities while also providing a better understanding and knowledge of desirable water quality- and springflow-related habitat 6-1
338 requirements of the Covered Species inhabiting the Comal and San Marcos Springs/River ecosystems as well as the species life cycles. The monitoring program will provide information for the USFWS and the Applicants to: (1) evaluate compliance with the HCP; (2) determine if progress is being made toward meeting the long-term biological goals and objectives; and (3) provide scientific data and feedback information for the AMP. The Applicants, through the AMP, will continually evaluate the data collected through the monitoring program, the results of the research and modeling, and other information as appropriate. The monitoring program will include, but will not be limited to, the hydrological data collection program by EAA, including water quality monitoring (see, e.g., EAA 2010(b)), the biological sampling program conducted by EAA as described in Section 6.3.1, the recharge monitoring data collected by EAA as described in Section 6.2.3, and the expanded water quality monitoring program monitoring that will be conducted by EAA as described in Section The results of these programs as well as information on the implementation of the minimization and mitigation measures will be included in the annual reports to allow the USFWS to fulfill its responsibility to monitor the implementation and success of the HCP, including the adaptive management commitments Compliance Monitoring The purpose of compliance monitoring is to provide a public record accessible to all participants, the public, and the USFWS demonstrating the Applicants compliance with the terms and conditions of the ITP, HCP, and IA. The compliance monitoring process for the HCP will consist of the preparation and submittal of annual reports by the Applicants, as described in Chapter 9 below, to the USFWS for review and comment. This information, along with compliance with TCEQ Texas Pollution Discharge Elimination System (TPDES) dry weather field screening program data, BMP treatment capabilities, and compliance with the Texas Surface Water Quality Standards (TSWQS) will help support adaptive management decisions and if applicable, will be included in the Annual Report. The intent of the compliance monitoring is to ensure that the HCP is fully functioning during the term of the ITP, as well as to provide a focus for minor modifications and adjustments to better meet the goals and objectives of the ITP. In addition, the Phase I reports will provide a means to document the progress of the Adaptive Decision Making Process during the several years prior to the end of Phase I and in anticipation of the transition to Phase II Effects and Effectiveness Monitoring Effects and Effectiveness Monitoring will evaluate the success of the HCP in meeting its stated biological goals and objectives. The Applicants will design and implement targeted studies to evaluate, at a minimum, each of the hypotheses set out in Section below. 6-2
339 6.2.3 Recharge Monitoring The EAA will accurately measure the amount of water (in ac-ft) recharging the Edwards Aquifer in the area described in Section 1.2 of this Plan. EAA will publish this measurement not later than June 1 st of each year for the purposes of guiding the activities in Section EAA will then maintain this information on an ongoing basis in an appropriate publication Monitoring Reports The Applicants will prepare and submit a Monitoring Report to be included as part of the Annual Report to be submitted to the USFWS. (See Section 9.3). The first Monitoring Report will be submitted for inclusion in the 2013 Annual Report to be submitted to USFWS at the end of the first quarter of Adaptive Management Research and Modeling for the Phase I Adjustments and Phase II Strategic Adaptive Management Decisions Pursuant to the AMP, the Applicants will ensure that research and modeling efforts sufficient to support and inform the Phase II Adaptive Management Decisions are complete and all relevant data are compiled no later than December 31, Details of the research and modeling are presented below Biological Monitoring A comprehensive biological monitoring plan (Variable Flow Study) was established by the EAA in 2000 to gather baseline and critical period data to fill important gaps in the ecological condition of the Comal and San Marcos springs and river ecosystems. The EAA will continue this comprehensive sampling plan for the term of the ITP (with modifications as identified through the AMP process) and will provide a means of monitoring changes to habitat availability and the population abundance of the Covered Species that may result from Covered Activities. This comprehensive monitoring plan will continue to accumulate baseline data for refinement of estimates of average community conditions. The monitoring will also increase in magnitude, including increased frequency and number of parameters examined, as discharge falls to specific levels. Additional monitoring during low-flow periods will enhance perceptibility of critical changes in important habitat parameters, new and existing threats, and water quality tolerance thresholds. The discharge trigger levels for additional monitoring and other management responses were chosen based on available data that suggest that significant changes in population dynamics or habitat availability may occur when discharge falls to, or below, these values. These trigger levels may be refined as additional data are gathered and ecological modeling is conducted through the AMP. In addition to long-term monitoring efforts that increase in intensity in response to the specified trigger events, a critical period monitoring component is incorporated into the Variable Flow 6-3
340 Study that initiates full-scale sample efforts at specified trigger levels. Over the past decade, only a handful of critical period events have triggered additional sampling. As part of the longterm monitoring component of this HCP, the critical period monitoring component of the Variable Flow Study will be maintained until sufficient documentation of low-flow events has been completed. It is this monitoring strategy that will be integrated into the long-term comprehensive monitoring to help refine critical monitoring trigger levels and appropriate management responses. Data gathered during this full-scale effort will also provide information on potential impacts of the sampling methodology on reduced habitat and potentially reduced populations. The scope of the Variable Flow Study currently can be modified on a yearly basis as provided in the FMA with agreement by the USFWS. The current Variable Flow Study has the following monitoring components: Aquatic vegetation mapping for select reaches; Fountain darter sampling (drop nets, dip nets, visual); San Marcos salamander sampling (SCUBA and snorkel); Texas wild-rice physical observations and annual mapping; Comal Springs riffle beetle monitoring; Comal invertebrate sampling (drift net sampling over spring orifices); Comal Springs salamander sampling; Parasite evaluations concerning the fountain darter; and Ramshorn and other exotic snail monitoring. Components to be incorporated into the Variable Flow Study upon permit issuance will include sampling for two additional non-listed species, the Edwards Aquifer diving beetle, and Texas troglobitic water slater. Additionally, monitoring of the type and quantity of nutrients (e.g., dissolved carbon) in the spring water will assist in determining the effects of variable flow on aquifer species. The study components, as currently designed and as refined through the AMP, will provide information to effectively determine whether the conservation measures are achieving the biological goals and objectives set forth in the HCP. A more detailed description of the sampling methodologies, frequencies, and sample locations is found in the Variable Flow Study Annual Reports. (See, e.g., BIO-WEST 2010a, b) Groundwater Modeling Computer groundwater models are mathematical representations of complex physical environments. The groundwater model for the Aquifer used by the EAA, at the time this HCP was written, was created by the United States Geological Survey (USGS) between 2000 and 6-4
341 2004. This model uses a finite difference computer code called MODFLOW, a software program created by the USGS. The MODFLOW model was used during the EARIP process to provide the model results for assessing the efficacy of the minimization and mitigation measures identified in Chapter 5 of the HCP. Like all groundwater models, the MODFLOW model has limitations and data gaps that manifest uncertainty in model results. By December 31, 2014, the EAA will take appropriate steps to reduce the level of uncertainty in the MODFLOW model by filling in the data gaps to the extent practicable and by reducing the number of structural limitations in the model. As part of the adaptive management commitment, the EAA will create another model to reduce uncertainty in the model results for use during the AMP and to provide assurance/confirmation that modeling results for the Aquifer and springflows are more reliable and defensible. This additional groundwater model is expected to be a finite element model. This additional model will be developed and ready for use by December 31, The new model development process will run concurrently with the EAA s effort to improve the existing MODFLOW model Ecological Modeling The EAA will oversee and retain a contractor to develop a predictive ecological model to evaluate potential adverse ecological effects from Covered Activities and to the extent that such effects are determined to occur, to quantify their magnitude. The model results will help the Applicants develop alternative approaches or possible mitigation strategies, if necessary. Ecological models are numeric or computer-based abstractions of ecological systems, and as such, they are simplifications of real-world processes and interactions. The complexity of ecological models varies from the relatively simple, such as some numeric models, to extremely complex, such as dynamic simulation models. Ecological models are used for a wide variety of purposes, including: (1) to better understand ecological relationships, processes, and interactions of the systems being studied; (2) project ecological responses over time; and (3) predict ecological responses to changes in environmental conditions. A predictive ecological model can project ecological responses to levels of environmental stressors beyond what are likely to be encountered during Phase I of the HCP. Therefore, the model will provide the ability to investigate potential impacts to these ecosystems from extreme short-term and sustained long-term impacts from natural and anthropogenic factors, including local and regional groundwater withdrawals. The two primary purposes for including a predictive ecological model in the AMP are to identify and describe ecological responses and to predict and quantify impacts. Three objectives are associated with each of the two purposes. Identify and describe specific ecological responses: to predict specific ecological responses of the Comal and San Marcos Springs/River ecosystems and associated Covered Species to various environmental factors, both natural and anthropogenic; 6-5
342 to assist in establishing potential threshold levels for these ecosystems and associated species relative to potential environmental stressors; and to assist the overall scientific effort to better understand the interrelationships among the various ecological factors affecting the dynamics of these ecosystems and associated species. Quantify, predict, and project impacts: to assist in identifying and quantifying the effects of various environmental factors, including groundwater withdrawal, recreation, parasitism, restoration, etc. on ecological changes in these ecosystems and associated species; to project long-term effects of the Covered Activities on these ecosystems and associated species to facilitate designation of Phase II biological goals and strategies for achievement; and to assist in mitigation design, implementation, and monitoring, where applicable. There are three broad categories of predictive ecological models, with numerous variations of each. These three categories are: (1) statistical models, (2) state-and-transition models, and (3) mechanistic simulation models. Each category has advantages and disadvantages associated with their use. For the HCP, a mechanistic simulation model will be used as it best simulates how the ecological systems actually function (examples include Daly et al. 2000, Childress et al. 2002, Mata-Gonzalez et al. 2008). Most mechanistic simulation models are at least moderately-complex models, and some are extremely complex. The most sophisticated of the mechanistic simulation ecosystem models simulate a wide variety of ecological processes including hydrology, aquatic plant growth, aquatic species population dynamics, sedimentation, recreation, and climatic fluctuations, along with their interactions, at spatial scales ranging from small (less than 1 m 2 ) to entire landscapes. For the HCP, dynamics would be simulated on the species-level for the Comal and San Marcos aquatic systems, and for time steps ranging from hours or days to decades. One major advantage of mechanistic simulation models is that complex ecological interactions can be simulated without a priori assumptions being made about the outcomes of these interactions. The other advantages include their ability to: (1) simulate complex ecological interactions; (2) test complex ecological hypotheses; (3) test potential impacts of changes in environmental conditions over time; (4) test potential effects of extreme values of various environmental factors; and (5) investigate the existence of, and help quantify, threshold values for various ecological variables and systems. To accomplish the objectives stated above, the following criteria should be met by the predictive ecological model. The model should be a mechanistic ecological simulation model. 6-6
343 The model should be capable of simulating the dynamics of both terrestrial and aquatic ecosystems, at the appropriate time scales, and integrate both types of ecosystems on a landscape-scale where appropriate. The model should be capable of including plant, animal, hydrological, climatic, and management variables, and simulating interactions among all of these components. The model should be capable of simulations on spatial scales ranging from 1 m 2 to the entire Edwards Aquifer region. The model should be capable of being linked to the groundwater model(s), so that simulations can be conducted for integrated surface and groundwater systems. The model should be sufficiently flexible that changes in algorithms can be made as needed, based on new data and improved understanding of the ecological dynamics of the Comal and San Marcos ecosystems. Revisions to the parameter values used in the model data base should be possible in a user-friendly manner such that routine upgrades to this data base can be made as additional site-specific data become available. The model should be capable of being run on commercially available PC hardware and using commercially available software operating systems. The model should have a history of producing accurate (80-90 percent) simulations of ecological dynamics in groundwater-influenced ecosystems, as demonstrated by field validation studies. The model should have user-friendly interfaces such that it can be used by a range of experienced personnel, upon completion of some degree of specific training on the use of the model Applied Research Facility Experimental Channel at the USFWS National Fish Hatchery and Technology Center Description of the Applied Research Facility As discussed throughout this HCP, applied research coupled with ecological modeling is a valuable component of the Phase I package. During Phase I, applied research will be conducted to better understand the ecological dynamics of the Comal system, particularly under low flow conditions. Initially, an on-site research channel at Landa Park in the Comal system for conducting these experiments was considered to limit costs and maximize effectiveness. BIO- WEST (2011c). However, an appropriate site could not be obtained in the Comal ecosystem. Accordingly, an applied research experimental facility will be constructed at the USFWS National Fish Hatchery and Technology Center (NFHTC) in San Marcos, Texas. The NFHTC has the existing infrastructure (Aquifer exempt wells, ponds, containment areas, recirculation and reuse capabilities, etc.) to allow for construction and operation of an applied research 6-7
344 facility to inform Phase II decisions regarding the Covered Species and, to the extent possible, adjustments to conservation Measures during Phase I. Although termed applied research facility, the conceptual design is a series of man-made channels with earthen substrate intertwined with the existing ponds available at the NFHTC. This will allow water use and reuse through the plumbing already in place while allowing the flexibility to pump water through several research channels for experimentation. To recreate the natural environment to the extent possible, considerable effort will be needed to simulate channel configuration, substrate, instream debris, riparian zone structure (trees, shrubs, grass), aquatic vegetation, and other natural and anthropogenic conditions present in the Comal River. These components will be carefully designed and constructed to provide the most authentic simulation practicable. A riffle beetle upwelling and spring run area (similar to that proposed in BIO-WEST 2011c) will be created at the headwaters of two of the research channels. The EAA will support and coordinate the NFHTC s construction and maintenance of the Applied Research Center. EAA will contract for the research activities in the Applied Research Center identified in this Section or developed as part of the AMP. The Program Manager will coordinate, supervise and oversee the implementation of all such research Research in the Experimental Channels The main focus of the research channels will be to evaluate the effects of low-flow on Covered Species and their habitat. This evaluation will include springflow conditions that bracket the range of 5 cfs to 100 cfs. Considering the Phase I schedule and the need to first get this facility designed, permitted, and constructed, it is likely that only five years will be available for Phase I experimentation. As such, key questions will need to be addressed during this time period, which will require a strict schedule and intense focus. The applied research at the NFHTC facility for Phase I will focus on the fountain darter relative to Comal (although research should be transferable to the San Marcos system) and the Comal Spring riffle beetle, as these are the two species with the greatest potential for impact relative to the Phase I package. This applied research will be further divided into three tiers. Tier A will focus on habitat requirements and responses; Tier B will focus on low-flow impacts directly on the fountain darter and Comal Springs riffle beetle; and Tier C will investigate the implications of the timing, frequency, and duration of multiple events in varying sequences and include specific research efforts designed to assess ecological model predictions (e.g., model validation). The experimental design for the research will be prepared prior to the initiation of the reseach. The experimental design for the research will receive input from the Science Committee prior to its initiation and on issues that arise during the conduct of the reasrch. (FMA Section ), Tier A Fountain Darter Habitat and Food Supply Low-flow effects on native aquatic vegetation A key unknown is the tolerance of native aquatic vegetation to reduced flow conditions in these systems. The timing and duration of these low-flow events will be studied relative to the native vegetation, starting with the plant species identified in the long-term biological goals for the 6-8
345 fountain darter. Decay of the above ground and below ground biomass will be measured over time. Above ground biomass is important for Covered Species habitat while below ground biomass is critical for root establishment and holding the plant in place during any subsequent pulse event. Water quality will be continuously measured to evaluate the before, during, and after effects of vegetation decay on water temperature, dissolved oxygen, carbon dioxide, and ph. Additional water quality parameters such as nutrients may also be studied. In addition to studying the effect of vegetation decline, decay and ultimately death, studies will be designed to evaluate recovery of native vegetation following various stages of aquatic vegetation decline and decay. Low-flow effects on macroinvertebrates (fountain darter food source) Another critical component of fountain darter habitat that is presently unknown is the relationship of macroinvertebrates (fountain darter s main food source) to low-flow conditions. Studies will be designed to evaluate the simulated effects of changing water quality conditions and aquatic vegetation composition on the macroinvertebrate (mainly amphipods) community. It may be that the amphipods are affected much earlier than actual vegetation decline or decay which would mean impacts to the darter from reduced food supply could potentially occur prior to even vegetation decline. Conversely, it may be that decomposing vegetation provides ample habitat for macroinvertebrates to the point of near vegetation death and as such the food source would not be the limiting factor to the fountain darter during periods of extremely low flow. Similar to the aquatic vegetation study, not only will simulated impacts be assessed during extended periods of simulated low flow, but recovery following these periods will be studied to learn response time (amphipod recovery) following a severe event. Tier A Comal Springs Riffle Beetle Habitat Associations and Movement Effects of flow levels on Comal Springs riffle beetle movement Upon completion of the artificial upwelling and spring run habitat within the created channel, Comal Springs riffle beetles will be collected from the wild and introduced into the artificial habitats. The first step will be to assess the survival success of adults. Once an adult population is established, flow manipulations will be performed to study the affinity of riffle beetles to flow and to track movement from surface to subsurface habitats and vice versa. The immediate goal is not to establish a reproducing riffle beetle population but to evaluate movement patterns of riffle beetles during periods of varying springflow. This study will be complicated by uncertainties in the ability to replicate food sources for the riffle beetle similar to what is experienced in the wild, so considerable trial and error is likely. Extended Low-flow period effects on Comal Springs riffle beetles Once a population is established in the experimental habitat, extended periods of low-flow will be tested to evaluate the effect of these periods on riffle beetle survival and habitat use. Surface habitat will be completely removed for extended periods of time, water quality will be altered to simulate extreme conditions, and other factors adjusted (e.g., reductions in leaf material or detritus, etc.) to simulate conditions that might be experienced in the wild during 6-9
346 these conditions. As with other proposed Tier A efforts, recovery following impacts will also be investigated. Test spring run connectivity Once a population is established and the above two Tier A riffle beetle studies performed, the concept of spring run connectivity will be tested. This will involve simulating subsurface habitat cutoff from surface habitat and riparian detritus, and subsurface habitats that are connected to surface habitats via the trickling of water across the surface habitat. This is a key study to assess the value of this concept as an additional protection measure in Spring Run 3 of the Comal system as discussed in BIO-WEST (2011). Tier B Direct Impacts to Covered Species Low-flow effects on fountain darter movement, survival, and reproduction A series of low-flow experiments with various timing and durations will be evaluated while examining direct impacts to fountain darters. A whole host of questions can be addressed under this topic with just a few examples including: when and where do darters move as vegetation decays and water quality deteriorates; when does reproduction stop or does it; does compensatory reproduction get triggered, and if so, when and what causes it; and what is the effect of predation on fountain darter population size? Since the fountain darter is a visual predator, and turbidity from stormwater run-off and recreational activities both increase turbidity, behavioral impacts of the fountain darter under different turbidity levels will also be examined in relation to feeding success. An endless number of scenarios are available to discuss under this heading which highlights the importance of a focused study design and schedule. Low-flow effects on Comal Springs riffle beetle survival and reproduction A series of low-flow experiments with various timing and durations will be evaluated while examining direct impacts to Comal Springs riffle beetles. A core question is: when are reproduction and survival compromised as physical habitat (surface and subsurface) declines and water quality deteriorates? The reproduction component assumes that a reproducing population can be established in the study habitat during Phase I. If a reproducing population is successfully established, this flow manipulation research could be expanded to include evaluation of desirable and threshold environmental conditions for larval and pupae stages. Tier C Testing repeat occurrences of low-flow or combination of effects. System Memory 6-10
347 Upon completion of Tier A and B studies certain components and parameters will likely show impacts and some will not. Tier C is designed to take those components or parameters that do show impacts at varying springflow levels and to evaluate potential additive effects of repeat occurrences. As with all other studies, careful study design will be needed to maximize the efficiency of any system memory studies. Ecological Model Validation Existing information and data gathered during Tiers A and B applied research and through continued ecological monitoring and on-site studies will be entered into the ecological models developed for these ecosystems. Towards the end of Phase I, specific studies will be designed and conducted to test the validity of ecological model results. This may involve simple or complex parameters and single or multiple low-flow events depending on Phase II questions that may be relevant at that time. Regardless of what Tier is involved, to be useful, studies will need to be designed to achieve an endpoint that can provide input to the ecological model or directly answer specific questions for the Phase II decision-making process or refinement of Phase I measures Additional Studies Additional physical habitat activities/studies will be performed in the field. The following activities will be conducted within the Comal and San Marcos systems as part of the implementation of minimization and mitigation measures. Although not specifically covered under Applied Research at the NFHTC these activities have the potential to directly influence study design at the applied research facility and, thus, are included to close this section. Aquatic Vegetation Restoration and non-native plant removal Evaluate transplant methodologies for various types of native aquatic vegetation Evaluate success of transplants over extended time period Evaluate methodologies for removal of non-native plants Track maintenance required to keep non-native species from re-establishing Old Channel ERPA Evaluate the need for channel manipulation for the enhancement of fountain darter habitat in the Old Channel. (Section ). Other biological interaction studies such as an evaluation of non-native animal species interactions with the fountain darter or gill parasite/snails/fountain darter interactions cannot be conducted at the NFHTC and thus will also be tied directly to on-site activities associated with those HCP conservation measures. 6-11
348 6.3.5 Texas Wild-Rice Enhancement As discussed in Sections and 5.4.1, restoration and enhancement of Texas wild-rice will be conducted during Phase I of the HCP. Initially, these activities will involve an applied research component. Methods for Texas wild-rice enhancement will need to be investigated to understand the potential for increased areal coverage of Texas wild-rice through implementation of this measure. Non-native vegetation mixed in with Texas wild-rice or surrounding existing Texas wild-rice plants but still located within optimal habitat areas will be removed to see if areal coverage of Texas wild-rice will expand in those areas. The specific areas chosen for evaluation will include only areas that would be suitable over the full range of discharges between the long term average and Phase I minimum flows. Once proven successful or not, this information can be beneficial for the Strategic Adaptive Management Decisions Monitoring and Reduction of Gill Parasites A major concern in the Comal Springs ecosystem is the continued presence of an Asian trematode, Centrocestus formosanus. This parasite was first discovered on fountain darters in the Comal River during October The parasite attaches to the fish s gill filaments causing extensive gill tissue proliferation and damage (Mitchell et al. 2000) with mortality in the wild being reported following the discovery in 1996 (Tom Brandt, USFWS, personal communication). A non-native snail, Melanoides tuberculatus, that has been in central Texas since 1964 (Mitchell et al. 2005) has been confirmed as its central Texas first intermediate host (Mitchell et al. 2000). Parasite monitoring via examination of presence on fountain darter gills to determine C. formosanus levels in the Comal River has been ongoing since the late 1990s by the USFWS, Texas State University, and BIO-WEST (EAA Variable Flow Study). Through the EAA Variable Flow Study monitoring, the USFWS NFHTC sampled three sites in the Comal River during two sampling periods; first during , and again during Two of the sites were located in the Upper Spring Run reach, and the third site was located downstream of Landa Lake in the Old Channel of the river. A significant decline in cercarial density was observed between the first and second sampling periods. Abiotic factors, such as total stream discharge and wading discharge, did not change significantly (p>0.05) 1 between sampling periods. Abiotic factors do not adequately explain the observed long-term decline in cercarial density (Johnson et al. 2011). Johnson et al. (2011) speculates that observed decline over time is likely a reflection of the typical pattern followed by most invasive species as they gradually become integrated into the local community following an initial explosive growth in population. Johnson et al. (2011) concluded that although cercarial densities may be abating, fountain darters in the Comal River are still threatened by the parasite, and conservation efforts will focus on reducing levels of infection pressure from the parasite whenever possible. 1 Statistical level of significance. 6-12
349 Informal observations suggest that the density of C. formosanus cercariae in the water column increases as stream discharge decreases and vice versa (T. Brandt, USFWS, personal communication), but there has been little definitive proof of this. If this relationship does exist between C. formosanus cercariae and discharge in the Comal River, there are concerns that increased levels of infection pressure would exacerbate the other stresses of low-flow periods on the fountain darter. Elimination of the parasite from the river probably cannot be accomplished. However, a possible practical approach to managing the parasite in the Comal River might be to control the parasite s snail host, M. tuberculata. USFWS and U.S. Environmental Protection Agency (EPA) authorizations to use chemicals known to be lethal to the snail likely cannot be obtained for the Comal River. Therefore, alternative methods need to be explored for decreasing abundances of M. tuberculata and the associated parasite. In 2010, the EARIP funded a study ( USFWS NFHTC and BIO-WEST 2011) to determine the effectiveness of M. tuberculata removal by physical methods on lowering drifting gill parasite numbers in the Comal River. The results from the study support the hypothesis that removing M. tuberculata from the Comal River correlates with a decrease in C. formosanus in the water column. These results support M. tuberculata control as an important HCP measure. However, there are several management and research questions still unanswered that may play a role in snail/parasite control and the relationship between the snails and the cercariae they release. The following activities to address these uncertainties will be conducted. The initial activity will be the evaluation of alternative methods for snail removal so that removal can be accomplished in the most effective, yet least destructive manner. The second activity deals with understanding the magnitude of snail removal necessary to affect downstream cercaria concentrations in the water column. Once the magnitude of snail removal for effective control of water column cercaria is identified, a study is necessary to evaluate the long-term benefits of that removal. For instance, it is important to understand if the snails repopulate the area within a short period of time and cercaria concentrations quickly return to near original levels, or if both snail populations and cercaria counts stay suppressed for an extended period of time. Additionally, although cercarial densities may be abating in the Comal system (Johnson et al. 2011), C. formosanus still poses a threat to fountain darters in the Comal River, especially during low-flows. As such, continued monitoring is essential and the following activities are included within this HCP conservation measure: A system-wide survey of snail population density and cercarial concentrations will be conducted to provide a baseline condition; Based on that system-wide survey, a decision will be made following the process set out in the AMP Agreement as to whether an initial system-wide removal effort is necessary, and if so, how to facilitate the performance of that effort; Based on the system-wide survey, a gill parasite monitoring program will be designed and implemented. Cercarial concentrations will be monitored in multiple areas along the Comal River on at least a semi-annual basis, and more frequently when spring flow drops initially 6-13
350 below 150 cfs or other springflow triggers that are developed. Corresponding fountain darter sampling to examine correlations between cercariae densities and fountain darter impacts in the wild will also be part of that monitoring effort. 6.4 Core Adaptive Management Actions This section outlines the AMP actions to protect habitat and populations of Covered Species in both the Comal and San Marcos Springs/River ecosystems in the event of limited recharge Risk Assessment, Estimation of Take, and Drought of Record Because biological data typically has great variability and there are many habitat and population parameters that potentially affect the population dynamics of a species, it is very difficult to assess the threat of extirpation. In any natural setting, the unpredictability of the effects of an individual event (e.g., extended low flow period) are often highly correlated with conditions immediately prior to the event complicating development of target conditions necessary to maintain habitat. For the AMP outlined here, a range of parameters is used to assess biological risks associated with deviating from the objectives set forth in Chapter 4 above for the individual species. Although protection of springflows to minimize the level of take is incorporated into the Phase I package, it is possible that conditions may reach or exceed the level of take during a repeat of conditions similar to those in the drought of record. This plan provides a framework for addressing such conditions, if they should occur, by providing measures to mitigate effects of such droughts on the species. The Phase I package should limit the time at and magnitude of impacts, but in the event that discharge falls to these levels, additional measures need to be in place to monitor changes closely and further protect habitat and the Covered Species. The AMP proposes a conservative approach that incorporates regular biological monitoring before and after and frequent monitoring during such events. It is important to accurately define dynamic ecosystem conditions prior to the onset of a limited recharge period to assess potential threats during an extended period under those conditions. Biological monitoring during a period of declining spring discharge will permit a close examination of actual population and habitat conditions when flow declines to or below modeled levels of concern. This approach differs from the traditional one of establishing one fixed number for total discharge below which the species is at risk and above which it is not. Instead, fixed numbers of total discharge are used to trigger additional sampling and used in conjunction with those sampling results to more accurately define biological risk and population changes. Fixed sampling outcomes coupled with fixed discharge levels elicit specific management responses. This is a more dynamic process that takes into account actual conditions rather than predetermined hypotheses of what conditions might be expected at certain discharge levels based on limited data. It is also anticipated that the ecological modeling discussed above will prove instrumental in projecting potential impacts allowing for informed and timely management decisions. 6-14
351 6.4.2 Plan Outline This Section outlines key parameters that are important to each species and provides the critical values that will elicit management responses. These responses include increased vigilance of ecosystem conditions (more frequent sampling) and increased levels of habitat restoration and enhancement measures (native vegetation restoration, ERPA, Texas wild-rice enhancement, etc.) targeted at maintaining populations and habitat in the wild. Finally, although not anticipated, nor projected, for the Phase I package, salvage efforts and off-site refugia are included as a safety net should conditions deteriorate beyond what is expected calling into question the likelihood of continued species existence in the wild. The adaptive management response triggers and biological relevance that are incorporated into the response for each action were based on existing biological data. Absent specific low flow data which will be collected as indicated (Critical Period monitoring or applied research), the critical values indicated below should be sufficient to support viable populations of Covered Species and their habitats. One of the adaptive management response options for Covered Species is off-site refugia. Although the Phase I package and adaptive management responses are designed to maintain conditions that allow populations of Covered Species to persist in the wild through periods of limited recharge that may be reasonably expected during Phase I of the HCP, there remains the slight possibility that salvage efforts (off-site refugia) will be necessary. The initiation for such efforts differs by species; an outline is provided below for conditions necessary to resort to this step for each respective species. The ERPA presents an option for protecting the fountain darter and other Covered Species in the wild during periods of low springflow. Preliminary study (BIO-WEST 2011) has documented the feasibility of such actions in the protection of the fountain darter in the wild. In the Comal system, native aquatic vegetation restoration and habitat protection (via flow-split management and high flow deflection) in the Old Channel will be relied on as one tool for protecting fountain darters during periods of decreasing low flows Comal Springs/River Ecosystem Adaptive Management Activities Fountain Darter The proposed Adaptive Management objectives and trigger levels for initiation of management responses for the fountain darter in the Comal Springs/River ecosystem are: Adaptive Management Objectives Maintain adequate springflow and manage other factors to meet the following conditions: - Minimize extent of range and time that water temperature is >25 C; 6-15
352 - Maintain >75 percent of mean abundance 2 of aquatic vegetation in prime habitat; and - Maintain >25 percent of mean abundance of aquatic vegetation in marginal habitat; - Maintain adequate (within historical range) water quality. Determine potential effect of parasite(s) and other non-native species, and if impacts are evident, minimize those impacts); and Determine potential impact of predation and competition during lower flows, and, if present during lower flows, minimize those impacts. Triggered Monitoring As a consequence of discharge dropping to the springflow level of concern (150 cfs) in the Comal River, the following specific monitoring activities will occur every other month until discharge falls to 80 cfs or increases to above 150 cfs. Aquatic vegetation mapping Four sites established by Variable Flow Study to include Upper Spring Run reach, Landa Lake, Old Channel reach, and New Channel reach; and. Dip net sampling/visual parasite evaluations Presence/absence surveys to be conducted at 50 sites in high quality habitat (Upper Spring Run reach (5), Landa Lake (20), Old Channel reach (20), and New Channel reach (5). If discharge continues to decline and falls to 60 cfs or lower, increased risk may be observed. Under these conditions, the same sampling procedures discussed above will be conducted but more frequently (monthly for aquatic vegetation mapping and weekly for dip netting). Old Channel ERPA The two minimization and mitigation measures specifically associated with the Old Channel ERPA for the fountain darter in the Comal River are native aquatic vegetation restoration and flow-split management. Flow split management is proposed for all conditions but with special emphasis when flows fall below 150 cfs. Native aquatic vegetation restoration and maintenance is proposed to be in place under all conditions. The objective of the Old Channel ERPA is to maintain water temperatures and high quality fountain darter habitat in the Old Channel at a level suitable for darter reproduction (in the spring) and larval and adult darter survival during the remaining portion of the year. 2 Based on existing 10 years of Variable Flow Study data (will be updated by future sampling events where total discharge >150 cfs in the Comal River). 6-16
353 Off-site Refugia The habitat triggers for off-site refugia are not solely dependent on discharge. Off-site refugia efforts could be triggered as high as 60 cfs or not at all, if habitat and population abundances are maintained above trigger levels. Two variables will be considered in concert with total discharge in the Comal River to assess the need to initiate refugia efforts for fountain darter populations: availability of sufficient habitat (aquatic vegetation), and presence/absence of darters throughout the known range. The total amount of aquatic vegetation under such conditions will be compared to mean aquatic vegetation coverage during favorable conditions (determined from all past and future Variable Flow Study samples at or above 150 cfs, but excluding samples initiated specifically to study high flow events ). Data collected outside of favorable conditions (below 150 cfs or after high flow events) are extremely valuable to determine low and high flow impacts, respectively, but should not be used to adjust the value used as an indicator of average habitat condition. The mean will be calculated by assigning a rank value to each vegetation type based on fountain darter preference and multiplying this weighting factor by the sum of each type from all four reaches used in the Variable Flow Study. The second variable, fountain darter presence/absence will be calculated as a proportion of dip-net samples that have fountain darters present. Sampling will consist of presence/absence dipnet surveys at 50 sites within the Comal system. As an example, 10 sites with darters out of 50 sites equals 20% and 15 sites with darters equals 30 percent. Using both of these variables, in addition to total discharge, increases the likelihood of correctly identifying deteriorating conditions that might not be easily observed using one method. Similarly, it reduces the probability of initiating a massive salvage effort when unwarranted. The modification of mean habitat condition with future data also provides an advantage by allowing for the refinement of comparison data over time. The proposed trigger levels are as follows: OR Less than 50 percent mean aquatic vegetation (Landa Lake and Old Channel) AND less than 20 percent darter presence system-wide, Less than 25 percent mean aquatic vegetation (Landa Lake and Old Channel) AND less than 30 percent darter presence system-wide. The reason for the higher percentage of darter abundance for the second trigger level is the expectation that the number of darters in high quality habitat will increase as the amount of available habitat decreases (clumping effect). Confirmation samples will be very important for this management plan. The trigger levels are designed to provide a conservative buffer that will allow time to verify conditions with a follow-up sample. In addition, when low discharge triggers additional monitoring, sampling will be frequent enough to observe a trend in conditions over time to help evaluate whether conditions have truly deteriorated to the point that off-site refugia are necessary. For the fountain darters, habitat 6-17
354 assessment (aquatic vegetation mapping) is too time consuming to verify with a follow-up sample; however, dip-net sampling can be accomplished by one person within one day. Therefore, triggering the off-site refugia with one of the two scenarios listed above will also require a follow-up dip-net sample the succeeding day to confirm the results. If confirmed, action will be taken to initiate off-site refugia collections Comal Springs Riffle Beetle The proposed Adaptive Management objectives and trigger levels for initiation of management responses for the Comal Springs riffle beetle are presented below. Adaptive Management Objectives Maintain horizontal and upwelling flows in >50 percent of surface habitat; Maintain adequate water quality (parameters maintained within historical ranges); and Determine extent of subsurface use and spatial distribution (if subsurface use is common, modify surface habitat requirements and modify objectives to include subsurface habitat availability). Triggered Monitoring When the springflow of concern (120 cfs) is reached, monitoring of the Comal Springs riffle beetle populations via cotton lures will be conducted every two weeks at three sites (Spring Run 3, western shore of Landa Lake, and Spring Island upwelling) until discharge increases to a level above 120 cfs. ERPAs There are currently no plans to establish an ERPA for Comal Springs riffle beetles in the Comal system. As discussed in Section 4.3, the flow levels supported by the Phase I package are deemed sufficient to protect the species during a repeat of conditions similar to the drought of record. One additional concept discussed in BIO-WEST (2011c) but not currently considered in the HCP measures is spring run connectivity. Should it be determined during applied research conducted at the NFHTC during Phase I that spring run connectivity is effective and that additional protection may be required for the Comal Springs riffle beetle, then some version of that component may be implemented during Phase II. Off-site Refugia Off-site refugia efforts will be initiated below 30 cfs when biological sampling reveals a substantial decline in the number of individuals in the surface layer of substrate in high quality habitat areas (Spring Run 3, Western Shoreline, Spring Island). The proposed trigger level for off-site refugia is: 6-18
355 When only one of the three monitored sites continues to have six or more adult beetles (collected in a 24 hour sampling period using cotton lures) Comal Springs Dryopid Beetle, Peck s Cave Amphipod, and Edwards Aquifer Diving Beetle Proposed Adaptive Management objectives and trigger levels for initiation of management responses for the Comal Springs dryopid beetle, Peck s Cave amphipod, and Edwards Aquifer diving beetle are presented below. Comal Springs Dryopid Beetle Adaptive Management Objectives Maintain adequate water quality within aquifer (parameters maintained within historical ranges); Monitor bad water line; Determine spatial and temporal distribution in the Aquifer; Determine life history characteristics (life span, tolerance to water quality changes, reproduction, food sources) and minimize impacts; and Determine how food sources, particularly those that originate from far away (e.g., organic material washed in from recharge features and chemolithoautotrophic bacteria in deep aquifer) vary naturally and minimize impacts as appropriate. Peck s Cave Amphipod Adaptive Management Objectives Maintain adequate water quality within aquifer (parameters maintained within historical ranges); Monitor bad water line; Determine spatial and temporal distribution in the Aquifer; and Determine life history characteristics (life span, tolerance to water quality changes, reproduction, food sources) and minimize impacts; and Determine how food sources, particularly those that originate from far away (e.g., organic material washed in from recharge features and chemolithoautotrophic bacteria in deep aquifer) vary naturally and minimize impacts as appropriate. Edwards Aquifer Diving Beetle Adaptive Management Objectives Maintain adequate water quality within aquifer (parameters maintained within historical ranges); Monitor bad water line; 6-19
356 Determine spatial and temporal distribution in the Aquifer; and Determine life history characteristics (life span, tolerance to water quality changes, reproduction, food sources) and minimize impacts; and Determine how food sources, particularly those that originate from far away (e.g., organic material washed in from recharge features and chemolithoautotrophic bacteria in deep aquifer) vary naturally and minimize impacts as appropriate. Triggered Monitoring Below 30 cfs total Comal springflow, weekly monitoring for standard water quality parameters (dissolved oxygen, conductivity, ph, and temperature) will be conducted at a network of three wells located within the immediate vicinity of Comal Springs. At 20 cfs total Comal springflow the weekly water quality monitoring will be expanded from standard parameters to include conventional water quality parameters (nutrients, TDS, TOC) at the same network of three wells. ERPAs There are currently no plans for creating an ERPA for subterranean species in the Comal system. The flow levels supported by the Phase I package are deemed sufficient to protect the species during a repeat of conditions similar to the drought of record. Off-site Refugia Off-site refugia efforts will be initiated when water quality sampling reveals a substantial decline in one or more of the parameters measured. The proposed trigger for off-site refugia is when: Any standard or conventional water quality parameter exceeds the historical range of the water quality parameter for the Edwards Aquifer by 10 percent or more Comal Springs Salamander Proposed Adaptive Management objectives and trigger levels for initiation of management responses for the Comal Springs Salamander are presented below. Adaptive Management Objectives Clarify the taxonomy of the species, including the species range and the connectivity with other populations, if they exist; and Maintain adequate springflow and manage other factors to meet following conditions: Maintain >75 percent of physical habitat (silt-free rocks) at all times; 6-20
357 o o Maintain adequate water quality (parameters maintained within historical ranges); and Minimize extent of range and time that water temperature is >27 C. Triggered Monitoring When the springflows of concern (120 cfs) is reached, the following monitoring activity is triggered and will occur every other week (regardless of duration of similar flow) until the next level is triggered (80 cfs) or flows are increased to above 120 cfs. Salamander snorkel surveys will be conducted at the three sites established by Variable Flow Study to include Spring Runs 1 and 3 and the Spring Island area. When springflow falls below 80 cfs, the same sampling effort will occur weekly until flows increase to above 80 cfs. ERPAs There are currently no plans to create an ERPA for the Comal Springs Salamander. As discussed in Section 4.3, the flow levels supported by the Phase I package are deemed sufficient to protect the species during a repeat of conditions similar to the drought of record. Should it be determined during applied research conducted at the NFHTC during Phase I that spring run connectivity is effective for the Comal Springs riffle beetle and that additional protection may be required for the Comal Springs salamander, then additional testing on the salamander at the NFHTC applied research facility will be conducted. Upon proven applicability and success, some version of that component may be implemented during Phase II. Off-site Refugia: It is important to note that the proposed habitat triggers for off-site refugia are not solely dependent on discharge. Off-site refugia efforts could be triggered as high as 120 cfs, or not at all, if habitat and population abundances remain above trigger levels. As with the fountain darter, two variables will be considered in concert with total discharge to assess the need to initiate off-site refugia efforts for the Comal Springs salamander population: availability of suitable habitat and salamander density throughout the known range. The total amount of suitable habitat measured under such conditions will be compared to a mean of total suitable habitat available during favorable conditions (determined from all past and future Variable Flow Study samples at or above 120 cfs, but excluding samples initiated specifically to high flow events ). Data collected outside of favorable conditions (below 120 cfs or after high flow events) are extremely valuable to determine low and high flow impacts, respectively, but should not be used to adjust the value used as an indicator of average habitat condition. The second variable, salamander density, will be calculated by finding the mean density among the three sites sampled for the Variable Flow Study. As with the suitable habitat variable, the mean density observed during each sample will be compared to a mean density of all samples taken during favorable conditions (all past and future Variable Flow Study samples at or above 120 cfs, but excluding high-flow events). 6-21
358 Using both of these variables, in addition to total discharge, increases the likelihood of correctly identifying deteriorating conditions that might not be easily observed using one method. Similarly, it reduces the probability of initiating a massive salvage effort when unwarranted. The modification of mean habitat condition with future data also provides an advantage by allowing for the refinement of comparison data over time. The proposed trigger levels are as follows: Less than 50 percent suitable habitat (Variable Flow Study monitoring locations) AND less than 20 percent salamander density OR Less than 25 percent suitable habitat (Variable Flow Study monitoring locations) AND less than 30 percent salamander density. The reason for the higher percentage of salamander density for the second trigger level is that it is anticipated that the number of salamanders in high quality habitat will increase as the amount of suitable habitat decreases (clumping effect) San Marcos Springs and River Ecosystem Adaptive Management Activities Fountain Darter Proposed Adaptive Management objectives and trigger levels for initiation of management responses for the fountain darter in the San Marcos Springs/River ecosystem are found below. Adaptive Management Objectives Maintain adequate springflow and manage other factors to meet the following conditions: - Minimize extent of range and time that water temperature is >25 C; - Maintain >75 percent of mean abundance 3 of aquatic vegetation in prime habitat; and - Maintain >25 percent of mean abundance of aquatic vegetation in marginal habitat; - Maintain adequate (within historical range) water quality. Determine potential effect of parasite(s) and other non-native species (if impacts evident, minimize impacts); and Determine potential impact of predation and competition during lower flows (if present during lower flows, minimize impacts). 3 Based on existing 10 years of Variable Flow Study data (will be updated by future sampling events where total discharge >100 cfs in the San Marcos River). 6-22
359 Triggered Monitoring As a consequence of discharge declining to the level of take (80 cfs) in the San Marcos River, the following specific monitoring activities will occur every other month (regardless of duration of similar flow) until discharge falls to 50 cfs or increases to above 100 cfs. Aquatic vegetation mapping Three sites established by Variable Flow Study to include Spring Lake Dam reach, City Park reach, and IH-35 reach. Dip Net sampling/visual parasite evaluations Presence/absence surveys to be conducted at 50 sites in high quality habitat (Spring Lake [20], Spring Lake Dam reach [10]), City Park reach [10], and IH-35 reach [10]). When springflow is less than 50 cfs, aquatic vegetation mapping will be conducted monthly, while dip net sampling and visual parasite evaluations will occur weekly. ERPAs There are currently no plans to create an ERPA for the fountain darter in the San Marcos system. As discussed in Section 4.3, the flow levels supported by the Phase I package are deemed sufficient to protect the species during a repeat of conditions similar to the drought of record. Should data collected during Phase I applied research or monitoring show that additional protection may be required for the fountain darter, then activities (such as an Eastern Spillway ERPA) discussed in BIO-WEST (2011c) may warrant further exploration. Off-Site Refugia It is important to note that the proposed habitat triggers for off-site refugia are not solely dependent on discharge. Off-site refugia efforts could be triggered as high as 50 cfs or not at all, if habitat and population abundances remain above trigger levels. As in the Comal River, two variables will be considered in concert with total discharge to assess the need to initiate off-site refugia efforts for the fountain darter population: availability of sufficient habitat (aquatic vegetation), and presence/absence of darters throughout the known range. These variables will be measured and calculated in the same manner as in the Comal River to determine when a trigger has been reached. The proposed trigger levels are as follows: OR Less than 50 percent mean aquatic vegetation (Variable Flow Study monitoring reaches including Spring Lake) AND less than 20 percent darter abundance, Less than 25 percent mean aquatic vegetation (Variable Flow Study monitoring reaches including Spring Lake) AND less than 30 percent darter abundance. The reason for the higher percentage of darter abundance for the second trigger level is that it is anticipated that the number of darters in high quality habitat will increase as the amount of available habitat decreases (clumping effect). 6-23
360 Confirmation samples will be very important for this management plan. These trigger levels have been designed to provide a conservative buffer that will allow time to verify conditions with a follow-up sample. In addition, when low discharge triggers additional monitoring, sampling will be frequent enough to observe a trend in conditions over time to help evaluate whether conditions have actually deteriorated to the point that off-site refugia are necessary. For the fountain darters, habitat assessment (aquatic vegetation mapping) is too time consuming to verify with a follow-up sample; however, dip-net sampling can be accomplished by one person within one day. Therefore, triggering the off-site refugia with one of the two scenarios listed above will also require a follow-up dip-net sample the succeeding day to confirm the results. If confirmed, action would be taken to initiate off-site refugia collections San Marcos Salamander Proposed Adaptive Management objectives and trigger levels for initiation of management responses for the San Marcos salamander are presented below. Adaptive Management Objectives Maintain adequate springflow and manage other factors to meet following conditions: Maintain >75 percent of physical habitat (silt-free rocks) at all times; Maintain adequate water quality (parameters maintained within historical ranges); and Minimize extent of range and time that water temperature is >27 C. Triggered Monitoring When the springflow level of concern (80 cfs) is reached, the following specific monitoring activity is triggered and will occur every other week (regardless of duration of similar flow) until the next level is triggered or flows are increased to above 80 cfs. Salamander surveys (SCUBA and snorkel) will be conducted at the three sites established by Variable Flow Study to include Hotel Area (Site 2), Riverbed Area (Site 14), and eastern spillway of Spring Lake dam (Site 22). When springflow falls below 50 cfs, the same sampling effort will occur weekly until flows increase to above 50 cfs. ERPAs There are currently no plans to create an ERPA for the San Marcos salamander in the San Marcos system. As discussed in Section 4.3, the flow levels supported by the Phase I package are deemed sufficient to protect the species during a repeat of conditions similar to the drought of record. Should data collected during Phase I applied research or monitoring show that additional protection may be required for the San Marcos salamander, then activities (such as an Eastern Spillway ERPA) discussed in BIO-WEST (2011c) may warrant further exploration. The objective of the Eastern Spillway ERPA is to maintain high-quality silt-free rock habitat, native vegetation to host salamander prey items, and recreation-disturbance-free high quality salamander habitat, particularly during average and low flows. 6-24
361 Off-site Refugia The habitat triggers for off-site refugia are not solely dependent on discharge. Off-site refugia efforts could be triggered as high as 80 cfs, or not at all, if habitat and population abundances remain above trigger levels. As with the fountain darter, two variables will be considered in concert with total discharge to assess the need to initiate off-site refugia efforts for the San Marcos salamander population: availability of suitable habitat and salamander density throughout the known range. The total amount of suitable habitat measured under such conditions will be compared to a mean of total suitable habitat available during favorable conditions (determined from all past and future Variable Flow Study samples at or above 80 cfs, but excluding samples initiated specifically to high flow events ). Data collected outside of favorable conditions (below 80 cfs or after high flow events) are extremely valuable to determine low and high flow impacts, respectively, but should not be used to adjust the value used as an indicator of average habitat condition. The second variable, salamander density, will be calculated by finding the mean density among the three sites sampled for the Variable Flow Study. As with the suitable habitat variable, the mean density observed during each sample will be compared to a mean density of all samples taken during favorable conditions (all past and future Variable Flow Study samples at or above 80 cfs, but excluding high-flow events). Using both of these variables, in addition to total discharge, increases the likelihood of correctly identifying deteriorating conditions that might not be easily observed using one method. Similarly, it reduces the probability of initiating a massive salvage effort when unwarranted. The modification of mean habitat condition with future data also provides an advantage by allowing for the refinement of comparison data over time. The proposed trigger levels are as follows: OR Less than 50 percent suitable habitat (Variable Flow Study monitoring locations) AND less than 20 percent salamander density Less than 25 percent suitable habitat (Variable Flow Study monitoring locations) AND less than 30 percent salamander density. The reason for the higher percentage of salamander density for the second trigger level is that it is anticipated that the number of salamanders in high quality habitat will increase as the amount of suitable habitat decreases (clumping effect) Texas Blind Salamander and Texas Troglobitic Water Slater Proposed Adaptive Management objectives and trigger levels for initiation of management responses for the Texas blind salamander and Texas troglobitic water slater are presented below. 6-25
362 Adaptive Management Objectives Maintain adequate water quality (parameters maintained within historical ranges) within the aquifer; Monitor bad water line; Determine spatial and temporal distribution in the aquifer; Determine life history characteristics (life span, tolerance to water quality changes, reproduction, food sources) and minimize impacts; and Determine how food sources, particularly those that originate from far away (e.g., organic material washed in from recharge features and chemolithoautotrophic bacteria in deep aquifer) vary naturally and minimize impacts as appropriate. Triggered Monitoring Below 50 cfs, weekly monitoring for standard water quality parameters (dissolved oxygen, conductivity, ph, and temperature) will be conducted at a network of three wells located within the vicinity of San Marcos Springs. When springflow falls below 30 cfs, the weekly water quality monitoring is expanded from standard parameters to include conventional water quality parameters (nutrients, TDS, total organic carbon) at the same network of three wells. ERPAs There are currently no plans to create an ERPA for subterranean species in the San Marcos system. As discussed in Section 4.3, the flow levels supported by the Phase I package are deemed sufficient to protect the species during a repeat of conditions similar to the drought of record. Off-site Refugia Off-site refugia efforts will be initiated below 30 cfs when water quality sampling reveals a substantial decline in one or more of the parameters measured. The proposed trigger for off-site refugia is when: Any standard or conventional water quality parameter exceeds the historical range of the water quality parameter for the Edwards Aquifer by 10 percent or more Texas Wild-Rice Proposed Adaptive Management objectives and trigger levels for initiation of management responses for Texas wild-rice are presented below. Adaptive Management Objectives Maintain >3,500 m 2 of Texas wild-rice plants at all times; Maintain Texas wild-rice stands at a minimum of three distinct longitudinal sections of the San Marcos River as described by the Variable Flow Study; 6-26
363 Maintain adequate water quality (parameters maintained within historical ranges); Minimize extent of vegetative mats and time that mats cover Texas wild-rice plants; and Determine and minimize impacts from herbivory and recreation during low flow. Triggered Monitoring When springflow level of concern (100 cfs) is reached, the following specific monitoring activities are also triggered and will occur at the specified frequency (regardless of duration of similar flow) until the next level is triggered or flows are increased above 100 cfs. At 100 cfs, mapping of Texas wild-rice coverage for the entire San Marcos River will be conducted; and From 100 cfs to 60 cfs, physical parameters of Texas wild-rice will be monitored every other week in designated vulnerable areas as established by the Variable Flow Study. When springflow is less than 80 cfs, total Texas wild-rice coverage will be mapped monthly under the guidelines specified above and physical visual observations will occur weekly. ERPAs There are currently no plans to create an ERPA for Texas wild-rice in the San Marcos system. As discussed in Section 4.3, the flow levels supported by the Phase I package are deemed sufficient to protect the species during a repeat of conditions similar to the drought of record. However, because of uncertainties associated with habitat modeling for Texas wild-rice, additional restoration and enhancement activities described in Chapter 6 are proposed for Texas wild-rice. Additionally, recreation control in key Texas wild-rice areas during low-flow conditions is also recommended. As previously stated, regardless if the eastern spillway is turned into an ERPA as discussed in BIO-WEST (2011c), access to this area will be restricted through its inclusion in the State Scientific Area discussed in Section 5.6 above. This alone will greatly enhance the protection of fountain darter, San Marcos salamander, and Texas wild-rice in the reach immediately below Spring Lake Dam. Off-site Refugia It is important to note that the proposed habitat triggers for off-site refugia are not solely dependent on discharge. Off-site refugia efforts could be triggered as high as 80 cfs or not at all, if areal coverage remains above trigger levels. The proposed trigger levels are as follows: OR Less than 3,500 m 2 total coverage in the San Marcos River Texas wild-rice stands exist at fewer than three distinct sections as described by the Variable Flow Study seven sections. 6-27
364 This page intentionally left blank 6-28
365 Chapter 7 Costs and Funding 7.0 Introduction To issue the ITP, USFWS must find that the Applicants will ensure that adequate funding for the [HCP] will be provided. (16 U.S.C. 1539(a)(2)(B)(iii)). To satisfy this requirement, the costs of implementing the HCP are set out below along with the assurance that funding will be available to implement the HCP. Specifics regarding the funding arrangements for the HCP are found in Articles Three and Five of the FMA, (Appendix R) and that are generally described briefly in Sections and below. Consistent with the phasing of the HCP, the costs and funding for implementation of the HCP are discussed below with respect to Phase I and Phase II of the HCP. Cost estimates are more detailed for Phase I, reflecting the prioritization of minimization and mitigation measures and task specific estimates derived from efforts of the Ecosystem Restoration Subcommittee, HDR Engineering, Inc., and BIO-WEST, Inc. with input from knowledgeable stakeholders. Although the measures may be modified during the term of the ITP as provided for in the AMP, the funding commitment will continue through the term of the ITP, with a potential augmentation in Phase II as described below, subject to the AMP. 7.1 Phase I Measures Annual Implementation Costs The estimated annual cost of implementing the minimization and mitigation measures in Chapter 5 and conducting the AMP in each year of the HCP is presented in Table 7.1. Implementation of some measures in the Phase I program will entail the expenditure of nonrecurring funds at the early years of the HCP for the habitat minimization and mitigation measures at Comal and San Marcos springs. Accordingly, the costs in the initial years are higher than in later years. The annualized costs in year 7 are expected to continue through Phase II, unless changed by the AMP. The cost of the SAWS ASR springflow protection measure was based on the experience of SAWS and other members of the SAWS ASR Work Group in leasing water and SAWS experience in operating its ASR. (See Appendix S). HDR Engineering, Inc. participated in the development of these cost estimates. The costs include the annual cost of leasing water for the SAWS ASR ($4,759,000) and the annual O&M costs related to the use of the ASR ($2,194,000). These costs are average annual costs based on a probabilistic analysis of the triggers for leasing the water and recovering water from the ASR. (See Section 5.5.1) The cost of the Regional Water Conservation Program was developed by the Conservation Work Group based largely on SAWS s experience with its conservation program. (See Appendix T). HDR Engineering, Inc. reviewed these cost estimates. 7-1
366 The estimated costs of the habitat minimization and mitigation measures were initially developed by the Ecosystem Restoration Subcommittee. (See Appendix U). To the extent possible, these estimates were based on experience in the springs ecosystem or comparable projects implemented elsewhere. Subsequently, the costs were refined by the cities of San Marcos and New Braunfels and included, where possible, preliminary estimates by potential contractors. The costs were reviewed and further refined by BIO-WEST with the participation of representatives from the spring cities. 7-2
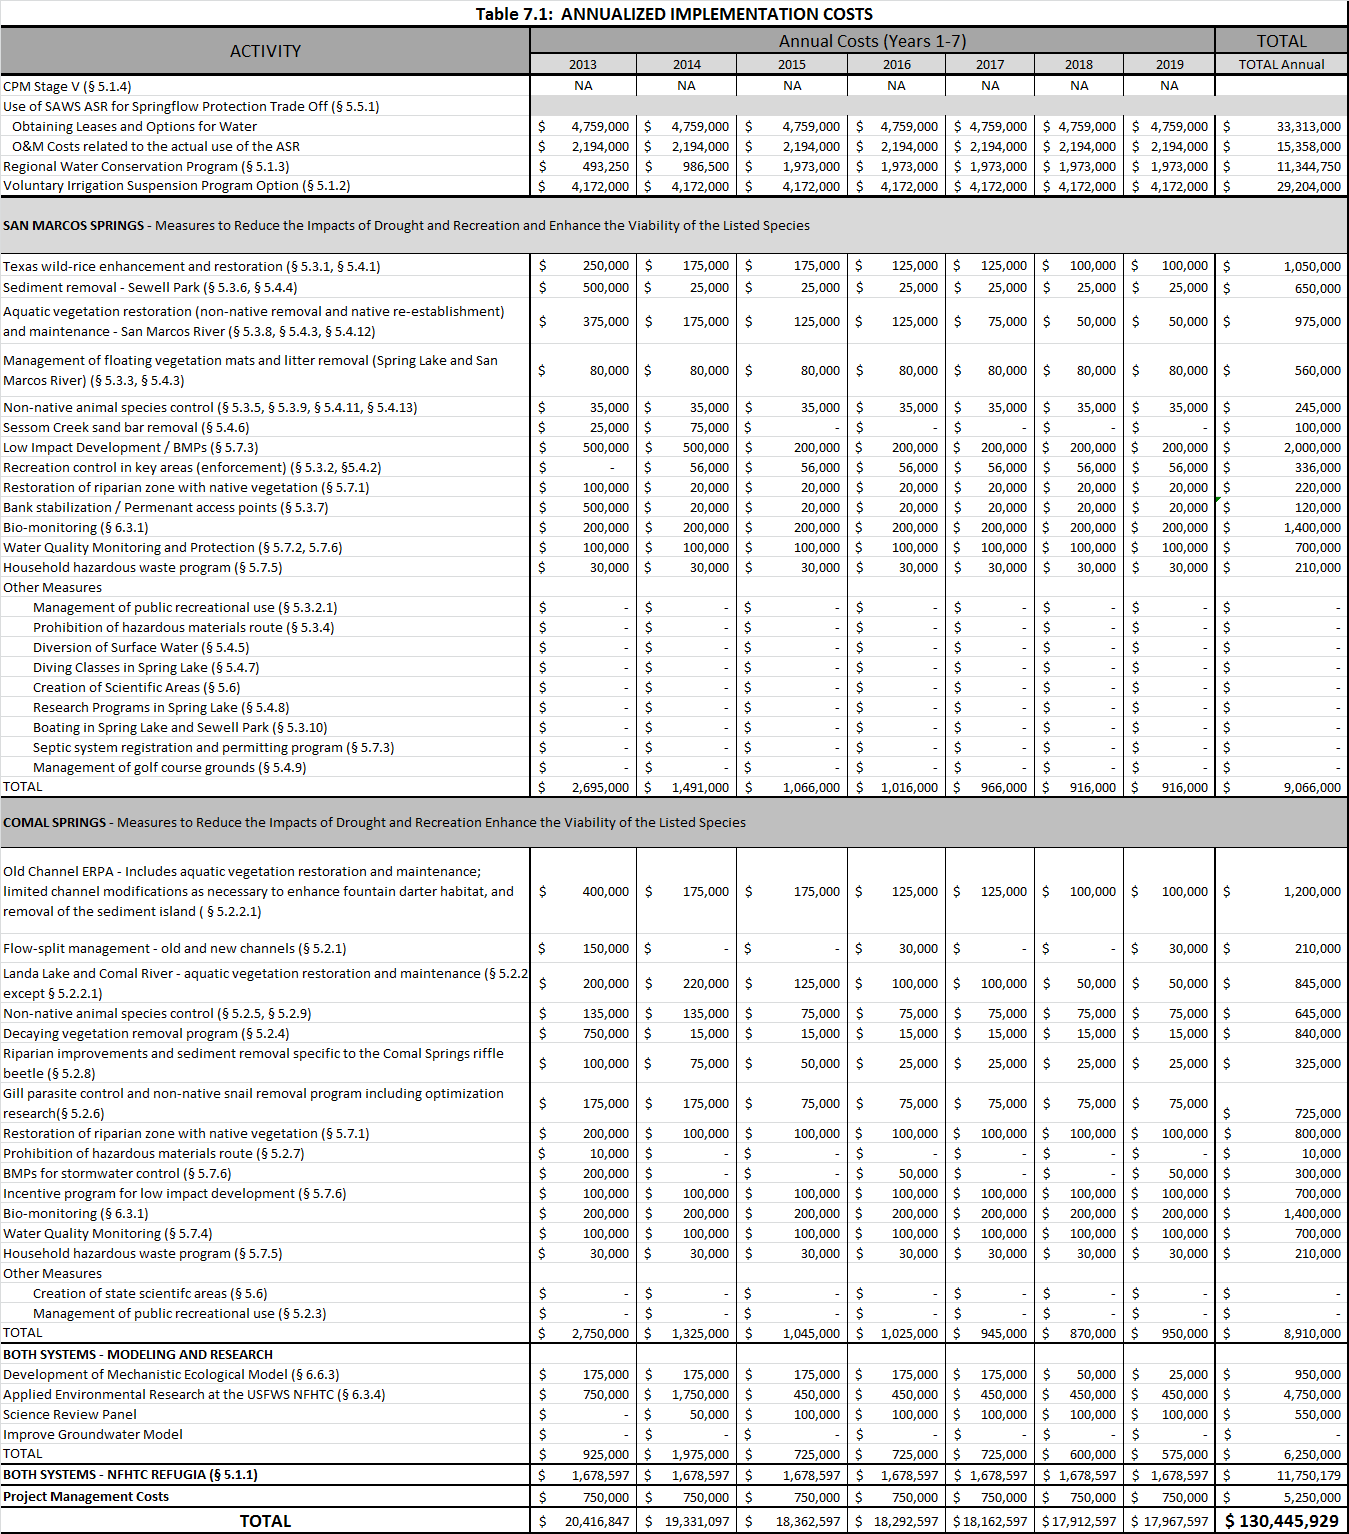
367 7-3

368 7-4
Habitat Conservation Plan Incidental Take License Information Package
 Habitat Conservation Plan Incidental Take License Information Package Hawaiian stilt, a eo, Himantopus mexicanus knudseni - Photo: Garret Lau State of Hawaii Department of Land and Natural Resources Division
HABITAT CONSERVATION PLANNING ASSISTANCE GRANT PROPOSAL COMAL COUNTY REGIONAL HABITAT CONSERVATION PLAN -- PROJECT STATEMENT
 HABITAT CONSERVATION PLANNING ASSISTANCE GRANT PROPOSAL COMAL COUNTY REGIONAL HABITAT CONSERVATION PLAN -- PROJECT STATEMENT 1.0 Background and Need Comal County proposes to develop and complete a regional
Multiple Species Conservation Program County of San Diego. A Case Study in Environmental Planning & The Economic Value of Open Space
 Multiple Species Conservation Program County of San Diego A Case Study in Environmental Planning & The Economic Value of Open Space Amy M. Fox Land Use Law Case Study Autumn Semester, 1999 Multiple Species
American Bar Association Section of Environment, Energy, and Resources
 American Bar Association Section of Environment, Energy, and Resources The Migratory Bird Treaty Act, the Bald and Golden Eagle Protection Act, and the Endangered Species Act: Prohibitions and Remedies
SAN MARCOS & COMAL SPRING & ASSOCIATED AQUATIC ECOSYSTEMS (REVISED) RECOVERY PLAN
 RECOVERY PLAN") SAN MARCOS & COMAL SPRING & ASSOCIATED AQUATIC ECOSYSTEMS (REVISED) RECOVERY PLAN ri Us. San Marcos and Comal Springs and Associated Aquatic Ecosystems (Revised) Recovery Plan (Short tide: San Marcos/Comal
SAN MARCOS & COMAL SPRING & ASSOCIATED AQUATIC ECOSYSTEMS (REVISED) RECOVERY PLAN ri Us. San Marcos and Comal Springs and Associated Aquatic Ecosystems (Revised) Recovery Plan (Short tide: San Marcos/Comal
CHAPTER 8. FEDERALLY-LISTED ENDANGERED OR THREATENED SPECIES
 1. INTRODUCTION AND DEFINITIONS. CHAPTER 8. FEDERALLY-LISTED ENDANGERED OR THREATENED SPECIES a. General. The Biotic Resources chapter in Appendix A of Order 1050.1E combines information on Federally-listed
National Marine Sanctuaries Act
 Please note: This text is from the fourth edition of Federal Historic Preservation Laws, published in 2006 by the National Center for Cultural Resources, National Park Service, Department of the Interior.
COMPREHENSIVE PLAN SECTION B, ELEMENT 4 WATER RESOURCES. April 20, 2010 EXHIBIT 1
 COMPREHENSIVE PLAN SECTION B, ELEMENT 4 WATER RESOURCES April 20, 2010 EXHIBIT 1 ELEMENT 4 WATER RESOURCES TABLE OF CONTENTS 4.1 INTRODUCTION 4.2 GOALS AND POLICIES 4.2.A General Goals and Policies 1 4.2.B
Section 4 General Strategies and Tools
 Section 4 General Strategies and Tools Key planning issues for WRIA 35 have been identified in Sections 5 and 6 in the areas of water supply, instream flow, water quality, and aquatic habitat. General
Environmental Compliance Questionnaire for National Oceanic and Atmospheric Administration Federal Financial Assistance Applicants
 OMB Approval No.: 0648-0538 Environmental Compliance Questionnaire for National Oceanic and Atmospheric Administration Federal Financial Assistance Applicants Instructions The National Environmental Policy
Notice of Availability and Request for Public Comment on the Joint U. S. Fish and Wildlife
 This document is scheduled to be published in the Federal Register on 06/28/2016 and available online at http://federalregister.gov/a/2016-15230, and on FDsys.gov Billing Code: 4333 15 Billing Code: 3510-22-P
Environmental Protection. Northern California River Watch v. City of Healdsburg 496 F.3d 993 (9 th Cir. 2007), p. 660
, p. 660") Environmental Protection Wetlands Northern California River Watch Endangered Species Babbitt v. Sweet Home HCPs Northern California River Watch v. City of Healdsburg 496 F.3d 993 (9 th Cir. 2007), p. 660
Environmental Protection Wetlands Northern California River Watch Endangered Species Babbitt v. Sweet Home HCPs Northern California River Watch v. City of Healdsburg 496 F.3d 993 (9 th Cir. 2007), p. 660
Water Extraction Permitting Policy
 Water Extraction Policy 1 Water Extraction Permitting Policy Department of Environment, Labour & Justice January 2013 Water Extraction Policy 2 EXECUTIVE SUMMARY This document establishes a new policy
3. The submittal shall include a proposed scope of work to confirm the provided project description;
 QIN Shoreline Master Program Project Summary The Shoreline Master Program (SMP) development process for the Quinault Indian Nation (QIN) includes the completion of inventory and analysis report with corresponding
U.S. Fish & Wildlife Service West Virginia Ecological Services Field Office
 Slide 1 West Virginia Ecological Services Field Office Liz Stout Fish and Wildlife Biologist 694 Beverly Pike Elkins, West Virginia 26241 elizabeth_stout@fws.gov 304-636-6586 x 15 Slide 2 Today s Goals
Water Quantity Trading & Banking: Concepts and Illustrations. Kurt Stephenson Dept. of Agricultural & Applied Economics October 15, 2015
 Water Quantity Trading & Banking: Concepts and Illustrations Kurt Stephenson Dept. of Agricultural & Applied Economics October 15, 2015 Groundwater Management Roles: Commonwealth and Users What GW goal
1.7.0 Floodplain Modification Criteria
 1.7.0 Floodplain Modification Criteria 1.7.1 Introduction These guidelines set out standards for evaluating and processing proposed modifications of the 100- year floodplain with the following objectives:
Hydrologic Connection of the Edwards Aquifer between San Marcos Springs and Barton Springs, Texas
 Hydrologic Connection of the Edwards Aquifer between San Marcos Springs and Barton Springs, Texas Larry F. Land 1, Brian B. Hunt 2, and Brian A. Smith 2 1 HDR Engineering, Inc., 4411 West Gate Blvd., Ste.
How To Manage Water Resources In The Yakima Basin
 Yakima Basin Integrated Water Resource Management Plan October 23, 2014 Presented by Derek Sandison, Director Office of Columbia River Photo Courtesy of Tom Ring Basin size: 6,155 sq. miles Population:
NOAA s Role in the Licensing of Offshore LNG Terminals
 NOAA s Role in the Licensing of Offshore LNG Terminals Emily Lindow, National Oceanic and Atmospheric Administration Senior Advisor to the Under Secretary of Commerce for Oceans and Atmosphere NOAA and
American Bar Association Section on Environment, Energy, and Resources. Species, Renewable Energy, and Public Lands: Moderator s Introduction
 American Bar Association Section on Environment, Energy, and Resources Species, Renewable Energy, and Public Lands: Moderator s Introduction Robin Kundis Craig William H. Leary Professor of Law University
RE: Docket # COE 2010 0035; ZRIN 0710 ZA05 Submitted via email to NWP2012@usace.army.mil and Rulemaking Portal at www.regulations.gov.
 April 18, 2011 U.S. Army Corps of Engineers Attn: CECW CO R 441 G Street, N.W. Washington, DC 20314 1000 RE: Docket # COE 2010 0035; ZRIN 0710 ZA05 Submitted via email to NWP2012@usace.army.mil and Rulemaking
Groundwater Law Today and Tomorrow: Court Decisions and Their Impact
 Groundwater Law Today and Tomorrow: Court Decisions and Their Impact 14 th Annual Bell County Water Symposium November 18, 2014 - Belton Presented by: Ty Embrey tembrey@lglawfirm.com (512) 322-5829 816
RESTRICTING GROUNDWATER WITHDRAWALS TO PROTECT WATER RESOURCES: ECONOMIC IMPACT ASSESSMENT
 CHAPTER 14 RESTRICTING GROUNDWATER WITHDRAWALS TO PROTECT WATER RESOURCES: ECONOMIC IMPACT ASSESSMENT Grace Johns and Lisa A. McDonald Economic analysis methods have been used in Florida to identify positive
Plan Groundwater Procurement, Implementation and Costs, prepared for the Brazos River Authority, July 2005.
 6 Conjunctive Use 6.1 Lake Granger Augmentation 6.1.1 Description of Option Rapid population growth and development in Williamson County require additional water supplies throughout the planning period.
QUESTIONS AND ANSWERS WATERS OF THE U.S. PROPOSAL
 QUESTIONS AND ANSWERS WATERS OF THE U.S. PROPOSAL Key Background Congress enacted the modern Clean Water Act in 1972 to address pollution entering the nation s waters to complement statutes such as the
Section 401 Water Quality Certification
 Section 401 Water Quality Certification Department of Health Environmental Management Division Clean Water Branch Voice: (808) 586-4309 Fax: (808) 586-4352 http://www.hawaii.gov/health/environmental/water/cleanwater/index.html
PUBLIC NOTICE Application for Permit
 PUBLIC NOTICE Application for Permit 30-Day Notice Issue Date: June 20, 2016 Expiration Date: July 20, 2016 US Army Corps of Engineers No: NWP-2010-535 Oregon Department of State Lands No: 58311-RF Interested
1 INTRODUCTION. Kayenta Complex Page 9 December 2011 Cumulative Hydrologic Impact Assessment
 1 INTRODUCTION The Office of Surface Mining Reclamation and Enforcement (OSMRE) is the regulatory authority for coal mining operations under the Surface Mining Reclamation and Control Act of 1977 that
Incidental Take Statement
 Incidental Take Statement Statement of Regulation Section 9 of the ESA and Federal regulation pursuant to section 4(d) of the ESA prohibit the take of endangered and threatened species, respectively, without
Appendix A. The Marine Life Protection Act (MLPA)
") Appendix A. The Marine Life Protection Act (MLPA) THE PEOPLE OF THE STATE OF CALIFORNIA DO ENACT AS FOLLOWS: SECTION 1. Chapter 10.5 (commencing with Section 2850) is added to Division 3 of the Fish and
Appendix A. The Marine Life Protection Act (MLPA) THE PEOPLE OF THE STATE OF CALIFORNIA DO ENACT AS FOLLOWS: SECTION 1. Chapter 10.5 (commencing with Section 2850) is added to Division 3 of the Fish and
HCP Team Meeting. November 18, 2015. icfi.com
 HCP Team Meeting November 18, 2015 icfi.com 1 Welcome and Introductions Where are we in the HCP process Hydrology modeling update Native fish survey Fish translocation Finalize covered activities Next
SUFFOLK COUNTY WATER QUALITY PROTECTION AND RESTORATION PROGRAM AND LAND STEWARDSHIP INITIATIVES INFORMATION FOR APPLICANTS
 June 2015 SUFFOLK COUNTY WATER QUALITY PROTECTION AND RESTORATION PROGRAM AND LAND STEWARDSHIP INITIATIVES INFORMATION FOR APPLICANTS Steven Bellone, Suffolk County Executive Joanne Minieri, Deputy County
Restoring Anadromous Fish Habitat in Big Canyon Creek Watershed. Summary Report 2002
 Restoring Anadromous Fish Habitat in Big Canyon Creek Watershed Summary Report 2002 DOE/BP-00005268-5 November 2002 This Document should be cited as follows: "Restoring Anadromous Fish Habitat in Big Canyon
DISTRICT VALUES STATEMENTS, GOALS, ACTION ITEMS, AND ONGOING TASKS FOR 2015 Adopted by the Board of Directors December 10, 2014. Values Statements.
 DISTRICT VALUES STATEMENTS, GOALS, ACTION ITEMS, AND ONGOING TASKS FOR 2015 Adopted by the Board of Directors December 10, 2014 Values Statements. The Board opposes any new transfers of water from the
CHAPTER 372-68 WAC WATER POLLUTION CONTROL AND ABATEMENT PLANS FOR SEWAGE DRAINAGE BASINS
 CHAPTER 372-68 WAC WATER POLLUTION CONTROL AND ABATEMENT PLANS FOR SEWAGE DRAINAGE BASINS Last Update: 6/8/88 WAC 372-68-010 Authority. 372-68-020 Purpose. 372-68-030 Definitions. 372-68-040 Planning guide.
ARIZONA DEPARTMENT OF WATER RESOURCES
 ARIZONA DEPARTMENT OF WATER RESOURCES WATER MANAGEMENT REQUIREMENTS FOR SOLAR POWER PLANTS IN ARIZONA ADWR CONTACT: Jeff Tannler, Statewide Active Management Area Director Arizona Department of Water Resources
NRDA PROCEDURES AND TERMS
 NRDA PROCEDURES AND TERMS (Paraphrased from the National Oceanic and Atmospheric Administration Guidance Documents for Natural Resource Damage Assessment Under the Oil Pollution Action of 1990) INTRODUCTION
Adoption of an Interim 602(a) Storage Guideline. Final Environmental Assessment
 Storage Guideline. Final Environmental Assessment") Adoption of an Interim 602(a) Storage Guideline Final Environmental Assessment U.S. Department of the Interior Bureau of Reclamation March 2004 The mission of the Department of the Interior is to protect
Adoption of an Interim 602(a) Storage Guideline Final Environmental Assessment U.S. Department of the Interior Bureau of Reclamation March 2004 The mission of the Department of the Interior is to protect
SAMOA MARINE WILDLIFE PROTECTION REGULATIONS 2009
 S.R. 2009/18 SAMOA MARINE WILDLIFE PROTECTION REGULATIONS 2009 Arrangement of Provisions PART I PRELIMINARY 1. Short title and commencement 2. Interpretation 3. Application in the Exclusive Economic Zone
DEPARTMENT OF ENVIRONMENTAL QUALITY Environmental Assessment
 DEPARTMENT OF ENVIRONMENTAL QUALITY Environmental Assessment Water Protection Bureau Name of Project: Applicant: Ueland Land Development LLC Type of Project: Proposed discharge of treated domestic wastewater
TEXAS: SAN ANTONIO San Antonio Protects Edwards Aquifer
 TEXAS: SAN ANTONIO San Antonio Protects Edwards Aquifer Background San Antonio, the seventh largest city in the United States, covers approximately 515 square miles of Bexar County in south central Texas.
STATEMENT OF RON HUNTSINGER NATIONAL SCIENCE COORDINATOR BUREAU OF LAND MANAGEMENT U.S
 STATEMENT OF RON HUNTSINGER NATIONAL SCIENCE COORDINATOR BUREAU OF LAND MANAGEMENT U.S. DEPARTMENT OF THE INTERIOR BEFORE THE HOUSE APPROPRIATIONS SUBCOMMITTEE ON INTERIOR, ENVIRONMENT AND RELATED AGENCIES
Protecting Floodplain. While Reducing Flood Losses
 Protecting Floodplain Natural and Beneficial i Functions While Reducing Flood Losses Jon Kusler Association of State Wetland Managers 518 872 1804; jon.kusler@aswm.org Report available at: http://aswm.org/pdf_lib/nbf.pdf
A Functional Classification System for Marine Protected Areas in the United States
 A Functional Classification System for Marine Protected Areas in the United States The U.S. Classification System: An Objective Approach for Understanding the Purpose and Effects of MPAs as an Ecosystem
The Everglades & Northern Estuaries; St. Lucie River Estuary, Indian River Lagoon & Caloosahatchee Estuary. Water Flows & Current Issues
 The Everglades & Northern Estuaries; St. Lucie River Estuary, Indian River Lagoon & Caloosahatchee Estuary Water Flows & Current Issues Florida Governor Rick Scott August 20, 2013 Upper Chain of Lakes
Conservation Tax Credit Regulations Chapter 391-1-6 A-1 RULES OF GEORGIA DEPARTMENT OF NATURAL RESOURCES CHAPTER 391-1-6
 Conservation Tax Credit Regulations Chapter 391-1-6 A-1 RULES OF GEORGIA DEPARTMENT OF NATURAL RESOURCES CHAPTER 391-1-6 GEORGIA CONSERVATION TAX CREDIT PROGRAM TABLE OF CONTENTS 391-1-6-.01 Purpose and
INDONESIA - LAW ON WATER RESOURCES,
 Environment and Development Journal Law LEAD INDONESIA - LAW ON WATER RESOURCES, 2004 VOLUME 2/1 LEAD Journal (Law, Environment and Development Journal) is a peer-reviewed academic publication based in
How To Write A Listing Policy For A Species At Risk Act
 Fisheries and Oceans Canada Species at Risk Act Listing Policy and Directive for Do Not List Advice DFO SARA Listing Policy Preamble The Fisheries and Oceans Canada (DFO) Species at Risk Act (SARA) Listing
GENERAL NPDES PERMIT FOR PESTICIDE APPLICATION POINT SOURCE DISCHARGES. Leslie Lowry Illinois Environmental Protection Agency
 GENERAL NPDES PERMIT FOR PESTICIDE APPLICATION POINT SOURCE DISCHARGES Leslie Lowry Illinois Environmental Protection Agency TOPICS TO BE DISCUSSED Background Scope Overview of General Permit Key Websites
NAPA COUNTY WATERSHED SYMPOSIUM
 Planning, Building, and Environmental Services NAPA VALLEY GROWTH NAPA COUNTY WATERSHED SYMPOSIUM Plunging Forward May 15, 2015 1 YOU CAN T CROSS THE SEA MERELY BY STANDING AND STARING AT THE WATER. Rabindranath
Applying HUD s Floodplain Management and Wetlands Protection Standards U.S. Department of Housing and Urban Development Office of Environment and
 Applying HUD s Floodplain Management and Wetlands Protection Standards U.S. Department of Housing and Urban Development Office of Environment and Energy Executive Order 11988 Floodplain Management Training
Sustainability Brief: Water Quality and Watershed Integrity
 Sustainability Brief: and Watershed Integrity New Jersey depends on water resources for the health of our people, the strength of our economy, and the vitality of our ecosystems. The quality of our water
Michigan Wetlands. Department of Environmental Quality
 Department of Environmental Quality Wetlands are a significant component of Michigan s landscape, covering roughly 5.5 million acres, or 15 percent of the land area of the state. This represents about
SP-472 AUGUST 2012. Feral Hog Population Growth, Density and Harvest in Texas
 SP-472 AUGUST 2012 Feral Hog Population Growth, Density and Harvest in Texas Photo courtesy Jared Timmons, Texas AgriLife Extension Service Feral hogs (Sus scrofa) are non-native, highly adaptable, and
Transportation and Environmental Challenges Associated with the Proposed State Highway 45 Southwest
 Transportation and Environmental Challenges Associated with the Proposed State Highway 45 Southwest Nico Hauwert, Ph.D., PG, Hydrogeologist City of Austin Watershed Protection Department William A. Conrad,
THE SECRETARY OF THE INTERIOR WASHINGTON
 THE SECRETARY OF THE INTERIOR WASHINGTON ORDER NO. 3336 Subject: Rangeland Fire Prevention, Management and Restoration Sec. 1 Purpose. This Order sets forth enhanced policies and strategies for preventing
REGULATORY GUIDANCE LETTER
 REGULATORY GUIDANCE LETTER. 07-02 Date: July 4, 2007 SUBJECT: Exemptions for Construction or Maintenance of Irrigation Ditches and Maintenance of Drainage Ditches Under Section 404 of Clean Water Act 1.
Addendum D. Nomination of Moody Wash ACEC
 Addendum D Nomination of Moody Wash ACEC Moody Wash ACEC is hereby nominated by Citizens for Dixie s Future to: BLM St. George Field Office 345 East Riverside Drive St. George, UT 84790 Moody Wash is a
March 2008. Prepared by: Irvine Ranch Water District. 15600 Sand Canyon Avenue. Irvine, CA 92618. Contact: Natalie Likens (949) 453-5633
 453-5633") ADDENDUM TO THE MICHELSON WATER RECLAMATION PLANT PHASE 2 & 3 CAPACITY EXPANSION PROJECT FEBRUARY 2006 FINAL ENVIRONMENTAL IMPACT REPORT AND THE SAN JOAQUIN FRESHWATER MARSH ENHANCEMENT PLAN REVISED SEPTEMBER
ADDENDUM TO THE MICHELSON WATER RECLAMATION PLANT PHASE 2 & 3 CAPACITY EXPANSION PROJECT FEBRUARY 2006 FINAL ENVIRONMENTAL IMPACT REPORT AND THE SAN JOAQUIN FRESHWATER MARSH ENHANCEMENT PLAN REVISED SEPTEMBER
Northern Long-eared Bat - Interim Final 4(d) Rule Questions and Answers
 Rule Questions and Answers") Northern Long-eared Bat - Interim Final 4(d) Rule Questions and Answers 1. What action is the Service taking? On January 15, 2015, the Service published a proposed rule under section 4(d) of the Endangered
Northern Long-eared Bat - Interim Final 4(d) Rule Questions and Answers 1. What action is the Service taking? On January 15, 2015, the Service published a proposed rule under section 4(d) of the Endangered
MASSACHUSETTS COASTAL NONPOINT PROGRAM NOAA/EPA DECISIONS ON CONDITIONS OF APPROVAL
 MASSACHUSETTS COASTAL NONPOINT PROGRAM NOAA/EPA DECISIONS ON CONDITIONS OF APPROVAL FOREWORD This document contains the basis for NOAA and EPA s decision to fully approve Massachusetts Coastal Nonpoint
Ocean Dumping Act: A Summary of the Law
 Claudia Copeland Specialist in Resources and Environmental Policy December 15, 2010 Congressional Research Service CRS Report for Congress Prepared for Members and Committees of Congress 7-5700 www.crs.gov
Environmental Law Primer. Adapted from Vermont Law School s Environmental Law Primer for Journalists
 Environmental Law Primer Adapted from Vermont Law School s Environmental Law Primer for Journalists General Categories Command and Control Liability Disclosure Ecosystem and Place-based Programs Marketable
4.2 Buena Vista Creek Watershed
 Buena Vista Creek Watershed 4.2 Buena Vista Creek Watershed Watershed Overview The Buena Vista Creek Watershed is the fourth-largest system within the Carlsbad Hydrologic Unit. The watershed extends approximately
Markets for Ecosystem Services on Agricultural Lands: Experience and Outlook in the United States
 Markets for Ecosystem Services on Agricultural Lands: Experience and Outlook in the United States Frank Casey Conservation Economics and Finance Program Defenders of Wildlife Presented at the Biodiversity
Proposed Terms of Reference for EIA studies
 1 Proposed Terms of Reference for EIA studies Base line data collection will be collected for the Post-Monsoon season 2016 (September to November 2016) in study area and 10 kms radius from project site.
Greater Los Angeles County Region
 Attachment 6 Greater Los Angeles County Region IRWM Implementation Grant Proposal Monitoring, Assessment, and Attachment 6 consists of the following items: Monitoring, Assessment, and. The purpose of this
UNITED STATES DISTRICT COURT DISTRICT OF MINNESOTA
 UNITED STATES DISTRICT COURT DISTRICT OF MINNESOTA ANIMAL PROTECTION INSTITUTE, and CENTER FOR BIOLOGICAL DIVERSITY, Civil File No. 06-3776 (MJD/RLE) Plaintiffs, vs. MARK HOLSTEN, in his official capacity
Water and Wastewater Challenges for San Antonio 2013
 Water and Wastewater Challenges for San Antonio 2013 Kelley Neumann, P. E. Senior Vice President / Strategic Resources September 11, 2013 San Antonio Women s Chamber of Commerce Water Operations Growth
Texas Commission on Environmental Quality Page 1 Chapter 7 - Memoranda of Understanding
 Texas Commission on Environmental Quality Page 1 7.101-7.104, 7.110-7.119, 7.121-7.127 Effective September 26, 2013 7.101. Memorandum of Understanding between the Texas Department of Commerce and the Texas
SUMMARY OF MAJOR RHCP REVISIONS
 MEMORANDUM DATE: March 4, 2009 TO: FROM: SUBJECT: Hays County RHCP Amanda Aurora and Clifton Ladd Application Draft Hays County RHCP - Summary of Major Edits and Response to Comments from the Third Draft
The North State: Implementing the California Water Action Plan February 24, 2014
 The North State: Implementing the California Water Action Plan February 24, 2014 The North State Water Alliance applauds Governor Brown s California Water Action Plan (Action Plan) and his call for comprehensive
Questions and Answers: Scoping for Southwestern Willow Flycatcher Critical Habitat Proposal
 U.S. Fish and Wildlife Service Questions and Answers: Scoping for Southwestern Willow Flycatcher Critical Habitat Proposal Arizona Ecological Services Field Office http://arizonaes.fws.gov Q: Why is the
Clean Water Services. Ecosystems Services Case Study: Tualatin River, Washington
 Viewed broadly, the concept of ecosystem services describes the many resources and services provided by nature. Typically, traditional planning and development practices do not adequately represent the
STATEMENT OF JOSEPH G. PIZARCHIK, DIRECTOR OFFICE OF SURFACE MINING RECLAMATION AND ENFORCEMENT U.S. DEPARTMENT OF THE INTERIOR BEFORE THE
 STATEMENT OF JOSEPH G. PIZARCHIK, DIRECTOR OFFICE OF SURFACE MINING RECLAMATION AND ENFORCEMENT U.S. DEPARTMENT OF THE INTERIOR BEFORE THE COMMITTEE ON ENVIRONMENT AND PUBLIC WORKS U.S. SENATE ON THE IMPLICATIONS
Chapter 3 Planning Issues, Opportunities, and Constraints
 Chapter 3 Planning Issues, Opportunities, and Constraints Introduction This chapter describes the key factors planning issues, opportunities, and constraints that influenced development of this RMP/EA.
Market-based Groundwater Allocation: Considerations for Arizona from the Texas Edwards Aquifer Cap and Trade System
 Market-based Groundwater Allocation: Considerations for Arizona from the Texas Edwards Aquifer Cap and Trade System Zachary P. Sugg Ph.D. Student University of Arizona School of Geography and Development
INFORMATION SHEET ORDER NO. R5-2011-XXXX TRIANGLE ROCK PRODUCTS, INC. FLORIN ROAD AGGREGATE PLANT SACRAMENTO COUNTY
 ORDER NO. R5-2011-XXXX INFORMATION SHEET Background Triangle Rock, Inc. (Discharger) submitted a Report of Waste Discharge (RWD) on 23 August 2010. The Discharger is expanding the mining operations at
City of Inglewood Well No. 2 Rehabilitation. City of Inglewood Thomas Lee
 City of Inglewood Well No. 2 Rehabilitation City of Inglewood Thomas Lee Project Location (Photos and location maps of the project) Project Description The City of Inglewood (City)receives its annual potable
State and Territory Coastal Management Program Managers
 MEMORANDUM FOR: FROM: SUBJECT: State and Territory Coastal Management Program Managers Jeffrey R. Benoit Director Final Program Change Guidance Attached is the Office of Ocean and Coastal Resource Management
Pajaro River Watershed Integrated Regional Water Management Plan Update Project Solicitation Form
 Pajaro River Watershed Integrated Regional Water Management Plan Update PROJECT OVERVIEW General Project Information Project Title: Corralitos Creek Water Supply and Fisheries Enhancement Project Project
NATIONAL MARINE FISHERIES SERVICE INSTRUCTION 02-110-17
 Department of Commerce $ National Oceanic & Atmospheric Administration $ National Marine Fisheries Service NATIONAL MARINE FISHERIES SERVICE INSTRUCTION 02-110-17 Protected Resource Management Endangered
Niki L. Pace, Research Counsel Mississippi Alabama Sea Grant Legal Program September 15, 2009
 Niki L. Pace, Research Counsel Mississippi Alabama Sea Grant Legal Program September 15, 2009 What is a land trust? A land trust is a private, nonprofit organization whose mission is the acquisition and
CITY OF POMPANO BEACH Broward County, Florida
 RESOLUTION NO. 2015-399 CITY OF POMPANO BEACH Broward County, Florida A RESOLUTION OF THE CITY COMMISSION OF THE CITY OF POMPANO BEACH, FLORIDA, OPPOSING THE OIL DRILLING PERMIT APPLICATION SUBMITTED BY
FLOOD PROTECTION AND ECOSYSTEM SERVICES IN THE CHEHALIS RIVER BASIN. May 2010. Prepared by. for the. 2010 by Earth Economics
 FLOOD PROTECTION AND ECOSYSTEM SERVICES IN THE CHEHALIS RIVER BASIN May 2010 Prepared by for the Execubve Summary The Chehalis Basin experienced catastrophic flooding in 2007 and 2009. In response, the
STATE UNIVERSITY OF NEW YORK COLLEGE OF TECHNOLOGY CANTON, NEW YORK COURSE OUTLINE ESCI 101 - INTRODUCTION TO ENVIRONMENTAL SCIENCE
 STATE UNIVERSITY OF NEW YORK COLLEGE OF TECHNOLOGY CANTON, NEW YORK COURSE OUTLINE ESCI 101 - INTRODUCTION TO ENVIRONMENTAL SCIENCE Prepared By: Rajiv Narula, Ph.D. SCHOOL OF SCIENCE, HEALTH, AND CRIMINAL
Federal Energy Regulatory Commission 5.1
 Federal Energy Regulatory Commission 5.1 period prescribed for making such payment, interest and penalty charges will be assessed. Interest and penalty charges will be computed in accordance with 31 U.S.C.
DEQ Response to Comments regarding the Public Notice for a Coal Mining Project in the Panther Creek watershed In Craig and Nowata Counties.
 DEQ Response to Comments regarding the Public Notice for a Coal Mining Project in the Panther Creek watershed In Craig and Nowata Counties. There were 10 comments received in response to an April 14, 2014
Water management planning for Naurzum National Nature Reserve, Kazakhstan. Abstract. By Y. A. Bragin
 SIBERIAN CRANE WETLAND PROJECT TECHNICAL BRIEF SIBERIAN CRANE WETLAND PRO ECT Water management planning for Naurzum National Nature Reserve, Kazakhstan By Y. A. Bragin Abstract The closed hydrological
33 CFR PART 332 COMPENSATORY MITIGATION FOR LOSSES OF AQUATIC RESOURCES. Authority: 33 U.S.C. 401 et seq. ; 33 U.S.C. 1344; and Pub. L. 108 136.
 33 CFR PART 332 COMPENSATORY MITIGATION FOR LOSSES OF AQUATIC RESOURCES Authority: 33 U.S.C. 401 et seq. ; 33 U.S.C. 1344; and Pub. L. 108 136. Source: 73 FR 19670, Apr. 10, 2008, unless otherwise noted.
NUCLEAR REGULATORY COMMISSION. [Docket No. 72-27; NRC-2011-0115] Pacific Gas and Electric Company;
![NUCLEAR REGULATORY COMMISSION. [Docket No. 72-27; NRC-2011-0115] Pacific Gas and Electric Company;](/thumbs/27/12155546.jpg "NUCLEAR REGULATORY COMMISSION. [Docket No. 72-27; NRC-2011-0115] Pacific Gas and Electric Company;") This document is scheduled to be published in the Federal Register on 09/16/2013 and available online at http://federalregister.gov/a/2013-22468, and on FDsys.gov [7590-01-P] NUCLEAR REGULATORY COMMISSION
This document is scheduled to be published in the Federal Register on 09/16/2013 and available online at http://federalregister.gov/a/2013-22468, and on FDsys.gov [7590-01-P] NUCLEAR REGULATORY COMMISSION
- POLICY - Disaster Recovery Assistance Program
 August 29, 2013 - POLICY - Disaster Recovery Assistance Program Overview Disasters and emergency legislative funding occur frequently and usually unpredictably. These characteristics require a standard
Remaining Wetland Acreage 1,500,000 915,960 584,040-39%
 NEW JERSEY Original Wetland Acreage Remaining Wetland Acreage Acreage Lost % Lost 1,500,000 915,960 584,040-39% New Jersey Wetlands: Nearly 99 percent of New Jersey s wetlands are palustrine or estuarine.
Briefing Paper on Lower Galveston Bay and Bayou Watersheds Lower Bay I: Armand Bayou to Moses Lake and Adjacent Bay Waters
 Briefing Paper on Lower Galveston Bay and Bayou Watersheds Lower Bay I: Armand Bayou to Moses Lake and Adjacent Bay Waters Jim Lester, PhD. and Lisa Gonzalez Houston Advanced Research Center Galveston
Water Resources Review Committee
 Water Resources Review Committee Members of the Committee Representative Randy Fischer, Chair Senator Gail Schwartz, Vice-Chair Senator Greg Brophy Senator Mary Hodge Senator Matt Jones Senator Ellen Roberts
2008 Compensatory Mitigation Rule: Overview and Highlights. Jenny Thomas U.S. Environmental Protection Agency Wetlands Division July 2014
 2008 Compensatory Mitigation Rule: Overview and Highlights Jenny Thomas U.S. Environmental Protection Agency Wetlands Division July 2014 Outline Background Rule goals Rule structure 8 sections Highlight
COMMUNITY CERTIFICATIONS
 National Flood Insurance Program Community Rating System COMMUNITY CERTIFICATIONS Public reporting burden for this form is estimated to average 4 hours for annual recertification, per response. The burden
MEPC 56/23 ANNEX 2 Page 1 ANNEX 2 RESOLUTION MEPC.162(56) Adopted on 13 July 2007
 Adopted on 13 July 2007") Page 1 RESOLUTION MEPC.162(56) Adopted on 13 July 2007 GUIDELINES FOR RISK ASSESSMENT UNDER REGULATION A-4 OF THE BWM CONVENTION (G7) THE MARINE ENVIRONMENT PROTECTION COMMITTEE, RECALLING Article 38(a)
Page 1 RESOLUTION MEPC.162(56) Adopted on 13 July 2007 GUIDELINES FOR RISK ASSESSMENT UNDER REGULATION A-4 OF THE BWM CONVENTION (G7) THE MARINE ENVIRONMENT PROTECTION COMMITTEE, RECALLING Article 38(a)
Environmental Protection Information Center
 Sent via electronic mail and certified mail on date shown below, return receipt requested May 9, 2014 State Water Resources Control Board Office of Chief Counsel Jeannette L. Bashaw, Legal Analyst 1001