Using Prophet JavaCharts
|
|
|
- Leon Jones
- 10 years ago
- Views:
Transcription
1 Using Prophet JavaCharts Welcome to the Most Powerful Charts on the Web! Prophet Financial Systems, Inc. All rights reserved.

2 Contents Using Prophet JavaCharts Chart Basics...4 Creating a Chart...4 Enlarging the Chart...5 Reading Market Data and Study Values...5 Zooming In, Zooming Out...6 Changing the Cursor Guide...6 Streaming Charts...7 Trouble With Streaming...7 Viewing Multiple Charts...8 Technical Studies...9 Adding Lower Studies / Multiple Indicator Windows...9 Applying Studies on Studies...10 Combining Lower Studies...11 Changing Study Parameters...11 Saving Your Studies / Creating Study Sets...12 Creating Comparison Charts...13 Drawing Tools Adding Trendlines...14 Changing the Color of a Trendline...14 Deleting Trendlines and Other Drawn Objects...14 Drawing Channels...15 Adding a Horizontal Price Level...16 Adding Text Notes...16 Highlighting Areas of the Chart...17 Fibonacci Studies Fibonacci Basics...18 Fibonacci Retracement Levels...19 Fibonacci Fans...20 Fibonacci Arcs...21 Fibonacci Time Zones...22 Customizing Fibonacci Levels...23 Customizing the Chart Appearance Saving Chart Styles...24 Adding Space at the Right Edge of the Chart...26 Adjusting Expanded Area Size...27 Resetting the Chart...27 Prophet JavaCharts : 2

3 Using Watch Lists in JavaCharts Managing Your Watch Lists...28 Flipping Quickly Through Your Charts...28 Keyboard Shortcut for Flip Charts...29 Tagging Symbols in Your Watch Lists...29 Using Move and Copy to Manage Your Watch Lists...29 Adjusting the Left-Panel Size...30 View by Company Name or Symbol...30 Stock Information Looking Up a Stock Symbol...31 Viewing Stock News...31 Finding the Ratio for a Stock Split (Yellow Triangles)...32 Charting Futures Markets Futures Symbology...33 Month Codes for Futures Contracts...33 Open Interest...34 Futures Data from the GLOBEX...34 Continuous Futures Contracts...35 Using the Futures Wizard...35 Charting Stock Options Options Symbology...39 The Options Wizard...40 Sharing Charts & Ideas Printing Charts...42 Sending Charts Via Sending Feedback / Requesting New Features...43 Troubleshooting Restart the Browser...44 Clear the Cache...44 Run a Browser Check...44 Contact Prophet for Assistance...44 Prophet JavaCharts : 3

4 Chart Basics This manual provides a complete overview of features in Prophet JavaCharts. Some power features are available with a Prophet.Net Premium Membership: n n n Gold maximum power, personalization, and convenience, at a fraction of the price of competing software-based systems. Real-time data available for equities, options, and futures Silver the best value for active equities traders. Includes streaming charts, quotes, and portfolios Bronze for savvy investors and chartists who don t require live market data For information about memberships at Prophet.Net, follow this link: n Creating a Chart To chart a stock, enter its stock symbol in the Symbol field and click Go (or press Return). You can choose from five different chart types using the menu next to the Go button; the default chart style is a Bar chart showing open, high, low, and close values. Additional menus let you change the chart duration - from 1 to 60 days of intraday data, or from 1 month to over 30 years of daily stock data - as well as the chart frequency. The chart frequency is the period of time represented by a single bar, point, or candle on the graph. You can vary the frequency to control the density of the graph. You can also select a specific date range by choosing Custom in the Duration menu. Prophet JavaCharts : 4

5 Enlarging the Chart You can resize Prophet JavaCharts to fill the entire screen. The JavaCharts applet starts attached to the browser page. Click the Detach button in the lower-left corner to float the applet. Once the applet is detached, you can resize the charts and adjust the aspect ratio by dragging the lower-right corner of the applet. Or doubleclick the title bar to make the applet fill the entire screen. Reading Market Data and Study Values For historical price quotes, move the cursor over the price bar that you are interested in and read the data below the stock name. D shows the date for the bar that your mouse is currently over. O is the opening price, H is the high, L is the low, and C is the close. R represents the day s range, or the difference between the day s high and low. Y is the current position of cursor on the price axis. Lower study values are shown in each indicator window. To read the value on an upper study, such as moving average or PSAR, hold the cursor over the point of interest and read the Y value from the data display. Prophet JavaCharts : 5

6 Zooming In, Zooming Out To zoom in on a portion of the main chart, click and drag your mouse from the starting date to the end date. The chart will redraw with just the time period you are interested in, which makes it easier to see the details. To return to the full duration of the chart, double-click the chart or select Unzoom from the Tools menu at the top of the chart. You can also zoom in and out using the magnifying glass icons at the bottom of the applet. Clicking each icon zooms in (or out) by half the chart duration. Once you ve zoomed in, use the scroll bar to pan across the chart. Changing the Cursor Guide Different cursors can help you draw accurate trendlines and read specific dates and prices more easily. You can toggle between a red vertical line, a red horizontal line, a red set of crosshairs, or an arrow. Click the square button at the bottom of the applet, next to the magnifying glass icons, until it reaches your preferred cursor type. Prophet JavaCharts : 6
 by half the chart duration.")
7 Streaming Charts To activate streaming, click the Streaming Charts checkbox at the lowerleft panel. Whether you choose bar frequencies of 1 minute or 2 hours, you ll see the latest quote updating on the price axis, as well as in the upper-left panel. With real-time data, you ll also be able to view live bid/ask values. Trouble With Streaming For most users, the default Turbo streaming mode provides optimal performance for streaming charts. However, if your system is unable to use Turbo streaming, you can use an alternate streaming method. To switch from Turbo Streaming mode to Standard Streaming mode, click on Tools menu, Settings, and select Standard Streaming. Prophet JavaCharts : 7

8 Viewing Multiple Charts With JavaCharts, you can view multiple charts without loading additional browser pages. To create another chart, click the Clone button at the lower-left of the applet. If you have saved Chart Styles, choose a Chart Style from the menu that appears when you click Clone. Prophet JavaCharts : 8

9 Technical Studies Adding Lower Studies / Multiple Indicator Windows You can add studies one-by-one by using the tree in the left panel. (If you wish to make the left panel wider, use the Tools menu to choose the Left- Panel Size.) Additionally, you can show multiple studies by adding them via the Technical Studies dialog box. From the Tools menu, select the Studies submenu and choose Apply Studies. (The menu appears at the top of the applet; you can also right-click on the chart to invoke the menu.) To select a study, click on the study name in the scrolling list and then click Add. Each lower study will be shown in a separate indicator window, unless Superimpose Lower Studies is checked. Prophet JavaCharts : 9
 To select a study, click on the study name in the scrolling list and then click Add.")
10 Click Show Last Value to display the last value in the indicator legend. Applying Studies on Studies In addition to applying studies to a stock s price, you can also apply some studies (such as Moving Averages) to the Volume and other lower studies that you ve added. To select the subject of your study (the default selection is Price), choose from the available options in the dialog box. Prophet JavaCharts :
, choose from the available options in the")
11 Combining Lower Studies Some technicians find it useful to superimpose two studies in a single indicator window. You can overlay the same study with different parameters, or combine two or more different studies. First choose Apply Studies from the Tools menu. Add the studies you wish to use, and then check the box labeled Superimpose Lower Studies. Changing Study Parameters Most studies include parameters - such as a percentage or a movingaverage period - that can be varied to suit your particular trading style. To change the parameters of a study, select Apply Studies from the Tools menu. When you select a study from the list, the parameters you can alter appear in editable fields. Once you ve entered new numbers in the available fields, click Add to apply the modified study to the chart. Prophet JavaCharts :

12 Saving Your Studies / Creating Study Sets Once you ve created a custom study or group of studies, you can save it as a Custom Study Set. From the Tools menu, choose Apply Studies from the Studies submenu. Create your study set and click Save. You will be prompted to give the study set a name. To edit an existing study set, select the study set from the menu at the top of the dialog box; the component studies will load in the lower window. You can select a study, change a parameter, and then click Update to automatically update and save the study set. If you do not wish to update the saved study set, use the Add and Remove buttons to change the combination of studies. You can click Save to save this group as a new Custom Study Set; enter a new name when prompted. Through My Studies, you ll be able to access your study sets with just a click and use them again in later sessions. Prophet JavaCharts :

13 Creating Comparison Charts You can compare different financial instruments to one another, such as a stock to any number of indices and stocks. From the Tools menu, locate the Studies submenu and choose Comparison Chart. Select an index from the list or enter a symbol in the field; then click Add until you re finished specifying the issues for comparison. When finished, click Close. Prophet JavaCharts :

14 Drawing Tools Adding Trendlines To draw a trendline on the chart, click on the starting point and then click again where you want the line to end. You can draw a trendline on the price graph or on any of the lower indicator windows. Changing the Color of a Trendline After drawing a trendline, hold the cursor over the trendline and rightclick. (If you're using a Mac, use Command-click instead of right-click.) A menu appears; choose Next Color to change the color of the trendline. Deleting Trendlines and Other Drawn Objects To delete a trendline (or other drawn object), first hold the mouse over a trendline; the cursor turns into a hand. Next, right-click and select Delete This Item from the menu. You can also choose to Redraw This Item or Delete All Items from this menu. Prophet JavaCharts :
, first hold the mouse over a trendline; the cursor turns into a hand.")
15 With this same menu, you can also choose to draw another object of the same type. If you accidentally start a trendline (i.e., the trendline becomes anchored at a starting point that you do not wish to use), you can drop it by pressing the Escape key on the keyboard, or by clicking the right mouse button. Drawing Channels To draw a channel comprising two parallel trendlines, first choose Channel from the Drawing Tools submenu of the Tools menu. Next, draw the first trendline by clicking start and end points on the price graph. After the first line is drawn, the cursor will show a second, parallel line. Move the mouse to adjust this line and click to anchor it on the chart. After the channel is completed, the trendline becomes the active drawing tool. Prophet JavaCharts :

16 Adding a Horizontal Price Level To draw a horizontal price level, first choose Price Level from the Drawing Tools submenu of the Tools menu. Click the price graph once to create a horizontal line; you can move the mouse to adjust the line s placement. Click again to anchor the line. After the price level is drawn, the trendline becomes the active drawing tool. Adding Text Notes You can add text notes to the price chart, as well as to any of the lower indicator windows. To add a text note to a chart, first choose Text Note from the Drawing Tools submenu of the Tools menu. Click the location for the text note, and then enter the note text in the dialog box that appears. After the note is entered, the trendline becomes the active drawing tool. Prophet JavaCharts :

17 Highlighting Areas of the Chart You can draw light-yellow ovals to highlight areas of the chart. From the Tools menu, locate the Drawing Tools submenu and choose Oval. Click once to anchor the oval. Move the mouse to adjust the oval, and click again to set the highlighted area. Prophet JavaCharts :

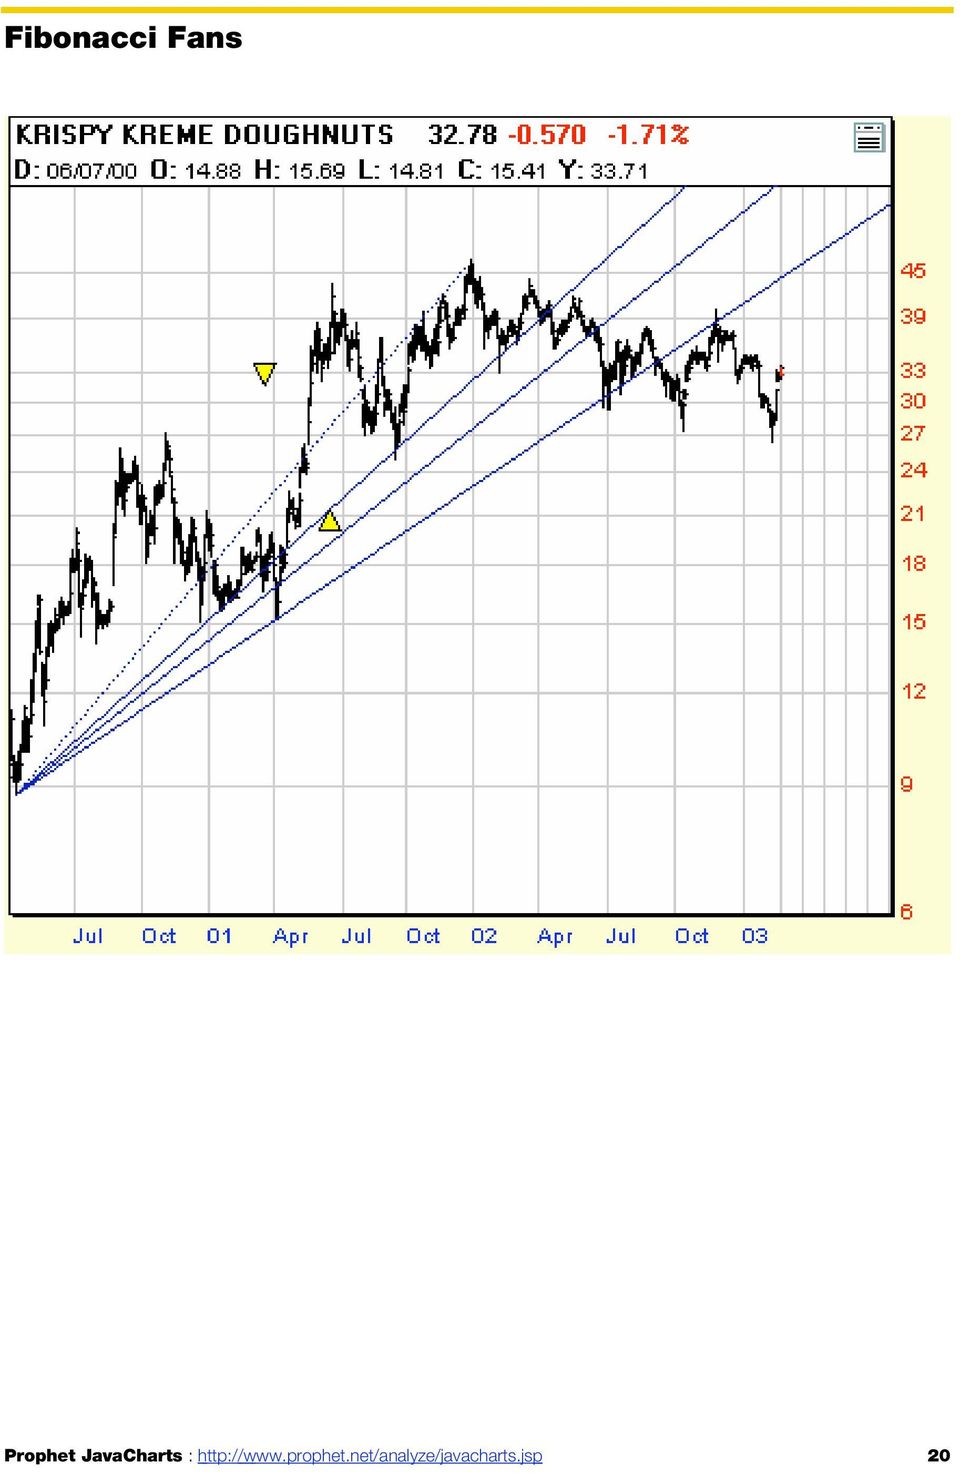
18 Fibonacci Studies Fibonacci studies are a premium option available to Gold members at Prophet.Net. The available types of interactive tools available are: n n n n Retracement levels Fans Arcs Time zones (time series) Fibonacci values and line styles can be customized in Prophet JavaCharts. Additionally, multiple Fibonacci studies, as well as other technical studies, may be applied to a single chart. Fibonacci Basics Prophet JavaCharts features interactive Fibonacci tools retracement levels, fans, arcs, and time zones (or time series) for historical and intraday charts. They can show implied levels of support and resistance, as well as potential pivot points, for various securities. To use a Fibonacci tool: First click on the Tools Menu, and choose the study type from the Drawing Tools submenu. Click the desired anchor points on the price chart to draw the study. Generally, these studies are drawn from peak-to-trough (or vice-versa). Example charts showing each Fibonacci tool follow. Prophet JavaCharts :
 for historical and intraday charts.")
19 Fibonacci Retracement Levels Prophet JavaCharts :

20 Fibonacci Fans Prophet JavaCharts :
21 Fibonacci Arcs Prophet JavaCharts :
22 Fibonacci Time Zones Prophet JavaCharts :
23 Customizing Fibonacci Levels You can customize Fibonacci Levels. From the Tools menu, locate the Drawing Tools submenu and choose Customize Fibonacci. A Fibonacci Settings dialog box will appear with value fields and choices for the line style of each level. To hide a level, uncheck the box adjacent to the level to be hidden. Click Reset to restore the default values. Prophet JavaCharts :
24 Customizing the Chart Appearance Saving Chart Styles You can create different chart views and save them for easy access in the future. First set up the chart with the preferences you wish to save; then, from the Tools menu, locate the Chart Styles submenu and select Save Style. For example, you might create the following styles: n n n n Streaming Intraday: 1 day, 1 minute chart, streaming, expanded 60-Day Close-Up: 60 day, 2 hour charts with colors Candle View: 1 month, daily candlesticks Long-Term Perspective: 4 years, weekly, expanded Prophet JavaCharts :
25 When saving chart styles, you can also include studies. Or apply studies after applying the chart style; it s up to you! For information about saving custom study sets, please refer to the Technical Studies section. You ll find your saved Chart Styles in the My Styles folder in the left panel of the applet. Initially no styles will appear here. But as you create and save styles, they will be available to you anytime, anywhere you re signed in. Additionally, when you Clone a chart, you will notice a pop-up menu where you can set the Chart Style for the new clone. Prophet JavaCharts :
26 Adding Space at the Right Edge of the Chart You can add space at the right edge of the chart by checking the box labeled Expand Chart. This feature is particularly useful for projecting trendlines, channels, and other drawn objects that extend into the expanded area. When the chart is expanded, you can read future dates and the price (Y) value of the cursor in the data line. Prophet JavaCharts :
27 Adjusting Expanded Area Size Checking Expand Chart adds space to the right of the chart; you can adjust the amount of additional space. From the Tools menu, choose a size from the Expanded Area submenu. Resetting the Chart To reset charts to 1-year daily chart and remove all technical studies, choose Reset Chart from the Tools menu. You also have the option to delete the drawn objects from the chart. Prophet JavaCharts :
28 Using Watch Lists in JavaCharts Managing Your Watch Lists The symbols from your Watch List are shown in the left panel. You can edit your Watch List while using JavaCharts by selecting Watch List submenu from the Tools menu and choosing Add Symbol to List. Similarly, you can delete a symbol from your Watch List by selecting Delete Symbol from List or by right-clicking the symbol in the leftpanel and selecting Delete from the menu that appears. Flipping Quickly Through Your Charts Below the left panel are the Flip Charts buttons, which enable you to quickly flip through the charts in any Watch List. First set up the chart appearance; choose the preferred Chart Style and Study Set, if you have them stored. Next, select the first symbol in any Watch List. To view the next chart in the Watch List, click the single arrow to view the next chart on the list. To back up, click the single-back arrow. To skip to the next tagged symbol or the end of the list, click the double-forward arrow. Note that the chart settings and studies persist from chart to chart. Prophet JavaCharts :
29 Keyboard Shortcut for Flip Charts You can use the Up and Down Arrow keys on your keyboard to speed through any symbol list shown in the left panel of JavaCharts. To jump to to tagged symbols, hold down the Control key while using the Up and Down Arrow keys. Tagging Symbols in Your Watch Lists As you find interesting opportunities, you may wish to flag specific charts of interest. Tagging is a convenient way to make symbols stand out. When you choose Tag This Symbol from the Tools menu (in the Watch Lists submenu), the active symbol will appear in boldface. Alternately, you can right-click the symbol in the left-panel and select Tag Symbol from the menu that appears. Using Move and Copy to Manage Your Watch Lists You can organize your trading ideas by keeping watch lists, such as Oversold Stocks, Momentum Stocks, Short Candidates, Long Positions, etc. As you proceed with your analysis, you can move or copy a stock from one list to another for example, from Oversold to Long Positions. The difference between Move and Copy is that Move removes a given symbol from the current list and moves it into a different list. Copy, however, leaves the symbol in its original list. Right-click a stock under a watch list in JavaCharts and choose either Copy to List or Move to List. Prophet JavaCharts :
30 Adjusting the Left-Panel Size To adjust the width of the left panel, choose Left-Panel Size from the Tools menu and make your selection from the submenu that appears. View by Company Name or Symbol You can choose whether you wish to view Watch Lists by Company name or Symbol. From the Tools menu, locate the Watch Lists submenu and choose View by Company Name or View by Symbol. Prophet JavaCharts :
31 Stock Information Looking Up a Stock Symbol To look up the symbol for a company or fund, click the word Symbol at the upper-right of the applet. Then click Look Up Symbol and use the Search box that appears. Viewing Stock News Many traders find it useful to have access to news when viewing stock charts. To read the latest news on a particular company, choose News & Research Links from the Tools menu. Prophet JavaCharts :
32 Finding the Ratio for a Stock Split (Yellow Triangles) A yellow triangle on the price graph indicates that a split occurred on that date. To read the split ratio, hold the cursor over the yellow triangle. Prophet JavaCharts :
33 Charting Futures Markets Prophet has historical data on over different 300 futures (sometimes called commodities) markets from around the world. This data goes back as far as 1959 and can be viewed as either a regular futures contract or a synthetic continuous contract in JavaCharts. Futures Symbology The fastest way to view a futures chart is to enter the symbol directly. There are two formats available for specifying futures contracts. n Symbol + Year + Month Code (note: you do not type the + sign) Examples: SP99Z, C02H, W03H n Symbol + 4 digit Date (note: you do not type the + sign) Examples: SP9912, C0203, W0303 Month Codes for Futures Contracts The month codes for futures symbols are: Month January February March April May June July August September October November December Month Code F G H J K M N Q U V X Z Prophet JavaCharts :
34 Open Interest When you enter a futures symbol, the graph is shown with the standard price and volume data, and a red open interest line is displayed in the volume graph. This line does not appear for stocks, since stocks do not have an open interest.. Futures Data from the GLOBEX If you want to fetch quotes from the GLOBEX on an intraday basis, precede the symbol with sign. Prophet JavaCharts :
35 Continuous Futures Contracts Prophet also makes synthetic continuous contracts available to give you a better long-term perspective. Two styles of contracts are available: nonadjusted and adjusted. Both of these types of continuous contracts are created by chaining together individual contracts based on volume. Each front month, based on the highest volume contract, is used for every portion of the assembled continuous contract. Sometimes there is a substantial price difference when a contract rolls forward. That is, even though they represent the same market, two different contract months may have an unusually large difference in price. This is particularly truly of some agricultural commodities. An adjusted contract eliminates this gap in order to portray a more useful long-term chart. These contracts are forward-adjusted, which means that their recent prices will have no correlation to their true market price. You can view charts for Continuous Contracts by entering the root symbol plus 1600 for non-adjusted, or 1700 for adjusted contracts. For Example: Use S1600 for a non-adjusted graph on continuous contracts for soybeans. Use W1700 for a graph of adjusted contracts for wheat. Using the Futures Wizard Because there is such a large variety of futures on the market, and because the months they trade vary, it is difficult to know what symbol is appropriate for a given market. The Prophet Futures Wizard makes this task easy. To invoke the Futures Wizard, click Symbol (to the left of the symbol entry box), and choose Futures Wizard from the menu. Prophet JavaCharts :
36 The following dialog box appears: The first dropdown is for a futures group. Choose a group (such as Grains, Foods, or Energy) that represents the broad market of interest to you. The next dropdown, for markets, is then populated with the markets belonging to that group. So, instead of having to choose from a list of over 300 symbols, you can look at the relatively small set belonging to the group you have already chosen. When you choose your market, the available months and years are provided in the last two dropdown menus, and the front month for that market is automatically selected. You can click Get Chart at this point, or you can choose a different month or year to display.
37 Additional options are available on the Futures Wizard, as well. Overlay Cash will display the cash market (if the data is available) on top of the futures graph so you can see how these two markets move with relation to each other. Clicking the Continuous Contracts button will automatically display the non-adjusted continuous contract of a market. Viewing a continuous contract can give you a much longer-term view of a market, since they can span decades, instead of the relatively brief lifespan of a typical futures contract. Prophet JavaCharts :
38 Charting Stock Options Prophet JavaCharts offers data on all the U.S.-traded stock and equity options. If you know the symbol for an option typically 5 characters long enter a period (. ) followed by the symbol; then click Go to display the price chart. Prophet JavaCharts :
39 Options Symbology The first three alphabetic characters following the dot (. ) are used to represent the option root. The option root does not necessarily correspond to the underlying stock symbol. In the case of IBM, it does. In the case of Apple Computer (stock symbol AAPL, root symbol AAQ) the symbols are different. If you do not know the root symbol for an option, the fastest way to find it is through the Options Chains page at Prophet.Net. n Prophet.Net : Quotes : Options Chains On the Options Chains page, enter the regular stock symbol (e.g., AAPL) and all the available options symbols will be displayed. Next is the month/type, which can be any 1 of 24 possible alphabetic characters. This is the 4th character of the symbol, and it shows not only if it s a put or a call, but also what the month expiration is. Month Call Put January A M February B N March C O April D P May E Q June F R July G S August H T September I U October J V November K W December L X So, in the case of.ibmpb, the 4th character is P, which means the symbol refers to an April put.
40 Finally, the 5th character is the strike price. Because there are only 26 letters in the alphabet, but far more possible strike prices, there is a lot of recycling. So A might be $5, $105, $205, $305, etc. You have to know what the strike price is to have an educated guess as to what is really being stated. Strike Code Price Strike Code Price A $5.00 M $65.00 B $10.00 N $70.00 C $15.00 O $75.00 D $20.00 P $80.00 E $25.00 Q $85.00 F $30.00 R $90.00 G $35.00 S $95.00 H $40.00 T $ I $45.00 U 7.50 J $50.00 V $12.50 K $55.00 W $17.50 L $60.00 X $22.50 The Options Wizard Figuring out a stock option symbol can be difficult, and the options wizard built into JavaCharts can help you. To invoke the Options Wizard, click on the word Symbol to the left of the symbol entry box, and choose Options Wizard from the dropdown menu that appears.
41 First, enter the root of the stock option and choose whether you want to view a Put or a Call. Next, choose the expiration you want to see. The year is not necessary, since you are simply choosing the forthcoming instance of the month you choose. For instance, if it is April, and you choose May from the dropdown, the wizard assumes you mean May of the present year. If you chose January, the system will assume you meant January of the next year. Lastly, choose the Strike Price and click Get Chart. For help with the symbology, click on Symbol Help in the wizard for further information.
42 Sharing Charts & Ideas Printing Charts To print a chart, choose Print Chart from the Tools menu. You ll see a new browser window with a picture of your chart. Use the browser s Print command to print the chart. For most printers, you will need to print the chart at a reduction. To do this, choose Print Preview (if available) from the File menu of the browser. Depending on your printer driver, you may be able to locate a selection that allows the printed image to Fit on One Page or Shrink Page to Fit. Or choose Page Setup and enter a percent reduction. The reduction amount will depend on your printer and the size of chart you re working with. Depending on the aspect ratio of your chart, you may also wish to change the Page Setup to print the chart in landscape (vs. portrait) orientation. If you use the crosshairs-style cursor when working with the chart, you may wish to change to an invisible cursor (no lines) when printing the chart. Prophet JavaCharts :
43 Sending Charts Via To a chart to a trading buddy, your broker, or a friend, choose Mail Chart from the Tools menu. You can add a note with your chart, such as Check out this great breakout! or Do you think I should buy this stock? The studies and other drawn objects will appear with the mailed chart. Your address is included in case your friend wants to write back. Rest assured that your privacy is protected; the information is not stored or re-used in any way. Sending Feedback / Requesting New Features We love to hear from you! Report a bug. Request a feature. Or just tell us we re doing a good job. us at [email protected] We can t always respond to feedback; however, we read all comments and keep track of the most requested features. For technical support, send your questions to [email protected] Prophet JavaCharts :
44 Troubleshooting Prophet JavaCharts is designed to behave like a software program that you access via your browser. It takes advantage of the Java engine built into most browsers. Restart the Browser If JavaCharts does not behave as expected, first try quitting and restarting the browser. Clear the Cache Depending on the cache setting of your browser, your system may cache older, expired versions of the JavaCharts applet. Consult the documentation for your browser for instructions on clearing the cache. Or contact [email protected] for assistance. Run a Browser Check If you see a large, gray box where the applet should appear, or if the applet behaves inconsistently, your browser may include an old or incompatible version of Java. Please follow this link to the Browser Check page: n Contact Prophet for Assistance If you are unable to resolve this problem through the Browser Check, please write to [email protected] and we will be pleased to assist you. Prophet JavaCharts :
Plotting: Customizing the Graph
 Plotting: Customizing the Graph Data Plots: General Tips Making a Data Plot Active Within a graph layer, only one data plot can be active. A data plot must be set active before you can use the Data Selector
Creating Drawings in Pro/ENGINEER
 6 Creating Drawings in Pro/ENGINEER This chapter shows you how to bring the cell phone models and the assembly you ve created into the Pro/ENGINEER Drawing mode to create a drawing. A mechanical drawing
Table of Contents. Introduction Opening A Demo Account Overview Market Watch (Quotes Window) Charts Navigator
 Charts Navigator") Table of Contents Introduction Opening A Demo Account Overview Market Watch (Quotes Window) Charts Navigator (Folder File) Trade Terminal (Your Account Details) New Order Execution News Service Account
Table of Contents Introduction Opening A Demo Account Overview Market Watch (Quotes Window) Charts Navigator (Folder File) Trade Terminal (Your Account Details) New Order Execution News Service Account
WEB TRADER USER MANUAL
 WEB TRADER USER MANUAL Web Trader... 2 Getting Started... 4 Logging In... 5 The Workspace... 6 Main menu... 7 File... 7 Instruments... 8 View... 8 Quotes View... 9 Advanced View...11 Accounts View...11
13 Managing Devices. Your computer is an assembly of many components from different manufacturers. LESSON OBJECTIVES
 LESSON 13 Managing Devices OBJECTIVES After completing this lesson, you will be able to: 1. Open System Properties. 2. Use Device Manager. 3. Understand hardware profiles. 4. Set performance options. Estimated
JUMP START INTO WINDOWS 10
 JUMP START INTO WINDOWS 10 Donna Payne WWW.THEPAYNEGROUP.COM Jump Start into Windows 10 There is a lot to celebrate with Microsoft Windows 10. There is the triumphant return of the Start button, more consolidation
Windows XP Pro: Basics 1
 NORTHWEST MISSOURI STATE UNIVERSITY ONLINE USER S GUIDE 2004 Windows XP Pro: Basics 1 Getting on the Northwest Network Getting on the Northwest network is easy with a university-provided PC, which has
NDA-30141 ISSUE 1 STOCK # 200893. CallCenterWorX-Enterprise IMX MAT Quick Reference Guide MAY, 2000. NEC America, Inc.
 NDA-30141 ISSUE 1 STOCK # 200893 CallCenterWorX-Enterprise IMX MAT Quick Reference Guide MAY, 2000 NEC America, Inc. LIABILITY DISCLAIMER NEC America, Inc. reserves the right to change the specifications,
User Guide. www.windsorbrokers.com. For more information email us on: [email protected]
 User Guide www.windsorbrokers.com For more information email us on: [email protected] CONTENTS Pages 1. Opening an account. 3-4 2. Server and account settings. 5-6 3. Market Watch
TRADE INTERCEPTOR CHARTING 4.0 USER MANUAL
 TRADE INTERCEPTOR CHARTING 4.0 USER MANUAL 1 Welcome to Trade Interceptor Charting 4.0 help file This help file has been created to give you a fast understanding of what's possible with Trade Interceptor
Intro to Excel spreadsheets
 Intro to Excel spreadsheets What are the objectives of this document? The objectives of document are: 1. Familiarize you with what a spreadsheet is, how it works, and what its capabilities are; 2. Using
Basic Introduction. GMFX MetaTrader 4.0. Basic Introduction
 GMFX GMFX About Got Money FX Got Money FX is an Australian owned and operated foreign exchange brokerage firm. We pride ourselves in offering our clients an honest and ethical trading environment. Clients
Internet Explorer 7. Getting Started The Internet Explorer Window. Tabs NEW! Working with the Tab Row. Microsoft QUICK Source
 Microsoft QUICK Source Internet Explorer 7 Getting Started The Internet Explorer Window u v w x y { Using the Command Bar The Command Bar contains shortcut buttons for Internet Explorer tools. To expand
Tutorials. If you have any questions, comments, or suggestions about these lessons, don't hesitate to contact us at [email protected].
 Tutorials The lesson schedules for these tutorials were installed when you installed Milestones Professional 2010. They can be accessed under File Open a File Lesson Chart. If you have any questions, comments,
Excel Project Creating a Stock Portfolio Simulation
 Background Vocabulary Excel Project Creating a Stock Portfolio Simulation 1. What is a stock? A stock is a share in the ownership of a corporation, a large business organization. A stock, also, represents
How to make a line graph using Excel 2007
 How to make a line graph using Excel 2007 Format your data sheet Make sure you have a title and each column of data has a title. If you are entering data by hand, use time or the independent variable in
BD CellQuest Pro Software Analysis Tutorial
 BD CellQuest Pro Analysis Tutorial This tutorial guides you through an analysis example using BD CellQuest Pro software. If you are already familiar with BD CellQuest Pro software on Mac OS 9, refer to
SMART Ink 1.5. Windows operating systems. Scan the following QR code to view the SMART Ink Help on your smart phone or other mobile device.
 SMART Ink 1.5 Windows operating systems User s guide Scan the following QR code to view the SMART Ink Help on your smart phone or other mobile device. Trademark notice SMART Ink, SMART Notebook, SMART
Data Visualization. Brief Overview of ArcMap
 Data Visualization Prepared by Francisco Olivera, Ph.D., P.E., Srikanth Koka and Lauren Walker Department of Civil Engineering September 13, 2006 Contents: Brief Overview of ArcMap Goals of the Exercise
Introduction to ProphetX Mini User Guide
 Introduction to ProphetX Mini User Guide Table of Contents User Interface... 3 Global ProphetX Preferences......3 Navigating ProphetX 3.x... 3 Docked Panes... 3 Context Tool Bar... 3 Split Views... 4 Tabbed
Introduction to MS WINDOWS XP
 Introduction to MS WINDOWS XP Mouse Desktop Windows Applications File handling Introduction to MS Windows XP 2 Table of Contents What is Windows XP?... 3 Windows within Windows... 3 The Desktop... 3 The
Custom Reporting System User Guide
 Citibank Custom Reporting System User Guide April 2012 Version 8.1.1 Transaction Services Citibank Custom Reporting System User Guide Table of Contents Table of Contents User Guide Overview...2 Subscribe
Website: http://www.metatraderglobal.com Twitter: http://twitter.com/metatraderlive/
 Website: http://www.metatraderglobal.com Twitter: http://twitter.com/metatraderlive/ About this book What is MetaTrader Global? MetaTrader Global is world s leading website portal dedicated to. We are
FastTrack Schedule 10. Tutorials Manual. Copyright 2010, AEC Software, Inc. All rights reserved.
 FastTrack Schedule 10 Tutorials Manual FastTrack Schedule Documentation Version 10.0.0 by Carol S. Williamson AEC Software, Inc. With FastTrack Schedule 10, the new version of the award-winning project
Introduction to Google SketchUp (Mac Version)
") Introduction to Google SketchUp (Mac Version) This guide is handy to read if you need some basic knowledge to get started using SketchUp. You will see how to download and install Sketchup, and learn how
Introduction to Google SketchUp (Mac Version) This guide is handy to read if you need some basic knowledge to get started using SketchUp. You will see how to download and install Sketchup, and learn how
Section 4. Mastering Folders
 Section 4 Mastering Folders About This Section Section 3: Working with Receipts introduced you to the Receipts Grid area of the Receipt Organizer window (the lower of the two grids). In the Receipts Grid,
Getting Started with Barchart Professional
 Getting Started with Barchart Professional Last Updated: 12/20/2010 Welcome to Barchart Professional! Professional a full-featured quote, chart and analysis software application that you download to your
Google Docs Basics Website: http://etc.usf.edu/te/
 Website: http://etc.usf.edu/te/ Google Docs is a free web-based office suite that allows you to store documents online so you can access them from any computer with an internet connection. With Google
CheckBook Pro 2 Help
 Get started with CheckBook Pro 9 Introduction 9 Create your Accounts document 10 Name your first Account 11 Your Starting Balance 12 Currency 13 Optional password protection 14 We're not done yet! 15 AutoCompletion
Converting to Advisor Workstation from Principia: The Research Module
 Converting to Advisor Workstation from Principia: The Research Module Overview - - - - - - - - - - - - - - - - - - - - - - - - - - - - - - - - - - - - - -1 Overview of the Research Module in Advisor Workstation
Getting Started with Excel 2008. Table of Contents
 Table of Contents Elements of An Excel Document... 2 Resizing and Hiding Columns and Rows... 3 Using Panes to Create Spreadsheet Headers... 3 Using the AutoFill Command... 4 Using AutoFill for Sequences...
User Guide 14 November 2015 Copyright GMO-Z.com Forex HK Limited All rights reserved.
 User Guide 14 November 2015 Copyright GMO-Z.com Forex HK Limited All rights reserved. Table of Contents Section ONE: Layout I. General View II. Quotes List III. Chart Window Section TWO: Drawing Tools
Triggers & Actions 10
 Triggers & Actions 10 CHAPTER Introduction Triggers and actions are the building blocks that you can use to create interactivity and custom features. Once you understand how these building blocks work,
Integrated Company Analysis
 Using Integrated Company Analysis Version 2.0 Zacks Investment Research, Inc. 2000 Manual Last Updated: 8/11/00 Contents Overview 3 Introduction...3 Guided Tour 4 Getting Started in ICA...4 Parts of ICA
How To Use Senior Systems Cloud Services
 Senior Systems Cloud Services In this guide... Senior Systems Cloud Services 1 Cloud Services User Guide 2 Working In Your Cloud Environment 3 Cloud Profile Management Tool 6 How To Save Files 8 How To
Trader s Guide 10.1.0.0
 Trader s Guide 10.1.0.0 September 2011 ONE BLUE HILL PLAZA, 10 TH FLOOR WWW.RITHMIC.COM ONE BLUE HILL PLAZA, 10 TH FLOOR 877 RITHMIC SALES PEARL RIVER, NEW YORK 10965-8689 877 408 0008 TECH SUPPORT Document
IFAS Reports. Participant s Manual. Version 1.0
 IFAS Reports Participant s Manual Version 1.0 December, 2010 Table of Contents General Overview... 3 Reports... 4 CDD Reports... 5 Running the CDD Report... 9 Printing CDD Reports... 14 Exporting CDD Reports
Chapter 14: Links. Types of Links. 1 Chapter 14: Links
 1 Unlike a word processor, the pages that you create for a website do not really have any order. You can create as many pages as you like, in any order that you like. The way your website is arranged and
WEBTrader. User Guide
 WEBTrader User Guide Table of Contents Creating a Demo account How to log in Main Areas of the WebTrader Market Watch Favorites Adding Favorites Spot Panes Charts Adding New Chart Using Charts Chart Options
Excel 2007 Basic knowledge
 Ribbon menu The Ribbon menu system with tabs for various Excel commands. This Ribbon system replaces the traditional menus used with Excel 2003. Above the Ribbon in the upper-left corner is the Microsoft
To download the latest version of TurboTick Pro go to http://www.turnkeybroker.com/download/turbotickpro/publish.html
 TurboTick PRO manual version 1.211 updated 12.7.2011 Getting started in TurboTick Pro TurboTick Pro is an advanced trading platform built for the active trader. With easy-to-use customizable screens, integrated
macquarie.com.au/prime Charts Macquarie Prime and IT-Finance Advanced Quick Manual
 macquarie.com.au/prime Charts Macquarie Prime and IT-Finance Advanced Quick Manual Macquarie Prime Charts Advanced Quick Manual Contents 2 Introduction 3 Customisation examples 9 Toolbar description 12
Outlook Email. User Guide IS TRAINING CENTER. 833 Chestnut St, Suite 600. Philadelphia, PA 19107 215-503-7500
 Outlook Email User Guide IS TRAINING CENTER 833 Chestnut St, Suite 600 Philadelphia, PA 19107 215-503-7500 This page intentionally left blank. TABLE OF CONTENTS Getting Started... 3 Opening Outlook...
Metatrader 4 Tutorial
 Metatrader 4 Tutorial Thank you for your interest in Best Metatrader Broker! This tutorial goes in detail about how to install and trade with your new Metatrader Forex trading platform. With Best Metatrader
Power E*TRADE PRO User Guide
 Power E*TRADE PRO User Guide 00798 (5/04) Table of Contents CHAPTER 1 How This Manual Is Organized: Quick Guide, Specific Tasks, and Menus 1 CHAPTER 2 Are You and Your Computer Ready for Power E*TRADE
OPERATION MANUAL. MV-410RGB Layout Editor. Version 2.1- higher
 OPERATION MANUAL MV-410RGB Layout Editor Version 2.1- higher Table of Contents 1. Setup... 1 1-1. Overview... 1 1-2. System Requirements... 1 1-3. Operation Flow... 1 1-4. Installing MV-410RGB Layout
An Introduction to K12 s Online School (OLS)
") An Introduction to K12 s Online School (OLS) 1 Introducing the Online School (OLS)... 6 Logging In... 6 OLS Home page... 8 My Account Menu... 9 To Edit Basic Account Information for Yourself... 9 Tip:
An Introduction to K12 s Online School (OLS) 1 Introducing the Online School (OLS)... 6 Logging In... 6 OLS Home page... 8 My Account Menu... 9 To Edit Basic Account Information for Yourself... 9 Tip:
Banner Document Management Suite (BDMS) Web Access Help
 Web Access Help") May 10 th, 2011 Banner Document Management Suite (BDMS) Web Access Help Division of Information Technology AppXtender Web Access Help: For questions regarding AppXtender Web Access, please contact the
May 10 th, 2011 Banner Document Management Suite (BDMS) Web Access Help Division of Information Technology AppXtender Web Access Help: For questions regarding AppXtender Web Access, please contact the
WINDSOR DIRECT 4 USER GUIDE
 www.windsorbrokersltd.com For more information email us on: [email protected] CONTENTS 1. Opening an account. p. 3 2. Server and account settings. p. 4 Changing Password p. 4 Events Setup. p.
Enhanced Formatting and Document Management. Word 2010. Unit 3 Module 3. Diocese of St. Petersburg Office of Training Training@dosp.
 Enhanced Formatting and Document Management Word 2010 Unit 3 Module 3 Diocese of St. Petersburg Office of Training [email protected] This Page Left Intentionally Blank Diocese of St. Petersburg 9/5/2014
DECS DER APPLE WIRELESS HELPER DOCUMENT
 DECS DER APPLE WIRELESS HELPER DOCUMENT A GUIDE TO THE DEPLOYMENT OF APPLE MAC NOTEBOOK COMPUTERS IN DECS WIRELESS NETWORKS apple Chris Downing, Senior Systems Engineer apple Viano Jaksa, Area Manager
Chapter 15 Using Forms in Writer
 Writer Guide Chapter 15 Using Forms in Writer OpenOffice.org Copyright This document is Copyright 2005 2006 by its contributors as listed in the section titled Authors. You can distribute it and/or modify
FreeStockCharts.com Workbook
 FreeStockCharts.com Workbook Updated March 2010 FREESTOCKCHARTS.COM WORKBOOK Worden Brothers, Inc. www.worden.com Five Oaks Office Park 4905 Pine Cone Drive Durham, NC 27707 0 FREESTOCKCHARTS.COM WORKBOOK
Stock Investment Guide Software Manual. By Churr Software. The Stock Investment Guide (manual version 0.8) ------ 1
 ------ 1") Stock Investment Guide Software Manual By Churr Software The Stock Investment Guide (manual version 0.8) ------ 1 This manual may not be duplicated either in whole or in part by any means without the expressed
Stock Investment Guide Software Manual By Churr Software The Stock Investment Guide (manual version 0.8) ------ 1 This manual may not be duplicated either in whole or in part by any means without the expressed
FxPro ctrader User Guide
 FxPro ctrader User Guide Content Content... 2 Getting Started... 3 FxPro ctrader Installation... 4 Launching FxPro ctrader... 5 Creating an Account... 6 Signing In... 8 Connection Settings... 9 FxPro ctrader
M-Files Gantt View. User Guide. App Version: 1.1.0 Author: Joel Heinrich
 M-Files Gantt View User Guide App Version: 1.1.0 Author: Joel Heinrich Date: 02-Jan-2013 Contents 1 Introduction... 1 1.1 Requirements... 1 2 Basic Use... 1 2.1 Activation... 1 2.2 Layout... 1 2.3 Navigation...
Strategy Trader User Guide
 Strategy Trader User Guide 1 Table of Contents Strategy Trader User Guide... 1 Workspaces... 6 Dealing Rates Window... 8 Navigation Window... 9 Manual Trading Window... 10 Account Manager Window... 11
1. Installing The Monitoring Software
 SD7000 Digital Microphone Monitor Software manual Table of Contents 1. Installing The Monitor Software 1.1 Setting Up Receivers For Monitoring 1.2 Running The Application 1.3 Shutdown 2. The Detail Monitoring
CITS. Windows & Macintosh Zimbra Calendar 5.0. Computing and Information Technology Services. Revised 8/21/2008
 Windows & Macintosh Zimbra Calendar 5.0 CITS Computing and Information Technology Services Sunday Monday Tuesday Wednesday Thursday Friday Saturday 1 2 3 4 5 6 7 8 9 10 11 12 13 14 15 16 17 18 19 20 21
Module One: Getting Started... 6. Opening Outlook... 6. Setting Up Outlook for the First Time... 7. Understanding the Interface...
 2 CONTENTS Module One: Getting Started... 6 Opening Outlook... 6 Setting Up Outlook for the First Time... 7 Understanding the Interface...12 Using Backstage View...14 Viewing Your Inbox...15 Closing Outlook...17
Central Management Software CV3-M1024
 Table of Contents Chapter 1. User Interface Overview...5 Chapter 2. Installation...6 2.1 Beginning Installation...6 2.2 Starting the CMS software...10 2.3 Starting it from the Start menu...10 2.4 Starting
Access 2007 Creating Forms Table of Contents
 Access 2007 Creating Forms Table of Contents CREATING FORMS IN ACCESS 2007... 3 UNDERSTAND LAYOUT VIEW AND DESIGN VIEW... 3 LAYOUT VIEW... 3 DESIGN VIEW... 3 UNDERSTAND CONTROLS... 4 BOUND CONTROL... 4
Introduction to Windows 8
 Introduction to Windows 8 Windows 8 is a completely redesigned operating system developed from the ground up with touchscreen use in mind as well as near instant-on capabilities that enable a Windows 8
Writer Guide. Chapter 15 Using Forms in Writer
 Writer Guide Chapter 15 Using Forms in Writer Copyright This document is Copyright 2005 2008 by its contributors as listed in the section titled Authors. You may distribute it and/or modify it under the
Managing Your Desktop with Exposé, Spaces, and Other Tools
 CHAPTER Managing Your Desktop with Exposé, Spaces, and Other Tools In this chapter Taking Control of Your Desktop 266 Managing Open Windows with Exposé 266 Creating, Using, and Managing Spaces 269 Mac
Table of contents. 1. About the platform 3. 2. MetaTrader 4 platform Installation 4. 3. Logging in 5 - Common log in problems 5
 Table of contents 1. About the platform 3 2. MetaTrader 4 platform Installation 4 3. Logging in 5 - Common log in problems 5 4. How to change your password 6 5. User Interface and Customization 7 - Toolbars
Cleaning your Windows 7, Windows XP and Macintosh OSX Computers
 Cleaning your Windows 7, Windows XP and Macintosh OSX Computers A cleaning of your computer can help your computer run faster and make you more efficient. We have listed some tools and how to use these
Outlook Web Access (OWA) User Guide
 User Guide") Outlook Web Access (OWA) User Guide September 2010 TABLE OF CONTENTS TABLE OF CONTENTS... 2 1.0 INTRODUCTION... 4 1.1 OUTLOOK WEB ACCESS SECURITY CONSIDERATIONS... 4 2.0 GETTING STARTED... 5 2.1 LOGGING
Outlook Web Access (OWA) User Guide September 2010 TABLE OF CONTENTS TABLE OF CONTENTS... 2 1.0 INTRODUCTION... 4 1.1 OUTLOOK WEB ACCESS SECURITY CONSIDERATIONS... 4 2.0 GETTING STARTED... 5 2.1 LOGGING
The Shield, Inc. 2014 www.turnkeybroker.com [email protected]
 TurboTick PRO manual version 2.022 updated 7.7.2014 Table of Contents Contents Table of Contents... 2 Getting started in TurboTick Pro... 3 Level 2... 5 Order Entry... 8 Streamlined Order Entry... 10 Portfolio
DROOMS DATA ROOM USER GUIDE. www.drooms.com
 USER GUIDE www.drooms.com USER GUIDE Dear User, Whether simply reviewing documentation, sending queries during the due diligence process or administering a data room yourself, Drooms is the software solution
Basic Excel Handbook
 2 5 2 7 1 1 0 4 3 9 8 1 Basic Excel Handbook Version 3.6 May 6, 2008 Contents Contents... 1 Part I: Background Information...3 About This Handbook... 4 Excel Terminology... 5 Excel Terminology (cont.)...
leveraging your Microsoft
 Kanban Task Manager for SharePoint Manual Table of contents 1 INTRODUCTION... 3 1.1 LANGUAGES... 4 1.2 REQUIREMENTS... 4 2 INSTALLATION OF KANBAN TASK MANAGER... 4 2.1 INTRODUCTION... 4 2.2 INSTALL AND
Excel 2003 Tutorial I
 This tutorial was adapted from a tutorial by see its complete version at http://www.fgcu.edu/support/office2000/excel/index.html Excel 2003 Tutorial I Spreadsheet Basics Screen Layout Title bar Menu bar
GUIDELINES FOR PREPARING POSTERS USING POWERPOINT PRESENTATION SOFTWARE
 Society for the Teaching of Psychology (APA Division 2) OFFICE OF TEACHING RESOURCES IN PSYCHOLOGY (OTRP) Department of Psychology, Georgia Southern University, P. O. Box 8041, Statesboro, GA 30460-8041
WHAT S NEW IN WORD 2010 & HOW TO CUSTOMIZE IT
 WHAT S NEW IN WORD 2010 & HOW TO CUSTOMIZE IT The Ribbon... 2 Default Tabs... 2 Contextual Tabs... 2 Minimizing and Restoring the Ribbon... 3 Customizing the Ribbon... 3 A New Graphic Interface... 5 Live
X-Trade Brokers Dom Maklerski S.A. XTB Expert Builder. Tutorial. Michał Zabielski 2010-08-05
 X-Trade Brokers Dom Maklerski S.A. XTB Expert Builder Tutorial Michał Zabielski 2010-08-05 Table of Contents Installation...3 Legal notification...7 Initial adjustments / Preferences...8 Language...8 Platform
Browsing and working with your files and folder is easy with Windows 7 s new look Windows Explorer.
 Getting Started with Windows 7 In Windows 7, the desktop has been given an overhaul and makeover to introduce a clean new look. While the basic functionality remains the same, there are a few new navigation
CONFERENCE NOW. with WebConnect
 CONFERENCE NOW with WebConnect I. WebConnect Overview 2 A. Conference Center 2 B. Conference Controls II. Log in (Chairperson) 3 III. Join a Meeting (Participant) 5 IV. Conference Controls 6 A. Participants
Active Trader Pro. Next Generation. Moving from. 9.6 to. Active Trader Pro
 WORKSPACE Moving from Active Trader Pro 9.6 to Active Trader Pro Next Generation Active Trader Pro Next Generation is a platform that has been shaped by input from traders like you. Powerful new technologies
DataPA OpenAnalytics End User Training
 DataPA OpenAnalytics End User Training DataPA End User Training Lesson 1 Course Overview DataPA Chapter 1 Course Overview Introduction This course covers the skills required to use DataPA OpenAnalytics
A Crash Course in OS X D. Riley and M. Allen
 Objectives A Crash Course in OS X D. Riley and M. Allen To learn some of the basics of the OS X operating system - including the use of the login panel, system menus, the file browser, the desktop, and
Business Objects Version 5 : Introduction
 Business Objects Version 5 : Introduction Page 1 TABLE OF CONTENTS Introduction About Business Objects Changing Your Password Retrieving Pre-Defined Reports Formatting Your Report Using the Slice and Dice
6. If you want to enter specific formats, click the Format Tab to auto format the information that is entered into the field.
 Adobe Acrobat Professional X Part 3 - Creating Fillable Forms Preparing the Form Create the form in Word, including underlines, images and any other text you would like showing on the form. Convert the
USER GUIDE. Unit 2: Synergy. Chapter 2: Using Schoolwires Synergy
 USER GUIDE Unit 2: Synergy Chapter 2: Using Schoolwires Synergy Schoolwires Synergy & Assist Version 2.0 TABLE OF CONTENTS Introductions... 1 Audience... 1 Objectives... 1 Before You Begin... 1 Getting
Chapter 9 Slide Shows
 Impress Guide Chapter 9 Slide Shows Transitions, animations, and more Copyright This document is Copyright 2007 2013 by its contributors as listed below. You may distribute it and/or modify it under the
Book Builder Training Materials Using Book Builder September 2014
 Book Builder Training Materials Using Book Builder September 2014 Prepared by WDI, Inc. Table of Contents Introduction --------------------------------------------------------------------------------------------------------------------
Word 2010: The Basics Table of Contents THE WORD 2010 WINDOW... 2 SET UP A DOCUMENT... 3 INTRODUCING BACKSTAGE... 3 CREATE A NEW DOCUMENT...
 Word 2010: The Basics Table of Contents THE WORD 2010 WINDOW... 2 SET UP A DOCUMENT... 3 INTRODUCING BACKSTAGE... 3 CREATE A NEW DOCUMENT... 4 Open a blank document... 4 Start a document from a template...
Creating Basic HTML Forms in Microsoft FrontPage
 Creating Basic HTML Forms in Microsoft FrontPage Computer Services Missouri State University http://computerservices.missouristate.edu 901 S. National Springfield, MO 65804 Revised: June 2005 DOC090: Creating
Understand the Sketcher workbench of CATIA V5.
 Chapter 1 Drawing Sketches in Learning Objectives the Sketcher Workbench-I After completing this chapter you will be able to: Understand the Sketcher workbench of CATIA V5. Start a new file in the Part
Lab Activity File Management with Windows Explorer Windows XP, Vista, Windows 7 and Windows 8 Brought to you by RMRoberts.com
 Lab Activity File Management with Windows Explorer Windows XP, Vista, Windows 7 and Windows 8 Brought to you by RMRoberts.com After completing this laboratory activity, you will be able to: o Open and
Brainreason Trading Platform User Manual
 Brainreason Trading Platform User Manual PREFACE INTRODUCTION About this document PLATFORM NAVIGATION Demo Subscription Demo Account Registration Contact Support Language Getting Started Icons and Symbols
Trading Contracts for Difference on margin involves a high degree of risk and may not be suitable for all investors.
 User Guide Ver 3.0 Disclaimer Trading Contracts for Difference on margin involves a high degree of risk and may not be suitable for all investors. The leverage created by trading on margin can work against
SpaceClaim Introduction Training Session. A SpaceClaim Support Document
 SpaceClaim Introduction Training Session A SpaceClaim Support Document In this class we will walk through the basic tools used to create and modify models in SpaceClaim. Introduction We will focus on:
Password Memory 6 User s Guide
 C O D E : A E R O T E C H N O L O G I E S Password Memory 6 User s Guide 2007-2015 by code:aero technologies Phone: +1 (321) 285.7447 E-mail: [email protected] Table of Contents Password Memory 6... 1
Ohio University Computer Services Center August, 2002 Crystal Reports Introduction Quick Reference Guide
 Open Crystal Reports From the Windows Start menu choose Programs and then Crystal Reports. Creating a Blank Report Ohio University Computer Services Center August, 2002 Crystal Reports Introduction Quick
Inventory Management. Users Guide
 Professional Edition Inventory Management Users Guide Version 1.4.5 Copyright 2006, 2007 The Fredrick Group, Inc. All rights reserved. Information in this document is provided by The Fredrick Group, Inc.
If you know exactly how you want your business forms to look and don t mind detail
 Advanced Form Customization APPENDIX E If you know exactly how you want your business forms to look and don t mind detail work, you can customize QuickBooks forms however you want. With QuickBooks Layout
Microsoft Excel 2010 Tutorial
 1 Microsoft Excel 2010 Tutorial Excel is a spreadsheet program in the Microsoft Office system. You can use Excel to create and format workbooks (a collection of spreadsheets) in order to analyze data and
Using Acrobat Comment and Markup tools
 Using Acrobat Comment and Markup tools In Adobe Acrobat 9 and Adobe Reader, a comment is a note, highlight, stamp, or any other markup you add to your PDF document by using the comment and markup tools.