HOW STRATEGIC ENVIRONMENTAL ASSESSMENT CAN INFLUENCE POWER DEVELOPMENT PLANS
|
|
|
- Cora Farmer
- 8 years ago
- Views:
Transcription
1 HOW STRATEGIC ENVIRONMENTAL ASSESSMENT CAN INFLUENCE POWER DEVELOPMENT PLANS Comparing Alternative Energy Scenarios for Power Planning in the Greater Mekong Subregion ASIAN DEVELOPMENT BANK

2 HOW STRATEGIC ENVIRONMENTAL ASSESSMENT CAN INFLUENCE POWER DEVELOPMENT PLANS Comparing Alternative Energy Scenarios for Power Planning in the Greater Mekong Subregion ASIAN DEVELOPMENT BANK

3 Creative Commons Attribution 3.0 IGO license (CC BY 3.0 IGO) 2015 Asian Development Bank 6 ADB Avenue, Mandaluyong City, 1550 Metro Manila, Philippines Tel ; Fax openaccess.adb.org OARsupport@adb.org; publications@adb.org Some rights reserved. Published in Printed in the Philippines. ISBN (Print), (PDF) Publication Stock No. BKK Cataloging-In-Publication Data Asian Development Bank. How Strategic Environmental Assessment can Influence Power Development Plans Comparing Alternative Scenarios for Power Planning in the Greater Mekong Subregion. Mandaluyong City, Philippines: Asian Development Bank, Infrastructure. 2. Energy. 3. Environment. 4. Asian Development Bank. I. Asian Development Bank. The views expressed in this publication are those of the authors and do not necessarily reflect the views and policies of the Asian Development Bank (ADB) or its Board of Governors or the governments they represent. ADB does not guarantee the accuracy of the data included in this publication and accepts no responsibility for any consequence of their use. The mention of specific companies or products of manufacturers does not imply that they are endorsed or recommended by ADB in preference to others of a similar nature that are not mentioned. By making any designation of or reference to a particular territory or geographic area, or by using the term country in this document, ADB does not intend to make any judgments as to the legal or other status of any territory or area. This work is available under the Creative Commons Attribution 3.0 IGO license (CC BY 3.0 IGO) By using the content of this publication, you agree to be bound by the terms of said license as well as the Terms of Use of the ADB Open Access Repository at openaccess.adb.org/termsofuse This CC license does not apply to non-adb copyright materials in this publication. If the material is attributed to another source, please contact the copyright owner or publisher of that source for permission to reproduce it. ADB cannot be held liable for any claims that arise as a result of your use of the material. Attribution In acknowledging ADB as the source, please be sure to include all of the following information: Author. Year of publication. Title of the material. Asian Development Bank [and/or Publisher]. Available under a CC BY 3.0 IGO license. Translations Any translations you create should carry the following disclaimer: Originally published by the Asian Development Bank in English under the title [title] [Year of publication] Asian Development Bank. All rights reserved. The quality of this translation and its coherence with the original text is the sole responsibility of the [translator]. The English original of this work is the only official version. Adaptations Any translations you create should carry the following disclaimer: This is an adaptation of an original Work Asian Development Bank [Year]. The views expressed here are those of the authors and do not necessarily reflect the views and policies of ADB or its Board of Governors or the governments they represent. ADB does not endorse this work or guarantee the accuracy of the data included in this publication and accepts no responsibility for any consequence of their use. Please contact OARsupport@adb.org or publications@adb.org if you have questions or comments with respect to content, or if you wish to obtain copyright permission for your intended use that does not fall within these terms, or for permission to use the ADB logo. Note: In this publication, $ refers to US dollars. Photo credits: ADB Photo Library (front cover right image); Peter-John Meynell (front cover left and center images; all section divider photos). The center cover photo shows the 292 meter high 4,200 MW Xiaowan dam on the Lancang (Mekong) river, Yunnan, People s Republic of China. The left cover photo shows a section of the 44 MW Bangchak Solar PV Power Plant Project in Ayutthaya province, Thailand. Printed on recycled paper

4 Contents Tables, Figures, and Map Acknowledgments Executive Summary Abbreviations iv v vii x Introduction 1 Development of the Alternative Scenarios 5 Process of Development 6 Assumptions and Limitations 7 Using the OptGen Power Planning Model 9 Description of the Scenarios 10 Current Power Development Plan Scenario 11 Renewable Energy Scenario 13 Energy Efficiency Scenario 17 Comparison of Scenarios 18 Comparing the Sustainability of Alternative Scenarios with Current Power Development Plan 23 Qualitative Comparisons 24 Quantitative Comparisons 31 Conclusions and Recommendations 35 References 38 iii

5 Tables, Figures, and Map Tables 1 Renewable Energy Shares by Scenario in Lower Mekong Basin Countries, Projected Demand by Scenario, Total Costs of Electricity Supply in the Lower Mekong Basin by Scenario, Figures 1 Projected Installed Capacity by Country in the Greater Mekong Subregion, Current Power Development Plan Scenario 12 2 Projected Cross-Border Flows in the Lower Mekong Basin, Current Power Development Plan Scenario, Renewable Energy Generation Output in the Renewable Energy Scenario, All Lower Mekong Basin Countries 15 4 Projected Installed Capacity in the Lower Mekong Basin, Alternative Scenarios, Projected Generation Output in the Lower Mekong Basin, Alternative Scenarios, Change in Installed Capacity from Current Power Development Plan Scenario, Change in Number of Major Power Plants from Current Power Development Plan Scenario, Radar Diagram Comparing Security Aspect Scores of Global Renewable Energy Displacement and Global Energy Efficiency Displacement with Current Power Development Plan 25 9 Radar Diagram Comparing Security Aspect Scores of Regional Renewable Energy and Regional Energy Efficiency with Current Power Development Plan Radar Diagram Comparing Security Aspect Scores of Global Renewable Energy and Regional Renewable Energy with Current Power Development Plan Radar Diagram Comparing Security Aspect Scores of Global Energy Efficiency and Regional Energy Efficiency with Current Power Development Plan Radar Diagram Comparing Security Aspect Scores of Global Renewable Energy Displacement and Global Energy Efficiency Displacement with Current Power Development Plan Financial Costs of Electricity Supply by Scenario, Total Costs of Electricity Supply in the Lower Mekong Basin by Scenario, Map Cross-Border Interconnector Routes, iv

6 Acknowledgments This strategic environmental assessment (SEA) study for regional power planning was carried out under a regional capacity development technical assistance of the Asian Development Bank (ADB) on Ensuring Sustainability of the Greater Mekong Subregion Regional Power Development (TA 7764-REG), with financing from the Government of France through the Agence Française de Développement. The SEA was developed by the consultancy consortium of the International Centre for Environmental Management (ICEM) and Economic Consulting Associates (ECA). Jong-Inn Kim, lead energy specialist at the Energy Division of ADB s Southeast Asia Department (SEEN), ably implemented the project. The peer reviewer of this report was Hyunjung Lee, energy economist at SEEN. The SEA team was led by Peter-John Meynell (SEA specialist) with the assistance of William Derbyshire (deputy team leader). The study team received strong support and guidance from ICEM, especially Jeremy Carew-Reid (director) and Tarek Ketelsen (technical director). The SEA team consisted of Tom Halliburton (power system analyst), Peter Meier (hydropower specialist), Jens Sjørslev (social specialist), John Sawdon (environment specialist), Tim Suljada (renewable energy specialist), Erin Boyd (energy economist), Mai Ky Vinh (GIS specialist), Dinh Hien Minh (energy economist), Nguyen Anh Tuan (energy planning specialist), Botumroath Sao (social specialist), Nguyen Quoc Khanh (renewable energy specialist), Phaivanh Phiapalath (environment specialist), Alexander Kenny (project manager and economist), Bernhard Lehner (river ecological connectivity study). Staff at ADB ensured the smooth administrative implementation of the project, namely, Trinidad S. Nieto, Bui Duy Thanh, and Genandrialine Peralta from Energy Division, Southeast Asia Department; and Lothar Linde, Iain Watson, and Sumit Pokhrel of the Environmental Operations Centre. Mark Kunzer, principal environmental specialist at the Environment and Safeguards Division, Regional and Sustainable Development Department, provided valuable comments in the vetting of this volume. Consultants Cherry Lynn Zafaralla edited the final volumes and coordinated publication, Jasper Lauzon designed the covers, and Principe Marin Nicdao designed and executed the interior layouts. Chong Chi Nai, director of SERD s Energy Division, and Ramesh Subramanian, SERD deputy director general, provided invaluable overall guidance and support throughout the project. Many different people made suggestions, provided information, and helped with developing the study. These include more than 250 participants at the study s regional and national consultation meetings, attendees at four Regional Power Trade Coordination Committee (RPTCC) meetings, and those who commented on the various reports. The focal points of the RPTCC were instrumental in providing feedback at the country level, namely, Kong Pagnarith (Mines and Energy, Cambodia); Zhong Xiaotao (China Southern Power Grid Co., People s Republic of China); Sanhaya Somvichit (Department of Energy Policy and Planning, v
, ably implemented the project.")
7 Acknowledgments Lao People s Democratic Republic); Saw Si Thu Hlaing (Department of Electric Power, Myanmar); Panupong Sathorn (Electricity Generating Authority of Thailand); Trinh Quoc Vu (Electricity Regulatory Authority of Vietnam, Viet Nam); Voradeth Phonokeo (Mekong River Commission); Simon Krohn (Mekong River Commission); Chuenchom Sangarasri Greacen (Palang Thai); Ame Trandem (International Rivers); and Witoon Permpongsacharoen (Mekong Energy and Ecology Network). Finally, the support of Carl Bernadac and Olivier Grandvoinet of Agence Française de Développement is gratefully acknowledged. vi
. Finally, the support of Carl Bernadac and Olivier Grandvoinet of Agence Française de Développement is gratefully acknowledged. vi")
8 Executive Summary This volume was developed from the Asian Development Bank (ADB) study Ensuring Sustainability of the Greater Mekong Subregion Regional Power Development (TA 7764-REG). This study shows how the strategic environmental assessment (SEA) process can be used for power planning. The study is the first in the world to incorporate SEA, which focuses on sustainability and policy making, into power development plans (PDPs). Specifically, the study incorporates SEA into the PDPs in the Greater Mekong Subregion (GMS) to arrive at an optimal power development trajectory for the GMS as a whole. This volume is the third in a three-part series of knowledge products focused on particular aspects of the study. It shows how SEA may be applied to compare different energy scenarios and how, by incorporating the wider impacts considered during the SEA process, a more sustainable power plan can be developed. It also shows how sustainability may be incorporated in power planning. This study assumes that the costs of impacts resulting from power sector development are the same for all Lower Mekong Basin countries, irrespective of their national income levels. In this SEA study, sustainability issues are defined in terms of national and regional security the degree of protection against danger, damage, or loss. Eight security aspects that capture the essence of sustainability for power planning are identified, namely, ecological security (land, water, air); climate security; food security; social security; health and safety security; good governance and state security; energy security; and economic security. For each security aspect, a series of indicators and sustainability statements are used to assess the contribution of the existing regional power master plan. No easily measurable indicators were identified for the good governance and state security aspect that could be used to compare the scenarios, and the analysis for this aspect was descriptive. In this third volume, alternative scenarios, namely, (i) current PDP, (ii) renewable energy with global and regional displacement options, and (iii) energy efficiency with global and regional displacement options are used to compare different generation mixes in the power plan. These are not detailed power plans, but planning tools that reflect significant power planning policy options, such as an increased contribution from renewable energy production and energy efficiency measures. The process of developing alternative power plan scenarios used in the SEA involves projecting the development of installed capacity and generation by fuel type across the GMS to 2025 on the basis of existing PDPs in the region (the current PDP scenario). The current PDP scenario is an updated version (as of 2012) of the existing GMS Power Transmission Master Plan developed under ADB s TA 6440-REG. The current PDP scenario incorporates the national PDPs of Cambodia, the Lao PDR, Thailand, and Viet Nam to The PDP for vii
 to arrive at an optimal power development trajectory for the GMS as a whole.")
9 Executive Summary Myanmar as well as for Yunnan Province and Guangxi Zhuang Autonomous Region in the PRC were not available for this study. The current PDP is compared to the baseline situation of all power plants and regional interconnectors operational in Using the OptGen power model, relevant data from the existing and proposed power plants are used to displace or remove and replace some of the existing capacity with increased power generation mixes of renewables; or to decrease the demand for power with increased energy efficiency measures. This gives a renewable energy scenario and an energy efficiency scenario. Two displacement options are considered for each of these two scenarios a global impacts option in which some coal-fired power plants are displaced to reduce carbon emissions; and a regional and local impacts option in which some large hydropower, nuclear, and coalfired power stations are displaced to reduce regional and local impacts. These scenarios and displacement options are described together with the required regional interconnections to service the trade in power in the region. The projections show that there is nearly a tripling of demand for power throughout the GMS by 2025, which is somewhat reduced by about 15% if energy efficiency measures are incorporated. The global displacement cases of the renewable energy and energy efficiency scenarios show a reduction in the output (gigawatts) of coal-fired power stations by about 10% and 16%, respectively, (or 9 and 15 fewer new coal-fired plants, respectively). The regional and local impacts cases of the renewable energy scenario shows three less nuclear power plants; while for the energy efficiency scenario, there would be eight and 22 less large hydropower plants compared to the current PDP. In addition, the regional and local energy efficiency scenario shows eight less coal-fired power plants. The current PDP and the four alternative cases (two scenarios each comprising two displacement cases) are compared both qualitatively and quantitatively. The qualitative comparison uses radar diagrams showing the relative differences between the scenarios for all 46 of the indicators used in each of the eight security aspects or areas of sustainability. In almost all cases, the energy efficiency scenario emerges as the most sustainable of the power development options, followed by the scenario with an increased renewable energy contribution to the power generation mix. The quantitative comparison monetizes six of the 46 key sustainability indicators that could be consistently valued. Financial costs of electricity generation are added to these six indicators. The energy efficiency scenario incurs lower costs largely because fewer plants have to be built to meet the reduced demand. The renewable energy scenario has slightly higher financial costs (approximately 5%) because of the higher costs of these technologies and the need to provide additional backup capacity to allow for their intermittent supply. However, when the monetized sustainability impacts are taken into account, the total social costs for both global and regional cases under the renewable energy scenario are very similar to the current PDP. This indicates that the higher financial costs of renewable energy technologies can be offset by their reduced impacts, leading to unchanged or improved social welfare. Furthermore, the renewable energy scenario was found to be more energy-secure. viii

10 Executive Summary Monetization provides a clear comparison of the costs, benefits, and trade-offs of each scenario. It is important to note that the environmental and social benefits may be considerably higher than those monetized by this SEA. Firstly, conservative assumptions were made; secondly, the costs of some issues, such as resettlement, were only partially monetized (i.e., no attempt was made to calculate the multigenerational, community, cultural, and livelihood impacts of resettlement). Lastly, many indicators and potential impacts were not monetized at all, such as ecosystem health and biodiversity. It is recommended that further studies be carried out to monetize more indicators that can enhance the sensitivity of SEA in power development plans. The methods for developing qualitative comparisons between all of the indicators and security aspects using a radar diagram approach illustrates how the assessment can highlight the strengths and weaknesses of the different power plan options. Application of a weighting process would increase the sensitivity of this approach. This volume finds that incorporating significantly greater renewable energy production and greater energy efficiency measures would increase the sustainability of the power plans at a comparatively low additional financial cost. Moreover, energy efficiency measures can offset costs of additional renewable energy. From an energy planning as well as consumer perspective, the resulting power generation mix would be stable and would provide greater energy security, while remaining affordable and accessible. Recommendations emerging from the analysis are as follows. (i) (ii) More accurate and realistic demand forecasting is an essential part of the process of making power sector development more sustainable. Sustainability of power sector development would be improved with greater emphasis on combining energy efficiency measures and renewable energy technologies. (iii) There are trade-offs between financial costs and sustainability. A monetization exercise recognizes these and shows that social welfare can be increased with appropriate deployment of renewable energy technologies. (iv) In their choice of technologies for new power generation, governments should be aware of the need to address greater regional and local impacts if they adopt a policy of reducing carbon emissions from the power sector. ix

11 Abbreviations ADB Asian Development Bank CSG China Southern Power Grid EE-G energy efficiency scenario with global displacement option EE-R energy efficiency scenario with regional displacement option GHG greenhouse gas GMS Greater Mekong Subregion GW gigawatt Lao PDR Lao People s Democratic Republic LMB Lower Mekong Basin MW megawatt MWh megawatt-hour PDP power development plan PRC People s Republic of China RE-G renewable energy scenario with global displacement option RE-R renewable energy scenario with regional displacement option SEA strategic environmental assessment TA technical assistance TWh terawatt-hour x

12 Introduction Zemoshan wind farm with 61 windmills with MW capacity, Daly, Yunnan, People s Republic of China

13 How Strategic Environmental Assessment Can Influence Power Development Plans The Asian Development Bank s (ADB) project on Ensuring Sustainability of the Greater Mekong Subregion Regional Power Development is a $1.35 million technical assistance project (ADB 2010a). It has the following objectives: (i) (ii) assess the impacts of alternative directions for the development of the power sector in the Greater Mekong Subregion (GMS) through a strategic environmental assessment (SEA); 1 develop recommendations on how to minimize and mitigate harmful impacts in the power sector; and (iii) provide capacity building for GMS countries in the conduct of SEA, and support its integration into the power planning process. This project commenced in March 2012 with a series of three regional consultations. National consultations were also held in four countries of the Lower Mekong to contribute toward the development of sustainability indicators for use in assessing the impacts. 2 A baseline report was produced in January 2013, including a report setting out the alternative power planning 1 The Greater Mekong Subregion includes Cambodia, the Lao People s Democratic Republic (Lao PDR), Myanmar, Thailand, Viet Nam, and Yunnan Province and Guangxi Zhuang Autonomous Region in the People s Republic of China (PRC). 2 This strategic environmental assessment (SEA) study was sustainability-led. Sustainability issues were defined in terms of national and regional security the degree of protection against danger, damage, or loss. Eight security aspects that capture the essence of sustainability for power planning were identified, namely: (i) ecological security (pollution, land and biodiversity, rivers); (ii) climate security; (iii) food security; (iv) social security; (v) health and safety security; (vi) good governance and state security; (vii) energy security; and (viii) economic security. Associated with each security aspect is a series of indicators and sustainability statements that were developed through stakeholder consultation and literature review, and against which the contribution of the existing regional power plan was assessed. 2
; 1 develop recommendations on how to minimize and mitigate harmful impacts in the power sector; and (iii) provide capacity building for GMS countries in the conduct of SEA, and")
14 Introduction scenarios (ADB 2013a). 3 The impact assessment report and summary report, complete with recommendations were finalized in December A three-volume series of knowledge products prepared from the study captures significant aspects of the SEA process. These volumes are as follows. (i) (ii) Integrating Strategic Environmental Assessment into Power Planning Identifying Sustainability Indicators of Strategic Environmental Assessment for Power Planning (iii) How Strategic Environmental Assessment can Influence Power Development Plans Comparing Alternative Scenarios for Power Planning in the Greater Mekong Subregion This volume applies SEA to compare different scenarios, and shows how a more sustainable power plan can be developed by incorporating the wider impacts considered during the SEA process. It also demonstrates how sustainability may be assessed in power planning, and how incorporating wider impacts might change decisions on the optimal power plan. This volume complements the first and second volumes in this series. The first volume shows how the SEA process can be used for power planning and how capacity for conducting SEAs and the consultation process can be strengthened. It highlights the role of SEA in assessing the sustainability of polices and plans at a regional or national level. The volume also shows how the SEA process can contribute to good governance in the power planning process, and how the capacity of national governments and stakeholders in the power planning process can be strengthened. The second volume describes the application of the SEA methodology to the GMS regional PDP. It shows how a set of indicators may be defined and used to capture the wider impacts of power planning, and to analyze PDPs in the GMS to achieve greater sustainability. 4 The volume explains why the particular indicators were selected for the study, why they are important, how they can be measured, and what the indicators reveal. Using the indicators established by the study, the volume shows how SEA may be applied to qualitatively and quantitatively compare different scenarios. The second volume also presents monetization 3 The study had three power planning scenarios: (i) current power development plan (PDP), (ii) renewable energy, and (iii) energy efficiency. The current PDP scenario is an updated version (as of 2012) of the existing GMS Power Transmission Master Plan developed under the Asian Development Bank s (ADB) TA 6440-REG. The current PDP scenario incorporates the national PDPs of Cambodia, the Lao PDR, Thailand, and Viet Nam to The PDP for Myanmar as well as for Yunnan Province and Guangxi Zhuang Autonomous Region in the PRC were not available for this study. The current PDP is compared to the baseline situation of all power plants and regional interconnectors operational in Two displacement options are considered for the renewable energy and energy efficiency scenarios a global impacts option in which some coal-fired power plants are displaced to reduce carbon emissions; and a regional and local impacts option in which some large hydropower, nuclear, and coal-fired power stations are displaced to reduce regional and local impacts. In the context of this SEA, the term displacement is used to indicate the option of removing a planned thermal, large hydropower, or nuclear plant from the PDP scenario and replacing it with greater contributions from renewable energy and energy efficiency. 4 The World Commission on Environment and Development (the Bruntland Commission) in 1987 defined sustainability as development that meets the needs of the present without compromising the ability of future generations to meet their own needs. 3

15 How Strategic Environmental Assessment Can Influence Power Development Plans as a means of comparison across scenarios, and explains how selected indicators were monetized. In addition, a series of SEA briefing papers produced earlier present the different stages of the SEA process in the format of case studies. An updated database of power plants in the GMS developed from a database provided by an earlier ADB project (TA 6440-REG) titled Facilitating Regional Power Trading and Environmentally Sustainable Development of Electricity Infrastructure in the Greater Mekong Subregion. Component 2: Analysis of SEA in GMS Countries, and Identification of Gaps, Needs and Areas for Capacity Development (ADB 2010b) is also available, together with an explanatory manual (ADB 2014). The SEA process is usually conducted at a relatively high level and complements the more detailed environmental impact assessments (EIAs) necessary for specific developments. The SEA process has its own limitations and assumptions because of the scale at which it is conducted. Such assumptions must be made clear and transparent. The development of more sustainable power plans must be underpinned by good governance. 5 Poor governance throughout the power planning process and operation of power plants in the GMS, along with the associated environmental and social impact assessment and monitoring, were major concerns of stakeholders consulted throughout this study. This study constitutes an attempt to introduce and incorporate a methodology for SEA in PDPs. The findings and recommendations are by no means exhaustive and final, but are meant to serve as a springboard for more in-depth SEA on individual national PDPs. The monetization of more indicators, in particular, is an area for future research. 5 In this study, good governance covers policy making including laws and regulations, enforcement of environmental conditions and social safeguards, as well as issues of corruption and capacity of institutions to manage the process. It refers to oversight of policy making, planning, operations and management by government, state-owned enterprises, and private entities, and involves consultation with public, private, and civil society organizations. Good governance and capacity development is one of the five drivers of change that ADB, in its long-term strategic framework Strategy 2020 (ADB 2008), focuses on to better mobilize and maximize resources, the others being (i) private sector development and private sector operations, (ii) gender equity, (iii) knowledge solutions, and (iv) partnerships. 4

16 Development of the Alternative Scenarios Construction is nearly complete in this 40 MW Phyu hydropower dam in Myanmar

17 How Strategic Environmental Assessment Can Influence Power Development Plans In this study, ADB drew up alternative scenarios in the SEA process to compare and contrast the sustainability of different variations on the regional power plan. From this analysis, conclusions are drawn for power planning policy such as the choice of technology to include in the power generation mix, the proportion of renewable energy, and the emphasis required on energy efficiency. The alternative scenarios are not intended to be fully developed power plans but to serve as an important planning tool. They reflect significant differences in policy, so that the SEA comparisons can highlight important differences and trends. Process of Development The process of developing alternative power plan scenarios used in the SEA involves projecting the development of installed capacity and generation by fuel type across the GMS to 2025 on the basis of existing PDPs in the region (the current PDP scenario). The current PDP scenario is an updated version (as of 2012) of the existing GMS Power Transmission Master Plan developed under ADB s TA 6440-REG. The current PDP scenario incorporates the national PDPs of Cambodia, the Lao PDR, Thailand, and Viet Nam to The PDP for Myanmar as well as for Yunnan Province and Guangxi Zhuang Autonomous Region in the PRC were not available for this study. The current PDP is compared to the baseline situation of all power plants and regional interconnectors operational in The scenarios are (i) current PDP, (ii) renewable energy with global and regional displacement options, and (iii) energy efficiency with global and regional displacement options. 6 The study looked 6 In the context of this SEA, the term displacement is used to indicate the option for removing a planned thermal, large hydropower, or nuclear plant from the PDP scenario and its replacement by greater contributions from renewable energy sources and energy efficiency measures. The global displacement scenario involves the displacement of some coal-fired thermal plants to address issues of carbon emissions. The regional displacement scenario involves the displacement of some planned large hydropower plants, nuclear plants in Viet Nam, and a few coal-fired plants. 6

18 Development of the Alternative Scenarios at how capacity and generation would change when (i) additional renewable energy is developed, displacing conventional capacity; and (ii) where additional energy efficiency measures are undertaken, also displacing conventional capacity. 7 The renewable energy scenario represents a plausible additional level of penetration of renewable energy capacity in addition to that included in existing PDPs, while the energy efficiency scenario represents the achievable levels of efficiency based on benchmarking against performance elsewhere. For each of these scenarios, two displacement cases or sub-scenarios were defined. Under the first, the global impacts case, conventional capacity with the highest impacts on greenhouse gas (GHG) emissions is displaced by additional renewable energy capacity or energy efficiency measures comprising lignite and coal-fired generation. Under the second, the regional impacts case, conventional capacity with the highest impacts on the GMS environment and population is displaced. This comprises large hydropower, nuclear, lignite, and coal capacity, in that order. In displacing conventional capacity, it was assumed that many new power projects are already committed and, therefore, cannot be displaced. Significantly, this includes the Xayaburi mainstream dam and the Hong Sa lignite power plant, both located in the Lao People s Democratic Republic (Lao PDR). The expansion of the Mae Moh lignite power plant, located in Thailand, is assumed to be displaced in all cases. While the projected capacity and generation is available for the whole of the GMS under the current PDP scenario, data limitations restrict the projections of the alternative scenarios to the four Lower Mekong Basin (LMB) countries comprising Cambodia, the Lao PDR, Thailand, and Viet Nam. Comparisons of the current PDP scenario and the alternative scenarios are for the LMB countries only. In developing the scenarios for this study, the threshold for medium- and large-sized hydropower was taken as 30 megawatts (MW), the standard for Viet Nam. Existing small hydropower plants (less than 30 MW) are considered as aggregate installed capacity. In developing the scenarios, the standard of 10 MW was used and applied to an estimated potential for small hydropower in each country, based upon the optimum regions for smallscale hydropower in the country (ADB 2010a). It was not based on the numbers of plants currently in the planning and design stages. Assumptions and Limitations The project s focus on the LMB under the alternative scenarios was required as detailed power development plans are not available for the power sector in Yunnan Province and Guangxi Zhuang Autonomous Region in the People s Republic of China, and in other GMS members. 7 Separating these scenarios into renewable energy and energy efficiency scenarios was specified in the terms of reference for the project and reconfirmed at the first regional consultation. Consequently, renewable energy sources and energy efficiency measures are treated as alternatives to each other for the purposes of the SEA analysis although in practice, a sustainable energy development path would combine elements of both. 7

19 How Strategic Environmental Assessment Can Influence Power Development Plans Communications with China Southern Power Grid Company (CSG) have, however, allowed significant power plants and expected developments over the study period to be identified. Other assumptions and limitations associated with the analysis are presented below. (i) (ii) (iii) (iv) (v) (vi) Demand projections under the PDPs are retained to reflect current power planning assumptions in GMS countries. While consultations under the project revealed a wide perception that such demand projections may prove to be overestimated, the PDPs remain as the figures most widely accepted by power planners and used as basis for the analysis. Potential renewable energy plants are modelled as blocks of capacity using a standard plant size and their geographic distribution is assumed to be uniform across areas of identified renewable resource potential. Due to the broad brush nature of the analysis, it was not possible to identify specific locations, which would depend on many site-specific variables. Displacement of plants under the alternative scenarios removes conventional capacity and replaces it with renewable capacity or energy efficiency, based on the electricity output they produce. It assumes that power trade between countries will redistribute electricity output in a perfect interlinked grid and as such simplifies the potential grid management issues that may arise from increased power trade. Modelling uses a monthly time-step, hence, daily and hourly variations in power output particularly for renewables are not reflected. Such variation has been addressed by incorporating sufficient reserve capacity in the form of open cycle gas plants that can be readily switched on and off to compensate for fluctuations in the grid. Reliable water inflow data was available only for existing plants in Viet Nam due to the availability of the database supplied by the Load Dispatch Centre of Electricity Vietnam National. The data made available included many years of historical inflows, from which a reliable synthetic inflow model could be derived. Data from an earlier ADB study (TA 6440-REG) was used for the remainder of the region, outside Viet Nam. No new flexible thermal capacity is planned for the region. Modelling of this aspect may have significant impacts on the needs for interconnection and on emissions. The limited flexibility of the thermal projects planned throughout the region is likely to result in higher emissions, as they will be forced to run at minimum output during low load periods. Larger interconnection capacity may be required to allow load following to be supplied by means of hydropower plants located in other areas. (vii) Data on the earliest commissioning dates for interconnectors and their capacity and load profiles was taken from the preceding study and could not be updated within the constraints of this project. (viii) The costs of energy efficiency measures to be implemented in the energy efficiency scenario required the creation of appropriate cost curves by assuming rising payback periods for greater volumes of energy efficiency. The assumptions upon which this was based are outlined in the energy efficiency scenario discussion in section 3. 8

20 Development of the Alternative Scenarios Using the OptGen Power Planning Model The OptGen database used for this study was prepared for the earlier TA 6440-REG project. 8 OptGen is a proprietary hydrothermal power system expansion planning system developed by Power Systems Research of Rio de Janeiro. The database was updated using current power plans for each country, and improved using new data. New sources of data include the Mekong River Commission database, and the database used by Electricity Vietnam National in their dispatch planning model, stochastic dual dynamic programming. Because of the need to work within the framework of a general purpose hydrothermal power system planning software, a number of work-arounds are present in the OptGen database. Consequently, various dummy power plants are included, so the database does not correspond exactly to the physical system. In this SEA, OptGen was used to determine optimal commissioning dates for new interconnections, in addition to those already committed. OptGen was not used to calculate optimal generation plant commissioning, as this data was taken from the PDPs of each country in the region. These plans were considered to be fixed, except for the Lao PDR. Export projects were included in the plan only if they were also included in the plans of the receiving country. The remaining generation in the Lao PDR would have created a large surplus for export. New projects have been removed or delayed to reduce Thai imports to approximately 15%. Five separate databases were prepared, each corresponding to one scenario. Differences consisted of commissioning dates for new plant and interconnections; quantities of alternative energy sources; and for the energy efficiency scenario, different load growth profiles. Data assumptions and limitations include the following: (i) (ii) (iii) (iv) (v) a time horizon of 1 January 2012 to 31 December 2027 in monthly time-steps with five load categories; three inflow scenarios: dry, average, and wet; a discount rate of 12%, with costs in US dollars in 2010 terms; a deficit cost (economic penalty for blackouts) of $3,500 per megawatt-hour (MWh); and for thermal plant fuel costs, the key input was the International Energy Agency s costs for their New Policies scenario. 8 Detailed instructions on how the OptGen software and power plant database were operated can be found in the associated report, GMS Strategic Environmental Assessment Power System Modelling: Processes and OptGen Database (ADB 2013b). 9

21 Description of the Scenarios West Phnom Penh 230 kv substation, Cambodia
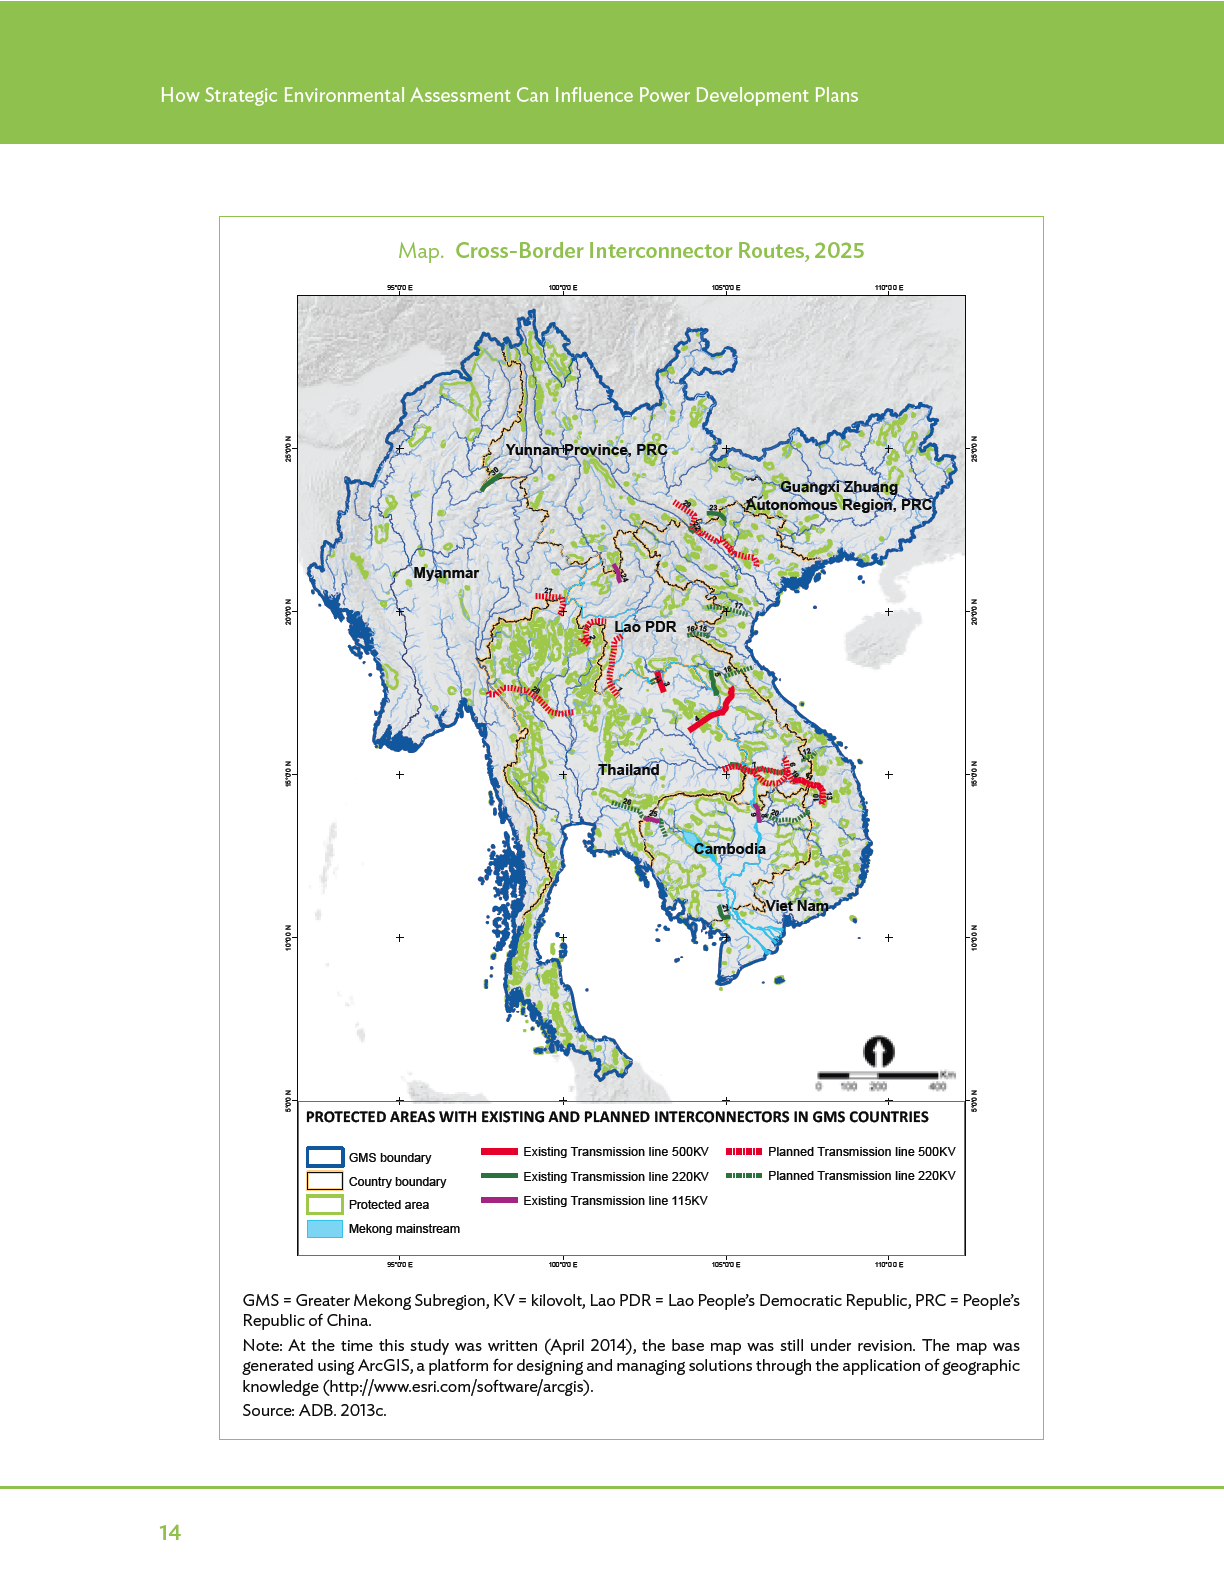
22 Description of the Scenarios Current Power Development Plan Scenario The current PDP scenario projects a very rapid expansion of installed generating capacity within the GMS, almost tripling from 2012 to 2025 (Figure 1). This expansion is driven by the projected increase in Yunnan Province and Guangxi Zhuang Autonomous Region in the PRC, which are expected to more than double in installed capacity from 53 gigawatts (GW) in 2012 to 136 GW by 2025, representing 40% of the total increase across the GMS. However, the dominance of Yunnan and Guangxi may still be understated. This is because SEA figures are based only on identified new plants, while new CSG information shows that total additional thermal and nuclear alone are greater than these figures. Among the LMB countries, Thailand and Viet Nam represent 88% of installed capacity in Viet Nam is projected to become the largest market among the four LMB countries by 2016, overtaking Thailand, with a demand 60% greater than that of Thailand by Viet Nam s installed capacity is projected to grow more than threefold from 27 GW to 94 GW in 2025, 30 GW of which will come from coal-fired capacity and a further 5 GW from nuclear capacity. Cross-border trade within the LMB countries will increase significantly, with the major flow being from hydropower export projects located in the Lao PDR to Thailand. The new coal-fired generating plants are clustered in southern Viet Nam, and in northern Viet Nam around Hai Phong; as well as in Guangxi and Yunnan. Nuclear generation is located in southeastern Viet Nam and in the coastal region of Guangxi. Large hydropower projects are developed across the region. 11
23 How Strategic Environmental Assessment Can Influence Power Development Plans Figure 1. Projected Installed Capacity by Country in the Greater Mekong Subregion, Current Power Development Plan Scenario (gigawatt-hours) Generating Capacity Existing 2025 Existing 2025 Existing 2025 Existing 2025 Existing 2025 Existing 2025 Cambodia Lao PDR Thailand Viet Nam Myanmar Yunnan + Guangxi Cogen + Other Gas Renewables Coal + Lignite Large/Medium Hydropower Nuclear Cogen = cogeneration, Lao PDR = Lao People s Democratic Republic. Source: ADB. 2013c. The projected cross-border flows in 2025 under the current PDP scenario are shown below. As can be clearly seen, the major flow is that from hydropower export projects located in the Lao PDR to Thailand, with smaller imports from hydropower export projects located in Myanmar. Viet Nam has limited imports from hydropower export projects in Cambodia, the Lao PDR, and CSG. Exports from Viet Nam to the Lao PDR represent flows into the southern part of the Lao PDR; at the same time, Viet Nam is importing from the northern part of the Lao PDR to its northern region (Figure 2 and Map). Under the current PDP scenario, this increased trade means the existing 1,037 kilometers (km) of interconnectors will increase by a further 2,743 km by The approximate routes for identified interconnectors are shown in the map. 12
24 Description of the Scenarios Figure 2. Projected Cross-Border Flows in the Lower Mekong Basin, Current Power Development Plan Scenario, 2025 (terawatt-hour) Myanmar CSG Lao PDR 4.4 Thailand Viet Nam 3.1 Cambodia TWh (flows >1 TWh only) CSG = China Southern Power Grid, Lao PDR = Lao People s Democratic Republic, TWh = terawatthour. Note: Only flows greater than 1 TWh are presented. Source: ADB. 2013c. Renewable Energy Scenario Under the renewable energy scenario, an additional 27 GW of renewable energy capacity is installed in LMB countries displacing big hydropower and thermal power plants. By 2025, the projected share of renewable energy in installed capacity across these countries rises from 9% under the current PDP scenario to 23%, and the share of generation from 7% to 16%. Solar installations in Thailand account for 9.4 GW of the additional renewable energy capacity, followed by small hydropower in Viet Nam of 4.8 GW, and 4 GW of solar also in Viet Nam. The contributions of wind and biomass or biogas are relatively small, reflecting limited highquality resources in the region that are not already targeted for development. The additional renewable energy generation output in the renewable energy scenario is shown in Figure 3. 13
25
26 Description of the Scenarios Figure 3. Renewable Energy Generation Output in the Renewable Energy Scenario, All Lower Mekong Basin Countries (gigawatt-hour per annum) 150,000 Additional Generation Output 100,000 50, Year PDP = power development plan. Source: ADB. 2013c. Biomass Geothermal Wind Solar Small Hydropower Existing PDP The resulting share of renewable energy technologies in total capacity and generation under the current PDP scenario and the renewable energy scenario is compared in Table 1 below. Table 1. Renewable Energy Shares by Scenario in Lower Mekong Basin Countries, 2025 (%) Current PDP Scenario Renewable Energy Scenario Security Aspect Capacity Output Capacity Output Cambodia Lao PDR Thailand Viet Nam LMB Lao PDR = Lao People s Democratic Republic, LMB = Lower Mekong Basin, PDP = power development plan. Source: ADB. 2013c. 15
27 How Strategic Environmental Assessment Can Influence Power Development Plans The additional renewable energy capacity is assumed to be located in areas of high resource potential, as follows: 9 (i) (ii) (iii) (iv) solar potential is concentrated in central and northeast Thailand and along Viet Nam s coastline; biomass potential is concentrated in the major rice-growing areas of the Chao Phraya basin, northeast Thailand, and the Mekong Delta; onshore wind potential is concentrated along Viet Nam s southeast coastline; and small hydropower is concentrated in the highland areas of the Lao PDR and Viet Nam. Energy efficiency measures will have a cost to implement, and that cost will rise with the volumes of measures implemented. To assume that energy efficiency measures are costless is equivalent to saying energy efficiency should be pursued without limit, which is clearly meaningless. However, while costs of a limited number of energy efficiency policies are publicly available, these are not readily transferable to estimating the costs of achieving a given volume of demand reduction through a mix of unspecified measures, which is what is required. Hence, an assumed cost curve for energy efficiency measures was created. An investment cost was estimated using an assumed payback period in years and the estimated short-run marginal cost of supply for each country was obtained from the power sector modeling. For example, if additional energy efficiency measures are expected to deliver electricity savings of 1 TWh annually and the estimated short-run marginal cost is $100/MWh, then the value of these savings is $100 million annually. With an assumed required payback period of 5 years, then the present value of these savings is $360 million (applying a discount rate of 12%). This represents the maximum amount at which it is economical to invest in energy efficiency measures to deliver these savings. To convert this into a levelized cost, energy efficiency investments were assumed to operate over 20 years, with the levelized cost being the present value of the monetary savings divided by the present value of the energy savings, or $48/MWh in this example. In the calculations, it was recognized that the costs of energy efficiency measures will increase as the volumes of savings increase. A cost curve was created by assuming rising payback periods for greater volumes (which implies a higher initial investment under this approach). The payback periods for the first 25% of additional savings in Thailand and Viet Nam were obtained from a recent study by ReEx Capital (2010). Each additional 25% block of savings was assumed to have a payback period 2 years longer. The payback periods for Cambodia and the Lao PDR are weighted averages of those for Thailand and Viet Nam. The additional renewable energy capacity in the renewable energy scenario allows the displacement of 9 GW of lignite and coal capacity relative to the current PDP scenario, mostly located in Viet Nam, under the global impacts case. Under the regional impacts case, 2 GW of large hydropower capacity, 5 GW of nuclear capacity, and 2 GW of lignite and coal 9 Maps showing the parts of the GMS with the greatest potential for different renewable technologies can be found in ADB (2013c). 16
28 Description of the Scenarios capacity are displaced. The relatively small quantity of large hydropower capacity displaced reflects the study s assumption that many of these projects are already committed (only eight projects are displaced in total). Energy Efficiency Scenario The energy efficiency scenario projects demand across the LMB to decrease by 15% by 2025 relative to the current PDP scenario. Energy efficiency potential in the industrial, commercial, and residential sectors was estimated in Thailand and Viet Nam using published sources, government plans, and international energy consumption benchmarks. These two countries comprise 96% of projected electricity demand to 2025 in the LMB countries. Cambodia and the Lao PDR are yet to develop national energy efficiency plans, and their national demand is a much smaller share of regional demand. Table 2 shows the resulting implied reductions in projected demand by 2025, relative to the current PDP scenario. Over the LMB as a whole, the additional energy efficiency potential identified is equivalent to a reduction in demand of approximately 15% relative to that in the current PDP scenario. 10 The reduction in demand under the energy efficiency scenario allows a reduction of 16 GW of lignite and coal capacity under the global impacts case and of 4 GW of large hydropower capacity (22 plants), 5 GW of nuclear capacity, and 8 GW of lignite and coal capacity under the regional impacts case. The much greater quantities of capacity that energy efficiency displaces relative to additional renewable energy capacity is evident. Security Aspect Table 2. Projected Demand by Scenario, 2025 Current PDP Scenario and Renewable Energy Scenario (terawatt-hour) Energy Efficiency Scenario (terawatt-hour) Percent Change Cambodia (10.0) Lao PDR (10.0) Thailand (16.1) Viet Nam (15.5) LMB (15.5) ( ) = negative, Lao PDR = Lao People s Democratic Republic, LMB = Lower Mekong Basin, PDP = power development plan. Source: ADB. 2013c. 10 For simplicity and in the absence of information on how this reduction may be distributed, it is assumed to be applied equally in each hour (i.e., peak demand reduces proportionally by the same amount as offpeak demand). 17
INTEGRATING STRATEGIC ENVIRONMENTAL ASSESSMENT INTO POWER PLANNING
 INTEGRATING STRATEGIC ENVIRONMENTAL ASSESSMENT INTO POWER PLANNING ASIAN DEVELOPMENT BANK INTEGRATING STRATEGIC ENVIRONMENTAL ASSESSMENT INTO POWER PLANNING ASIAN DEVELOPMENT BANK Creative Commons Attribution
Glossary of Energy Terms. Know Your Power. Towards a Participatory Approach for Sustainable Power Development in the Mekong Region
 Glossary of Energy Terms Know Your Power 2012 Towards a Participatory Approach for Sustainable Power Development in the Mekong Region List of terms Terms Page Terms Page Avoided cost 10 Installed capacity
Greater Mekong Sub-region Power Trade and Interconnection, Mongolia Grid Interconnection Perspectives
 Greater Mekong Sub-region Power Trade and Interconnection, Mongolia Grid Interconnection Perspectives Shigeru Yamamura( 山 村 繁 ), Energy Specialist, East Asia Department, Asian Development Bank GMS Power
Greater Mekong Subregion (GMS) Market Coordination
 Market Coordination") Greater Mekong Subregion (GMS) Market Coordination Anthony Jude Regional & Sustainable Development Department 27 November 2013 Sustainable Energy Training, Bangkok, Thailand Overview Participating Countries:
Greater Mekong Subregion (GMS) Market Coordination Anthony Jude Regional & Sustainable Development Department 27 November 2013 Sustainable Energy Training, Bangkok, Thailand Overview Participating Countries:
GMS Economic Cooperation Program
 GMS Economic Cooperation Program In 1992, six countries bordering the Mekong River Cambodia, People s Republic of China (specifically, Yunnan province and later, Guangxi Zhuang Autonomous Region), Lao
GLOBAL RENEWABLE ENERGY MARKET OUTLOOK 2013
 GLOBAL RENEWABLE ENERGY MARKET OUTLOOK 213 FACT PACK GUY TURNER HEAD OF ECONOMICS AND COMMODITIES APRIL 26, 213 GLOBAL RENEWABLE ENERGY MARKET OUTLOOK, 26 APRIL 213 1 INTRODUCTION This year s Global Renewable
ASEAN POWER GRID : ROAD TO MULTILATERAL POWER TRADING. Presented By: Bambang Hermawanto Chairman, ASEAN Power Grid Consultative Committee (APGCC)
") ASEAN POWER GRID : ROAD TO MULTILATERAL POWER TRADING Presented By: Bambang Hermawanto Chairman, ASEAN Power Grid Consultative Committee (APGCC) ERC Forum 2015, Bangkok 01 October 2015 Overview of ASEAN
ASEAN POWER GRID : ROAD TO MULTILATERAL POWER TRADING Presented By: Bambang Hermawanto Chairman, ASEAN Power Grid Consultative Committee (APGCC) ERC Forum 2015, Bangkok 01 October 2015 Overview of ASEAN
1. Energy. 2. Power. 3. Regional cooperation. 4. Greater Mekong Subregion. I. Asian Development Bank.
 September 2012 2012 Asian Development Bank All rights reserved. Published 2012. Printed in the Philippines. ISBN 978-92-9092-836-2 (Print), 978-92-9092-837-9 (PDF) Publication Stock No. RPT124977-2 Cataloging-In-Publication
Power Generation and Cross-border Grid Planning for the Integrated ASEAN Electricity Market: A Dynamic Linear Programming Model
 Chapter 3 Power Generation and Cross-border Grid Planning for the Integrated ASEAN Electricity Market: A Dynamic Linear Programming Model Youngho Chang Nanyang Technological University Yanfei Li Nanyang
Levelized Cost and Levelized Avoided Cost of New Generation Resources in the Annual Energy Outlook 2015
 June 2015 Levelized Cost and Levelized Avoided Cost of New Generation Resources in the Annual Energy Outlook 2015 This paper presents average values of levelized costs for generating technologies that
Overview on SEA output
 1 st SEA workshop of the revised PDP VII Overview on SEA output of Project N a t i o n a l P o w e r D e v e l o p m e n t P l a n p e r i o d 2 0 11-2 0 2 0, v i s i o n 2 0 3 0 ( P D P V I I ) P r e
Green Power Accounting Workshop: Concept Note For discussion during Green Power Accounting Workshop in Mexico City, May 13th 2011
 Introduction As more companies and government organizations prepare greenhouse gas (GHG) inventories that reflect the emissions directly and indirectly associated with their operations, they increasingly
ENERGY EFFICIENCY DEVELOPMENTS AND POTENTIAL ENERGY SAVINGS IN THE GREATER MEKONG SUBREGION
 ENERGY EFFICIENCY DEVELOPMENTS AND POTENTIAL ENERGY SAVINGS IN THE GREATER MEKONG SUBREGION ASIAN DEVELOPMENT BANK ENERGY EFFICIENCY DEVELOPMENTS AND POTENTIAL ENERGY SAVINGS IN THE GREATER MEKONG SUBREGION
Levelized Cost of New Electricity Generating Technologies
 Levelized Cost of New Electricity Generating Technologies The Energy Information Administration (EIA) produces forecasts of energy supply and demand for the next 20 years using the National Energy Modeling
SECTOR ASSESSMENT (SUMMARY): ENERGY 1
: ENERGY 1") Country Partnership Strategy: Kazakhstan 2012 2016 SECTOR ASSESSMENT (SUMMARY): ENERGY 1 Sector Road Map 1. Sector Performance, Problems, and Opportunities 1. Overview. Oil accounts for about a quarter
Country Partnership Strategy: Kazakhstan 2012 2016 SECTOR ASSESSMENT (SUMMARY): ENERGY 1 Sector Road Map 1. Sector Performance, Problems, and Opportunities 1. Overview. Oil accounts for about a quarter
SECTION 1. PREAMBLE 3 SECTION 2. EXECUTIVE SUMMARY 4 ABOUT US 6
 CONTENTS SECTION 1. PREAMBLE 3 SECTION 2. EXECUTIVE SUMMARY 4 ABOUT US 6 Disclaimer notice on page 8 applies throughout. Page 2 SECTION 1. PREAMBLE The New Energy Outlook (NEO) is Bloomberg New Energy
SECTOR ASSESSMENT (SUMMARY): ENERGY 1. 1. Sector Performance, Problems, and Opportunities
: ENERGY 1. 1. Sector Performance, Problems, and Opportunities") Country Partnership Strategy: Bangladesh, 2011 SECTOR ASSESSMENT (SUMMARY): ENERGY 1 Sector Road Map 1. Sector Performance, Problems, and Opportunities 1. Power generation gap. Bangladesh endures long
Country Partnership Strategy: Bangladesh, 2011 SECTOR ASSESSMENT (SUMMARY): ENERGY 1 Sector Road Map 1. Sector Performance, Problems, and Opportunities 1. Power generation gap. Bangladesh endures long
SECTOR ASSESSMENT (SUMMARY): ENERGY. 1. Sector Performance, Problems, and Opportunities
: ENERGY. 1. Sector Performance, Problems, and Opportunities") Country Operations Business Plan: Philippines, 2013 2015 SECTOR ASSESSMENT (SUMMARY): ENERGY 1. Sector Performance, Problems, and Opportunities 1. Challenges. Economic growth has been impeded in the Philippines
Country Operations Business Plan: Philippines, 2013 2015 SECTOR ASSESSMENT (SUMMARY): ENERGY 1. Sector Performance, Problems, and Opportunities 1. Challenges. Economic growth has been impeded in the Philippines
Tax Credit Extension: Impact on Renewables Investment and Emissions Outcomes
 CONCORD, MA - WASHINGTON, DC 47 Junction Square Drive Concord, MA 01742 978-369-5533 www.mjbradley.com MJB&A Issue Brief March 7, 2016 Tax Credit Extension: Impact on Renewables Investment and Emissions
The Greater Mekong Subregion at 20. Progress and Prospects
 The Greater Mekong Subregion at 20 Progress and Prospects The Greater Mekong Subregion at 20 Progress and Prospects 2012 Asian Development Bank All rights reserved. Published in 2012. Printed in the Philippines.
How To Plan For A New Power Plant In Manitoba
 Meeting Manitobans Electricity Manitoba is growing and is expected to continue doing so. Over the last years the province has enjoyed an expanding population and economy. These increases have led to many
[Sent to Covered Activities and Resource Mapping working groups on Oct. 21, 2011.]
![[Sent to Covered Activities and Resource Mapping working groups on Oct. 21, 2011.]](/thumbs/29/13809325.jpg "[Sent to Covered Activities and Resource Mapping working groups on Oct. 21, 2011.]") 2040 and 2050 Acreage Needs for Renewable Generation Dave Vidaver, Electricity Analysis Office, California Energy Commission dvidaver@energy.state.ca.gov In order to inform the DRECP process, Energy Commission
2040 and 2050 Acreage Needs for Renewable Generation Dave Vidaver, Electricity Analysis Office, California Energy Commission dvidaver@energy.state.ca.gov In order to inform the DRECP process, Energy Commission
Comparison of CO 2 Abatement Costs in the United States for Various Low and No Carbon Resources. Total System Levelized Cost Based on EIA LCOE
 Comparison of CO 2 Abatement Costs in the United States for Various Low and No Carbon Resources Every year the Energy Information Administration (EIA) publishes its Annual Energy Outlook (AEO). In the
H1 2014 LEVELISED COST OF ELECTRICITY - PV
 H1 2014 LEVELISED COST OF ELECTRICITY - PV JENNY CHASE 4 FEBRUARY 2014 LCOE OF PV, FEBRUARY 2014 1 PV EXPERIENCE CURVE, 1976-2013 (2013 $/W) 100 Cost per W (2013 $) 1976 10 1985 2003 2006 1 2012 2013 Q3
Cutting Australia s Carbon Abatement Costs with Nuclear Power
 Cutting Australia s Carbon Abatement Costs with Nuclear Power Martin Nicholson, October 2011 Abstract The Australian Government Treasury modelling of a carbon price shows that Australia must purchase the
The Kingdom of Thailand: Capacity Building for the Neighbouring Countries Economic Development Cooperation Agency
 Technical Assistance Report Project Number: 40137 December 2006 The Kingdom of Thailand: Capacity Building for the Neighbouring Countries Economic Development Cooperation Agency The views expressed herein
Preparatory Paper on Focal Areas to Support a Sustainable Energy System in the Electricity Sector
 Preparatory Paper on Focal Areas to Support a Sustainable Energy System in the Electricity Sector C. Agert, Th. Vogt EWE Research Centre NEXT ENERGY, Oldenburg, Germany corresponding author: Carsten.Agert@next-energy.de
Value of storage in providing balancing services for electricity generation systems with high wind penetration
 Journal of Power Sources 162 (2006) 949 953 Short communication Value of storage in providing balancing services for electricity generation systems with high wind penetration Mary Black, Goran Strbac 1
Present and Future Cost of New Utility- Scale Electricity Generation
 Present and Future Cost of New Utility- Scale Electricity Generation Version 1.0 July 10 Matt Croucher and Tim James L. William Seidman Research Institute W. P. Carey School of Business Arizona State University
Emissions Comparison for a 20 MW Flywheel-based Frequency Regulation Power Plant
 Emissions Comparison for a 20 MW Flywheel-based Frequency Regulation Power Plant Beacon Power Corporation KEMA Project: BPCC.0003.001 May 18, 2007 Final Report with Updated Data Emissions Comparison for
Keisuke Sadamori Director, Energy Markets and Security International Energy Agency Kuala Lumpur, 8 October
 Keisuke Sadamori Director, Energy Markets and Security International Energy Agency Kuala Lumpur, 8 October The context Southeast Asia is a key pillar of Asia s growth A mix of countries with disparate
2014 Residential Electricity Price Trends
 FINAL REPORT 2014 Residential Electricity Price Trends To COAG Energy Council 5 December 2014 Reference: EPR0040 2014 Residential Price Trends Inquiries Australian Energy Market Commission PO Box A2449
CONTENTS. Promising storage capacity estimates. Expansion of coal in the next 30 years. The economic potential of CCS in Vietnam.
 CCS DEPLOYMENT POTENTIAL IN VIETNAM S POWER SECTOR Presented by: Nhan T. Nguyen With contribution from Minh Ha-Duong and Anh T.H. Nguyen Centre International de Recherche sur l Environnement et le Développement
Unlocking Electricity Prices:
 Volume 2 A BidURenergy White Paper Unlocking Electricity Prices: A White Paper Exploring Price Determinants by: Mark Bookhagen, CEP pg. 2 Written by Mark Bookhagen, CEP Introduction In order to be classified
Power Generation. Lilian Macleod Power Supply Manager National Grid
 Power Generation Place your chosen image here. The four corners must just cover the arrow tips. For covers, the three pictures should be the same size and in a straight line. This text box and image can
Some micro- and macro-economics of offshore wind*
 Some micro- and macro-economics of offshore wind* EPSRC SUPERGEN Wind Energy Hub University of Strathclyde May 2016 Fraser of Allander Institute Energy Modelling Team Fraser of Allander Institute Department
Off-grid Hybrid Solar: Market Overview, Business Case & Technical Considerations
 Off-grid Hybrid Solar: Market Overview, Business Case & Technical Considerations Craig Chambers AECOM Australia Pty Ltd of 420 George Street, Sydney, NSW 2000 Australia Keywords : Solar PV, sustainability,
Canada A Global Leader in Renewable Energy Enhancing Collaboration on Renewable Energy Technologies
 Canada A Global Leader in Renewable Energy Enhancing Collaboration on Renewable Energy Technologies Energy and Mines Ministers Conference Yellowknife, Northwest Territories August 2013 Canada A Global
Reasons for the drop of Swedish electricity prices
 Reasons for the drop of Swedish electricity prices Project for Svensk Energi Dr. Lion Hirth Neon Neue Energieökonomik GmbH Karl-Marx-Platz 12, 12043 Berlin, Germany hirth@neon-energie.de Summary report
Electricity Costs White Paper
 Electricity Costs White Paper ISO New England Inc. June 1, 2006 Table of Contents Executive Summary...1 Highlights of the Analysis...1 Components of Electricity Rates...2 Action Plan for Managing Electricity
Draft consolidated baseline and monitoring methodology ACM00XX
 Draft consolidated baseline and monitoring methodology ACM00XX Consolidated baseline and monitoring methodology for new grid connected fossil fuel fired power plants using a less GHG intensive technology
Australian Remote Renewables: Opportunities for Investment
 Australian Remote Renewables: Opportunities for Investment The largely untapped remote clean energy market and funding support available from the Australian Government creates an attractive opportunity
RESPONSE TO PUB ORDER 117/06. PUB Order 117/06 Directive 6
 RESPONSE TO PUB ORDER 117/06 PUB Order 117/06 Directive 6 6. Manitoba Hydro shall file a General Rate Application for the fiscal years 2007/08 and 2008/09 by no later than August 1, 2007 which shall include
CRS Report Summaries WORKING DRAFT
 CRS Report Summaries R40147 Green Buildings This is a definition and analysis of the cost and benefits of green buildings. It also cites agencies and laws that encourage the building of environmentally
CO 2 Emissions from Electricity Generation and Imports in the Regional Greenhouse Gas Initiative: 2010 Monitoring Report
 CO 2 Emissions from Electricity Generation and Imports in the Regional Greenhouse Gas Initiative: 2010 Monitoring Report August 6, 2012 1 This report was prepared on behalf of the states participating
A macro-economic viewpoint. What is the real cost of offshore wind? siemens.com / wind
 A macro-economic viewpoint What is the real cost of offshore wind? siemens.com / wind in the cost debate A broader view of the value of renewables. Globally, installed power generation capacity currently
Macro-economic impact of Renewable Energy Production in Belgium. 21 October 2014
 Macro-economic impact of Renewable Energy Production in Belgium 21 October 2014 Context and objectives of the study Renewable energy deployment among key solutions for meeting energy challenges to be addressed
Carbon Price Transfer in Norway
 Public ISDN nr. 978-82-93150-03-9 THEMA Report 2011-1 Carbon Price Transfer in Norway The Effect of the EU-ETS on Norwegian Power Prices Commissioned by Energy Norway, Federation of Norwegian Industries
Energy Productivity & Pricing
 Energy Productivity & Pricing Markets for energy, renewable energy and carbon Dr Jenny Riesz February 2014 2 Average electricity retail prices Electricity price rises CSIRO Future Grid (2013) Change and
Asian Journal on Energy and Environment
 As. J. Energy Env. 2005, 6(02), 139-144 Asian Journal on Energy and Environment ISSN 1513-4121 Available online at www.asian-energy-journal.info The Small Hydropower Project as the Important Renewable
THE COSTS OF DECARBONISING ELECTRICITY GENERATION
 THE COSTS OF DECARBONISING ELECTRICITY GENERATION This technical annex to Building a low-carbon economy presents further details on the analysis underlying the estimates of the costs of decarbonising the
SECTOR ASSESSMENT (SUMMARY): ENERGY 1
: ENERGY 1") Country Partnership Strategy: Uzbekistan 2012 2016 SECTOR ASSESSMENT (SUMMARY): ENERGY 1 Sector Road Map 1. Sector Performance, Problems, and Opportunities 1. The energy sector underpins Uzbekistan s sustained
Country Partnership Strategy: Uzbekistan 2012 2016 SECTOR ASSESSMENT (SUMMARY): ENERGY 1 Sector Road Map 1. Sector Performance, Problems, and Opportunities 1. The energy sector underpins Uzbekistan s sustained
E N G I N E E R I N G
 Purpose If the customer s proposed project proceeds to Gate 1 of the Integrated Customer Solutions (ICS) process (see the ICS Process and Proposal Submission Guide), the customer must prepare a Load Displacement
Busting Myths about Renewable Energy
 Symposium on Renewable Energy: the Future for Australia, UNSW 15 April 2014 Busting Myths about Renewable Energy Dr Mark Diesendorf Institute of Environmental Studies University of New South Wales Sydney,
Alternative RE Approach Technical Support Document
 Alternative RE Approach Technical Support Document 1.1. Introduction Renewable energy (RE) is a cost-effective approach for reducing carbon dioxide (CO 2) emissions from fossil fuel-fired electric generating
Michigan Nuclear Power Plants Contribution to the State Economy
 Michigan Nuclear Power Plants Contribution to the State Economy PREPARED FOR PREPARED BY Mark Berkman, Ph.D. Dean Murphy, Ph.D. September 2015 This report was prepared for Nuclear Matters. All results
Greenhouse Gas Offsets and Renewable Energy Certificates: Distinct Commodities in an Evolving Market The Climate Trust
 Greenhouse Gas Offsets and Renewable Energy Certificates: Distinct Commodities in an Evolving Market The Climate Trust Introduction The framework for future climate policy is emerging in the United States
State of Renewables. US and state-level renewable energy adoption rates: 2008-2013
 US and state-level renewable energy adoption rates: 2008-2013 Elena M. Krieger, PhD Physicians, Scientists & Engineers for Healthy Energy January 2014 1 Introduction While the United States power sector
Role of Natural Gas in a Sustainable Energy Future
 Role of Natural Gas in a Sustainable Energy Future Alexander Medvedev, Deputy Chairman of Gazprom Management Committee, Director General of Gazprom Export 2 nd Ministerial Gas Forum Doha, 30 November 2010
Western Australian Feed-In Tariff Discussion Paper
 Western Australian Feed-In Tariff Discussion Paper OVERVIEW In September 2008, the incoming State Government announced its intention to introduce a feed-in tariff as part of the Liberal Plan for Environmental
Energy and Consumer Impacts of EPA s Clean Power Plan. Prepared for the American Coalition for Clean Coal Electricity
 Energy and Consumer Impacts of EPA s Clean Power Plan Prepared for the American Coalition for Clean Coal Electricity Contents Executive Summary Overview of the Clean Power Plan NERA Methodology Baseline
REQUEST FOR PROPOSALS
 REQUEST FOR PROPOSALS RENEWABLE ENERGY CERTIFICATES SOURCED FROM RENEWABLE RESOURCES CERTIFIED BY THE CALIFORNIA ENERGY COMMISSION February 18, 2015 1.0 Introduction of Pittsburg Power Company dba Island
Greenhouse gas abatement potential in Israel
 Greenhouse gas abatement potential in Israel Israel s GHG abatement cost curve Translated executive summary, November 2009 1 Executive Summary Background At the December 2009 UNFCCC Conference in Copenhagen,
Opportunity, Policy, and Practice for Renewable Energy: New Mexico Case Study
 Opportunity, Policy, and Practice for Renewable Energy: New Mexico Case Study 1 Federal policy: RPS, RES, CES Program Design Element S 3813 Renewable Energy Promotion Act 2010 (Bingaman) S. 1462 American
Medium voltage products. Technical guide Smart grids
 Medium voltage products Technical guide Smart grids Contents 2 1. Introduction 8 2 The different components and functions of a smart grid 8 2.1 Integration of distributed renewable energy sources 9 2.2
System-friendly wind power
 System-friendly wind power Lion Hirth (neon) Simon Müller (IEA) BELEC 28 May 2015 hirth@neon-energie.de Seeking advice on power markets? Neon Neue Energieökonomik is a Berlin-based boutique consulting
ACCOUNTING FOR ASIA S NATURAL CAPITAL
 ACCOUNTING FOR S NATURAL CAPITAL DRIVING THE TRANSITION TO A RESOURCE-EFFICIENT GREEN ECONOMY Asia s rapid economic growth during recent decades has been accompanied by serious depletion of the region
Germany's energy transition: Status quo and Challenges.
 Ulrich Benterbusch Germany's energy transition: Status quo and Challenges. 2 nd Session Group of Experts on Renewable Energy, UNECE, Geneva 1 Agenda. Energy transition: Status quo and official goals. German
ENERGY SECTOR JOBS TO 2030: A GLOBAL ANALYSIS
 ENERGY SECTOR JOBS TO : A GLOBAL ANALYSIS Final report For Greenpeace International Authors Jay Rutovitz, Alison Atherton Institute for Sustainable Futures UTS 2009 Disclaimer While all due care and attention
Interview: Aurélie Faure, Financial Analyst at Dexia Asset Management
 Research letter n 09/03 October 2009 http://www.carbonium.fr/pdf/research0903.pdf CONTENTS Interview: Aurélie Faure, Financial Analyst at Dexia Asset Management... p. 1 Hot topics in Copenhagen... p. 3
Portfolio Manager and Green Power Tracking
 Building owners and operators can buy green power products as a way of reducing the environmental impacts associated with purchased electricity use in their facilities. The Environmental Protection Agency
Summary of the Impact assessment for a 2030 climate and energy policy framework
 Summary of the Impact assessment for a 2030 climate and energy policy framework Contents Overview a. Drivers of electricity prices b. Jobs and growth c. Trade d. Energy dependence A. Impact assessment
Inland Waterway Infrastructure - Mekong River cruise promoting factor. Tokyo September 2010
 Inland Waterway Infrastructure - Mekong River cruise promoting factor Tokyo September 2010 Mekong river system Mekong river system Land and resources: Parts of China, Myanmar and Viet Nam, nearly 1/3 of
IRP 2010 Energy Forecast Revision 2 Report
 IRP 2010 Energy Forecast Revision 2 Report Report prepared for IRP 2010 Revision 2 By: Systems Operations and Planning Date: July 2010 IRP 2010 Revision 2 Forecast Report Page 1 EXECUTIVE SUMMARY Forecasts
4. Comparison with DECC (2014) Estimated impacts of energy and climate change policies on energy prices and bills
 Estimated impacts of energy and climate change policies on energy prices and bills") Energy prices and bills - supplementary tables Contents: 1. Energy prices and bills 2. Assumptions 3. Scenarios to 2030 4. Comparison with DECC (2014) Estimated impacts of energy and climate change policies
Energy prices and bills - supplementary tables Contents: 1. Energy prices and bills 2. Assumptions 3. Scenarios to 2030 4. Comparison with DECC (2014) Estimated impacts of energy and climate change policies
Republic of the Union of Myanmar: Support for Strengthening Public Debt Management
 Technical Assistance Report Project Number: 47225 Capacity Development Technical Assistance (CDTA) December 2013 Republic of the Union of Myanmar: Support for Strengthening Public Debt Management The views
Kingdom of Thailand: Strengthening Integrated Water and Flood Management Implementation
 Technical Assistance Report Project Number: 46231 Policy and Advisory Technical Assistance (PATA) December 2012 Kingdom of Thailand: Strengthening Integrated Water and Flood Management Implementation (Financed
The Real Cost of Electrical Energy. Outline of Presentation
 2 Outline of Presentation Data Sources Electricity Demand and Supply Cost to Meet Demand Profile Electricity Pricing Cost Impact of Dispatching Generation (Load Following) Simplifying Assumptions Electricity
1. a) How effective is the current Climate Change Act 2010 in driving climate change action by:
 How effective is the current Climate Change Act 2010 in driving climate change action by:") Public Submission Review of Climate Change Act 2010 City of Melbourne Questions 1. a) How effective is the current Climate Change Act 2010 in driving climate change action by: Government? (tick one only)
Public Submission Review of Climate Change Act 2010 City of Melbourne Questions 1. a) How effective is the current Climate Change Act 2010 in driving climate change action by: Government? (tick one only)
NERA Analysis of Energy Supplier Margins
 7 December 2009 NERA Analysis of Energy Supplier Margins By Graham Shuttleworth Even though wholesale energy prices have fallen recently, gas and electricity suppliers are earning very little margin on
A sustainable energy and climate policy for the environment, competitiveness and long-term stability
 2009-02-05 A sustainable energy and climate policy for the environment, competitiveness and long-term stability The party leaders of Alliance for Sweden entered into an agreement today on a long-term,
SECTOR ASSESSMENT (SUMMARY): ENERGY
: ENERGY") Provincial Renewable Energy Project (RRP SOL 46014) SECTOR ASSESSMENT (SUMMARY): ENERGY Sector Road Map 1. Sector Performance, Problems, and Opportunities 1. Grid-connected electricity is generated and
Provincial Renewable Energy Project (RRP SOL 46014) SECTOR ASSESSMENT (SUMMARY): ENERGY Sector Road Map 1. Sector Performance, Problems, and Opportunities 1. Grid-connected electricity is generated and
Towards a French Nuclear Phase-Out?
 Towards a French Nuclear Phase-Out? New Directions in the Energy Debate Yves Marignac Director of Nuclear Energy Conference 2015 Europe without nuclear - What does Europe's energy future look like? 19
BUSINESS MODELS TO REALIZE THE POTENTIAL OF RENEWABLE ENERGY AND ENERGY EFFICIENCY IN THE GREATER MEKONG SUBREGION
 BUSINESS MODELS TO REALIZE THE POTENTIAL OF RENEWABLE ENERGY AND ENERGY EFFICIENCY IN THE GREATER MEKONG SUBREGION ASIAN DEVELOPMENT BANK BUSINESS MODELS TO REALIZE THE POTENTIAL OF RENEWABLE ENERGY AND
New York s Upstate Nuclear Power Plants Contribution to the State Economy
 New York s Upstate Nuclear Power Plants Contribution to the State Economy PREPARED FOR New York State IBEW Utility Labor Council Rochester Building and Construction Trades Council Central and Northern
Photovoltaic in Mexico Recent Developments and Future
 Photovoltaic in Mexico Recent Developments and Future Rodolfo Martínez Strevel Berlin, Germany May 23th, 2013 Bufete de Tecnología Solar, S.A. (BUTECSA) Production of Primary Energy in Mexico, 2011 % 7,0
Fact Sheet on China s energy sector and Danish solutions
 Fact Sheet on China s energy sector and Danish solutions 1. EXPANSION WITH RENEWABLE ENERGY: China focuses on a massive expansion with non fossil energy that is renewable energy and nuclear energy. The
CHINA 2050 HIGH RENEWABLE ENERGY PENETRATION SCENARIO AND RODAMAP STUDY
 国 家 发 展 和 改 革 委 员 会 能 源 研 究 所 Energy Research Institute National Development and Reform Commission CHINA 2050 HIGH RENEWABLE ENERGY PENETRATION SCENARIO AND RODAMAP STUDY CHINA NATIONAL RENEWABLE ENERGY
ERCOT Analysis of the Impacts of the Clean Power Plan Final Rule Update
 ERCOT Analysis of the Impacts of the Clean Power Plan Final Rule Update ERCOT Public October 16, 2015 ERCOT Analysis of the Impacts of the Clean Power Plan Final Rule Update In August 2015, the U.S. Environmental
POLICY BRIEF: Renewable Energy and the Carbon Price Brief prepared for WWF- Australia
 REPUTEX ANALYTICS Brief prepared for WWF- REPORT SUMMARY This brief prepared by RepuTex and commissioned by WWF-, examines the relationship between the carbon price and renewable energy generation in.
How To Improve Office Space At The Asian Development Bank
 May 2013 Special Capital Expenditure Budget Proposal: Improving Office Facilities of Selected Resident Missions ABBREVIATIONS ADB Asian Development Bank BPBM BPMSD OAS OIST Budget and Management Services
ALL ISLAND GRID STUDY WORK STREAM 4 ANALYSIS OF IMPACTS AND BENEFITS
 ALL ISLAND GRID STUDY WORK STREAM 4 ANALYSIS OF IMPACTS AND BENEFITS January 2008 Executive Summary The All Island Grid Study is the first comprehensive assessment of the ability of the electrical power
issue brief Colorado s Pathway to Cutting Carbon Pollution www.nrdc.org/policy www.facebook.com/nrdc.org www.twitter.com/nrdc
 issue brief Colorado s Pathway to Cutting Carbon Pollution The Clean Power Plan, finalized by the U.S. Environmental Protection Agency, is a game changer because it sets the first-ever limits on carbon
Opportunities for the Georgian Hydropower industry to benefit from Directive 2009/28EC of the European Parliament
 Promotion hidroenergetikasi Project investiciebis (HIPP) Opportunities for the Georgian Hydropower industry to benefit from Directive 2009/28EC of the European Parliament What Europe wants to do Comply
Policy Brief International Renewable Energy Investment Credits Under a Federal Renewable Energy Standard
 Policy Brief International Renewable Energy Investment Credits Under a Federal Renewable Energy Standard Andrew Stevenson and Nigel Purvis* July 13, 2010 Key Findings Allowing regulated entities to comply
A note on the inefficiency of technology- and region-specific renewable energy support - The German case
 A note on the inefficiency of technology- and region-specific renewable energy support - The German case AUTHOR Cosima Jägemann EWI Working Paper, No 14/05 March 2014 Institute of Energy Economics at the
Steven Beck Head of Trade Finance Private Sector Operations Department Asian Development Bank
 Briefs March No. 11 2013 Key Points A gap in trade finance is represented by unmet demand for lending and guarantees to support $1.6 trillion in trade, $425 billion of which is in developing Asia. Availability
Asia Pacific Public Electronic Procurement Network
 Technical Assistance Report Project Number: 47192-001 Regional Capacity Development Technical Assistance (R-CDTA) December 2013 Asia Pacific Public Electronic Procurement Network (Cofinanced by the Republic
Chile Economy-wide implications of a carbon tax in the Chilean electricity generation sector
 Chile Economy-wide implications of a carbon tax in the Chilean electricity generation sector A Policy Brief An output of the CDKN funded project on modelling the socio-economic implications of mitigation
2013 Residential Electricity Price Trends
 FINAL REPORT 2013 Residential Electricity Price Trends 13 December 2013 Reference: EPR0036 Final Report Inquiries Australian Energy Market Commission PO Box A2449 Sydney South NSW 1235 E: aemc@aemc.gov.au