Undergraduate Degree Completion by Age 25 to 29 for Those Who Enter College 1947 to 2002
|
|
|
- August Higgins
- 8 years ago
- Views:
Transcription
1 Undergraduate Degree Completion by Age 25 to 29 for Those Who Enter College 1947 to 2002 About half of those who start higher education have completed a bachelor's degree by the ages of 25 to 29 years. This is nearly a constant in higher education: For the last 50 years the share of 25 to 29 year olds with at least some college that has completed at least four years of college has fluctuated within a narrow range of 48 to 54 percent. College completion is difficult to measure over many decades because definitions of who has started college and who has completed college were changed by the Census Bureau in the early 1990s. Nevertheless these data suggest that some modest improvement in baccalaureate degree completion by ages 25 to 29 years has occurred since the 1950s. Moreover additional progress may have occurred during the 1990s. Of course these trends and patterns vary widely across different groups of the population. Only about 29 percent of Hispanics who start college will have completed a bachelor's degree by age 25 to 29 years, compared to about 70 percent of Asian/Pacific Islanders. This pattern reverses for associate degrees. By ages 25 to 29 years about 8 percent of Asian/Pacific Islanders will have completed an associate degree, compared to nearly 20 percent of Hispanics. Women appear to be making greater gains in bachelor's degree completion rates than are men over the last decade. These and other significant findings of college completion by age 25 to 29 years for those who enter college are gleaned from our examination of Census Bureau reports on educational attainment dating back to The Data Sources. For various years between 1940 and 1962, and each year since 1964, the Census Bureau has gathered and reported data on the educational attainment of people in the United States. These data describe the amount of education held by people classified by age, gender, race/ethnicity, geographic location and other useful ways of describing people. Most of the data on educational attainment have been gathered in the March Supplement to the monthly Current Population Survey. The CPS is a monthly survey of about 50,000 households mainly designed to gather data on employment and unemployment of the civilian, noninstitutional population of the United States. An October supplement gathers important data on school enrollment. The March supplement gathers data on educational attainment and other important population descriptions such as income. In addition to the March Current Population Survey supplement, detailed data on educational attainment are gathered in the decennial census of the population. Both the CPS and decennial census data on educational attainment are available on the Census Bureau's website at: Postsecondary Education OPPORTUNITY Page 1

2 Definitions. There are actually two distinct sets of data reported by the Census Bureau measuring educational attainment. The first data are those reported through 1991 based on one set of definitions, and the second set are those reported since 1992 based on a second set of definitions. Through 1991 the Census Bureau measured educational attainment in terms of years of school completed. Completing four years of college has been treated in this analysis as graduating from college with a bachelor's degree. In addition, the Census Bureau only counted those who had completed at least a full year of college as having enrolled in college. Anyone who did not complete a full year of college was not counted as having begun college. Beginning in 1992 the Census Bureau began reporting CPS data on educational attainment in terms of highest degree completed. In part because students are taking longer to complete degrees this now more accurately measures the educational attainment expectation of employers and others who use college credentials. Beginning in 1992 the Census Bureau also began counting those who started college but left before completing a full year as having some college. Reviewing these two different definitions we judge the current definitions more useful to the study of college completion. And for our purposes the second change--counting all who start college-- reduces somewhat the measured college completion rates reported in this analysis for the years 1992 through The pre-1992 data present a somewhat inflated picture of college completion rates in the U.S. between 1947 and Age. For years the Census Bureau has used the 25 to 29 age group as a useful reference for looking at degree attainment. (Other age groups are used for other purposes.) We use the same age group knowing that some people may be still completing their bachelor's degree in this age range and others will complete their degree later in life. Our analysis of the 2002 data across age levels suggests that the proportion of the cohort having completed a bachelor's degrees is very close to its peak for this cohort. College Completion Rates In March of 2002 there were 18,310,000 people ages 25 to 29 years old in the civilian, noninstitutional population of the U.S. Of these 10,623,000 had at least some college enrollment experience. Of those with college experience 5,372,000 or 50.6 percent had completed a bachelor's degree or more. Another 1,505,000 or 14.2 percent of those with some college experience had completed an associate's degree, either occupational or academic. These are the college completion rates for the bachelor's and associate's degrees for The chart on page 1 of this issue of OPPORTUNITY shows the share of the gender and each distinct racial/ethnic groups' bachelor's degree completion rates for By gender females had slightly greater bachelor's degree completion rates at 51.7 percent than did males at 49.3 percent. Asian/Pacific Islanders had by far the highest bachelor's degree completion rates at 69.7 percent. White non-hispanics had the second highest rate at 54.6 percent. Black non-hispanics had a far lower bachelor's degree completion rate at 33.8 percent. Hispanics had the lowest bachelor's degree completion rate at 28.8 percent. Postsecondary Education OPPORTUNITY Page 2

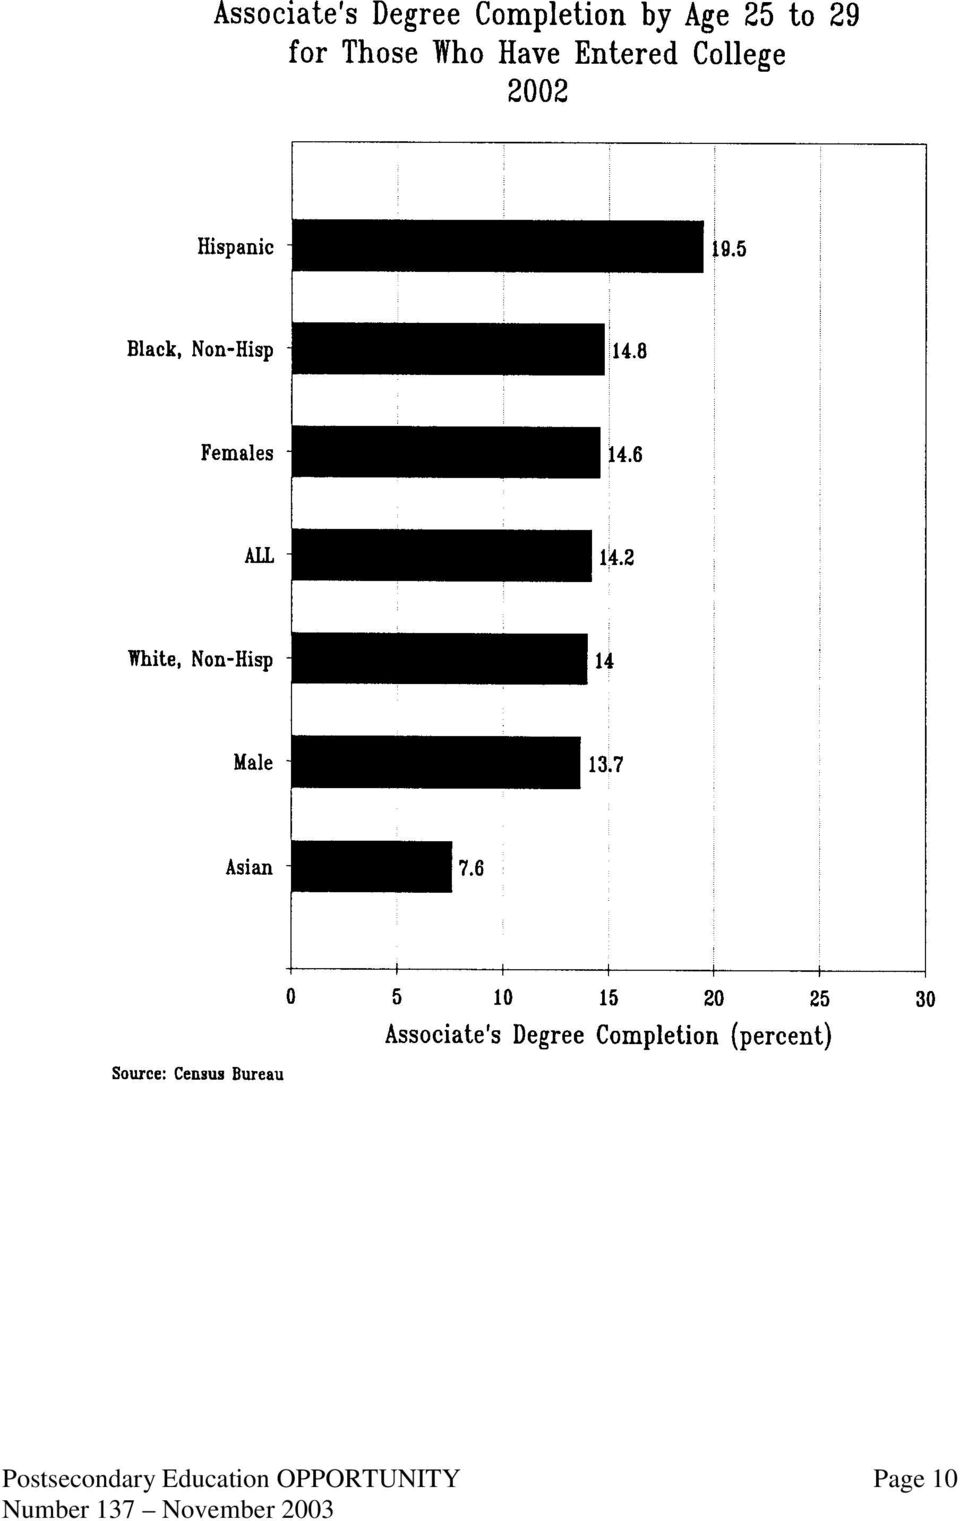
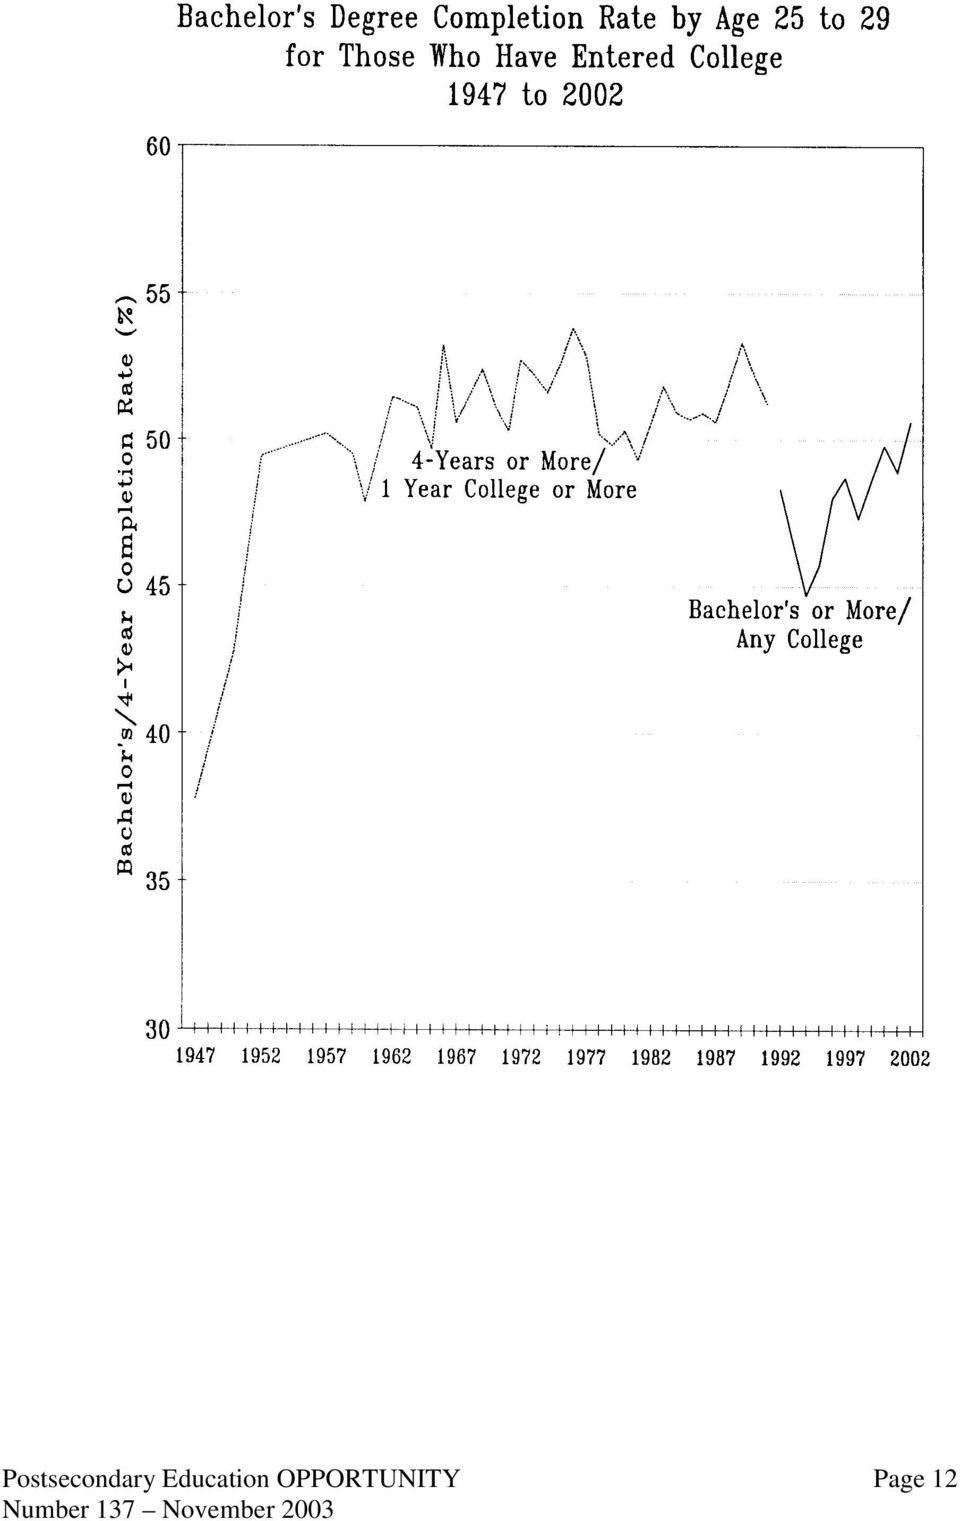
3 The chart on this page shows the proportion of 25 to 29 year olds holding associate degrees, either occupational or academic. Associate degree completion rates varied again by gender and race/ethnicity: 14.6 percent of females ages 25 to 29 held associate degrees, compared to 13.7 percent of males. Hispanics were most likely to have earned associate degrees (19.5 percent), and Asian/PIs were least likely (7.6 percent). When bachelor and associate degree completion rates are combined a picture of significant success in higher education emerges. For 25 to 29 year olds that have started higher education 64.8 percent have a college degree to show for their efforts. By gender 66.3 percent of women and 63.0 percent of men have a college degree. By racial/ethnic categories degree completion rates were 77.3 percent for Asians, 68.6 percent for white non-hispanics, 48.6 percent for black non-hispanics and 48.3 percent for Hispanics. Age Why ages 25 to 29 for measuring bachelor's degree completion? The Census Bureau has adopted this as a convention for measuring recently achieved educational attainment, as in: socdemo/education/taba-2.pdf But as the chart on page 4 makes clear, the proportion of the population starting college and completing at least a bachelor's degree does not increase appreciably among older age cohorts. It remains in the 50 to 54 percent range through age 65 to 69 years. Trends The second chart on this page shows bachelor's degree completion rates between 1947 and Two distinct plots are shown because of the distinct definitions employed by the Census Bureau: years of school completed from 1947 to 1991, and highest degree completed from 1992 through Under the old Census Bureau definition four year college completion rates remained quite stable at around 50 percent between 1952 and Under the new definition the bachelor's degree completion rate is somewhat lower, between 45 and 50 percent, but appears to be increasing between 1994 and Over this very long period of time the picture that emerges is one of great stability in bachelor's degree completion. About half of those who start college complete a bachelor's degree. This is just as true today as it was a half century ago. Overall there is very little or no trend upward or downward to these data. This finding of stability clashes sharply with other Census Bureau data on bachelor's degree attainment (not completion) for 25 to 29 year olds. Attainment measures the share of the population with a bachelor's degree. Completion measures the share of those who start college with a bachelor's degree. Postsecondary Education OPPORTUNITY Page 3

4 The chart on the next page shows the proportion of the U.S. population age 25 to 29 with a bachelor's degree or more. This is the attainment rate. It has increased from about 5.9 percent in 1940 to 29.3 percent by With the exception of disruptions caused by World War II in the late 1940s and the Vietnam War during the 1970s, growth in the share of the 25 to 29 year old population with a bachelor's degree or more has been steady and substantial. This growth in bachelor's degree attainment contrasts sharply with the lack of growth in bachelor's degree completion. Between 1952 and 2002 the bachelor's degree completion rate increased from 50.2 to 50.6 percent, or by 0.4 percentage points. Between 1952 and 2002 the bachelor's degree attainment rate increased from 10.1 to 29.3 percent, or by 19.2 percentage points. Clearly the gains in bachelor's degree attainment rates have occurred prior to college, namely in increased high school graduation rates and/or college continuation rates for high school graduates. Probably both. These rates may not necessarily move together, but their cumulative effect-- measured in college participation rates--has been relentlessly upward over the last five decades. The gains in bachelor's degree attainment rates have not been produced within higher education. Higher education completion rates have been flat for 50 years. Colleges and universities have certainly produced many more bachelor's degrees over the last 50 years. But these gains are entirely attributable to gains in numbers and rates of high school graduation and college continuation, not college completion. Our colleges and universities continue to graduate the students they admit at the same rate they did 50 years ago. There has been no progress within higher education in five decades. Undergraduate Degree Completion Using the most recent definitions of college enrollment and graduation employed by the Census Bureau since 1992 we can study recent trends and patterns in undergraduate degree completion rates. These data now span eleven years, and updates our previous analysis of these data reported in the December 2000 issue of OPPORTUNITY. As shown in the chart on the following page bachelor's degree completion rates for 25 to 29 year olds have ranged between 44.7 percent in 1994 to 50.6 percent in Clearly bachelor's degree completion rates increased during most of the 1990s. These 25 to 29 year olds began their college careers about a decade earlier, between 1982 and Associate degree completion rates have ranged between 13.5 percent in 1992 and 1997, and 15.7 percent in Between 1992 and 2002 this rate has increased from 13.5 to 14.2 percent. Both bachelor's and associate's degree completion rates have increased during the last decade. Thus, between 1992 and 2002 the undergraduate degree completion rate increased from 61.8 to 64.8 percent among 25 to 29 year olds. Postsecondary Education OPPORTUNITY Page 4

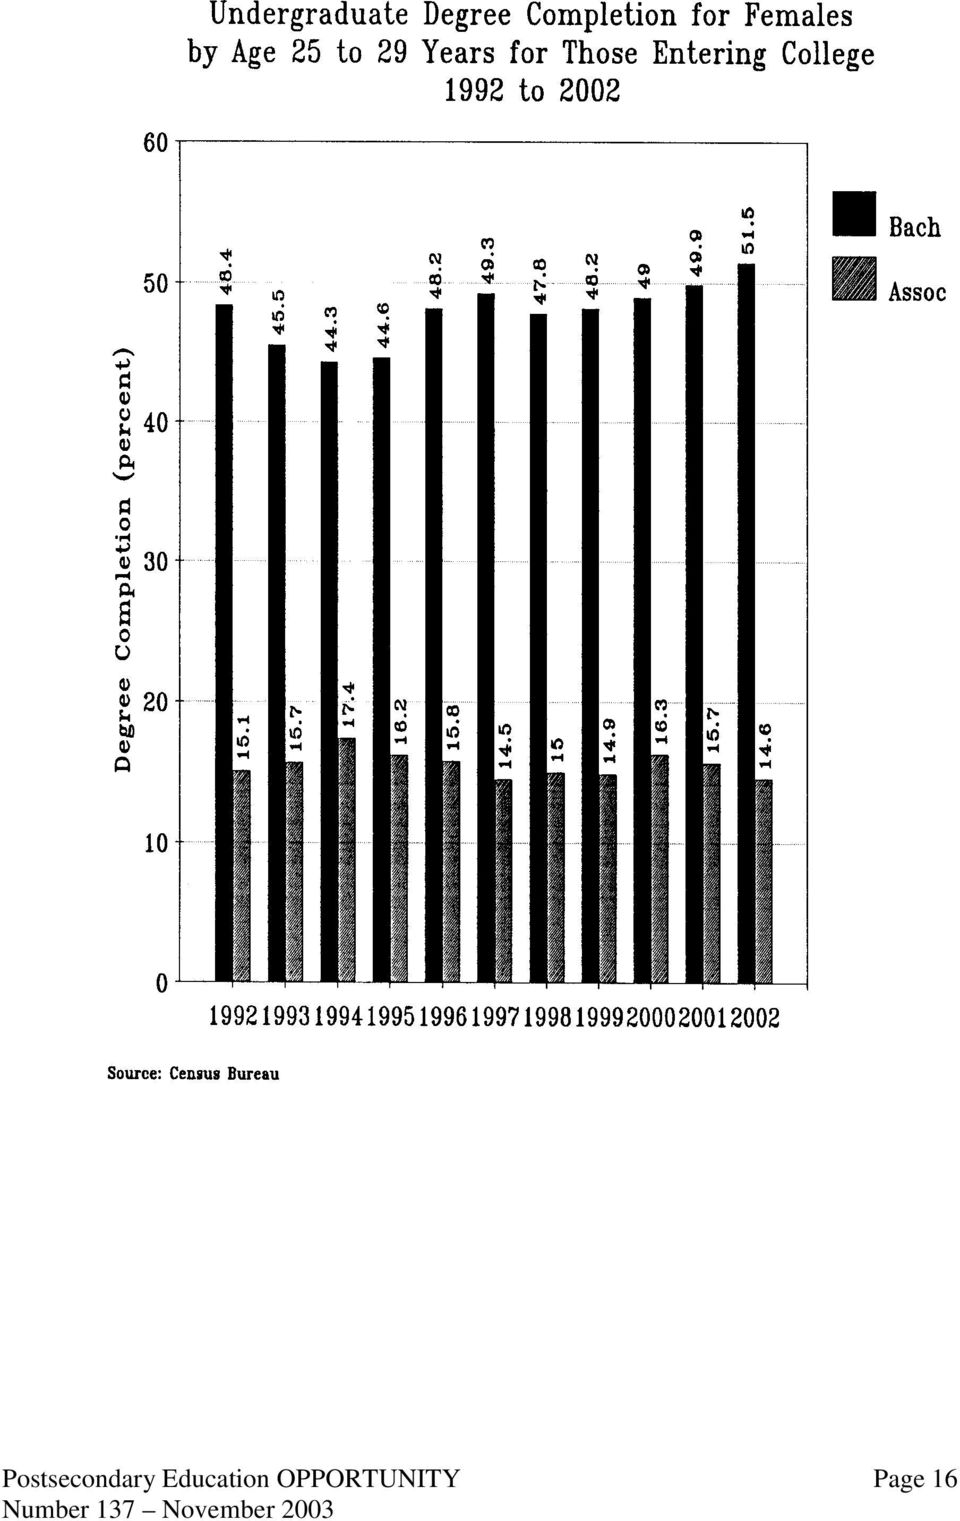
5 Gender. The two charts on page 7 show undergraduate degree completion rates for males and females age 25 to 29 years for the period 1992 through Over this brief period the charts are quite similar, although on more careful inspection familiar differences emerge. First by ages 25 to 29 years larger shares of females than males held both associate and bachelor's degrees from college in This was also true in However: Between 1992 and 2002 the share of males holding associate degrees increased while the share of females holding associate degrees decreased. Between 1992 and 2002 the share of 25 to 29 year old males holding bachelor's degrees increased by 1.2 percent, while the share of females holding this degree increased by 3.1 percentage points. In 1992 men between the ages to 25 and 29 years were 49.8 percent of the civilian, noninstitutional population and held 49.3 percent of the bachelor's degrees. Women were 50.2 percent of this population and held 50.7 percent of the bachelor's degrees. By 2002 men were 50.0 percent of this age cohort but held 45.7 percent of the bachelor's degrees. Women were also 50.0 percent of this cohort, but held 54.3 percent of the bachelor's degrees. Looking back five decades at the span from 1952 to 2002 these numbers are even more dramatic. In 1952 men were 47.3 percent of the civilian noninstitutional population of 25 to 29 year olds, but held 64.7 percent of the bachelor's degrees. Women were 52.7 percent of this cohort but held just 35.3 percent of the bachelor's degrees. These gender trends have been frequently reported in these pages of OPPORTUNITY over the last eight years. They are nothing new. But they are highly significant. They reflect not just the feminization of higher education enrollments but also the same for the college-educated workforce in future years. Race/Ethnicity In addition to the gender disaggregation of these data the Census Bureau has reported data describing the undergraduate degree completion of the four major racial/ ethnic groups of the population for the years 1992 through These groups are: white non-hispanics, black non- Hispanics, Hispanics and Asian/Pacific Islanders. Our analysis here focuses on the 25 to 29 year old age group. The first of these charts for white non-hispanics is the first chart on page 8 of this issue of OPPORTUNITY. By age 25 to 29 years 54.6 percent of those who had started college had completed a bachelor's degree and another 14 percent had completed an associate's degree. More than two out of three non-hispanic whites who had started college had a college degree to show for their efforts by the time they were 25 to 29. Between 1992 and 2002 the share of non-hispanic whites ages 25 to 29 years who had started college and completed bachelor's degrees increased from 51.0 to 54.6 percent. The bachelor's degree completion rate increased substantially between 1994 and 2002, from 47.5 to 54.6 percent. Postsecondary Education OPPORTUNITY Page 5

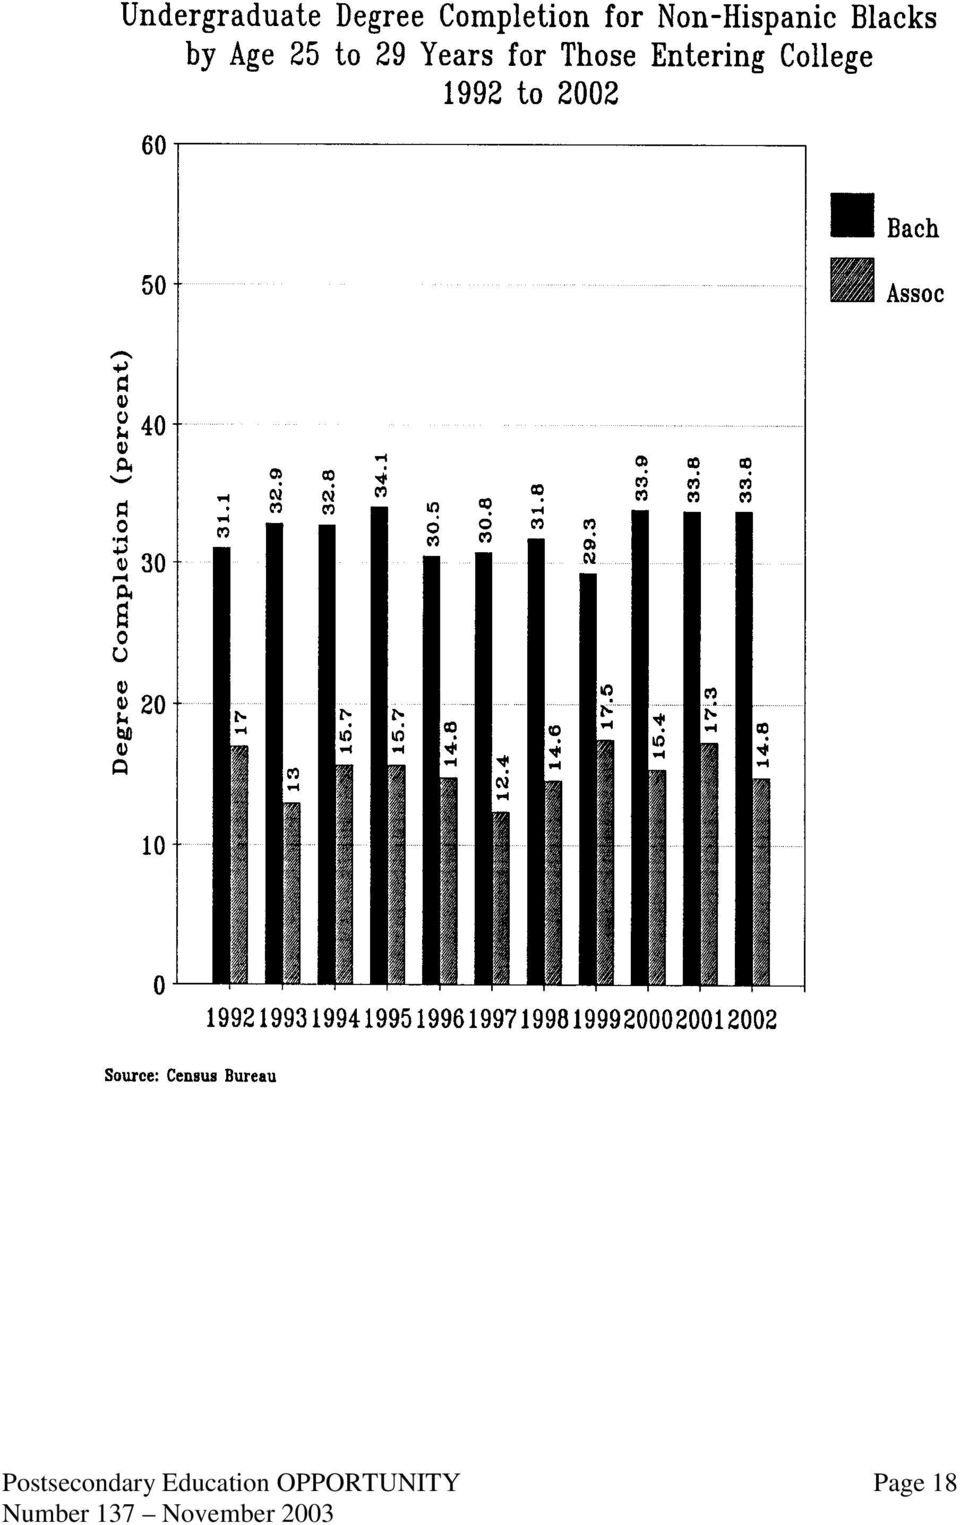
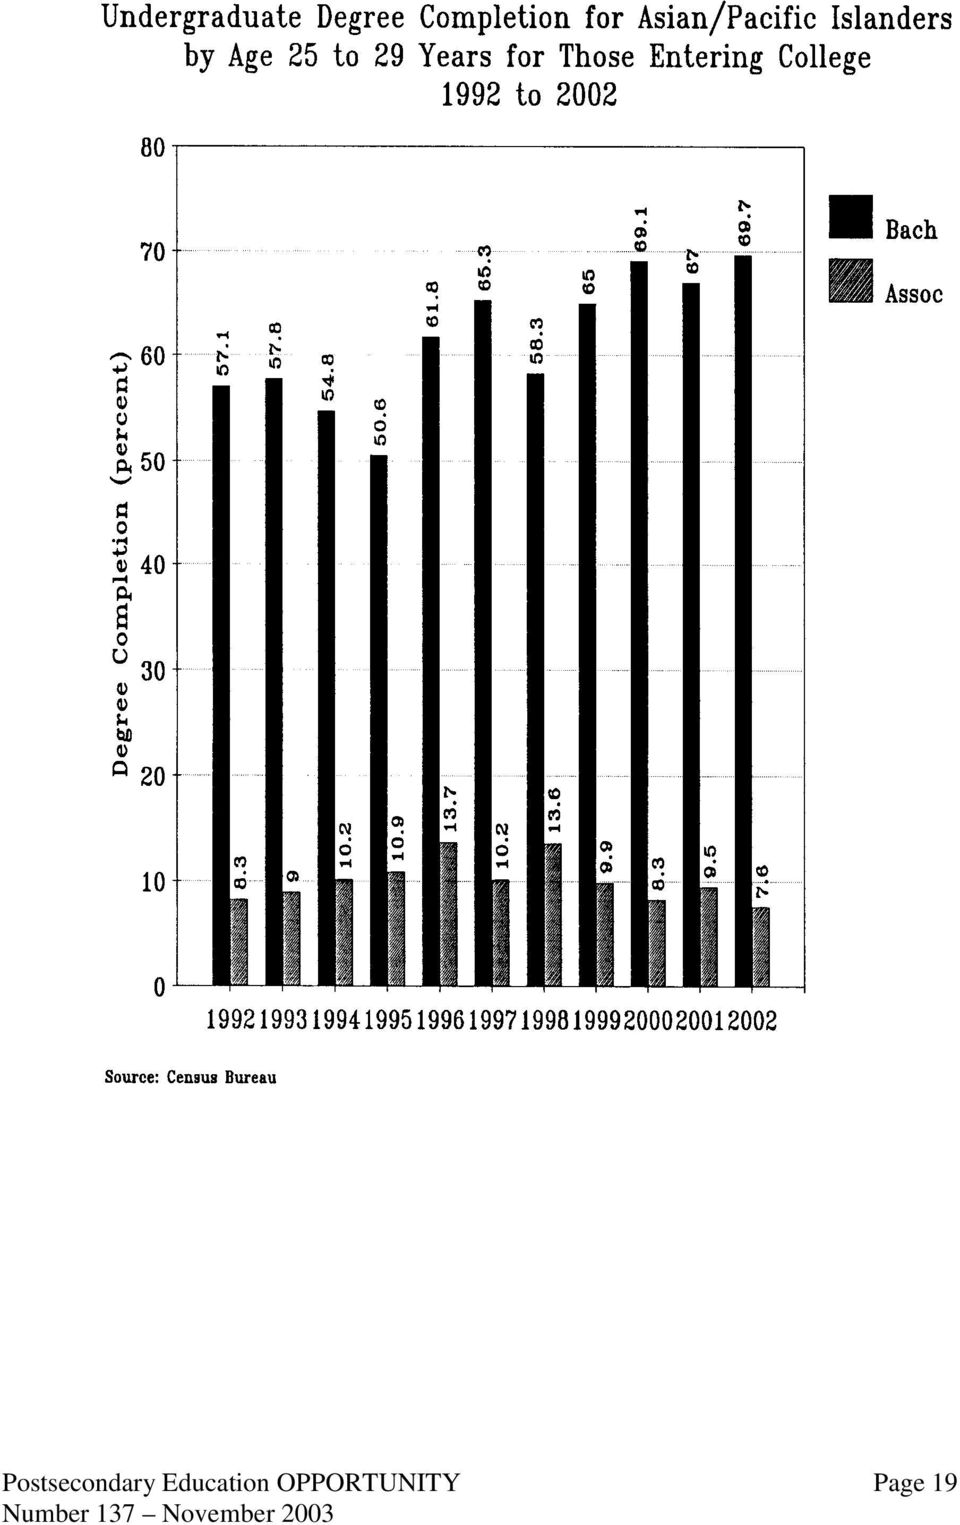
6 Similarly the share of those who had started college that held an associate's degree increased from 13.3 to 14.0 percent, although this trend has been generally downward since White non-hispanics represent 61.5 percent of the civilian noninstitutional population of 25 to 29 year olds in They also represent 69.7 percent of this age group that has at least some college education experience. And they represent 75.2 percent of 25 to 29 year olds with bachelor's degrees or more from higher education. However non-hispanic whites represent a shrinking share of the population of 25 to 29 year olds. In just a decade earlier--non-hispanic whites represented 72.3 percent of the population of 25 to 29 year olds, 77.9 percent of those with any college experience, and 82.2 percent of 25 to 29 year olds with at least a bachelor's degree from higher education. Clearly the market population is less non-hispanic white, as are college enrollments and college graduates. The demographic changes are natural, occurring continuously, and indicate different futures for higher education enrollments and college-educated workforces, voters and parents. The second chart on this page shows undergraduate degree completion rates for non-hispanic blacks ages 25 to 29 years from 1992 through In 2002 the proportion of these blacks with any college that completed at least a bachelor's degree from college was 33.8 percent. Another 14.8 percent had completed associate's degrees in Between 1992 and 2002 the bachelor's degree completion rate for non-hispanic blacks increased from 31.1 to 33.8 percent, an increase of 2.7 percentage points. At the same time the associate's degree completion rate declined, from 17.0 to 14.8 percent, a decline of 2.2 percentage points. Apparently an increasing share of black college students are successfully pursuing bachelor's degrees over associate's degrees from higher education. In 2002 black non-hispanics represented 12.6 percent of the 25 to 29 year old population, 11.6 percent of those with any college experience, and 7.7 percent of those with a bachelor's degree or more from college. In 1992 blacks were 13.2 percent of the population of 25 to 29 years olds, 9.6 percent of those with any college experience, and 6.5 percent of those with a bachelor's degree or more from higher education. Thus over this ten year period blacks ages 25 to 29 represented a shrinking share of the population of 25 to 29 year olds. However blacks represented a growing share of those with any college experience and a growing share of those holding at least bachelor's degrees from higher education. The decade between 1992 and 2002 was a period of relative growth in higher education participation and graduation for blacks. Asian/Pacific Islanders have the highest undergraduate degree completion rates of any racial/ethnic group. In percent of those 25 to 29 years old with any college experience held either a bachelor's or associate's degree from higher education. The bachelor's degree completion rate was 69.7 percent and the associate's degree completion rate was 7.6 percent. Between 1992 and 2002 the bachelor's degree completion rate among 25 to 29 year old Asian/Pacific Islanders increased sharply, from 57.1 to 69.7 percent, or by 12.6 percentage points. Postsecondary Education OPPORTUNITY Page 6

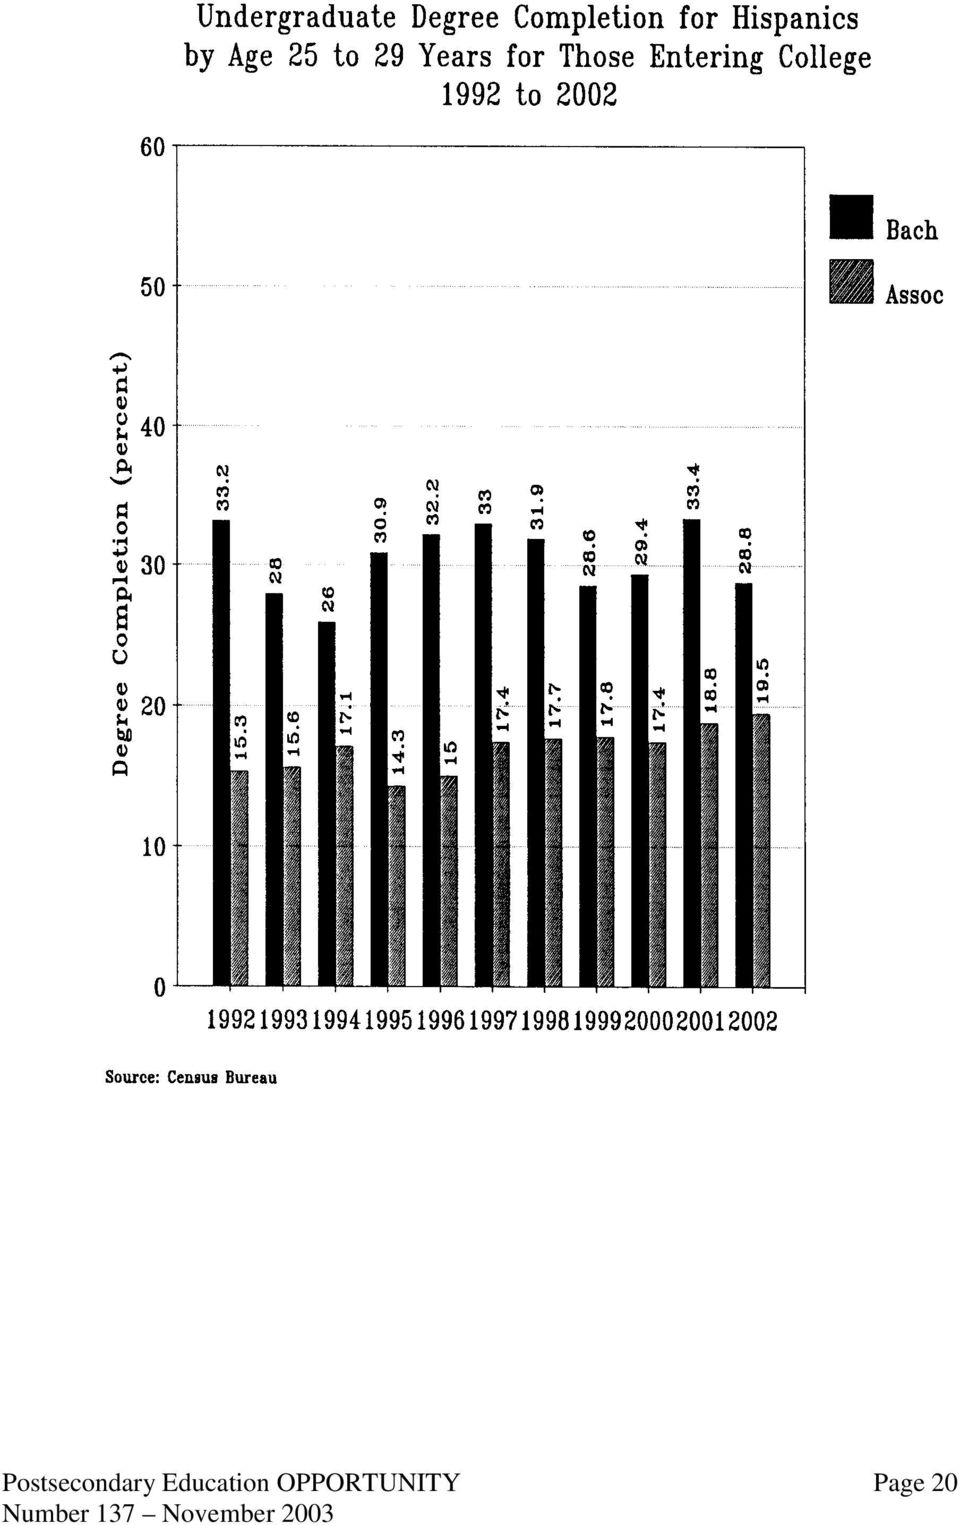
7 During the same time the associate degree completion rate edged downward, from 8.3 to 7.5 percent, or by 0.8 percentage points. In 2002 Asian/Pacific Islanders comprised 5.8 percent of the population of 25 to 29 year olds, 7.9 percent of those with any college enrollment experience, and 10.9 percent of those with bachelor's degrees or more from higher education. Clearly Asian/Pacific Islanders are especially successful in their pursuit of college degrees. In 2002 Hispanics have the lowest bachelor's degree completion rate among 25 to 29 year olds, and the highest associate degree completion rate. The bachelor's degree completion rate was 28.8 percent, and the associate's degree completion rate was 19.5 percent. Between 1992 and 2002 the bachelor's degree completion rate for Hispanics ages 25 to 29 years declined from 33.2 to 28.8 percent, a decline of 4.4 percentage points. Hispanics were the only racial/ethnic group where the bachelor's degree completion rate declined over this ten year period. The associate degree completion rate increased from 15.3 to 19.5 percent, and increase of 4.2 percentage points. This was the largest for any group, and the associate degree completion rates for both blacks and Asian/Pacific Islanders decreased during this period. In 2002 Hispanics were 19.3 percent of the country's population of 25 to 29 year olds, 10.3 percent of those with any college enrollment experience, and had earned 5.8 percent of the bachelor's degrees. Ten years earlier in 1992 Hispanics were 10.6 percent of the 25 to 29 year old population, 6.1 percent of those with any higher education enrollment experience and had earned 4.4 percent of the bachelor's degrees. Clearly Hispanics are growing very rapidly as a share of the 25 to 29 year old population, but also making very slow progress in gaining baccalaureate-level higher education over the last decade. Equity Indices Another way of showing the meaning of these data is through equity indices. These indices are simply the ratio of bachelor's degree completion rates for each population group to the bachelor's degree completion rate for the population for each year of the time series. These indices provide a directly comparable measure of the completion rate for any population group to the population mean. For example for white non-hispanics in 2002 the ratio of the bachelor's degree completion rate of 54.6 percent to the rate for the population of 50.6 percent is The white non-hispanic's bachelor's degree completion rate is percent of the rate for the population. The indices report predictable results: Asian/Pacific Islanders' equity index has risen from in 1991 to by White non-hispanics' equity index increased from to Females' equity index increased from to between 1992 and Males' equity index has declined from 99.6 to Black non-hispanics have relatively low equity indices but rates are rising from 64.4 to Postsecondary Education OPPORTUNITY Page 7

8 Hispanics are clearly having increasing difficulty completing bachelor's degrees from higher education. Their equity index has fallen from 68.7 in 1992 to 56.9 by This decline is partially offset by gains in associate degree completion during this period. These data describe an overall quite stable bachelor's degree completion for those who enter college over the last five decades. The gains in attainment by age 25 to 29 are attributable entirely to gains in high school graduation and college continuation for high school graduates--not to any gain in bachelor's degree completion within higher education. But these overall data obscure important redistribution of bachelor's degree completion within higher education: from men to women, and from Hispanics and blacks to Asians and whites. Postsecondary Education OPPORTUNITY Page 8

9 Postsecondary Education OPPORTUNITY Page 9

10 Postsecondary Education OPPORTUNITY Page 10
11 Postsecondary Education OPPORTUNITY Page 11

12 Postsecondary Education OPPORTUNITY Page 12
13 Postsecondary Education OPPORTUNITY Page 13

14 Postsecondary Education OPPORTUNITY Page 14

15 Postsecondary Education OPPORTUNITY Page 15

16 Postsecondary Education OPPORTUNITY Page 16
17 Postsecondary Education OPPORTUNITY Page 17

18 Postsecondary Education OPPORTUNITY Page 18
19 Postsecondary Education OPPORTUNITY Page 19
20 Postsecondary Education OPPORTUNITY Page 20
21 Postsecondary Education OPPORTUNITY Page 21
College Enrollment by Age 1950 to 2000
 College Enrollment by Age 1950 to 2000 Colleges compete with the labor market and other adult endeavors for the time and attention of young people in a hurry to grow up. Gradually, young adults drift away
Parental Educational Attainment and Higher Educational Opportunity
 Parental Educational Attainment and Higher Educational Opportunity Federal higher education policy recognizes certain student characteristics as limiting higher educational opportunity, and has created
Educational Attainment of Veterans: 2000 to 2009
 Educational Attainment of Veterans: to 9 January 11 NCVAS National Center for Veterans Analysis and Statistics Data Source and Methods Data for this analysis come from years of the Current Population Survey
College Enrollment Hits All-Time High, Fueled by Community College Surge
 Enrollment Hits All-Time High, Fueled by Community Surge FOR RELEASE: OCTOBER 29, 2009 Paul Taylor, Project Director Richard Fry, Senior Researcher Wendy Wang, Research Associate Daniel Dockterman, Research
Women s Participation in Education and the Workforce. Council of Economic Advisers
 Women s Participation in Education and the Workforce Council of Economic Advisers Updated October 14, 214 Executive Summary Over the past forty years, women have made substantial gains in the workforce
Marriage and divorce: patterns by gender, race, and educational attainment
 ARTICLE OCTOBER 2013 Marriage and divorce: patterns by gender, race, and educational attainment Using data from the National Longitudinal Survey of Youth 1979 (NLSY79), this article examines s and divorces
Doctors 24,728 20,176 44,904 55.1% 44.9% First-Prof 42,862 36,845 79,707 53.8% 46.2%
 Earned Degrees Conferred by Gender 1870 to 2001 The growing gender imbalance in higher education is most apparent at college graduation. Throughout the education pipeline girls and young women are consistently
COLLEGE ENROLLMENT AND WORK ACTIVITY OF 2014 HIGH SCHOOL GRADUATES
 For release 10:00 a.m. (EDT) Thursday, April 16, 2015 USDL-15-0608 Technical information: (202) 691-6378 cpsinfo@bls.gov www.bls.gov/cps Media contact: (202) 691-5902 PressOffice@bls.gov COLLEGE ENROLLMENT
Young Black America Part Four: The Wrong Way to Close the Gender Wage Gap
 Issue Brief August 2015 Young Black America Part Four: The Wrong Way to Close the Gender Wage Gap By Cherrie Bucknor* Young blacks in America have had significant improvements in educational attainment
The goal is to transform data into information, and information into insight. Carly Fiorina
 DEMOGRAPHICS & DATA The goal is to transform data into information, and information into insight. Carly Fiorina 11 MILWAUKEE CITYWIDE POLICY PLAN This chapter presents data and trends in the city s population
LICENSED SOCIAL WORKERS IN THE UNITED STATES, 2004. Chapter 2 of 4. Demographics
 LICENSED SOCIAL WORKERS IN THE UNITED STATES, 2004 Chapter 2 of 4 Demographics Prepared by Center for Health Workforce Studies School of Public Health, University at Albany Rensselaer, NY and NASW Center
Home Computers and Internet Use in the United States: August 2000
 Home Computers and Internet Use in the United States: August 2000 Special Studies Issued September 2001 P23-207 Defining computer and Internet access All individuals living in a household in which the
New York State Profile
 As America Becomes More Diverse: The Impact of State Higher Education Inequality State Profile Questions You Should Ask How educated is s adult population and workforce? How does compare to the national
Educational Attainment in the United States: 2003
 Educational Attainment in the United States: 2003 Population Characteristics Issued June 2004 P20-550 The population in the United States is becoming more educated, but significant differences in educational
Minorities in Higher Education. 2010 2011 Supplement. Young M. Kim
 Minorities in Higher Education 2010 Twenty-FOURTH Status Report 2011 Supplement Young M. Kim Minorities in Higher Education 2010 Twenty-FOURTH Status Report 2011 Supplement Young M. Kim PROJECT COORDINATOR:
CENTER FOR LABOR MARKET STUDIES
 The Complete Breakdown in the High Schoolto Work Transition of Young, Non College Enrolled High School Graduates in the U.S.; The Need for an Immediate National Policy Response Prepared by: Andrew Sum
The recession of 2007 2009, a
 Employment outlook: Labor force projections to : a more slowly growing workforce The projected labor force growth over the next 10 years will be affected by the aging of the baby-boom generation; as a
UWEP Utah Women and Education Project
 Research and Policy Brief UWEP Utah Women and Education Project May 25, 2010 UWEP 2010-204 Women and Higher Education in Utah: A Glimpse at the Past and Present According to Lumina Foundation researchers,
Projections of the Size and Composition of the U.S. Population: 2014 to 2060 Population Estimates and Projections
 Projections of the Size and Composition of the U.S. Population: to Population Estimates and Projections Current Population Reports By Sandra L. Colby and Jennifer M. Ortman Issued March 15 P25-1143 INTRODUCTION
The Changing Gender Balance: An Overview
 Fewer Men on Campus A Puzzle for Liberal Arts Colleges and Universities November 15-16, 1999 Goucher College Baltimore, Maryland Thomas G. Mortenson Senior Scholar Center for the Study of Opportunity in
An Equity Profile of the Kansas City Region. Summary. Overview. The Equity Indicators Framework. central to the region s economic success now and
 An Equity Profile of the Kansas City Region PolicyLink and PERE An Equity Profile of the Kansas City Region Summary Overview Across the country, regional planning organizations, community organizations
A New Measure of Educational Success in Texas. Tracking the Success of 8th Graders into and through College
 A New Measure of Educational Success in Texas Tracking the Success of 8th Graders into and through College National Center for Management Systems (NCHEMS) Contents Introduction 1 The Challenge 2 Purpose
Rhode Island State Profile
 As America Becomes More Diverse: The Impact of State Higher Education Inequality State Profile Questions You Should Ask How educated is s adult population and workforce? How does compare to the national
New Mexico State Profile
 As America Becomes More Diverse: The Impact of State Higher Education Inequality State Profile Questions You Should Ask How educated is s adult population and workforce? How does compare to the national
The Big Payoff: Educational Attainment and Synthetic Estimates of Work-Life Earnings
 The Big Payoff: Educational Attainment and Synthetic Estimates of Work-Life Earnings Special Studies Issued July 2002 P23-210 Does going to school pay off? Most people think so. Currently, almost 90 percent
Number, Timing, and Duration of Marriages and Divorces: 2009
 Number, Timing, and Duration of Marriages and Divorces: 2009 Household Economic Studies Issued May 2011 P70-125 INTRODUCTION Marriage and divorce are central to the study of living arrangements and family
During the past century,
 Academic preparation is still a core function of community colleges. But today their mission is more comprehensive, thanks to a gradual shift toward vocational education, job training, and programs catering
Women See Value and Benefits of College; Men Lag on Both Fronts, Survey Finds
 Social & Demographic Trends Wednesday, August 17, 2011 Women See Value and Benefits of College; Men Lag on Both Fronts, Survey Finds Paul Taylor, Director Kim Parker, Associate Director Richard Fry, Senior
NINE DECLINING FACULTY WAGE PREMIUMS: ANALYSIS OVER TIME BY GENDER IN THE PUBLIC AND PRIVATE SECTORS. Frederick G. Floss i
 187 Wagadu Volume 9 Fall 2011 NINE DECLINING FACULTY WAGE PREMIUMS: ANALYSIS OVER TIME BY GENDER IN THE PUBLIC AND PRIVATE SECTORS Frederick G. Floss i Abstract: The wage premium is the relative wage of
Employment in the United States is recovering slowly from the
 Employment Patterns During the Recovery: Who Are Getting the Jobs and Why? By Ayşegül Şahin and Jonathan L. Willis Employment in the United States is recovering slowly from the Great Recession. After declining
Women, Minorities, and Persons with Disabilities in Science and Engineering: 2013
 Women, Minorities, and Persons with Disabilities in Science and Engineering: 213 National Center for Science and Engineering Statistics Directorate for Social, Behavioral and Economic Sciences National
Fall headcount enrollments in graduate level engineering programs within the State University System of Florida increased from 2,771 to 5,638 between
 1 2 In the fall of 1996 enrollment in graduate level engineering programs at all universities in Florida, including private and for profit universities, was 4,007. In the fall of 2012, enrollment increased
Trends In Long-term Unemployment
 MARCH 2015 Trends In Long-term Unemployment Karen Kosanovich and Eleni Theodossiou Sherman Long-term unemployment reached historically high levels following the Great Recession of 2007 2009. Both the number
Massachusetts State Profile
 As America Becomes More Diverse: The Impact of State Higher Education Inequality State Profile Questions You Should Ask How educated is adult population and workforce? How does compare to the national
The U.S. labor force the number of
 Employment outlook: 14 Labor force projections to 2014: retiring boomers The baby boomers exit from the prime-aged workforce and their movement into older age groups will lower the overall labor force
AMERICA S YOUNG ADULTS AT 23: SCHOOL ENROLLMENT, TRAINING, AND EMPLOYMENT TRANSITIONS BETWEEN AGES 22 AND 23
 For release 10:00 a.m. (EST) Wednesday, February 9, 2011 USDL-11-0155 Technical information: (202) 691-7410 nls_info@bls.gov www.bls.gov/nls Media contact: (202) 691-5902 PressOffice@bls.gov AMERICA S
LICENSED SOCIAL WORKERS IN THE UNITED STATES, 2004 SUPPLEMENT. Chapter 2 of 5. Who Are Licensed Social Workers?
 LICENSED SOCIAL WORKERS IN THE UNITED STATES, 2004 SUPPLEMENT Chapter 2 of 5 Who Are Licensed Social Workers? Prepared by Center for Health Workforce Studies School of Public Health, University at Albany
How 2015 graduates are faring
 How 2015 graduates are faring What they re telling us that schools can use By Jo Ann Deasy The 2014 2015 GSQ Total School Profile provides a wealth of survey data about graduating students: educational
(1992-2012) Russell N. James III, J.D., Ph.D. Professor, Texas Tech University
 Russell N. James III, J.D., Ph.D. Professor, Texas Tech University") American Charitable Bequest Demographics (1992-2012) Russell N. James III, J.D., Ph.D. Professor, Texas Tech University Director of Graduate Studies in Charitable Financial Planning CH Foundation Chair
American Charitable Bequest Demographics (1992-2012) Russell N. James III, J.D., Ph.D. Professor, Texas Tech University Director of Graduate Studies in Charitable Financial Planning CH Foundation Chair
CLACLS. Marriage Patterns among Latinos in New York City, 1990-2010. Amanda Mía Marín-Chollom. Justine Calcagno
 CLACLS Center for Latin American, Caribbean & Latino Studies Marriage Patterns among Latinos in New York City, 1990-2010 Center for Latin American, Caribbean & Latino Studies Graduate Center City University
Demographic Analysis of the Salt River Pima-Maricopa Indian Community Using 2010 Census and 2010 American Community Survey Estimates
 Demographic Analysis of the Salt River Pima-Maricopa Indian Community Using 2010 Census and 2010 American Community Survey Estimates Completed for: Grants & Contract Office The Salt River Pima-Maricopa
The Employment and Mal Employment Situation for Recent College Graduates: An Update
 The Employment and Mal Employment Situation for Recent College Graduates: An Update Neeta P. Fogg and Paul E. Harrington Center for Labor Markets and Policy Drexel University, Philadelphia, Pennsylvania
AMERICA'S YOUNG ADULTS AT 27: LABOR MARKET ACTIVITY, EDUCATION, AND HOUSEHOLD COMPOSITION: RESULTS FROM A LONGITUDINAL SURVEY
 For release 10:00 a.m. (EDT) Wednesday, March 26, 2014 USDL-14-0491 Technical information: (202) 691-7410 nls_info@bls.gov www.bls.gov/nls Media contact: (202) 691-5902 PressOffice@bls.gov AMERICA'S YOUNG
Prepared by: Andrew Sum Ishwar Khatiwada With Walter McHugh. Center for Labor Market Studies Northeastern University
 The College Educated Population and Labor Force of Massachusetts and the U.S., Their Employment Behavior and Labor Market Problems, The Numbers and Occupational Characteristics of College Labor Market
Colorado State Profile
 As America Becomes More Diverse: The Impact of State Higher Education Inequality State Profile Questions You Should Ask How educated is s adult population and workforce? How does compare to the national
Educational Attainment in the United States: 2015
 Educational Attainment in the United States: 215 Population Characteristics Current Population Reports By Camille L. Ryan and Kurt Bauman March 216 P2-578 This report provides a portrait of educational
Suggested Citation: Institute for Research on Higher Education. (2016). College Affordability Diagnosis: Florida. Philadelphia, PA: Institute for
. College Affordability Diagnosis: Florida. Philadelphia, PA: Institute for") FLORIDA Suggested Citation: Institute for Research on Higher Education. (2016). College Affordability Diagnosis: Florida. Philadelphia, PA: Institute for Research on Higher Education, Graduate School of
FLORIDA Suggested Citation: Institute for Research on Higher Education. (2016). College Affordability Diagnosis: Florida. Philadelphia, PA: Institute for Research on Higher Education, Graduate School of
What It s Worth: Field of Training and Economic Status in 2009
 What It s Worth: Field of Training and Economic Status in 2009 Household Economic Studies Issued February 2012 P70-129 INTRODUCTION The relationship between educational attainment and economic outcomes
Portraits A PORTRAIT OF LOW-INCOME YOUNG ADULTS IN EDUCATION JUNE 2010
 Portraits WHAT IS THE PORTRAITS SERIES? With the support from the Bill & Melinda Gates Foundation, the INSTITUTE FOR HIGHER EDUCATION POLICY plans to regularly release short research briefs that describe
A Half-Century of California Poverty
 A Half-Century of California Poverty Robert G. Mogull California State University at Sacramento In this article, poverty statistics are examined over the past 50 years for insights on trends. Data were
Community Colleges: Preparing America s Workforce in the 21 st Century
 Community Colleges: Preparing America s Workforce in the 21 st Century Presented by: Dr. Jesus Jess Carreon Chancellor, Dallas County Community College District What s Changing? Demographics Nature of
Steve and Clint Marchant Data Based Insights, Inc. on behalf of the ACS Department of Research & Market Insights. March 5, 2015
 Starting Salaries of Chemists And Chemical Engineers: 2014 Analysis of the American Chemical Society's Survey Of New Graduates in Chemistry and Chemical Engineering Steve and Clint Marchant Data Based
Figure 5-1 Master's degrees awarded in S&E and non-s&e fields, by sex: 1990 98
 Chapter 5 Graduate Degrees Trends for women and minorities in attainment of master s and doctoral degrees are similar to those for their bachelor s degree attainment and their graduate enrollment: both
2003 National Survey of College Graduates Nonresponse Bias Analysis 1
 2003 National Survey of College Graduates Nonresponse Bias Analysis 1 Michael White U.S. Census Bureau, Washington, DC 20233 Abstract The National Survey of College Graduates (NSCG) is a longitudinal survey
Suggested Citation: Institute for Research on Higher Education. (2016). College Affordability Diagnosis: Massachusetts. Philadelphia, PA: Institute
. College Affordability Diagnosis: Massachusetts. Philadelphia, PA: Institute") MASSACHUSETTS Suggested Citation: Institute for Research on Higher Education. (2016). College Affordability Diagnosis: Massachusetts. Philadelphia, PA: Institute for Research on Higher Education, Graduate
MASSACHUSETTS Suggested Citation: Institute for Research on Higher Education. (2016). College Affordability Diagnosis: Massachusetts. Philadelphia, PA: Institute for Research on Higher Education, Graduate
Suggested Citation: Institute for Research on Higher Education. (2016). College Affordability Diagnosis: Texas. Philadelphia, PA: Institute for
. College Affordability Diagnosis: Texas. Philadelphia, PA: Institute for") TEXAS Suggested Citation: Institute for Research on Higher Education. (2016). College Affordability Diagnosis: Texas. Philadelphia, PA: Institute for Research on Higher Education, Graduate School of Education,
TEXAS Suggested Citation: Institute for Research on Higher Education. (2016). College Affordability Diagnosis: Texas. Philadelphia, PA: Institute for Research on Higher Education, Graduate School of Education,
1960-61. United States
 61-61 United States By, the U.S. population had surpassed 179 million, a gain of 19.0 percent from. The median age had decreased to 29.5 (28.7 for men and.3 for women), the first decline since 1900. The
Social work education in England 2009-2014
 Social work education in England 2009-2014 A report for the Department of Health (DH) March 2015 Produced by Skills for Care for the Department of Health Contents Introduction 3 1. Enrolments 4 Interim
Florida s Great Cost Shift: How Higher Education Cuts Undermine Its Future Middle Class
 Florida s Great Cost Shift: How Higher Education Cuts Undermine Its Future Middle Class J ust as a postsecondary education has become essential for getting a decent job and entering the middle class, it
Real Mean and Median Income, Families and Individuals, 1947-2012, and Households, 1967-2012 (Reported in $2012).
.") Income Real Mean and Median Income, Families and Individuals, 1947-2012, and Households, 1967-2012 (Reported in $2012). $80,000 $60,000 Median Family Income Mean Family Income Median Household Income Mean
Income Real Mean and Median Income, Families and Individuals, 1947-2012, and Households, 1967-2012 (Reported in $2012). $80,000 $60,000 Median Family Income Mean Family Income Median Household Income Mean
Going Nowhere Workers Wages since the Mid-1970s
 Going Nowhere Workers Wages since the Mid-1970s I n the late 1990s, many observers hoped that we had finally broken free of the slow income growth that had bogged down the American middle class for more
Suggested Citation: Institute for Research on Higher Education. (2016). College Affordability Diagnosis: South Carolina. Philadelphia, PA: Institute
. College Affordability Diagnosis: South Carolina. Philadelphia, PA: Institute") SOUTH CAROLINA Suggested Citation: Institute for Research on Higher Education. (2016). College Affordability Diagnosis: South Carolina. Philadelphia, PA: Institute for Research on Higher Education, Graduate
SOUTH CAROLINA Suggested Citation: Institute for Research on Higher Education. (2016). College Affordability Diagnosis: South Carolina. Philadelphia, PA: Institute for Research on Higher Education, Graduate
A Study of Career Patterns of the Presidents of Independent Colleges and Universities
 A Study of Career Patterns of the Presidents of Independent Colleges and Universities Harold V. Hartley III Eric E. Godin A Study of Career Patterns of the Presidents of Independent Colleges and Universities
Trends in Higher Education Series. Education Pays. The Benefits of Higher Education for Individuals and Society. Sandy Baum and Jennifer Ma
 Trends in Higher Education Series Education Pays The Benefits of Higher Education for Individuals and Society 2007 Sandy Baum and Jennifer Ma Executive Summary Students who attend institutions of higher
Nursing Supply and Demand Study Acute Care
 2014 Nursing Supply and Demand Study Acute Care Greater Cincinnati Health Council 2100 Sherman Avenue, Suite 100 Cincinnati, OH 45212-2775 Phone: (513) 531-0200 Table of Contents I. Introduction and Executive
Carl Perkins IV State Report
 CARL PERKINS IV STATE For REPORT: inquiries, POST-SECONDARY please SCHOOLS contact AND STUDENTS PRES Associates at: 1 info@presassociates.com (307) 733-3255 Wyoming State Department of Education Carl Perkins
Some College, No Degree
 Some College, No Degree A look at those who left college early December 2015 Lexi Shankster Contents Introduction... 3 Summary of Findings:... 3 How much College without a?... 4 Race and Ethnicity... 4
Changes in Health Insurance Coverage in the Great Recession, 2007-2010 John Holahan and Vicki Chen The Urban Institute Executive Summary
 I S S U E P A P E R kaiser commission on medicaid and the uninsured Changes in Health Insurance Coverage in the Great Recession, 2007-2010 John Holahan and Vicki Chen The Urban Institute Executive Summary
EXECUTIVE SUMMARY. Findings from the Annual Survey of Schools of Nursing Academic Year 2009-2010
 EXECUTIVE SUMMARY Findings from the Annual Survey of Schools of Nursing Academic Year 2009-2010 NLN Data Show Both Progress and Challenges in Meeting IOM Objectives This executive summary describes findings
OVERVIEW OF CURRENT SCHOOL ADMINISTRATORS
 Chapter Three OVERVIEW OF CURRENT SCHOOL ADMINISTRATORS The first step in understanding the careers of school administrators is to describe the numbers and characteristics of those currently filling these
HEALTH INSURANCE COVERAGE STATUS. 2009-2013 American Community Survey 5-Year Estimates
 S2701 HEALTH INSURANCE COVERAGE STATUS 2009-2013 American Community Survey 5-Year Estimates Supporting documentation on code lists, subject definitions, data accuracy, and statistical testing can be found
SECTION 1. Participation in Education
 The indicators in this section of The Condition of Education report trends in enrollments across all levels of education. Enrollment is a key indicator of the scope of and access to educational opportunities
Figure 1.1 Percentage of persons without health insurance coverage: all ages, United States, 1997-2001
 Figure 1.1 Percentage of persons without health insurance coverage: all ages, United States, 1997-2001 DATA SOURCE: Family Core component of the 1997-2001 National Health Interview Surveys. The estimate
Chapter 2. Education and Human Resource Development for Science and Technology
 Chapter 2 Education and Human Resource Development for Science and Technology 2.1 Evironment for Basic Human Resource Development... 53 2.1.1 Science education in primary and secondary schools... 53 2.1.2
Self-employment continues to be
 U.S. Self-Employment Self-employment in the United States About 1 in 9 workers was self-employed in 2009; as in the past, self-employment continues to be more common among men, Whites, Asians, and older
Over the past three decades, the share of middle-skill jobs in the
 The Vanishing Middle: Job Polarization and Workers Response to the Decline in Middle-Skill Jobs By Didem Tüzemen and Jonathan Willis Over the past three decades, the share of middle-skill jobs in the United
Time for a Shared Recovery
 Time for a Shared Recovery Using the Census Data to Show the Harmful and Needless Needless Persistence of Poverty August 19, 2008 1 PART III 21 Deborah Weinstein Executive Director, Coalition on Human
Carl Perkins IV State Report
 CARL PERKINS IV STATE For REPORT: inquiries, POST-SECONDARY please SCHOOLS contact AND STUDENTS PRES Associates at: 1 info@presassociates.com (307) 733-3255 Wyoming State Department of Education Carl Perkins
REPORT. 2014-15 Undergraduate Degree Earners. First-time Graduates and Graduates with Prior Awards
 2014-15 Undergraduate First-time Graduates and Graduates with Prior Awards The total number of undergraduate degree earners has remained nearly constant over the last four years, with 2,804,133 students
Health Status, Health Insurance, and Medical Services Utilization: 2010 Household Economic Studies
 Health Status, Health Insurance, and Medical Services Utilization: 2010 Household Economic Studies Current Population Reports By Brett O Hara and Kyle Caswell Issued July 2013 P70-133RV INTRODUCTION The
National Sample Survey of Registered Nurses March 2004. Preliminary Findings
 The Registered Nurse Population: National Sample Survey of Registered Nurses March 2004 Preliminary Findings Preliminary Findings 2004 National Sample Survey of Registered Nurses The (NSSRN) is the Nation
Indicator 3: Fatal Work-Related Injuries
 Indicator 3: Fatal Work-Related Injuries Significance i Fatal work-related injuries are defined as injuries that occur at work and result in death. Each year, over 4,600 cases of work-related fatalities
BizBuySell.com Small Business Buyer & Seller Demographic Study
 BizBuySell.com Small Business Buyer & Seller Demographic Study Table of Contents Report Executive Summary Younger, More Diverse Buyers Look to Acquire Retiring Baby Boomer Businesses Female Business Buyers
Text table 4-1 Enrollment, degree attainment, and employment status of academic year 1996/97 and 1997/98 S&E bachelor s degree recipients: April 1999
 Chapter 4 Graduate Enrollment Overview Graduate enrollment in science and engineering 1 rose in after 5 consecutive years of decline. (See appendix table 4-1.) The growth was entirely attributable to increases
The Changing Population of Texas. BP Business Leaders November 8, 2012 Austin, TX
 The Changing Population of Texas BP Business Leaders November 8, 2012 Austin, TX Growing States, 2000-2010 2000 Population* 2010 Population* Numerical Change 2000-2010 Percent Change 2000-2010 United States
Graduation Rates 2009-10
 Page 1 of 19 Graduation Rates 29-1 User ID: 29C11 Screening questions Does your institution use a website to disclose Student-Right-to-Know student athlete graduation rates? nmlkji nmlkj No. Yes. Please
Employment-Based Health Insurance: 2010
 Employment-Based Health Insurance: 2010 Household Economic Studies Hubert Janicki Issued February 2013 P70-134 INTRODUCTION More than half of the U.S. population (55.1 percent) had employment-based health
SalarieS of chemists fall
 ACS news SalarieS of chemists fall Unemployment reaches new heights in 2009 as recession hits profession hard The economic recession has taken its toll on chemists. Despite holding up fairly well in previous
Succeeding Calumet Conference Center, Purdue University Calumet, Hammond, IN June 17, 2010
 Post-Secondary Student Pathways in Northwest Indiana: Patterns of Enrollment Research findings from the Mobile Working Students Collaborative Desiree Zerquera & Jin Chen Project on Academic Success WORKING
The Recession of 2007 2009
 The Recession of 2007 2009 February 2012 A general slowdown in economic activity, a downturn in the business cycle, a reduction in the amount of goods and services produced and sold these are all characteristics
Application Trends Survey
 The premier provider of market intelligence Application Trends Survey SURVEY REPORT About This Study The Application Trends Survey is a product of the Graduate Management Admission Council (GMAC ), a global
DIVERSITY OF PROFESSIONAL SCHOOL APPLICANTS OVER A TEN YEAR PERIOD IN THE UNITED STATES (2003-2013)
") DIVERSITY OF PROFESSIONAL SCHOOL APPLICANTS OVER A TEN YEAR PERIOD IN THE UNITED STATES (2003-2013) Ellen Lee, D.D.S. 1, Brian Chin 2, Kevin Lin 3, David Hershkowitz, D.D.S. 4, Arthur D. Goren, D.M.D.
DIVERSITY OF PROFESSIONAL SCHOOL APPLICANTS OVER A TEN YEAR PERIOD IN THE UNITED STATES (2003-2013) Ellen Lee, D.D.S. 1, Brian Chin 2, Kevin Lin 3, David Hershkowitz, D.D.S. 4, Arthur D. Goren, D.M.D.
The Decline in Student Applications to Computer Science and IT Degree Courses in UK Universities. Anna Round University of Newcastle
 The Decline in Student Applications to Computer Science and IT Degree Courses in UK Universities Introduction Anna Round University of Newcastle The research described in this report was undertaken for
Sharp Declines in Underemployment for College Graduates
 Sharp Declines in Underemployment for College Graduates Anthony P. Carnevale Nicole Smith Center on Education and the Workforce McCourt School of Public Policy Introduction Not only did the Great Recession
BACKGROUND INFORMATION ON COMMUNITY COLLEGES
 NATIONAL CENTER ON EDUCATION AND THE ECONOMY C BACKGROUND INFORMATION ON COMMUNITY COLLEGES May 2013 Two and a half years ago, the National Center on Education and the Economy (NCEE) began a project to
Research Brief February 2015
 College Board Research Research Brief February 2015 Supply and Demand in the Higher Education Market: College Enrollment Amal Kumar The College Board Michael Hurwitz The College Board Summary Between 2002
Key Indicators on the Path to a Bachelor s Degree by Race and Ethnicity in Maryland
 Key Indicators on the Path to a Bachelor s Degree by Race and Ethnicity in Maryland Joseph Popovich April 2016 Maryland, like many other states, has set ambitious goals for increasing the number of college
Access to meaningful, rewarding and safe employment is available to all.
 Home Previous Reports Links Downloads Contacts The Social Report 2002 te purongo oranga tangata 2002 Introduction Health Knowledge and Skills Safety and Security Paid Work Human Rights Culture and Identity
THE EDUCATIONAL PROGRESS OF BLACK STUDENTS
 NATIONAL CENTER FOR EDUCATION STATISTICS Findings from THE CONDITION OF EDUCATION 1994 NO. 2 THE EDUCATIONAL PROGRESS OF BLACK STUDENTS U.S. Department of Education Office of Educational Research and Improvement
The Condition of College & Career Readiness l 2011
 The Condition of College & Career Readiness l 2011 ACT is an independent, not-for-profit organization that provides assessment, research, information, and program management services in the broad areas