College Enrollment by Age 1950 to 2000
|
|
|
- Shanna Barker
- 8 years ago
- Views:
Transcription
1 College Enrollment by Age 1950 to 2000 Colleges compete with the labor market and other adult endeavors for the time and attention of young people in a hurry to grow up. Gradually, young adults drift away from higher education and into their other adult roles. Higher education's opportunity to enroll and educate young adults is brief. For individuals, college enrollment has opportunity costs of foregone income and lifestyle choices. However, as the data described here illustrate, a growing share of adults remain enrolled in school. They extend their formal education both because they want to (demand for higher education), and because they can (supply of higher education opportunity). Here we explore school (mostly college) enrollment of the population beginning at age 18 through whatever age people still seek the benefits of higher education. Note that compulsory state school enrollment laws require school enrollment through about age 16. After 16 school enrollment becomes voluntary. At age 18 when young people become adults, many adult roles are available and higher education is in hot competition for the commitment of adults. Controlling for age, different demographic groups of the population show distinctive enrollment trends and patterns. Notably: Women are more likely to be enrolled than are men. Asian/Pacific Islanders and non-hispanic whites are more likely to be enrolled than are blacks and Hispanics at younger adult ages, but blacks become those most likely to be enrolled after age 30. Adults over 25 are more likely to be enrolled in college as undergraduates in the western Rocky Mountain states, and less likely to be enrolled as undergraduates in the mid-atlantic states, than are people at this age in the rest of the United States. Public institutions provide about 80 percent of undergraduate enrollment at all age levels. Four-year colleges enroll about three quarters of undergraduates in higher education through age 24, two thirds of those between 25 and 34 years, and about half of undergraduates age 35 and over. These and many other findings result from our analysis of Census Bureau and National Center for Education Statistics data on enrollments by age. The Data The primary source of data used in this analysis is the Census Bureau's Current Population Survey. The CPS is a monthly survey of a national sample of about 50,000 U.S. households used to gather data on employment and unemployment. The survey is limited to the civilian, noninstitutional population, and thus excludes persons in military service, correctional facilities and other institutional facilities. In the October CPS the education supplement is used to gather data on school enrollment of the population. In the March CPS another supplement gathers information on the educational attainment of the population. Data examined here rely mainly on the October CPS for school enrollment by age. Our main focus in this analysis is on undergraduate enrollments by age. These data were originally gathered for a presentation to the Council for Adult and Experiential Learning (CAEL) at their fall 2001 conference recently held in Orlando. However, available data from Census invite a broader look at adult enrollment and education. Thus some of the data examined here includes broader measures of school enrollment for those age 18 and over. Specifically, besides undergraduate enrollment, some younger adults are still completing high school, and many older adults are enrolled as graduate students. A fourth category of adult education reported by the Census Bureau but not explored in detail here are adults taking vocational courses in a non-school setting. Postsecondary Education OPPORTUNITY 1
, and because they can (supply of higher education opportunity).")
2 This analysis includes unique state-level analyses of undergraduate enrollment for students age 25 years and over. These data are for fall Here, with the assistance of Kim Mergenthaler at CAEL, we have used data on undergraduate enrollment by age 25 years and over from the fall 1998 IPEDS enrollment survey, and combined these data with Census Bureau estimates of state population in these same IPEDS age ranges. The results are undergraduate enrollment rates for each state by age range and gender. This is something OPPORTUNITY subscribers have requested in the past, and that we are pleased to now be able to provide. School Enrollment Rates by Age The chart on page 1 of this issue of OPPORTUNITY shows school enrollment rates by age group between 18 and 34 years for the years from 1950 through For those 18 to 19 years, enrollment rates increased from 29.4 percent in 1950 to 61.2 percent by For those 20 to 21 years, school enrollment rates increased from 18.8 percent in 1959 to 44.1 percent in For those 22 to 24 years, enrollment rates grew from 8.6 percent in 1959 to 24.6 percent by For people 25 to 29 years, school enrollment rates increased from 3.0 percent in 1950 to 11.4 percent in For people 30 to 34 years, enrollment rates increased from 1.1 percent in 1952 to 6.7 percent in Clearly, at every age, school enrollment rates have increased greatly over the last five decades. But different population groups have had quite different experiences. Take, for example, males and females. Gender. We have long held that men and women are living on different planets, despite their brother-sisterhood. The chart on this page shows school enrollment rates for men for the last five decades. It differs sharply from the equivalent chart for females on the following page. Between 1950 and 2000 the enrollment rate for males ages 18 to 19 years increased from 35.7 percent in 1950 to 58.3 percent by 2000, an increase of 22.6 percent. For males 20 to 21 years, the enrollment rate increased from 28.3 percent in 1959 to 41.0 percent by 2000, an increase of 12.7 percent. At 22 to 24 years, enrollment rates increased from 13.7 percent in 1959 to 23.9 percent by 2000, or by 10.2 percent. At 25 to 29 years, enrollment rates increased from 5.9 percent in 1950 to 10.0 percent in 2000, or by 4.1 percent. At 30 to 34 years, enrollment rates increased from 1.7 percent in 1952 to 5.6 percent in 2000, or by 3.9 percent. For males the effects of the Vietnam War in the late 1960s and early 1970s are particularly pronounced on younger males between the ages of 18 and 21 years. During that War, military conscription combined with exemption for full-time college enrollment brought many young males into college. This bulge in their enthusiasm for college lasted only until the military draft was ended in Thereafter males enrollment rates fell back to pre-war levels. At both the 18 to 19 and 20 to 21 year old age ranges, school enrollment rates were higher during the peak of the Vietnam War than they were in There must be something about war that focuses the male mind on the advantages of college enrollment. Quite interesting is the peak in school enrollment for males ages 25 to 29 and 30 to 34 years in the late 1970s, well after the War was over and the draft had ended. Apparently many males encouraged to enroll in college during the War remained in college long after the War was over. Among 25 to 29 and 30 to 34 year old males, enrollment rates were greater in the late 1970s than they were in Postsecondary Education OPPORTUNITY 2

3 For women a quite different pattern emerges between 1950 and 2000, as shown in the chart on the following page. The growth in enrollment rates is steadier, not apparently influenced by the Vietnam war, and far greater for women than it was for men over the last five decades. Among 18 to 19 year old women, enrollment rates increased from 24.3 percent in 1950 (18.5 percent in 1947), to 64.2 percent by 2000, an increase of 39.9 percent (compared to an increase of 22.6 percent for men). Among 20 to 21 year old women, enrollment rates increased from 11.1 to 47.3 percent between 1959 and 2000, an increase of 36.2 percent (compared to an increase of 12.7 percent for men). Among women 22 to 24 years old, enrollment rates increased from 4.4 to 25.3 percent between 1959 and 2000, an increase of 20.9 percent (compared to an increase of 10.2 percent for men). Among women 25 to 29 years old, enrollment rates increase from 0.4 percent in 1950 to 12.7 percent in 2000, an increase of 12.3 percent (compared to an increase of 4.1 percent for men). Among women 30 to 34 years old, enrollment rates increased from 0.7 percent in 1952 to 7.7 percent in 2000, an increase of 7.0 percent (compared to an increase of 3.9 percent for men). The progress of women in school enrollments over the last 50 years is simply stunning. At each of these five age groupings, enrollment rates for women moved from well behind those of men to well ahead of those of men during the last 50 years. This is a profoundly significant change, one that we have drawn attention to often since 1995 in these pages of OPPORTUNITY. It is a change we barely understand, whose meaning we seem currently oblivious to, that will permanently alter the way we live. Race/ethnicity. The Census Bureau has collected and reports school enrollment rates by age for the major racial/ethnic groups (with gender breakdowns): whites, blacks and Hispanics (since 1972). In the last few years the Census Bureau has begun adding reporting categories: white non-hispanic (since 1993), black non-hispanic (since 1993) and Asian and Pacific Islander (since 1999). The data for blacks from 1947 through 1966 are for blacks and other races. The data for whites is very similar to the chart on page 1 of this issue of OPPORTUNITY. It is not reproduced here because of space limitations. However, the larger minority populations--blacks and Hispanics--remain of vital public interest. Their growing share of the U.S. population means that they will replace the declining share of the population that is white. Because whites are far better educated than blacks or Hispanics, rapid and substantial gains in minority education attainment are vital to sustaining the human capital economy now driven disproportionately by college-educated whites. The charts on page 5 shows school enrollment rates by age for blacks and Hispanics. The picture for blacks is one of long-term and very substantial increases in school enrollment rates at each age group. The 2000 data are at or very close to record high enrollment rates, thus indicating that progress continues to be made. For Hispanics there is less progress shown, and during most of the 1990s enrollment rates for Hispanics age 18 to 21 have been declining following increases in the 1970s and 1980s. Other Hispanics, particularly between the ages of 22 and 24 years, continued to make progress in school enrollments during the 1990s however. Space does not permit presentation of all of the available data on school enrollment rates by race/ethnicity for each of the older age cohorts for all years in the time series. But to highlight these data for one year we have summarized the data for each racial/ethnic group reported by the Census Bureau in the following table: Postsecondary Education OPPORTUNITY 3
. Among 20 to 21 year old women, enrollment rates increased from 11.1 to 47.3 percent between 1959 and 2000, an increase of 36.2 percent (compared to an increase of 12.")
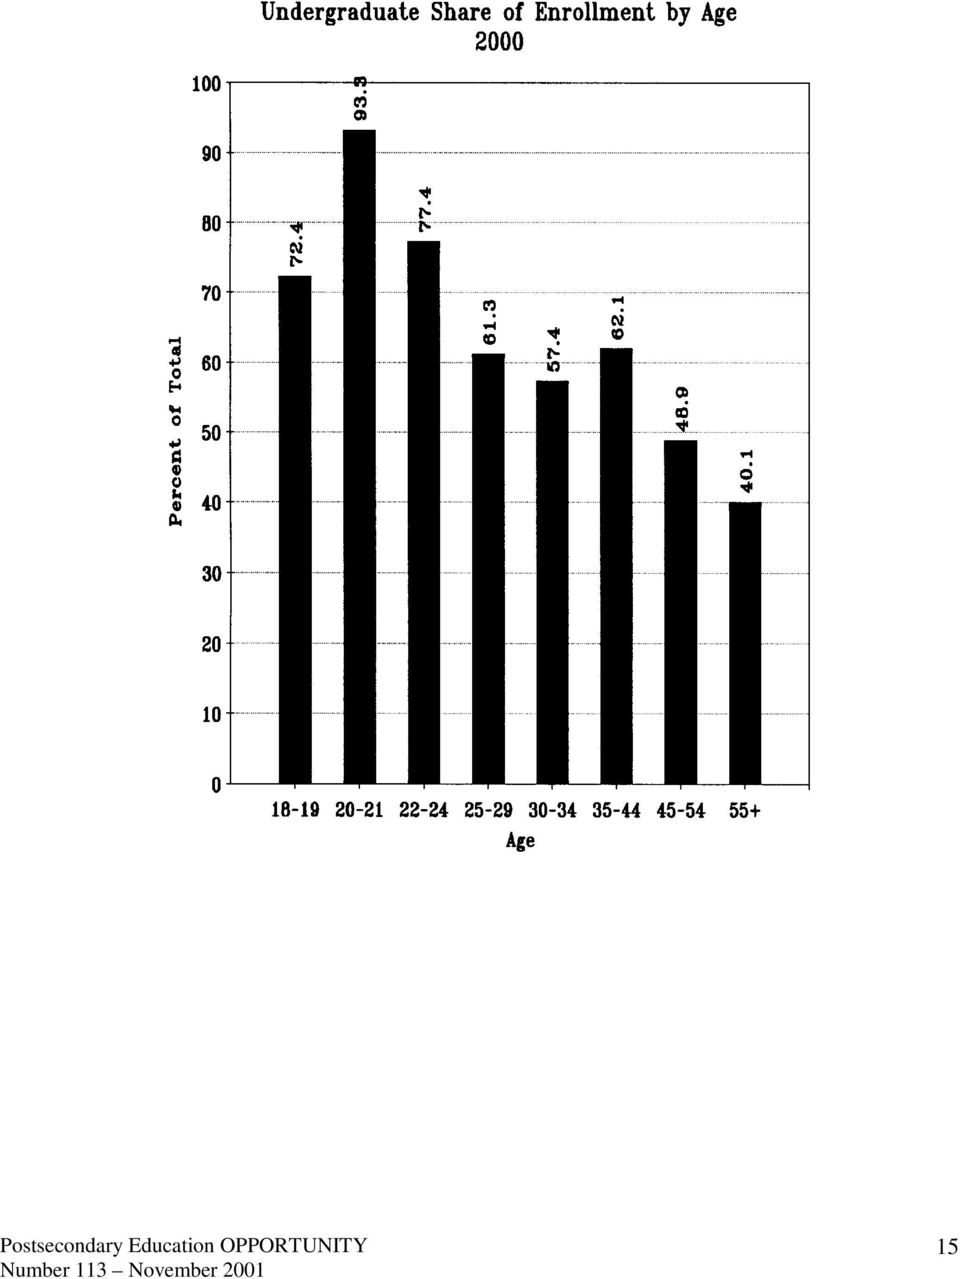
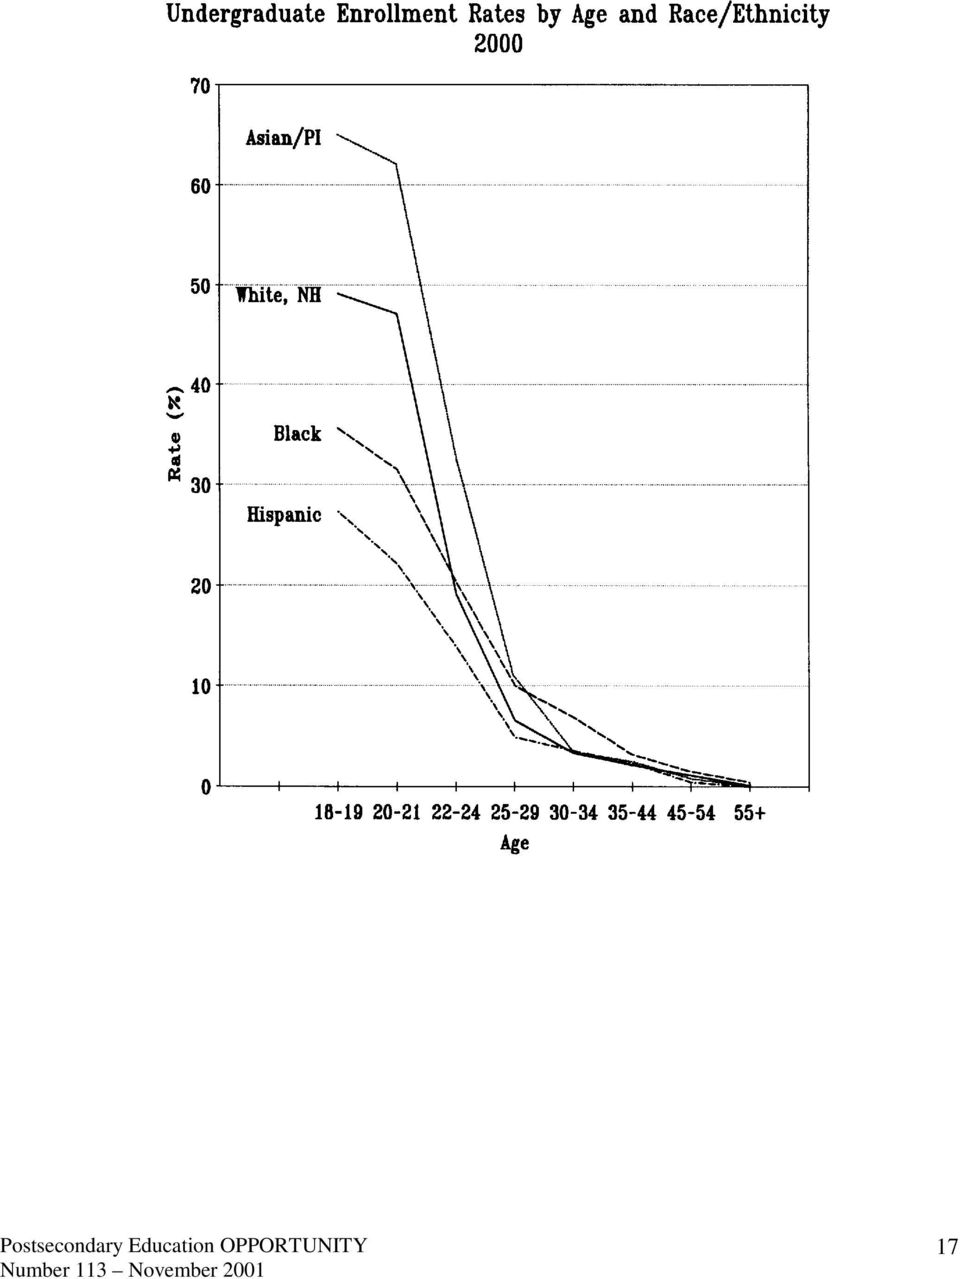
4 School Enrollment Rates in 2000 by Age and Race/Ethnicity White White-nH Black Black-nH Asian/PI Hispanic At each age level, Asian/Pacific Islanders have the highest enrollment rates, and Hispanics have the lowest. Enrollment rates for whites are higher than those for blacks between the ages of 18 and 21 years, but black enrollment rates are higher than those for whites between 22 and 34 years. Undergraduate Enrollment by Age In October 2000 there were 12,399,000 undergraduates enrolled in American colleges and universities according to the Census Bureau. They were distributed by age according to the top pie chart on this page. Undergraduate enrollment begins early. About 1.2 percent of those 16 to 17 years old are enrolled in college as undergraduate students. Over half of all undergraduate students--55 percent--were age 21 or less. Another 27 percent were 22 to 29 years old. The remaining 18 percent were 30 and over. A decade earlier, in 1990, there were 11,108,000 undergraduates enrolled in U.S. colleges and universities. They were distributed by age according to the bottom pie chart on this page. Between 1990 and 2000 the age distribution of undergraduates shifted only slightly. The share of undergraduates age 21 or less increased by 1.5 percent between 1990 and The share of undergraduates age 22 to 29 increased by 0.6 percent. The share of undergraduates age 30 and over decreased by 2.1 percent between 1990 and At age 18 years and over, not all students are undergraduates, as shown in the first chart on the following page for October At age 18 to 19, 72.4 percent of those enrolled in school were undergraduate college students. At that age, 26.9 percent were still enrolled below college. But 0.5 percent were already enrolled in graduate school too. By age 20 to 21, 93.3 percent of school enrollments were undergraduate students. An additional 4.4 percent were still enrolled below college, and an additional 2.3 percent were now in graduate school. By age 22 to 24, 77.4 percent of school enrollments were undergraduates. About 1.8 percent of enrolled students were enrolled below college, and 20.9 percent were now in graduate school. By age 25 to 29, 61.3 percent of enrolled students were undergraduates. Interestingly, 3.3 percent were enrolled below college (up from 1.8 percent of those 22 to 24) percent were enrolled in graduate school. At age 30 to 34, just 57.4 percent of those enrolled in school were undergraduates. 3.7 percent were enrolled below college, and 38.9 percent were enrolled in graduate schools. The second chart on this page shows undergraduate enrollment rates by age. This is the proportion of the U.S. population enrolled in school as undergraduate students. Postsecondary Education OPPORTUNITY 4

5 Clearly undergraduate enrollment rates are highest between the ages of 18 and 21 years. In October 2000, more than 40 percent of the U.S. population was enrolled in college as undergraduates. A decade earlier, in October 1990, there was a similar pattern in enrollment rates. However, between 1990 and 2000 the growth in undergraduate enrollment rates was greatest between the ages of 20 and 24 years. Undergraduate enrollment rates for the age 30 years and over barely changed between 1990 and Gender. In October 2000 undergraduate enrollment rates by gender are shown in the first chart on the following page. At all age ranges--except 22 to 24 years--enrollment rates for women were greater than were those for men, often by substantial margins. This gender difference is greatest in the 18 to 19 and 20 to 21 year old cohorts. At age 18 to 19, the undergraduate enrollment rate for women exceeded the male rate by 12.1 percentage points. By ages 20 to 21, the enrollment rate for women exceeded the male rate 6.9 percent. We have written often in these pages about the growing disparity between the performance of males and females throughout the education pipeline. These data are another illustration of this disparity. Between 1990 and 2000 undergraduate enrollment rates for young adult males actually declined, but increased sharply for females. Between ages 22 to 24 years male undergraduate enrollment rates increased between 1990 and 2000, but by less than they did for women: Male Female % +6.1% % +7.1% % +3.6% % +0.6% % -0.1% The pattern suggested in the above data is that the women "get it" earlier than do the men. (Or, as mothers say: boys mature later.) Women appear to engage in undergraduate education sooner after high school than do the men. They complete it sooner than the men do, and thus by age 30 to 34 male undergraduate enrollment rates have risen while they have declined for women. Race/ethnicity. The four major racial/ethnic groups reported by the Census Bureau tend to show distinctive patterns in undergraduate enrollment by age, as shown in the two charts on this page. Asian and Pacific Islanders have by far the highest undergraduate enrollment rates between ages 18 and 29, but then have the lowest thereafter. In October percent of Asian/PI's age 18 and 19 were enrolled as undergraduates, and at ages 20 to 21 years 62.2 percent were still enrolled. White non-hispanics had the second highest rates, at 49.1 percent for year olds, and 47.1 percent for year olds. Blacks have the third highest undergraduate enrollment rates between 18 and 21 years, at 35.6 percent for those 18 to 19, and 31.5 percent for those 20 to 21 years. However, from age 30 and on blacks are more likely to be enrolled as undergraduates than is any other group. Through age 30 Hispanics are least likely to be enrolled in college as undergraduates. At age 18 to 19, 27.3 percent are enrolled, at age 20 to percent are enrolled, and at 22 to 24 years 13.9 percent are in college as undergraduate students. Enrollment Status. Undergraduate enrollment status--whether full-time or part-time--is strongly related to age. Younger undergraduates, between 18 and 24, are most likely to be enrolled on a full-time basis. Beyond age 30 undergraduates are most likely to be enrolled part-time, as shown in the top chart on this page. This shift from full-time to part-time college attendance is clearly related to the opportunity costs of college attendance. Life gets complicated as young adults move through their twenties. Time available to devote to college Postsecondary Education OPPORTUNITY 5

6 diminishes as careers and families are started, and financial obligations dictate priorities. This makes higher education's ability to capture students while they are young critical to the success of the education enterprise. Institutional control. Overall about 80 percent of undergraduate college students are enrolled in public institutions. The public institution share of undergraduate enrollments at each age level remains close to this figure, dipping slightly toward privates between the ages of 20 and 21 years, as shown in the bottom chart on this page. Above age 25 between 83 and 88 percent of undergraduate enrollments are in public institutions. Institutional level. Most students at the undergraduate level are enrolled in four-year institutions. This is particularly true of undergraduate students between the ages of 20 and 24 years where more than three quarters are enrolled in four-year institutions. Above age 35, however, about half of all undergraduate students are enrolled in two-year colleges. Employment. College enrollment has always been in stiff competition with the labor market and other adult pursuits. Eventually college loses out to these alternatives. And as the data in the second chart on this page show, most students try to do both at the same time. At age 18 to 19, half of all college students were also working at least part-time. The employment rate among college students 20 to 21 years rose to 60 percent. Two-thirds of college students 22 to 24 years also had jobs. By ages 25 to 29 years, three-quarters of college students were working, and over half of college students were working full-time by then also. Vocational courses. In addition to these institution-based (school) enrollments, other adults are also taking vocational courses in non-school settings. These too are age-related. Vocational course enrollment rates by age cohort in October 2000 were as follows: years 1.3% years 3.2% years 2.9% years 2.2% years 1.6% 65 years and over 0.5% Vocational course taking increased with educational attainment in 2000: not high school graduate 0.5% high school graduate only 1.5% some college 2.8% bachelor's or more 2.8% At most age levels, vocational course-taking rates were greater among those employed part-time than they were among those employed full-time: Full-time Part-time % 1.9% % 3.5% % 3.7% % 2.3% % 2.0% % 0.9% Postsecondary Education OPPORTUNITY 6

7 Older Undergraduate Enrollment by State This analysis of college enrollments by age was first suggested by Dr. Thomas Flint of the Council for Adult and Experiential Learning (CAEL) in Chicago. CAEL was especially interested in older undergraduate enrollment rates by state. During the course of development of data reported here, CAEL and OPPORTUNITY jointly examined enrollment rates by state for undergraduates by gender and age 25 years and over. One of the results of that joint effort is the chart on this page of undergraduate enrollment rates of state populations between the ages of 25 and 29 years. This analysis combined age data on undergraduate enrollments by state reported in the fall 1998 IPEDS enrollment survey, with Census Bureau data on state population estimates by age and gender as of July 1, This combination produced a large Excel workbook available on our website ( of undergraduate college enrollment rates by state and gender for the following age intervals: 25-29, 30-34, 35-39, and The population and enrollment data used to calculate the rates are shown in each state's spreadsheet. For 25 to 29 year olds, undergraduate enrollment rates in 1998 ranged from 1.7 percent in Connecticut to 7.0 percent in Montana. The regional patterns in this ranking are clear and striking. The 13 states with the highest enrollment rates for undergraduates are all western states. The states with the lowest enrollment rates are all New England or mid-atlantic states. We have no simple explanation for these regional differences. Always observed higher education enrollments occur at the intersection of student demand and institutional supply curves. Or, higher education enrollments are never more or less than the limiting factor of the number of students seeking enrollment and institutions willing and able to enroll them. Causal explanations remain for future research. The data on college enrollment rates have shown remarkable growth over the last 50 years. Every demographic group has participated to some degree, some more than others. Given the emergence of college education as vital to individual and social economic success since the early 1970s, this is a record of who is preparing to engage in life's opportunities and who is not. Postsecondary Education OPPORTUNITY 7

8 8

9 9

10 10

11 11

12 12

13 13

14 14

15 15
16 16

17 17
18 18

19 19

20 20

21 21
22 22
23 23
Undergraduate Degree Completion by Age 25 to 29 for Those Who Enter College 1947 to 2002
 Undergraduate Degree Completion by Age 25 to 29 for Those Who Enter College 1947 to 2002 About half of those who start higher education have completed a bachelor's degree by the ages of 25 to 29 years.
College Enrollment Hits All-Time High, Fueled by Community College Surge
 Enrollment Hits All-Time High, Fueled by Community Surge FOR RELEASE: OCTOBER 29, 2009 Paul Taylor, Project Director Richard Fry, Senior Researcher Wendy Wang, Research Associate Daniel Dockterman, Research
Parental Educational Attainment and Higher Educational Opportunity
 Parental Educational Attainment and Higher Educational Opportunity Federal higher education policy recognizes certain student characteristics as limiting higher educational opportunity, and has created
Educational Attainment of Veterans: 2000 to 2009
 Educational Attainment of Veterans: to 9 January 11 NCVAS National Center for Veterans Analysis and Statistics Data Source and Methods Data for this analysis come from years of the Current Population Survey
The Changing Gender Balance: An Overview
 Fewer Men on Campus A Puzzle for Liberal Arts Colleges and Universities November 15-16, 1999 Goucher College Baltimore, Maryland Thomas G. Mortenson Senior Scholar Center for the Study of Opportunity in
UWEP Utah Women and Education Project
 Research and Policy Brief UWEP Utah Women and Education Project May 25, 2010 UWEP 2010-204 Women and Higher Education in Utah: A Glimpse at the Past and Present According to Lumina Foundation researchers,
CENTER FOR LABOR MARKET STUDIES
 The Complete Breakdown in the High Schoolto Work Transition of Young, Non College Enrolled High School Graduates in the U.S.; The Need for an Immediate National Policy Response Prepared by: Andrew Sum
New York State Profile
 As America Becomes More Diverse: The Impact of State Higher Education Inequality State Profile Questions You Should Ask How educated is s adult population and workforce? How does compare to the national
COLLEGE ENROLLMENT AND WORK ACTIVITY OF 2014 HIGH SCHOOL GRADUATES
 For release 10:00 a.m. (EDT) Thursday, April 16, 2015 USDL-15-0608 Technical information: (202) 691-6378 cpsinfo@bls.gov www.bls.gov/cps Media contact: (202) 691-5902 PressOffice@bls.gov COLLEGE ENROLLMENT
Marriage and divorce: patterns by gender, race, and educational attainment
 ARTICLE OCTOBER 2013 Marriage and divorce: patterns by gender, race, and educational attainment Using data from the National Longitudinal Survey of Youth 1979 (NLSY79), this article examines s and divorces
Rhode Island State Profile
 As America Becomes More Diverse: The Impact of State Higher Education Inequality State Profile Questions You Should Ask How educated is s adult population and workforce? How does compare to the national
Doctors 24,728 20,176 44,904 55.1% 44.9% First-Prof 42,862 36,845 79,707 53.8% 46.2%
 Earned Degrees Conferred by Gender 1870 to 2001 The growing gender imbalance in higher education is most apparent at college graduation. Throughout the education pipeline girls and young women are consistently
Women s Participation in Education and the Workforce. Council of Economic Advisers
 Women s Participation in Education and the Workforce Council of Economic Advisers Updated October 14, 214 Executive Summary Over the past forty years, women have made substantial gains in the workforce
Minorities in Higher Education. 2010 2011 Supplement. Young M. Kim
 Minorities in Higher Education 2010 Twenty-FOURTH Status Report 2011 Supplement Young M. Kim Minorities in Higher Education 2010 Twenty-FOURTH Status Report 2011 Supplement Young M. Kim PROJECT COORDINATOR:
Massachusetts State Profile
 As America Becomes More Diverse: The Impact of State Higher Education Inequality State Profile Questions You Should Ask How educated is adult population and workforce? How does compare to the national
Enrollment Data Undergraduate Programs by Race/ethnicity and Gender (Fall 2008) Summary Data Undergraduate Programs by Race/ethnicity
 Summary Data Undergraduate Programs by Race/ethnicity") Enrollment Data Undergraduate Programs by Race/ethnicity and Gender (Fall 8) Summary Data Undergraduate Programs by Race/ethnicity The following tables and figures depict 8, 7, and 6 enrollment data for
Enrollment Data Undergraduate Programs by Race/ethnicity and Gender (Fall 8) Summary Data Undergraduate Programs by Race/ethnicity The following tables and figures depict 8, 7, and 6 enrollment data for
New Mexico State Profile
 As America Becomes More Diverse: The Impact of State Higher Education Inequality State Profile Questions You Should Ask How educated is s adult population and workforce? How does compare to the national
Demographic Profile of Wichita Unemployment Insurance Beneficiaries Q3 2015
 Demographic Profile of Wichita Unemployment Insurance Beneficiaries Q3 2015 The Bureau of Labor Statistics defines an unemployed person as one 16 years and older having no employment and having made specific
What It s Worth: Field of Training and Economic Status in 2009
 What It s Worth: Field of Training and Economic Status in 2009 Household Economic Studies Issued February 2012 P70-129 INTRODUCTION The relationship between educational attainment and economic outcomes
Colorado State Profile
 As America Becomes More Diverse: The Impact of State Higher Education Inequality State Profile Questions You Should Ask How educated is s adult population and workforce? How does compare to the national
Demographic Profile of Wichita Unemployment Insurance Beneficiaries Q2 2014
 Demographic Profile of Wichita Unemployment Insurance Beneficiaries Q2 2014 The Bureau of Labor Statistics defines an unemployed person as one 16 years and older having no employment and having made specific
Women, Minorities, and Persons with Disabilities in Science and Engineering: 2013
 Women, Minorities, and Persons with Disabilities in Science and Engineering: 213 National Center for Science and Engineering Statistics Directorate for Social, Behavioral and Economic Sciences National
Prepared by: Andrew Sum Ishwar Khatiwada With Walter McHugh. Center for Labor Market Studies Northeastern University
 The College Educated Population and Labor Force of Massachusetts and the U.S., Their Employment Behavior and Labor Market Problems, The Numbers and Occupational Characteristics of College Labor Market
Suggested Citation: Institute for Research on Higher Education. (2016). College Affordability Diagnosis: Massachusetts. Philadelphia, PA: Institute
. College Affordability Diagnosis: Massachusetts. Philadelphia, PA: Institute") MASSACHUSETTS Suggested Citation: Institute for Research on Higher Education. (2016). College Affordability Diagnosis: Massachusetts. Philadelphia, PA: Institute for Research on Higher Education, Graduate
MASSACHUSETTS Suggested Citation: Institute for Research on Higher Education. (2016). College Affordability Diagnosis: Massachusetts. Philadelphia, PA: Institute for Research on Higher Education, Graduate
Access to meaningful, rewarding and safe employment is available to all.
 Home Previous Reports Links Downloads Contacts The Social Report 2002 te purongo oranga tangata 2002 Introduction Health Knowledge and Skills Safety and Security Paid Work Human Rights Culture and Identity
Overall Progress and Challenges Facing the State
 Executive Summary This report provides the Nebraska Legislature with comparative statistics to monitor and evaluate progress toward achieving three key priorities for Nebraska s postsecondary education
Trends In Long-term Unemployment
 MARCH 2015 Trends In Long-term Unemployment Karen Kosanovich and Eleni Theodossiou Sherman Long-term unemployment reached historically high levels following the Great Recession of 2007 2009. Both the number
Age/sex/race in New York State
 Age/sex/race in New York State Based on Census 2010 Summary File 1 Jan K. Vink Program on Applied Demographics Cornell University July 14, 2011 Program on Applied Demographics Web: http://pad.human.cornell.edu
Graduation Rates 2009-10
 Page 1 of 19 Graduation Rates 29-1 User ID: 29C11 Screening questions Does your institution use a website to disclose Student-Right-to-Know student athlete graduation rates? nmlkji nmlkj No. Yes. Please
Number, Timing, and Duration of Marriages and Divorces: 2009
 Number, Timing, and Duration of Marriages and Divorces: 2009 Household Economic Studies Issued May 2011 P70-125 INTRODUCTION Marriage and divorce are central to the study of living arrangements and family
SalarieS of chemists fall
 ACS news SalarieS of chemists fall Unemployment reaches new heights in 2009 as recession hits profession hard The economic recession has taken its toll on chemists. Despite holding up fairly well in previous
Baccalaureate Program: Applications and Enrollment
 Baccalaureate Program: Applications and Enrollment Please report the number of applications, accepted applicants, and enrolled students as of November 1, 2012 (or as of the date in the fall term when your
The question of whether student debt levels are excessive
 College on Credit: How Borrowers Perceive Their Education Debt By Sandy Baum and Marie O Malley Sandy Baum is professor of economics at Skidmore College in Skidmore, PA. Marie O Malley is vice president
Financing the Future Postsecondary Students, Costs, and Financial Aid: 1996-1997
 Financing the Future Postsecondary Students, Costs, and Financial Aid: 996-997 Household Economic Studies Issued October 2002 P70-83 INTRODUCTION increased, it has also become increasingly difficult for
AMERICA'S YOUNG ADULTS AT 27: LABOR MARKET ACTIVITY, EDUCATION, AND HOUSEHOLD COMPOSITION: RESULTS FROM A LONGITUDINAL SURVEY
 For release 10:00 a.m. (EDT) Wednesday, March 26, 2014 USDL-14-0491 Technical information: (202) 691-7410 nls_info@bls.gov www.bls.gov/nls Media contact: (202) 691-5902 PressOffice@bls.gov AMERICA'S YOUNG
A Gender Reversal On Career Aspirations Young Women Now Top Young Men in Valuing a High-Paying Career
 1 A Gender Reversal On Career Aspirations Young Women Now Top Young Men in Valuing a High-Paying Career By Eileen Patten and Kim Parker Career Importance, by Gender % of 18-34-year-olds saying being successful
LICENSED SOCIAL WORKERS IN THE UNITED STATES, 2004. Chapter 2 of 4. Demographics
 LICENSED SOCIAL WORKERS IN THE UNITED STATES, 2004 Chapter 2 of 4 Demographics Prepared by Center for Health Workforce Studies School of Public Health, University at Albany Rensselaer, NY and NASW Center
A New Measure of Educational Success in Texas. Tracking the Success of 8th Graders into and through College
 A New Measure of Educational Success in Texas Tracking the Success of 8th Graders into and through College National Center for Management Systems (NCHEMS) Contents Introduction 1 The Challenge 2 Purpose
Disabilities and Employment: Removing Barriers to Encourage Productive Community Living
 Disabilities and Employment: Removing Barriers to Encourage Productive Community Living Peter S. Arno, PhD Deborah Viola, PhD Alexandra Rubino, BA Prevalence of Disabilities in US and UK US 54 million:
Home Computers and Internet Use in the United States: August 2000
 Home Computers and Internet Use in the United States: August 2000 Special Studies Issued September 2001 P23-207 Defining computer and Internet access All individuals living in a household in which the
Real Mean and Median Income, Families and Individuals, 1947-2012, and Households, 1967-2012 (Reported in $2012).
.") Income Real Mean and Median Income, Families and Individuals, 1947-2012, and Households, 1967-2012 (Reported in $2012). $80,000 $60,000 Median Family Income Mean Family Income Median Household Income Mean
Income Real Mean and Median Income, Families and Individuals, 1947-2012, and Households, 1967-2012 (Reported in $2012). $80,000 $60,000 Median Family Income Mean Family Income Median Household Income Mean
LICENSED SOCIAL WORKERS IN THE UNITED STATES, 2004 SUPPLEMENT. Chapter 2 of 5. Who Are Licensed Social Workers?
 LICENSED SOCIAL WORKERS IN THE UNITED STATES, 2004 SUPPLEMENT Chapter 2 of 5 Who Are Licensed Social Workers? Prepared by Center for Health Workforce Studies School of Public Health, University at Albany
School Enrollment Social and Economic Characteristics of Students: October 2003
 School Enrollment Social and Economic Characteristics of Students: October 2003 Population Characteristics Issued May 2005 P20-554 This report highlights school enrollment trends of the population aged
How 2015 graduates are faring
 How 2015 graduates are faring What they re telling us that schools can use By Jo Ann Deasy The 2014 2015 GSQ Total School Profile provides a wealth of survey data about graduating students: educational
Figure 1.1 Percentage of persons without health insurance coverage: all ages, United States, 1997-2001
 Figure 1.1 Percentage of persons without health insurance coverage: all ages, United States, 1997-2001 DATA SOURCE: Family Core component of the 1997-2001 National Health Interview Surveys. The estimate
HEALTH INSURANCE COVERAGE STATUS. 2009-2013 American Community Survey 5-Year Estimates
 S2701 HEALTH INSURANCE COVERAGE STATUS 2009-2013 American Community Survey 5-Year Estimates Supporting documentation on code lists, subject definitions, data accuracy, and statistical testing can be found
Educational Attainment in the United States: 2015
 Educational Attainment in the United States: 215 Population Characteristics Current Population Reports By Camille L. Ryan and Kurt Bauman March 216 P2-578 This report provides a portrait of educational
The Big Payoff: Educational Attainment and Synthetic Estimates of Work-Life Earnings
 The Big Payoff: Educational Attainment and Synthetic Estimates of Work-Life Earnings Special Studies Issued July 2002 P23-210 Does going to school pay off? Most people think so. Currently, almost 90 percent
The goal is to transform data into information, and information into insight. Carly Fiorina
 DEMOGRAPHICS & DATA The goal is to transform data into information, and information into insight. Carly Fiorina 11 MILWAUKEE CITYWIDE POLICY PLAN This chapter presents data and trends in the city s population
Young Black America Part Four: The Wrong Way to Close the Gender Wage Gap
 Issue Brief August 2015 Young Black America Part Four: The Wrong Way to Close the Gender Wage Gap By Cherrie Bucknor* Young blacks in America have had significant improvements in educational attainment
The Decline in Student Applications to Computer Science and IT Degree Courses in UK Universities. Anna Round University of Newcastle
 The Decline in Student Applications to Computer Science and IT Degree Courses in UK Universities Introduction Anna Round University of Newcastle The research described in this report was undertaken for
Succeeding Calumet Conference Center, Purdue University Calumet, Hammond, IN June 17, 2010
 Post-Secondary Student Pathways in Northwest Indiana: Patterns of Enrollment Research findings from the Mobile Working Students Collaborative Desiree Zerquera & Jin Chen Project on Academic Success WORKING
Projections of the Size and Composition of the U.S. Population: 2014 to 2060 Population Estimates and Projections
 Projections of the Size and Composition of the U.S. Population: to Population Estimates and Projections Current Population Reports By Sandra L. Colby and Jennifer M. Ortman Issued March 15 P25-1143 INTRODUCTION
NCES 2011-034 U.S. DEPARTMENT OF EDUCATION
 NCES 2011-034 U.S. DEPARTMENT OF EDUCATION The Condition of Education 2011 in Brief MAY 2011 Editors Susan Aud National Center for Education Statistics Gretchen Hannes American Institutes for Research
EXECUTIVE SUMMARY. Findings from the Annual Survey of Schools of Nursing Academic Year 2009-2010
 EXECUTIVE SUMMARY Findings from the Annual Survey of Schools of Nursing Academic Year 2009-2010 NLN Data Show Both Progress and Challenges in Meeting IOM Objectives This executive summary describes findings
BizBuySell.com Small Business Buyer & Seller Demographic Study
 BizBuySell.com Small Business Buyer & Seller Demographic Study Table of Contents Report Executive Summary Younger, More Diverse Buyers Look to Acquire Retiring Baby Boomer Businesses Female Business Buyers
ETS s Addressing Achievement Gaps Symposium. Advancing Success for Black Men in College. A Statistical Profile
 ETS s Addressing Achievement Gaps Symposium Advancing Success for Black Men in College A Statistical Profile ETS s Addressing Achievement Gaps Symposium Advancing Success for Black Men in College Co-sponsored
An Equity Profile of the Kansas City Region. Summary. Overview. The Equity Indicators Framework. central to the region s economic success now and
 An Equity Profile of the Kansas City Region PolicyLink and PERE An Equity Profile of the Kansas City Region Summary Overview Across the country, regional planning organizations, community organizations
WORKING THEIR WAY THROUGH COLLEGE: STUDENT EMPLOYMENT AND ITS IMPACT ON THE COLLEGE EXPERIENCE
 Issue Brief May 2006 WORKING THEIR WAY THROUGH COLLEGE: STUDENT EMPLOYMENT AND ITS IMPACT ON THE COLLEGE EXPERIENCE During the 2003 04 academic year, 78 percent of undergraduates worked while they were
TWO-YEAR COLLEGE MATHEMATICS PROGRAM FACULTY
 CHAPTER 9 TWO-YEAR COLLEGE MATHEMATICS PROGRAM FACULTY This chapter describes the number, teaching load, education, professional activities, and age, sex, and ethnicity of the faculty in two-year college
Women in the U.S. Military: Growing Share, Distinctive Profile
 1 PEW SOCIAL & DEMOGRAPHIC TRENDS in the U.S. Military: Growing Share, Distinctive Profile By Eileen Patten and Kim Parker The women who serve in today s military differ from the men who serve in a number
Employment-Based Health Insurance: 2010
 Employment-Based Health Insurance: 2010 Household Economic Studies Hubert Janicki Issued February 2013 P70-134 INTRODUCTION More than half of the U.S. population (55.1 percent) had employment-based health
Survey of Nurses 2012
 Survey of Nurses 2012 EXECUTIVE SUMMARY In 2012, the Michigan Center for Nursing conducted the ninth annual survey of nurses licensed in Michigan. The samples for this survey and previous surveys were
Educational Attainment in the United States: 2003
 Educational Attainment in the United States: 2003 Population Characteristics Issued June 2004 P20-550 The population in the United States is becoming more educated, but significant differences in educational
Sources of Health Insurance and Characteristics of the Uninsured: Analysis of the March 2013 Current Population Survey
 September 2013 No. 390 Sources of Health Insurance and Characteristics of the Uninsured: Analysis of the March 2013 Current Population Survey By Paul Fronstin, Ph.D., Employee Benefit Research Institute
College of Medicine Enrollment MD and MD/MPH Fall 2002 to Fall 2006
 1 1 College of Medicine Enrollment MD and MD/MPH 8 6 4 2 College of Medicine MD and MD/MPH New students 184 18 172 185 184 Continuing students 592 595 67 585 589 Total 775 775 779 77 773 Change from previous
Women See Value and Benefits of College; Men Lag on Both Fronts, Survey Finds
 Social & Demographic Trends Wednesday, August 17, 2011 Women See Value and Benefits of College; Men Lag on Both Fronts, Survey Finds Paul Taylor, Director Kim Parker, Associate Director Richard Fry, Senior
Health Status, Health Insurance, and Medical Services Utilization: 2010 Household Economic Studies
 Health Status, Health Insurance, and Medical Services Utilization: 2010 Household Economic Studies Current Population Reports By Brett O Hara and Kyle Caswell Issued July 2013 P70-133RV INTRODUCTION The
Trends in Higher Education Series. Education Pays. The Benefits of Higher Education for Individuals and Society. Sandy Baum and Jennifer Ma
 Trends in Higher Education Series Education Pays The Benefits of Higher Education for Individuals and Society 2007 Sandy Baum and Jennifer Ma Executive Summary Students who attend institutions of higher
OVERVIEW OF CURRENT SCHOOL ADMINISTRATORS
 Chapter Three OVERVIEW OF CURRENT SCHOOL ADMINISTRATORS The first step in understanding the careers of school administrators is to describe the numbers and characteristics of those currently filling these
The recession of 2007 2009, a
 Employment outlook: Labor force projections to : a more slowly growing workforce The projected labor force growth over the next 10 years will be affected by the aging of the baby-boom generation; as a
During the past century,
 Academic preparation is still a core function of community colleges. But today their mission is more comprehensive, thanks to a gradual shift toward vocational education, job training, and programs catering
THE EDUCATIONAL PROGRESS OF BLACK STUDENTS
 NATIONAL CENTER FOR EDUCATION STATISTICS Findings from THE CONDITION OF EDUCATION 1994 NO. 2 THE EDUCATIONAL PROGRESS OF BLACK STUDENTS U.S. Department of Education Office of Educational Research and Improvement
Suggested Citation: Institute for Research on Higher Education. (2016). College Affordability Diagnosis: Florida. Philadelphia, PA: Institute for
. College Affordability Diagnosis: Florida. Philadelphia, PA: Institute for") FLORIDA Suggested Citation: Institute for Research on Higher Education. (2016). College Affordability Diagnosis: Florida. Philadelphia, PA: Institute for Research on Higher Education, Graduate School of
FLORIDA Suggested Citation: Institute for Research on Higher Education. (2016). College Affordability Diagnosis: Florida. Philadelphia, PA: Institute for Research on Higher Education, Graduate School of
Text table 4-1 Enrollment, degree attainment, and employment status of academic year 1996/97 and 1997/98 S&E bachelor s degree recipients: April 1999
 Chapter 4 Graduate Enrollment Overview Graduate enrollment in science and engineering 1 rose in after 5 consecutive years of decline. (See appendix table 4-1.) The growth was entirely attributable to increases
Graduation Rates 2015-16
 Graduation Rates 2015-16 Overview Graduation Rates Overview Welcome to the IPEDS Graduation Rates (GR) survey component. The GR component collects data on the cohort of full-time, first-time degree/certificate-seeking
2010 Grantmakers Salary and Benefits Report KEY FINDINGS
 2010 Grantmakers Salary and Benefits Report KEY FINDINGS WHO WE ARE The Council on Foundations is a national nonprofit association of approximately 2,000 grantmaking foundations and corporations. As a
Record Shares of Young Adults Have Finished Both High School and College
 Social & Demographic Trends Monday, Nov. 5, 2012 Record Shares of Young Adults Have Finished Both High School and College Richard Fry, Senior Economist Kim Parker, Associate Director FOR FURTHER INFORMATION
CLACLS. Marriage Patterns among Latinos in New York City, 1990-2010. Amanda Mía Marín-Chollom. Justine Calcagno
 CLACLS Center for Latin American, Caribbean & Latino Studies Marriage Patterns among Latinos in New York City, 1990-2010 Center for Latin American, Caribbean & Latino Studies Graduate Center City University
Undergraduate Enrollment
 Undergraduate Enrollment Total undergraduate enrollment in degree-granting postsecondary institutions increased 31 percent from 13.2 million in 2000 to 17.3 million in 2014. By 2025, total undergraduate
Lloyd Potter is the Texas State Demographer and the Director of the Texas State Data Center based at the University of Texas at San Antonio.
 Lloyd Potter is the Texas State Demographer and the Director of the Texas State Data Center based at the University of Texas at San Antonio. 1 2 Texas population in 2014 was just under 27 million and was
Employment in the United States is recovering slowly from the
 Employment Patterns During the Recovery: Who Are Getting the Jobs and Why? By Ayşegül Şahin and Jonathan L. Willis Employment in the United States is recovering slowly from the Great Recession. After declining
Low-wage Workers Are Older and Better Educated than Ever BY JOHN SCHMITT AND JANELLE JONES*
 Issue Brief April 2012 Low-wage Workers Are Older and Better Educated than Ever BY JOHN SCHMITT AND JANELLE JONES* Relative to any of the most common benchmarks the cost of living, the wages of the average
Social work education in England 2009-2014
 Social work education in England 2009-2014 A report for the Department of Health (DH) March 2015 Produced by Skills for Care for the Department of Health Contents Introduction 3 1. Enrolments 4 Interim
Portraits A PORTRAIT OF LOW-INCOME YOUNG ADULTS IN EDUCATION JUNE 2010
 Portraits WHAT IS THE PORTRAITS SERIES? With the support from the Bill & Melinda Gates Foundation, the INSTITUTE FOR HIGHER EDUCATION POLICY plans to regularly release short research briefs that describe
Demographic Analysis of the Salt River Pima-Maricopa Indian Community Using 2010 Census and 2010 American Community Survey Estimates
 Demographic Analysis of the Salt River Pima-Maricopa Indian Community Using 2010 Census and 2010 American Community Survey Estimates Completed for: Grants & Contract Office The Salt River Pima-Maricopa
Graduation Rates 2014-15
 Overview Graduation Rates 2014-15 Graduation Rates Overview Welcome to the IPEDS Graduation Rates (GR) survey component. The GR component collects data on the cohort of full-time, first-time degree/certificate-seeking
The traditional work schedule for an
 A time to work: recent trends in work and flexible schedules Numerous U.S. workers have work schedules different from the standard 9 a.m.-to-5 p.m., Monday-through-Friday, work ; the demands of the industry
National Sample Survey of Registered Nurses March 2004. Preliminary Findings
 The Registered Nurse Population: National Sample Survey of Registered Nurses March 2004 Preliminary Findings Preliminary Findings 2004 National Sample Survey of Registered Nurses The (NSSRN) is the Nation
2013 2014 Factual Look at Higher Education in Nebraska. Section: Enrollment Fall Enrollment Data for 2003 through 2013
 2013 2014 Factual Look at Higher Education in Nebraska Nebraska s Coordinating Commission for Postsecondary Education Section: Enrollment Fall Enrollment Data for 2003 through 2013 Published November 2014
Trends in Higher Education Series. Trends in College Pricing
 Trends in Higher Education Series Trends in College Pricing 2006 Introduction This report, based on the College Board s Annual Survey of Colleges, provides up-to-date information on tuition and other expenses
Research Report No. 99-4
 Research Report No. 99-4 Washington State Board for Community and Technical Colleges; Education Division Introduction EMPLOYMENT OUTCOMES OF NON-TRANSFERRING STUDENTS At the close of the 1996-97 academic
Bowen, Chingos & McPherson, Crossing the Finish Line
 1 Bowen, W. G., Chingos, M. M., and McPherson, M. S. (2009). Crossing the Finish Line: Completing College at America s Public Universities. Princeton, N.J.: Princeton University Press. The authors begin
Where Are Students Getting Science Bachelor s Degrees? What Are They Paying?
 Center for STEM EDUCATION & INNOVATION at American Institutes for Research DATA BRIEF SEPTEMBER 2013 This data brief is the first in the series The Price and Cost of Science Degrees. For more information,
Health Insurance Coverage: Estimates from the National Health Interview Survey, 2004
 Health Insurance Coverage: Estimates from the National Health Interview Survey, 2004 by Robin A. Cohen, Ph.D., and Michael E. Martinez, M.P.H., Division of Health Interview Statistics, National Center
March 2004 Report No. 04-23
 March 2004 Report No. 04-23 Most Bright Futures Scholars Perform Well and Remain Enrolled in College at a glance Bright Futures scholarship recipients perform well in college. Students who receive Bright
2 2000 CBMS Survey of Undergraduate Programs
 Chapter Summary of CBMS Findings on Mathematical Sciences Enrollment, Bachelors Degrees, Faculty, and the Curriculum in Twoand Four-Year Colleges and Universities A. What Do the CBMS Surveys Study? Every
May 2006. Minnesota Undergraduate Demographics: Characteristics of Post- Secondary Students
 May 2006 Minnesota Undergraduate Demographics: Characteristics of Post- Secondary Students Authors Tricia Grimes Policy Analyst Tel: 651-642-0589 Tricia.Grimes@state.mn.us Shefali V. Mehta Graduate Intern
Suggested Citation: Institute for Research on Higher Education. (2016). College Affordability Diagnosis: South Carolina. Philadelphia, PA: Institute
. College Affordability Diagnosis: South Carolina. Philadelphia, PA: Institute") SOUTH CAROLINA Suggested Citation: Institute for Research on Higher Education. (2016). College Affordability Diagnosis: South Carolina. Philadelphia, PA: Institute for Research on Higher Education, Graduate
SOUTH CAROLINA Suggested Citation: Institute for Research on Higher Education. (2016). College Affordability Diagnosis: South Carolina. Philadelphia, PA: Institute for Research on Higher Education, Graduate
Health Insurance Data Brief #2
 cepr Center for Economic and Policy Research Health Insurance Data Brief #2 Health Insurance Coverage in the United States By Heather Boushey and Joseph Wright 1 April 13, 2004 CENTER FOR ECONOMIC AND