Doctors 24,728 20,176 44, % 44.9% First-Prof 42,862 36,845 79, % 46.2%
|
|
|
- Isaac Waters
- 8 years ago
- Views:
Transcription
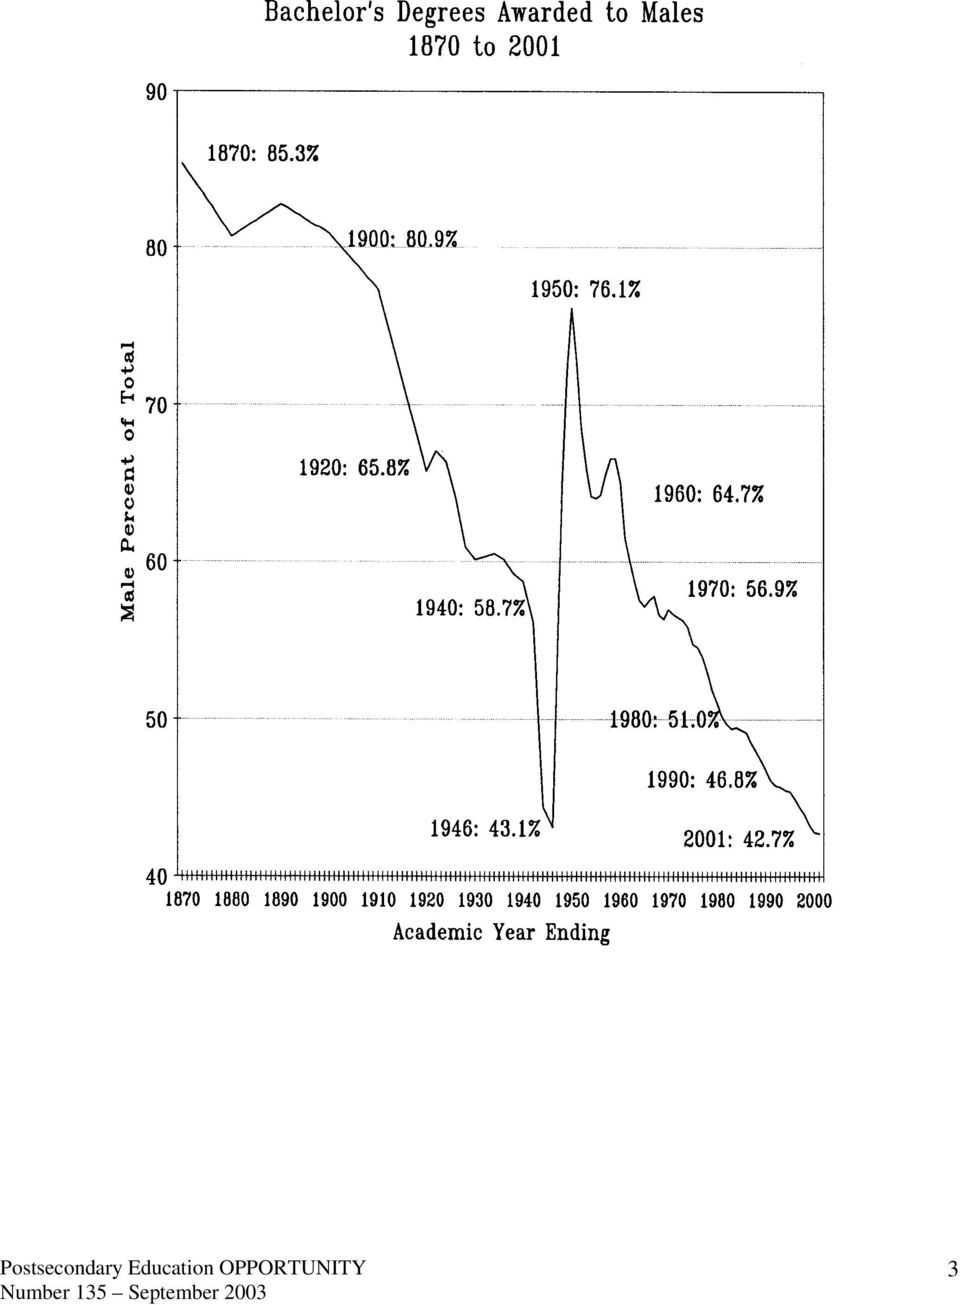
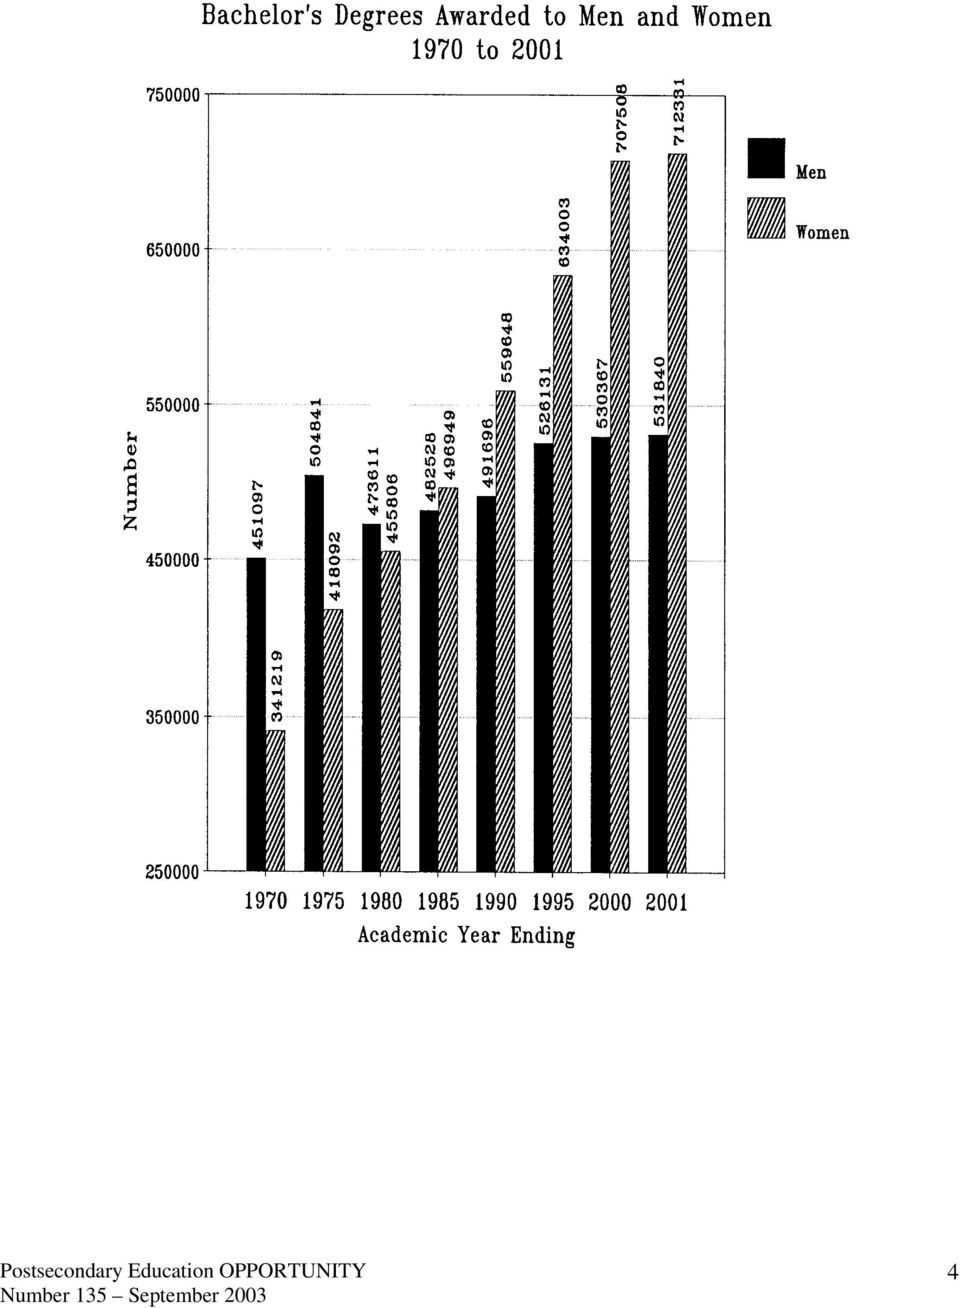
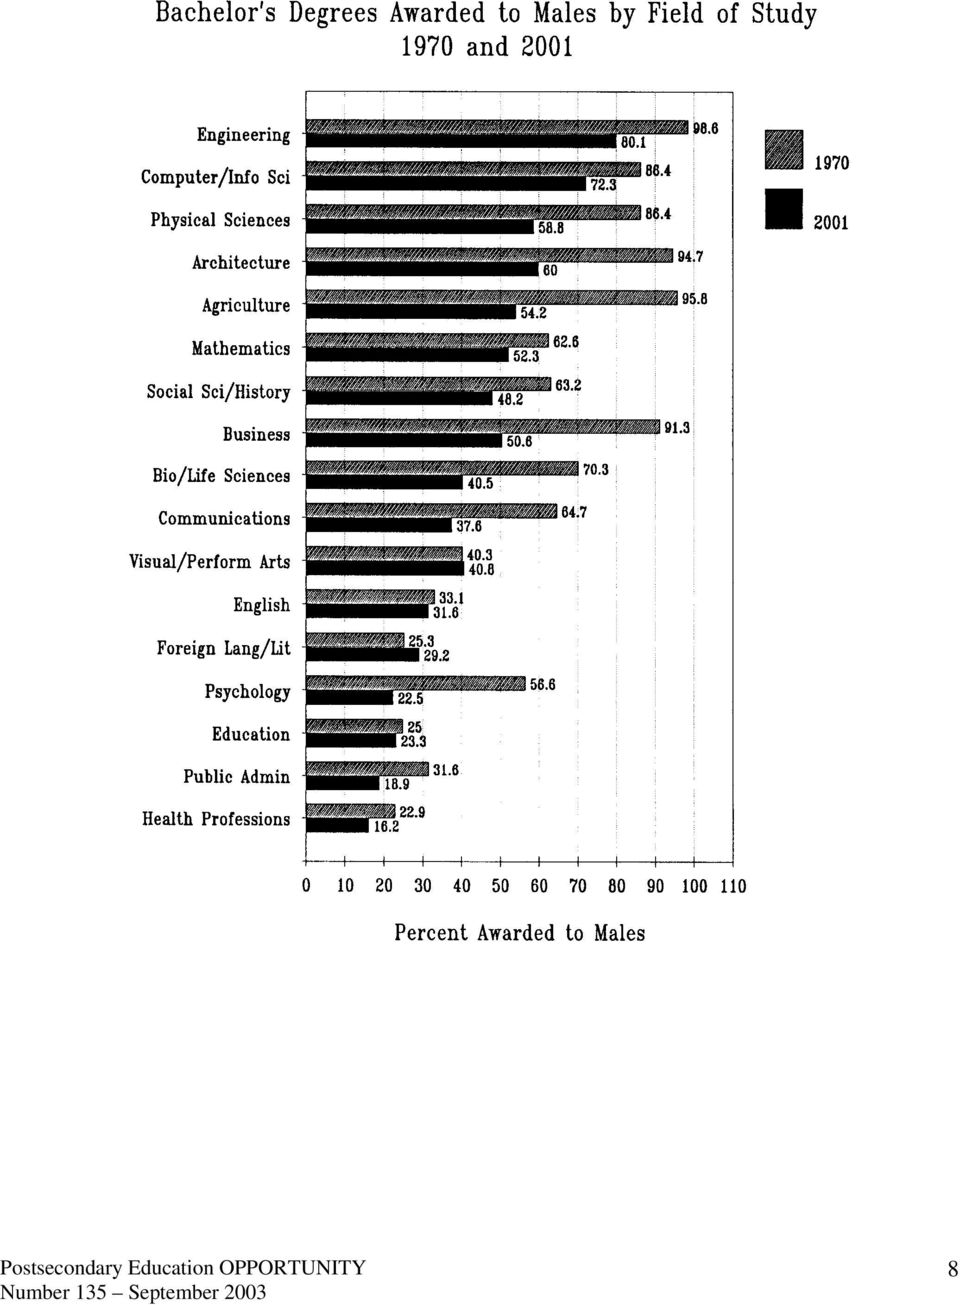
1 Earned Degrees Conferred by Gender 1870 to 2001 The growing gender imbalance in higher education is most apparent at college graduation. Throughout the education pipeline girls and young women are consistently and persistently outperforming boys and young men. While these performance differences appear to be small at each stage in the education pipeline, their cumulative effect is most dramatically on display at college graduation. In there were 531,840 bachelor's degrees awarded to men by American colleges and universities. At the same time women earned 712,331 bachelor's degrees. Men earned 42.7 percent of the total and women earned 57.3 percent. Similar results occurred at the associate's and master's degree levels. Every year 105 male babies are born for every 100 girl babies. This is a demographic constant in the United States. Males remain a majority of the U.S. population up to the mid 20s. After that women make up a larger share of the population. In the traditional undergraduate college years males are roughly 51 percent of the population. Thus when males earn 42.7 percent of the bachelor's degrees from college they are underrepresented by a little more than eight percentage points, and women are over represented by the same amount. The story told by data presented here is one that continues to evolve gradually, year after year, as it has for more than 130 years in the United States. It can and should also be told as a record of the educational progress of girls and women in America. Indeed, it is a story occurring in most of the world: women are advancing well beyond men in education nearly everywhere that the ambitions of women are not culturally suppressed. Because OPPORTUNITY focuses on populations that are underrepresented in higher education, this analysis focuses on males. In a world demanding ever higher levels of education and training, men are falling behind the needs of the labor force as well as the achievements of women. As a direct result men are losing their historic economic, civic and family roles. More males are dropping out of the traditional social roles they have played as workers, breadwinners and voters. Instead males are increasingly in prison, committing suicide, abandoning the children they father, dropping out of the labor force and failing to even vote in elections. Americans tend to believe market forces can correct any imbalance in society. But the plight of males does not appear to be amenable to a market solution. Increasingly we understand that males are wired differently from birth. Thus we should not be surprised that the current educational offerings that serve girls and women so well do not achieve similar success for boys and men. Here we update our previously reported data on earned college degrees by gender with data for This update is based on data recently reported by the National Center for Education Statistics. The report may be downloaded from the NCES Website at: Earned Degrees Conferred For the year American colleges and universities awarded the following degrees to men and women: Level Males Females Total Associate 231, , , % 60.0% Bachelors 531, ,331 1,244, % 57.3% Master 194, , , % 58.5% Postsecondary Education OPPORTUNITY 1

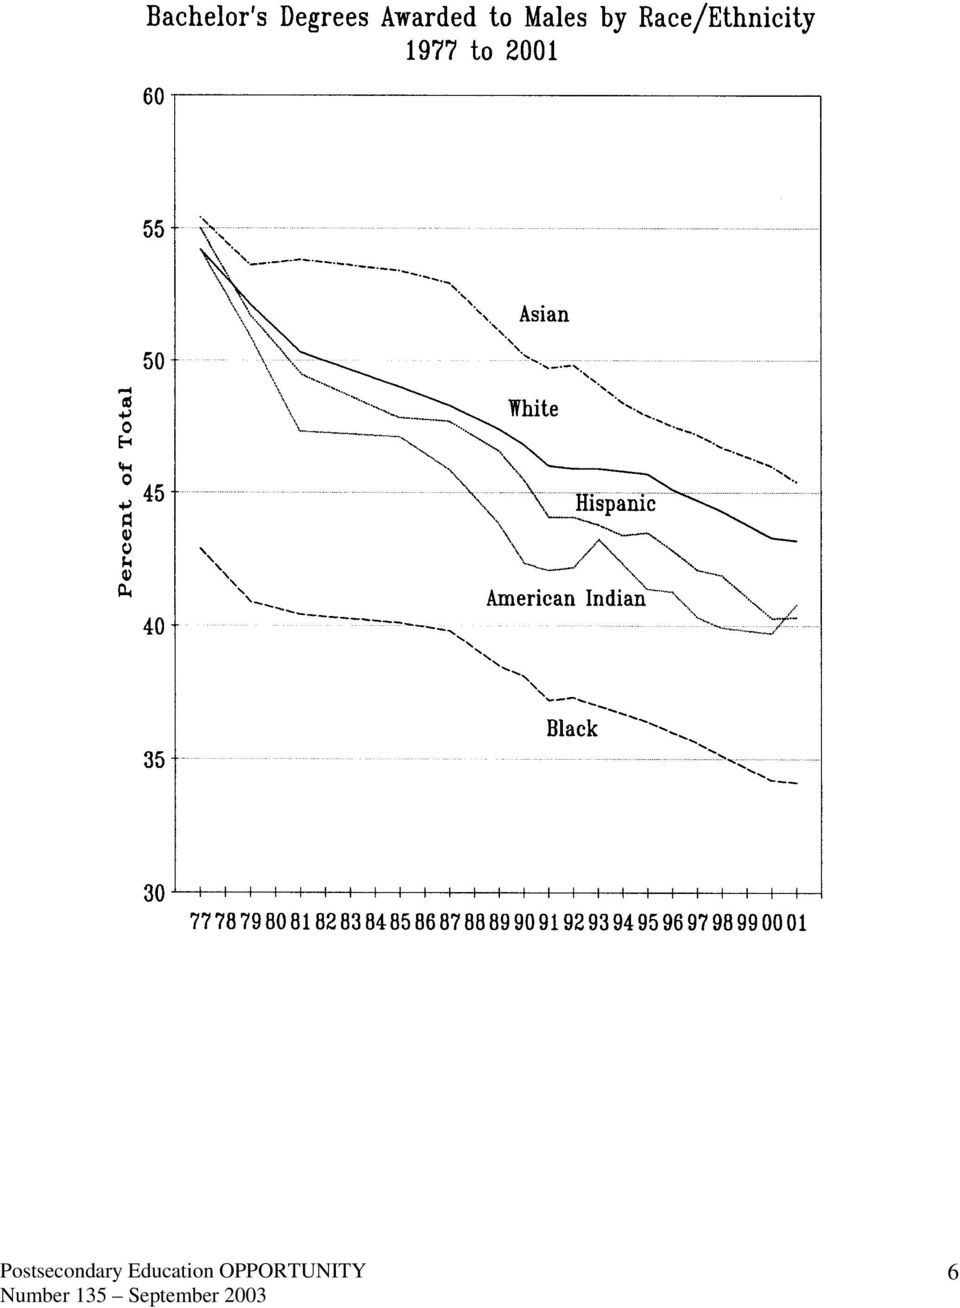
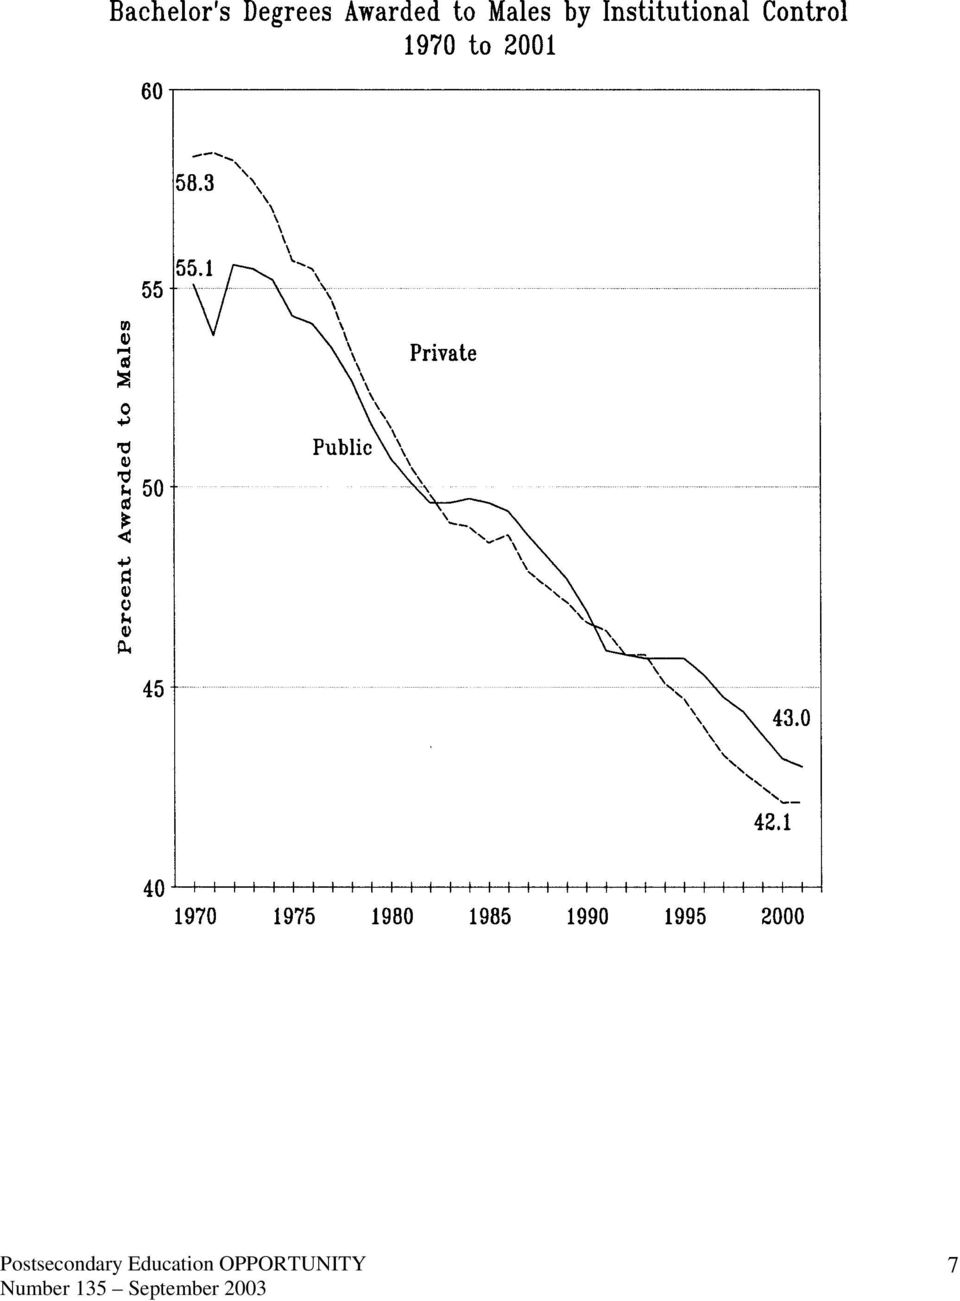
2 Doctors 24,728 20,176 44, % 44.9% First-Prof 42,862 36,845 79, % 46.2% States. The gender distribution of college degrees tends to hold across all states: A majority of associate's degrees were awarded to females in 2001 in every state except Arizona. The share of associate's degrees awarded to men ranged from 31.0 percent in Arkansas to 51.6 percent in Arizona. A majority of the bachelor's degrees were awarded to women in all states in The share of these degrees earned by men ranged from 37.4 percent in Delaware to 48.5 percent in Utah. A majority of the master's degrees were awarded to women in every state except Utah. In 2001 the share of master's degrees awarded to men ranged from 31.0 percent in Maine to 55.4 percent in Utah. A majority of the doctorates were earned by males in 43 states, and a majority by females eight states. The range in the share of doctorates earned by men was from 37.0 percent in Alaska to 69.6 percent in Montana. Race/ethnicity. The general pattern of most bachelor's degrees going to women holds for every racial/ethnic group of the population. However, the pattern varies considerably across groups. For 2001: White non-hispanic. Males earn 40.3 percent of associates degrees, 43.2 percent of bachelors degrees, 38.8 percent of masters degrees, 50.5 percent of doctorates and 55.7 percent of first-professional degrees. Blacks. Males earn 34.6 percent of associate degrees, 34.1 percent of bachelors degrees, 29.8 percent of masters degrees, 38.6 percent of doctorates and 38.9 percent of first-professional degrees. Hispanics. Males earn 40.6 percent of the associate degrees, 40.3 percent of the bachelors degrees, 37.9 percent of the masters degrees, 45.0 percent of the doctorates and 51.9 percent of the first professional degrees. Asian/Pacific Islander. Males earn 43.2 percent of the associate degrees, 45.4 percent of the bachelors degrees, 46.3 percent of the master's degrees, 56.0 percent of the doctorates and 48.8 percent of the first-professional degrees. American Indian/Alaskan Native. Males earn 34.5 percent of the associate degrees, 40.8 percent of the bachelors degrees, 36.6 percent of the masters, 42.4 percent of the doctorates and 51.1 percent of the first-professional degrees. The second chart on the previous page shows the share of bachelor's degrees awarded to men by public and private institutions since The gender shift from male to female has occurred in both sectors, although somewhat more so in private institutions than in the publics. Generally institutions with engineering programs (often public universities) are least affected by the gender issue, and liberal arts colleges (often private) are most affected. As these data show nothing significant has yet happened in the U.S. to alter these trends--nothing at all. Postsecondary Education OPPORTUNITY 2

3 3
4 4
5 5

6 6
7 7
8 8
Undergraduate Degree Completion by Age 25 to 29 for Those Who Enter College 1947 to 2002
 Undergraduate Degree Completion by Age 25 to 29 for Those Who Enter College 1947 to 2002 About half of those who start higher education have completed a bachelor's degree by the ages of 25 to 29 years.
The Changing Gender Balance: An Overview
 Fewer Men on Campus A Puzzle for Liberal Arts Colleges and Universities November 15-16, 1999 Goucher College Baltimore, Maryland Thomas G. Mortenson Senior Scholar Center for the Study of Opportunity in
College Enrollment by Age 1950 to 2000
 College Enrollment by Age 1950 to 2000 Colleges compete with the labor market and other adult endeavors for the time and attention of young people in a hurry to grow up. Gradually, young adults drift away
Youngstown State University Bachelor's Degrees Awarded by Term and Ethnicity
 July 1, 1997 through June 30, 1998 July 1, 1998 through June 30, 1999 Summer Fall Winter Spring Total Summer Fall Winter Spring Total American Indian Men 0 1 0 0 1 0 0 0 0 0 Women 0 0 0 1 1 0 1 0 0 1 Subtotal
Youngstown State University Associate's Degrees Awarded by Term and Ethnicity
 July 1, 1997 through June 30, 1998 July 1, 1998 through June 30, 1999 Summer Fall Winter Spring Total Summer Fall Winter Spring Total American Indian Men 0 0 0 0 0 0 0 0 0 0 Women 0 0 0 1 1 0 0 0 1 1 Subtotal
Text table 4-1 Enrollment, degree attainment, and employment status of academic year 1996/97 and 1997/98 S&E bachelor s degree recipients: April 1999
 Chapter 4 Graduate Enrollment Overview Graduate enrollment in science and engineering 1 rose in after 5 consecutive years of decline. (See appendix table 4-1.) The growth was entirely attributable to increases
12-month Enrollment 2015-16
 Overview screen 12-month Enrollment 2015-16 12-month Enrollment Overview The 12-Month Enrollment component collects unduplicated student enrollment counts and instructional activity data for an entire
12-Month Enrollment - The FTE & Network Marketing
 Overview screen 12-month Enrollment 2015-16 12-month Enrollment Overview The 12-Month Enrollment component collects unduplicated student enrollment counts and instructional activity data for an entire
National Center for Education Statistics
 National Center for Education Statistics IPEDS Data Center National American University-Rapid City UnitID 219204 OPEID 00405700 Address 321 Kansas City Street, Rapid City, SD, 57701-3692 Web Address www.national.edu
Programs in Higher Education. Alyson Reed Director, Linguistic Society of America Roundtable Discussion LSA Annual Meeting, Pittsburgh, Jan 6-9, 2011
 Programs in Higher Education Alyson Reed Director, Linguistic Society of America Roundtable Discussion LSA Annual Meeting, Pittsburgh, Jan 6-9, 2011 The status of Linguistics in Higher Education What do
in Computer Science Data Source IPEDS /NCES and CRA Taulbee
 Trend Analysis for Minorities in Computer Science Data Source IPEDS /NCES and CRA Taulbee June 2012 G1: Underrepresented Ethnicities Associate s Degrees (2000-2009) 7000 6000 5000 4000 3000 2000 1000 0
High School Dropouts in Chicago and Illinois: The Growing Labor Market, Income, Civic, Social and Fiscal Costs of Dropping Out of High School
 High School Dropouts in Chicago and Illinois: The Growing Labor Market, Income, Civic, Social and Fiscal Costs of Dropping Out of High School Prepared by: Andrew Sum Ishwar Khatiwada Joseph McLaughlin
The Price of a Science PhD: Variations in Student Debt Levels Across Disciplines and Race/Ethnicity
 Center for Education & Innovation at American Institutes for Research Broadening Participation in Graduate Education Issue Brief May 2013 Kristina L. Zeiser Rita J. Kirshstein Courtney Tanenbaum The Price
12-month Enrollment 2014-15
 Overview screen 12-month Enrollment 2014-15 12-month Enrollment Overview The 12-Month Enrollment component collects unduplicated student enrollment counts and instructional activity data for an entire
Enrollment Data Undergraduate Programs by Race/ethnicity and Gender (Fall 2008) Summary Data Undergraduate Programs by Race/ethnicity
 Summary Data Undergraduate Programs by Race/ethnicity") Enrollment Data Undergraduate Programs by Race/ethnicity and Gender (Fall 8) Summary Data Undergraduate Programs by Race/ethnicity The following tables and figures depict 8, 7, and 6 enrollment data for
Enrollment Data Undergraduate Programs by Race/ethnicity and Gender (Fall 8) Summary Data Undergraduate Programs by Race/ethnicity The following tables and figures depict 8, 7, and 6 enrollment data for
National Sample Survey of Registered Nurses March 2004. Preliminary Findings
 The Registered Nurse Population: National Sample Survey of Registered Nurses March 2004 Preliminary Findings Preliminary Findings 2004 National Sample Survey of Registered Nurses The (NSSRN) is the Nation
National Center for Education Statistics
 National Center for Education Statistics IPEDS Data Center St Louis College of Pharmacy UnitID 179265 OPEID 00250400 Address 4588 Parkview Pl, Saint Louis, MO, 63110-1088 Web Address www.stlcop.edu General
12-month Enrollment 2013-14
 Overview screen 12-month Enrollment 2013-14 12-month Enrollment Overview The 12-Month Enrollment component collects unduplicated student enrollment counts and instructional activity data for an entire
GRADUATE AND FIRST-PROFESSIONAL STUDENTS
 NATIONAL CENTER FOR EDUCATION STATISTICS GRADUATE AND FIRST-PROFESSIONAL STUDENTS NATIONAL POSTSECONDARY STUDENT AID STUDY 1996 U.S. Department of Education Office of Educational Research and Improvement
Inclusion and Equity Matters: The Role of Community Colleges in Diversifying the STEM Pipeline
 Inclusion and Equity Matters: The Role of Community Colleges in Diversifying the STEM Pipeline Presented at the LSMCE Conference 24 October 2015 Eboni M. Zamani-Gallaher University of Illinois at Urbana-Champaign
Figure 5-1 Master's degrees awarded in S&E and non-s&e fields, by sex: 1990 98
 Chapter 5 Graduate Degrees Trends for women and minorities in attainment of master s and doctoral degrees are similar to those for their bachelor s degree attainment and their graduate enrollment: both
Interstate Migration Patterns of Recent Recipients of Bachelor s and Master s Degrees in Science and Engineering
 Interstate Migration Patterns of Recent Recipients of Bachelor s and Master s Degrees in Science and Engineering Special Report Basmat Parsad and Lucinda Gray, Authors John Tsapogas, Project Officer Division
New Mexico State Profile
 As America Becomes More Diverse: The Impact of State Higher Education Inequality State Profile Questions You Should Ask How educated is s adult population and workforce? How does compare to the national
Estimates of New HIV Infections in the United States
 Estimates of New HIV Infections in the United States Accurately tracking the HIV epidemic is essential to the nation s HIV prevention efforts. Yet monitoring trends in new HIV infections has historically
12-month Enrollment 2013-14
 Overview screen 12-month Enrollment 2013-14 12-month Enrollment Overview The 12-Month Enrollment component collects unduplicated student enrollment counts and instructional activity data for an entire
College of Medicine Enrollment MD and MD/MPH Fall 2002 to Fall 2006
 1 1 College of Medicine Enrollment MD and MD/MPH 8 6 4 2 College of Medicine MD and MD/MPH New students 184 18 172 185 184 Continuing students 592 595 67 585 589 Total 775 775 779 77 773 Change from previous
Marriage and divorce: patterns by gender, race, and educational attainment
 ARTICLE OCTOBER 2013 Marriage and divorce: patterns by gender, race, and educational attainment Using data from the National Longitudinal Survey of Youth 1979 (NLSY79), this article examines s and divorces
Trends in Degree Demographics in Fields Relevant to NCAR Presented by: Rajul Pandya May 2009 NCAR Diversity Committee Presentation
 Trends in Degree Demographics in Fields Relevant to NCAR Presented by: Rajul Pandya May 29 NCAR Diversity Committee Presentation All data (unless otherwise noted) is from the The Integrated Postsecondary
How to Report Student Enrollment Over a 12-Month Period
 Overview screen 12-month Enrollment 2014-15 12-month Enrollment Overview The 12-Month Enrollment component collects unduplicated student enrollment counts and instructional activity data for an entire
Characteristics of College Students Who Graduate with No Debt
 Student Aid Policy Analysis Characteristics of College Students Who Graduate EXECUTIVE SUMMARY Mark Kantrowitz Publisher of Fastweb.com and FinAid.org August 24, 2011 About two fifths of undergraduate
Colorado State Profile
 As America Becomes More Diverse: The Impact of State Higher Education Inequality State Profile Questions You Should Ask How educated is s adult population and workforce? How does compare to the national
Educational Attainment of Veterans: 2000 to 2009
 Educational Attainment of Veterans: to 9 January 11 NCVAS National Center for Veterans Analysis and Statistics Data Source and Methods Data for this analysis come from years of the Current Population Survey
Awareness of New Jersey s Family Leave Insurance Program Is Low, Even As Public Support Remains High and Need Persists
 NEW JERSEY S FAMILY LEAVE INSURANCE PROGRAM A CENTER FOR WOMEN AND WORK ISSUE BRIEF OCTOBER 2012 Awareness of New Jersey s Family Leave Insurance Program Is Low, Even As Public Support Remains High and
12-month Enrollment 2015-16
 12-month Enrollment 2015-16 Institution: Southwestern Oregon Community College (210155) Overview screen 12-month Enrollment Overview The 12-Month Enrollment component collects unduplicated student enrollment
Associate Degree in Nursing Program Application for Admission. DEADLINE FOR FALL 2016 SEMESTER: April 1, 2016 BY 11:00 AM
 DEADLINE FOR FALL 2016 SEMESTER: April 1, 2016 BY 11:00 AM INSTRUCTIONS FOR NEW APPLICANTS Deadline April 1 by 11:00 AM 1. Complete the application. Download the application from www.goodwin.edu/majors/nursing/default.asp
12-month Enrollment 2015-16
 Overview screen 12-month Enrollment 2015-16 12-month Enrollment Overview The 12-Month Enrollment component collects unduplicated student enrollment counts and instructional activity data for an entire
Associate Degree in Nursing Program Application for Admission DEADLINE FOR SUMMER 2016 SEMESTER: DECEMBER 4, 2015 BY 11:00 AM
 DEADLINE FOR SUMMER 2016 SEMESTER: DECEMBER 4, 2015 BY 11:00 AM INSTRUCTIONS FOR NEW APPLICANTS 1. Complete the application. Download the application from www.goodwin.edu/majors/nursing/default.asp Use
Education Working Paper Archive
 Education Working Paper Archive Gender Gaps in College and High School Graduation by Race, Combining Public and Private Schools November 16, 2006 Duncan Chaplin The Urban Institute/Mathematica Policy Research
Michigan Department of Community Health
 Michigan Department of Community Health INTRODUCTION The Michigan Department of Community Health asked Public Sector Consultants Inc. (PSC) to conduct a survey of licensed pharmacists in 2005 to gather
12-month Enrollment 2015-16
 12-month Enrollment 2015-16 Institution: Florida Agricultural and Mechanical University (133650) Overview screen 12-month Enrollment Overview The 12-Month Enrollment component collects unduplicated student
UWEP Utah Women and Education Project
 Research and Policy Brief UWEP Utah Women and Education Project May 25, 2010 UWEP 2010-204 Women and Higher Education in Utah: A Glimpse at the Past and Present According to Lumina Foundation researchers,
School to College. Alaska DIPLOMAS COUNT. Can State P-16 Councils Ease the Transition? 2008 With Support from the Bill & Melinda Gates Foundation
 Alaska School to College Can State P-16 Councils Ease the Transition? A Special Supplement to Education Week s DIPLOMAS COUNT 2008 With Support from the Bill & Melinda Gates Foundation About Diplomas Count
New York State Profile
 As America Becomes More Diverse: The Impact of State Higher Education Inequality State Profile Questions You Should Ask How educated is s adult population and workforce? How does compare to the national
A m e r i c A n S o c i o l o g i c A l A S S o c i At i o n
 A m e r i c A n S o c i o l o g i c A l A S S o c i At i o n Paying Attention to the Master s Degree in Sociology Roberta Spalter-Roth and Nicole Van Vooren Department of Research and Development 1 An
Figure 1.1 Percentage of persons without health insurance coverage: all ages, United States, 1997-2001
 Figure 1.1 Percentage of persons without health insurance coverage: all ages, United States, 1997-2001 DATA SOURCE: Family Core component of the 1997-2001 National Health Interview Surveys. The estimate
Baccalaureate Program: Applications and Enrollment
 Baccalaureate Program: Applications and Enrollment Please report the number of applications, accepted applicants, and enrolled students as of November 1, 2012 (or as of the date in the fall term when your
Portraits A PORTRAIT OF LOW-INCOME YOUNG ADULTS IN EDUCATION JUNE 2010
 Portraits WHAT IS THE PORTRAITS SERIES? With the support from the Bill & Melinda Gates Foundation, the INSTITUTE FOR HIGHER EDUCATION POLICY plans to regularly release short research briefs that describe
bachelor s degree-granting institutions were located.
 WEB Profile of 2007 08 2007-08 First-Time Bachelor s TABLES Degree Recipients U.S. DEPARTMENT OF EDUCATION in 2009 OCTOBER 2012 NCES 2013-150 These Web Tables provide wideranging information on the demographic
trends in the profiles of graduate and first-professional students from 1995 96 to 2007 08. These tables group students by their graduate degree
 WEB TABLES U.S. DEPARTMENT OF EDUCATION OCTOBER 2010 NCES 2011-219 Profile of Graduate and First-Professional Students: Trends from Selected Years, 1995 96 to 2007 08 Enrollment in graduate and firstprofessional
Rhode Island State Profile
 As America Becomes More Diverse: The Impact of State Higher Education Inequality State Profile Questions You Should Ask How educated is s adult population and workforce? How does compare to the national
CLACLS. Marriage Patterns among Latinos in New York City, 1990-2010. Amanda Mía Marín-Chollom. Justine Calcagno
 CLACLS Center for Latin American, Caribbean & Latino Studies Marriage Patterns among Latinos in New York City, 1990-2010 Center for Latin American, Caribbean & Latino Studies Graduate Center City University
A Review on Postsecondary Education and Low-Income Young Adults
 Portraits WHAT IS THE PORTRAITS SERIES? With the support from the Bill & Melinda Gates Foundation, the INSTITUTE FOR HIGHER EDUCATION POLICY plans to regularly release short research briefs that describe
Total Enrollment Fall 2007 to Fall 2011
 STATISTICAL PORTRAIT FALL 211 Total Enrollment 1 College or School 1 8 7 8 9 21 211 Medicine Masters of Public Health Graduate Studies Health Related Professions Nursing School Medicine 776 762 772 791
WEB TABLES. Characteristics of Associate s Degree Attainers and Time to Associate s Degree U.S. DEPARTMENT OF EDUCATION MARCH 2012 NCES 2012-271
 WEB TABLES U.S. DEPARTMENT OF EDUCATION MARCH 2012 NCES 2012-271 Characteristics of Associate s Degree Attainers and Time to Associate s Degree The number of associate s degrees conferred by U.S. postsecondary
Categories of Data. Communication & Journalism as a Broad Field
 Graduate Enrollment and Degrees in Communication/Journalism: Benchmarking Data from the Council of Graduate Schools/Graduate Record Examinations Survey Since 1986, the Council of Graduate Schools (CGS)
Massachusetts State Profile
 As America Becomes More Diverse: The Impact of State Higher Education Inequality State Profile Questions You Should Ask How educated is adult population and workforce? How does compare to the national
Educational Attainment in the United States: 2003
 Educational Attainment in the United States: 2003 Population Characteristics Issued June 2004 P20-550 The population in the United States is becoming more educated, but significant differences in educational
12-month Enrollment 2011-12. Institution: State Fair Community College (179539) Overview screen
 Overview screen") Print Form(s) Get PDF File Go Back 12-month Enrollment 2011-12 Institution: State Fair Community College (179539) Overview screen 12-month Enrollment Overview The 12-Month Enrollment component collects
Print Form(s) Get PDF File Go Back 12-month Enrollment 2011-12 Institution: State Fair Community College (179539) Overview screen 12-month Enrollment Overview The 12-Month Enrollment component collects
Minorities in Higher Education. 2010 2011 Supplement. Young M. Kim
 Minorities in Higher Education 2010 Twenty-FOURTH Status Report 2011 Supplement Young M. Kim Minorities in Higher Education 2010 Twenty-FOURTH Status Report 2011 Supplement Young M. Kim PROJECT COORDINATOR:
PIMA COUNTY EQUAL EMPLOYMENT OPPORTUNITY PLAN SHORT FORM
 PIMA COUNTY EQUAL EMPLOYMENT OPPORTUNITY PLAN SHORT FORM STEP 1: Grant Title: Address: Contact: Introductory Statement Various Federal Grants Pima County Government County Administration 130 W. Congress,
Institution: University of Connecticut (129020) Part C Selection
 Part C Selection") Fall Enrollment 2013-14 Overview Fall Enrollment Overview The Fall Enrollment component collects student enrollment counts by level of student, enrollment status, gender and race/ethnicity. In addition,
Fall Enrollment 2013-14 Overview Fall Enrollment Overview The Fall Enrollment component collects student enrollment counts by level of student, enrollment status, gender and race/ethnicity. In addition,
Public Health Workforce Interests and Needs Survey Presentation at Keeneland, 2015
 Public Health Workforce Interests and Needs Survey Presentation at Keeneland, 2015 Katie Sellers, DrPH CPH ASTHO JP Leider, PhD de Beaumont Foundation Kiran Bharthapudi, PhD ASTHO Rivka Liss Levinson,
Some College, No Degree
 Some College, No Degree A look at those who left college early December 2015 Lexi Shankster Contents Introduction... 3 Summary of Findings:... 3 How much College without a?... 4 Race and Ethnicity... 4
A New Measure of Educational Success in Texas. Tracking the Success of 8th Graders into and through College
 A New Measure of Educational Success in Texas Tracking the Success of 8th Graders into and through College National Center for Management Systems (NCHEMS) Contents Introduction 1 The Challenge 2 Purpose
NCES 2011-034 U.S. DEPARTMENT OF EDUCATION
 NCES 2011-034 U.S. DEPARTMENT OF EDUCATION The Condition of Education 2011 in Brief MAY 2011 Editors Susan Aud National Center for Education Statistics Gretchen Hannes American Institutes for Research
APPENDIX A. Tables. Appendix A Tables 119
 118 The Condition of Education 2012 APPENDIX A Tables Appendix A Tables 119 Indicator 1 Enrollment Trends by Age Table A-1-1. Percentage of the population ages 3 34 enrolled in school, by age group: October
Stats. in Brief. Changes in Postsecondary Awards Below the Bachelor s Degree: 1997 to 2007. Introduction
 Stats U.S. Departt of Education NCES -167 November 09 in Brief AUTHORS Laura Horn Xiaojie Li MPR Associates, Inc. Thomas Weko Project Officer National Center for Education Statistics CONTENTS Introduction...
The Outcomes For CTE Students in Wisconsin
 Promoting Rigorous Career and Technical Education Programs of Study Quantitative Outcomes Study: Baseline Data Collection Report Prepared under contract to Division of Academic and Technical Education
Women s Participation in Education and the Workforce. Council of Economic Advisers
 Women s Participation in Education and the Workforce Council of Economic Advisers Updated October 14, 214 Executive Summary Over the past forty years, women have made substantial gains in the workforce
Graduation Rates 2009-10
 Page 1 of 19 Graduation Rates 29-1 User ID: 29C11 Screening questions Does your institution use a website to disclose Student-Right-to-Know student athlete graduation rates? nmlkji nmlkj No. Yes. Please
2. List at least three (3) of the most important things you learned during your time in the program
 of the most important things you learned during your time in the program") Section 1. NIU s Sport Management MS Student Exit Interview -- Student Questions Please answer the following questions offered below regarding your experiences within the program. 1. General Reflections
Section 1. NIU s Sport Management MS Student Exit Interview -- Student Questions Please answer the following questions offered below regarding your experiences within the program. 1. General Reflections
College Enrollment, Persistence, and Graduation: Statewide Results
 College Enrollment, Persistence, and Graduation: Statewide Results 72 Percent of Public High School Graduates Enroll in College 46 Percent Graduate in Six Years Summary Among students in the public high
New Jersey State Legislature: A Demographic Profile
 New Jersey State Legislature: A Demographic Profile September 2015 John Froonjian, Senior Research Associate Daniel Rockefeller, Graduate Assistant William J. Hughes Center for Public Policy Stockton University
PURDUE UNIVERSITY - West Lafayette Campus
 Associate Awards School of Veterinary Medicine Associate in Applied Science 23 23 23 23 Total 23 23 23 23 Awards: Students fullfilling multiple Associate award requirement from different programs will
The Path Through Graduate School: A Longitudinal Examination 10 Years After Bachelor s Degree
 U.S. Department of Education NCES 2007-162 The Path Through Graduate School: A Longitudinal Examination 10 Years After Bachelor s Degree Postsecondary Education Descriptive Analysis Report THIS PAGE INTENTIONALLY
NATIONAL CENTER FOR EDUCATION STATISTICS. Statistical Analysis Report February 2001. Postsecondary Education Descriptive Analysis Reports
 NATIONAL CENTER FOR EDUCATION STATISTICS Statistical Analysis Report February 2001 Postsecondary Education Descriptive Analysis Reports From Bachelor s Degree to Work Major Field of Study and Employment
Survey of Advanced Practice Nurses 2010
 Survey of Advanced Practice s 2010 INTRODUCTION AND METHODOLOGY In 2010, the Michigan Center for Nursing and Office of the Chief Executive asked Public Sector Consultants Inc. to conduct a survey of advanced
Table 5.1 Degrees Conferred by School/College and Campus Fall 2011 - Spring 2012
 Table 5.1 Degrees Conferred by School/College and Campus Schools / Colleges Associates Bachelors Masters All Degrees UVI (ALL) School of Business 21 101 8 130 School of Education 9 30 23 62 College of
INFOBRIEF SRS. Science and engineering (S&E) doctorates awarded ACADEMIC INSTITUTIONS OF MINORITY FACULTY WITH S&E DOCTORATES
 doctorates awarded ACADEMIC INSTITUTIONS OF MINORITY FACULTY WITH S&E DOCTORATES") INFOBRIEF SRS Science Resources Statistics National Science Foundation NSF 06-318 Directorate for Social, Behavioral, and Economic Sciences June 2006 ACADEMIC INSTITUTIONS OF MINORITY FACULTY WITH S&E
INFOBRIEF SRS Science Resources Statistics National Science Foundation NSF 06-318 Directorate for Social, Behavioral, and Economic Sciences June 2006 ACADEMIC INSTITUTIONS OF MINORITY FACULTY WITH S&E
LICENSED SOCIAL WORKERS IN THE UNITED STATES, 2004 SUPPLEMENT. Chapter 2 of 5. Who Are Licensed Social Workers?
 LICENSED SOCIAL WORKERS IN THE UNITED STATES, 2004 SUPPLEMENT Chapter 2 of 5 Who Are Licensed Social Workers? Prepared by Center for Health Workforce Studies School of Public Health, University at Albany
NCHEMS. The Lumina Foundation for Education. As America Becomes More Diverse: The Impact of State Higher Education Inequality
 NCHEMS As America Becomes More Diverse: The Impact of State Higher Education Inequality Patrick J. Kelly National Center for Higher Education Management Systems (NCHEMS) With Support from The Lumina Foundation
Demographic and Background Characteristics
 Demographic and Background Characteristics This subsection summarizes background characteristics of respondents. Knowledge Networks has previously compiled a great deal of information on the demographic
LICENSED SOCIAL WORKERS IN THE UNITED STATES, 2004. Chapter 2 of 4. Demographics
 LICENSED SOCIAL WORKERS IN THE UNITED STATES, 2004 Chapter 2 of 4 Demographics Prepared by Center for Health Workforce Studies School of Public Health, University at Albany Rensselaer, NY and NASW Center
Women, Minorities, and Persons with Disabilities in Science and Engineering: 2013
 Women, Minorities, and Persons with Disabilities in Science and Engineering: 213 National Center for Science and Engineering Statistics Directorate for Social, Behavioral and Economic Sciences National

100 BLACK MEN OF AMERICA
 2014 100 BLACK MEN OF AMERICA LOUISVILLE CHAPTER SCHOLARSHIP APPLICATION 2014 100 BLACK MEN OF AMERICA LOUISVILLE CHAPTER FORM CREATED BY INSPIRE RESEARCH AND CONSULTING, LLC. ELIGIBILITY REQUIREMENTS:
HHSC is accepting applications for representatives to serve on the Texas Nonprofit Council.
 HHSC is accepting applications for representatives to serve on the Texas Nonprofit Council. Background The Texas Nonprofit Council was established by S.B 993 during the 83 rd Legislation Session in 2013.
! Of students graduating from Colorado high schools in 2000, 21.8 percent had Hispanic, Asian, Black or Native American parentage (Table 1).
.") January 11, 2002 Page 1 of 19 TOPIC: STATEWIDE DIVERSITY REPORT PREPARED BY: MICHELLE DERBENWICK I. SUMMARY Under CCHE s Diversity Policy, the Commission annually monitors the state s progress toward access
January 11, 2002 Page 1 of 19 TOPIC: STATEWIDE DIVERSITY REPORT PREPARED BY: MICHELLE DERBENWICK I. SUMMARY Under CCHE s Diversity Policy, the Commission annually monitors the state s progress toward access
MEDICAL ASSISTANT APPLICATION
 PERSONAL INFORMATION Merritt College For Spring 2015 Cohort MEDICAL ASSISTANT APPLICATION Last Name: First Name: MI: Address: City, State, Zip Primary Phone: Additional Phone: Email: Gender: q Female q
How Low Income Undergraduates Financed Postsecondary Education: 1992-93
 NATIONAL CENTER FOR EDUCATION STATISTICS Statistical Analysis Report April 1996 Postsecondary Education Descriptive Analysis Reports How Low Income Undergraduates Financed Postsecondary Education: 1992-93
Educational Attainment in Hawaii
 Statistics Brief, January 2016 Research and Economic Analysis Division State Department of Business, Economic Development and Tourism Educational Attainment in Overview This brief presents an overview
During the past century,
 Academic preparation is still a core function of community colleges. But today their mission is more comprehensive, thanks to a gradual shift toward vocational education, job training, and programs catering
How To Increase Interest In Science And Technology
 Creating a Pipeline: An Analysis of Pre-College Factors of Students in STEM Erica Harwell and Derek A. Houston University of Illinois at Urbana-Champaign ABSTRACT This study seeks to understand the pre-college
Parental Educational Attainment and Higher Educational Opportunity
 Parental Educational Attainment and Higher Educational Opportunity Federal higher education policy recognizes certain student characteristics as limiting higher educational opportunity, and has created
FACTBOOK. The Condition. Excelencia in Education www.edexcelencia.org
 FACTBOOK The Condition Education2015 of Latinos in Excelencia in Education www.edexcelencia.org 1 THE CONDITION OF LATINOS IN EDUCATION: 2015 FACTBOOK JANUARY 2015 COMPILED BY: Deborah A. Santiago, COO
The Rise of College Student Borrowing
 1 The Rise of College Student Borrowing FOR RELEASE: NOVEMBER 23, 2010 Paul Taylor, Project Director Richard Fry, Senior Researcher Rebecca Hinze-Pifer, Intern Daniel Dockterman, Research Assistant MEDIA
Changes in Self-Employment: 2010 to 2011
 Changes in Self-Employment: 2010 to 2011 American Community Survey Briefs By China Layne Issued January 2013 ACSBR/11-21 INTRODUCTION From December 2007 to June 2009, the United States experienced an economic
ZERO ROBOTICS APPLICATION
 ZERO ROBOTICS APPLICATION 2016 MIDDLE SCHOOL SUMMER PROGRAM Application Instructions To apply, please complete the following application (online version also available). Narrative responses should be no
Life After College: A Descriptive Summary of 1992 93 Bachelor s Degree Recipients in 1997
 NATIONAL CENTER FOR EDUCATION STATISTICS Statistical Analysis Report July 1999 Baccalaureate and Beyond Longitudinal Study Life After College: A Descriptive Summary of 1992 93 Bachelor s Degree Recipients
School of Health and Human Sciences Department of Nursing Bachelor of Science in Nursing Program. RN to BSN Application
 School of Health and Human Sciences Department of Nursing Bachelor of Science in Nursing Program RN to BSN Application Dev F10; Rev F11, F12 PROGRESSION AND GRADUATION RNBS Program Progression 1. A grade