What is R? R s Advantages R s Disadvantages Installing and Maintaining R Ways of Running R An Example Program Where to Learn More
|
|
|
- Derick Turner
- 8 years ago
- Views:
Transcription
1 Bob Muenchen, Author R for SAS and SPSS Users, Co-Author R for Stata Users muenchen.bob@gmail.com, What is R? R s Advantages R s Disadvantages Installing and Maintaining R Ways of Running R An Example Program Where to Learn More Copyright 2010, 2011, Robert A Muenchen. All rights reserved. 2 The most powerful statistical computing language on the planet. -Norman Nie, Developer of SPSS Language + package + environment for graphics and data analysis Free and open source Created by Ross Ihaka & Robert Gentleman 1996 & extended by many more An implementation of the S language by John Chambers and others R has 4,950 add-ons, or nearly 100,000 procs 3 4

2 5 6 Source: r4stats.com/popularity 1. Data input & management (data step) 2. Analytics & graphics procedures (proc step) 3. Macro language 4. Matrix language 5. Output management systems (ODS/OMS) * SAS Approach; DATA A; SET A; logx = log(x); PROC REG; MODEL Y = logx; R integrates these all seamlessly. # R Approach lm( Y ~ log(x) ) 7 8
 * SAS Approach; DATA A; SET A; logx = log(x); PROC REG;")
3 Vast selection of analytics & graphics New methods are available sooner Many packages can run R (SAS, SPSS, Excel ) Its object orientation does the right thing Its language is powerful & fully integrated Procedures you write are on an equal footing It is the universal language of data analysis It runs on any computer Being open source, you can study and modify it It is free 9 10 * Using SAS; PROC TTEST DATA=classroom; CLASS gender; VAR score; # In R t.test(score ~ gender, data=classroom) t.test(posttest, pretest, paired=true, data=classroom) Language is somewhat harder to learn Help files are sparse & complex Must find R and its add-ons yourself Graphical user interfaces not as polished Most R functions hold data in main memory Rule-of-thumb: 10 million values per gigabyte SAS/SPSS: billions of records Several efforts underway to break R s memory limit including Revolution Analytics distribution 11 12
 Language is somewhat harder to learn Help files are sparse & complex Must find R and its add-ons yourself Graphical user interfaces not as")
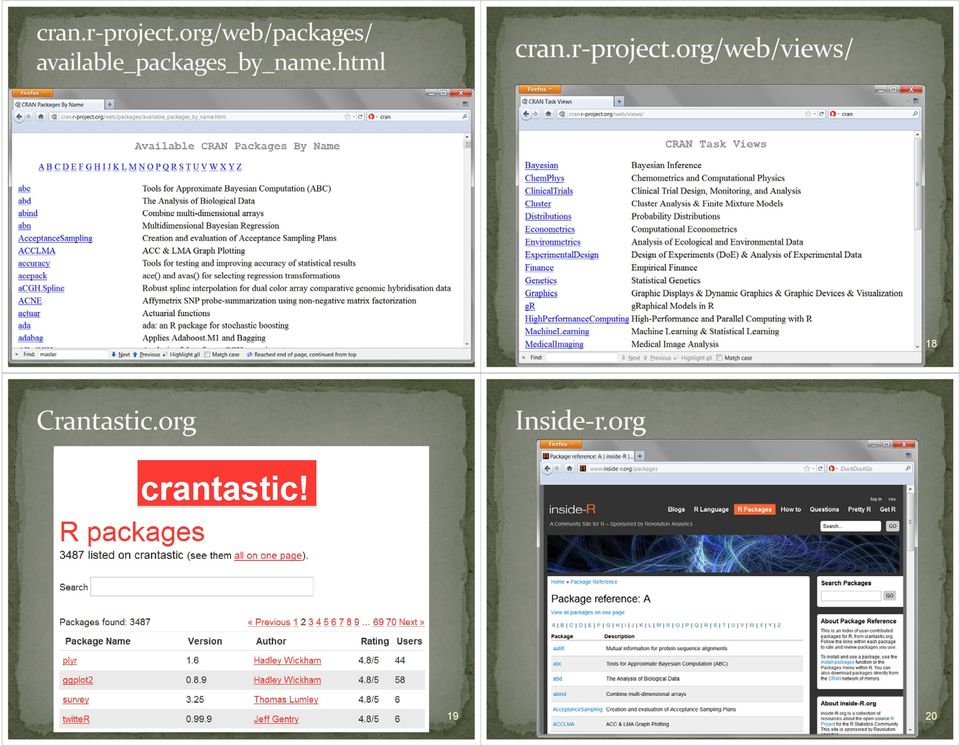
4 Base R plus Recommended Packages like: Base SAS, SAS/STAT, SAS/GRAPH, SAS/IML Studio SPSS Stat. Base, SPSS Stat. Advanced, Regression Tested via extensive validation programs But add-on packages written by Professor who invented the method? A student interpreting the method? support is free, quick, 24-hours: Stackoverflow.com Quora.com Crossvalidated stats.stackexchange.com /questions/tagged/r Phone support available commercially Go to cran.r-project.org, the Comprehensive RArchive Network 2. Download binaries for Base & run 3. Add-ons: install.packages( mypackage ) 4. To update: update.packages() Comprehensive R Archive Network Crantastic.com Inside-R.org R4Stats.com 15 16

5
6 Run code interactively Submit code from Excel, SAS, SPSS, Point-n-click using Graphical User Interfaces (GUIs) Batch mode
 Batch mode")
7 25 Copyright 2010, 2011, Robert A Muenchen. All rights reserved. 26 run ExportDataSetToR("mydata"); submit/r; mydata$workshop <- factor(mydata$workshop) summary(mydata) endsubmit; GET FILE= mydata.sav. BEGIN PROGRAM R. mydata <- spssdata.getdatafromspss( variables = c("workshop gender q1 to q4"), missingvaluetona = TRUE, row.label = "id" ) summary(mydata) END PROGRAM
, missingvaluetona = TRUE, row.")
8

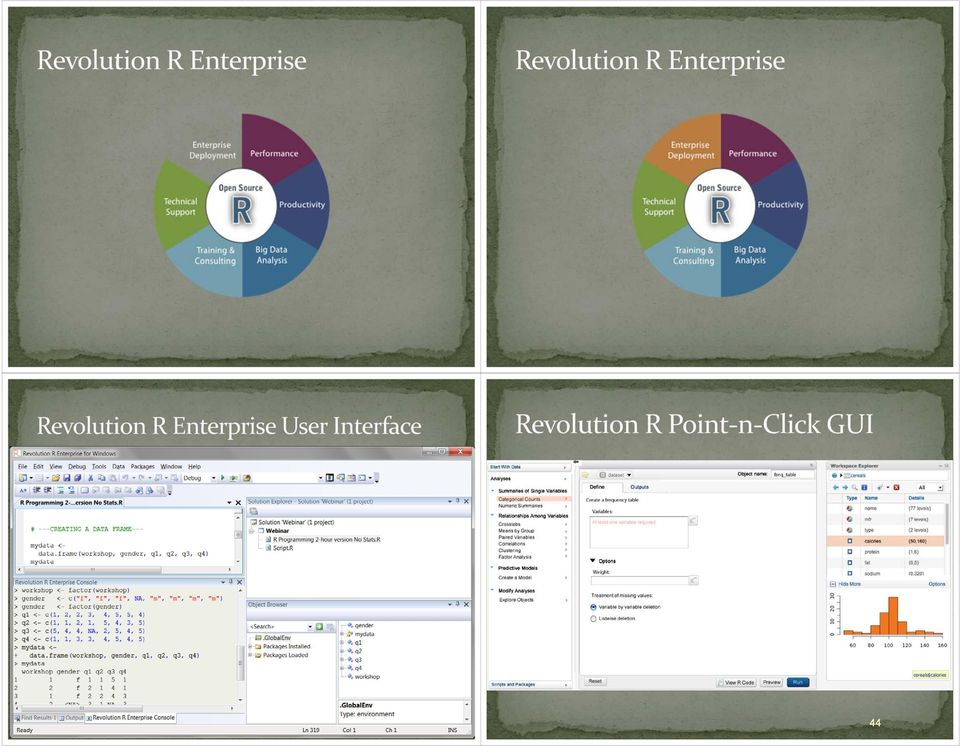
9 33 34 A company focused on R development & support Run by SPSS founder Norman Nie Their enhanced distribution of R: Revolution R Enterprise Free for colleges and universities, including for outside consulting 35

10

11 43 44
12 mydata <- read.csv("mydata.csv") print(mydata) mydata$workshop <- factor(mydata$workshop) summary(mydata) plot( mydata$q1, mydata$q4 ) mymodel <- lm( q4~q1+q2+q3, data=mydata ) summary( mymodel ) anova( mymodel ) plot( mymodel ) > mydata <- read.csv("mydata.csv") > print(mydata) workshop gender q1 q2 q3 q4 1 1 f f f <NA> 3 1 NA m m m m > mydata$workshop <-factor(mydata$workshop) > summary(mydata) workshop gender 1:4 f :3 2:4 m :4 NA's:1 q1 q2 q3 q4 Min. :1.00 Min. :1.00 Min. :2.000 Min. :1.00 1st Qu.:2.00 1st Qu.:1.00 1st Qu.: st Qu.:2.50 Median :3.50 Median :2.50 Median :4.000 Median :3.50 Mean :3.25 Mean :2.75 Mean :4.143 Mean :3.25 3rd Qu.:4.25 3rd Qu.:4.25 3rd Qu.: rd Qu.:4.25 Max. :5.00 Max. :5.00 Max. :5.000 Max. :5.00 NA's :
 > summary(mydata) workshop gender 1:4 f :3 2:4 m :4 NA's:1 q1 q2 q3 q4 Min. :1.00 Min. :1.00 Min. :2.000 Min. :1.00 1st Qu.:2.00 1st Qu.:1.00 1st Qu.:4.000 1st Qu.:2.50 Median :3.")
13 > mymodel <- lm(q4 ~ q1+q2+q3, data=mydata) > summary(mymodel) Call: lm(formula = q4 ~ q1 + q2 + q3, data = mydata) Residuals: Coefficients: Estimate Std. Error t value Pr(> t ) (Intercept) q q q Multiple R-squared: , Adjusted R-squared: F-statistic: on 3 and 3 DF, p-value: Copyright 2010, 2011, Robert A Muenchen. All rights reserved

14 R for SAS and SPSS Users, Muenchen R for Stata Users, Muenchen & Hilbe R Through Excel: A Spreadsheet Interface for Statistics, Data Analysis, and Graphics, Heiberger & Neuwirth Data Mining with Rattle and R: The Art of Excavating Data for Knowledge Discovery, Williams R is powerful, extensible, free Download it from CRAN Academics download Revolution R Enterprise for free at You run it many ways & from many packages Several graphical user interfaces are available R's programming language is the way to access its full power muenchen@utk.edu Slides: r4stats.com/misc/webinar Presentation: bit.ly/r-sas-spss 55

Multiple Linear Regression
 Multiple Linear Regression A regression with two or more explanatory variables is called a multiple regression. Rather than modeling the mean response as a straight line, as in simple regression, it is
R: A Free Software Project in Statistical Computing
 R: A Free Software Project in Statistical Computing Achim Zeileis http://statmath.wu-wien.ac.at/ zeileis/ Achim.Zeileis@R-project.org Overview A short introduction to some letters of interest R, S, Z Statistics
Financial Risk Models in R: Factor Models for Asset Returns. Workshop Overview
 Financial Risk Models in R: Factor Models for Asset Returns and Interest Rate Models Scottish Financial Risk Academy, March 15, 2011 Eric Zivot Robert Richards Chaired Professor of Economics Adjunct Professor,
R: A Free Software Project in Statistical Computing
 R: A Free Software Project in Statistical Computing Achim Zeileis Institut für Statistik & Wahrscheinlichkeitstheorie http://www.ci.tuwien.ac.at/~zeileis/ Acknowledgments Thanks: Alex Smola & Machine Learning
Using R for Windows and Macintosh
 2010 Using R for Windows and Macintosh R is the most commonly used statistical package among researchers in Statistics. It is freely distributed open source software. For detailed information about downloading
We extended the additive model in two variables to the interaction model by adding a third term to the equation.
 Quadratic Models We extended the additive model in two variables to the interaction model by adding a third term to the equation. Similarly, we can extend the linear model in one variable to the quadratic
Psychology 205: Research Methods in Psychology
 Psychology 205: Research Methods in Psychology Using R to analyze the data for study 2 Department of Psychology Northwestern University Evanston, Illinois USA November, 2012 1 / 38 Outline 1 Getting ready
Statistical Models in R
 Statistical Models in R Some Examples Steven Buechler Department of Mathematics 276B Hurley Hall; 1-6233 Fall, 2007 Outline Statistical Models Linear Models in R Regression Regression analysis is the appropriate
Comparing Nested Models
 Comparing Nested Models ST 430/514 Two models are nested if one model contains all the terms of the other, and at least one additional term. The larger model is the complete (or full) model, and the smaller
MIXED MODEL ANALYSIS USING R
 Research Methods Group MIXED MODEL ANALYSIS USING R Using Case Study 4 from the BIOMETRICS & RESEARCH METHODS TEACHING RESOURCE BY Stephen Mbunzi & Sonal Nagda www.ilri.org/rmg www.worldagroforestrycentre.org/rmg
Data Science with R. Introducing Data Mining with Rattle and R. Graham.Williams@togaware.com
 http: // togaware. com Copyright 2013, Graham.Williams@togaware.com 1/35 Data Science with R Introducing Data Mining with Rattle and R Graham.Williams@togaware.com Senior Director and Chief Data Miner,
DEPARTMENT OF PSYCHOLOGY UNIVERSITY OF LANCASTER MSC IN PSYCHOLOGICAL RESEARCH METHODS ANALYSING AND INTERPRETING DATA 2 PART 1 WEEK 9
 DEPARTMENT OF PSYCHOLOGY UNIVERSITY OF LANCASTER MSC IN PSYCHOLOGICAL RESEARCH METHODS ANALYSING AND INTERPRETING DATA 2 PART 1 WEEK 9 Analysis of covariance and multiple regression So far in this course,
ECON 424/CFRM 462 Introduction to Computational Finance and Financial Econometrics
 ECON 424/CFRM 462 Introduction to Computational Finance and Financial Econometrics Eric Zivot Savery 348, email:ezivot@uw.edu, phone 543-6715 http://faculty.washington.edu/ezivot OH: Th 3:30-4:30 TA: Ming
Basic Statistics and Data Analysis for Health Researchers from Foreign Countries
 Basic Statistics and Data Analysis for Health Researchers from Foreign Countries Volkert Siersma siersma@sund.ku.dk The Research Unit for General Practice in Copenhagen Dias 1 Content Quantifying association
Introduction to R software for statistical computing
 to R software for statistical computing JoAnn Rudd Alvarez, MA joann.alvarez@vanderbilt.edu biostat.mc.vanderbilt.edu/joannalvarez Department of Biostatistics Division of Cancer Biostatistics Center for
Stat 5303 (Oehlert): Tukey One Degree of Freedom 1
: Tukey One Degree of Freedom 1") Stat 5303 (Oehlert): Tukey One Degree of Freedom 1 > catch
Stat 5303 (Oehlert): Tukey One Degree of Freedom 1 > catch
Using R for Linear Regression
 Using R for Linear Regression In the following handout words and symbols in bold are R functions and words and symbols in italics are entries supplied by the user; underlined words and symbols are optional
Regression step-by-step using Microsoft Excel
 Step 1: Regression step-by-step using Microsoft Excel Notes prepared by Pamela Peterson Drake, James Madison University Type the data into the spreadsheet The example used throughout this How to is a regression
How To Understand Data Mining In R And Rattle
 http: // togaware. com Copyright 2014, Graham.Williams@togaware.com 1/40 Data Analytics and Business Intelligence (8696/8697) Introducing Data Science with R and Rattle Graham.Williams@togaware.com Chief
Chapter 13 Introduction to Linear Regression and Correlation Analysis
 Chapter 3 Student Lecture Notes 3- Chapter 3 Introduction to Linear Regression and Correlation Analsis Fall 2006 Fundamentals of Business Statistics Chapter Goals To understand the methods for displaing
Downloading, Configuring, and Using the Free SAS University Edition Software
 PharmaSUG 2015 Paper CP08 Downloading, Configuring, and Using the Free SAS University Edition Software Kirk Paul Lafler, Software Intelligence Corporation, Spring Valley, California Charles Edwin Shipp,
Correlation and Simple Linear Regression
 Correlation and Simple Linear Regression We are often interested in studying the relationship among variables to determine whether they are associated with one another. When we think that changes in a
Installing R and the psych package
 Installing R and the psych package William Revelle Department of Psychology Northwestern University August 17, 2014 Contents 1 Overview of this and related documents 2 2 Install R and relevant packages
R a Global Sensation in Data Science
 R a Global Sensation in Data Science Nicoleta CARAGEA (nicoletacaragea@gmail.com) Antoniade-Ciprian ALEXANDRU (alexcipro@yahoo.com) Ecological University of Bucharest - Faculty of Economics Ana Maria DOBRE
E(y i ) = x T i β. yield of the refined product as a percentage of crude specific gravity vapour pressure ASTM 10% point ASTM end point in degrees F
 = x T i β. yield of the refined product as a percentage of crude specific gravity vapour pressure ASTM 10% point ASTM end point in degrees F") Random and Mixed Effects Models (Ch. 10) Random effects models are very useful when the observations are sampled in a highly structured way. The basic idea is that the error associated with any linear,
Random and Mixed Effects Models (Ch. 10) Random effects models are very useful when the observations are sampled in a highly structured way. The basic idea is that the error associated with any linear,
Multiple Regression in SPSS This example shows you how to perform multiple regression. The basic command is regression : linear.
 Multiple Regression in SPSS This example shows you how to perform multiple regression. The basic command is regression : linear. In the main dialog box, input the dependent variable and several predictors.
ANOVA. February 12, 2015
 ANOVA February 12, 2015 1 ANOVA models Last time, we discussed the use of categorical variables in multivariate regression. Often, these are encoded as indicator columns in the design matrix. In [1]: %%R
data visualization and regression
 data visualization and regression Sepal.Length 4.5 5.0 5.5 6.0 6.5 7.0 7.5 8.0 4.5 5.0 5.5 6.0 6.5 7.0 7.5 8.0 I. setosa I. versicolor I. virginica I. setosa I. versicolor I. virginica Species Species
Generalized Linear Models
 Generalized Linear Models We have previously worked with regression models where the response variable is quantitative and normally distributed. Now we turn our attention to two types of models where the
How To Test The Performance Of An Ass 9.4 And Sas 7.4 On A Test On A Powerpoint Powerpoint 9.2 (Powerpoint) On A Microsoft Powerpoint 8.4 (Powerprobe) (
 On A Microsoft Powerpoint 8.4 (Powerprobe) (") White Paper Revolution R Enterprise: Faster Than SAS Benchmarking Results by Thomas W. Dinsmore and Derek McCrae Norton In analytics, speed matters. How much? We asked the director of analytics from a
White Paper Revolution R Enterprise: Faster Than SAS Benchmarking Results by Thomas W. Dinsmore and Derek McCrae Norton In analytics, speed matters. How much? We asked the director of analytics from a
Getting Correct Results from PROC REG
 Getting Correct Results from PROC REG Nathaniel Derby, Statis Pro Data Analytics, Seattle, WA ABSTRACT PROC REG, SAS s implementation of linear regression, is often used to fit a line without checking
N-Way Analysis of Variance
 N-Way Analysis of Variance 1 Introduction A good example when to use a n-way ANOVA is for a factorial design. A factorial design is an efficient way to conduct an experiment. Each observation has data
Data Mining and Data Warehousing. Henryk Maciejewski. Data Mining Predictive modelling: regression
 Data Mining and Data Warehousing Henryk Maciejewski Data Mining Predictive modelling: regression Algorithms for Predictive Modelling Contents Regression Classification Auxiliary topics: Estimation of prediction
Find the Hidden Signal in Market Data Noise
 Find the Hidden Signal in Market Data Noise Revolution Analytics Webinar, 13 March 2013 Andrie de Vries Business Services Director (Europe) @RevoAndrie andrie@revolutionanalytics.com Agenda Find the Hidden
Predictor Coef StDev T P Constant 970667056 616256122 1.58 0.154 X 0.00293 0.06163 0.05 0.963. S = 0.5597 R-Sq = 0.0% R-Sq(adj) = 0.
 = 0.") Statistical analysis using Microsoft Excel Microsoft Excel spreadsheets have become somewhat of a standard for data storage, at least for smaller data sets. This, along with the program often being packaged
Statistical analysis using Microsoft Excel Microsoft Excel spreadsheets have become somewhat of a standard for data storage, at least for smaller data sets. This, along with the program often being packaged
How do most businesses analyze data?
 Marilyn Monda, MA, MBB Say hello to R! And say good bye to expensive stats software R Course 201311 1 How do most businesses analyze data? Excel??? Calculator?? Homegrown analysis packages?? Statistical
Interaction effects between continuous variables (Optional)
") Interaction effects between continuous variables (Optional) Richard Williams, University of Notre Dame, http://www.nd.edu/~rwilliam/ Last revised February 0, 05 This is a very brief overview of this somewhat
Interaction effects between continuous variables (Optional) Richard Williams, University of Notre Dame, http://www.nd.edu/~rwilliam/ Last revised February 0, 05 This is a very brief overview of this somewhat
Chapter 3 Quantitative Demand Analysis
 Managerial Economics & Business Strategy Chapter 3 uantitative Demand Analysis McGraw-Hill/Irwin Copyright 2010 by the McGraw-Hill Companies, Inc. All rights reserved. Overview I. The Elasticity Concept
xtmixed & denominator degrees of freedom: myth or magic
 xtmixed & denominator degrees of freedom: myth or magic 2011 Chicago Stata Conference Phil Ender UCLA Statistical Consulting Group July 2011 Phil Ender xtmixed & denominator degrees of freedom: myth or
EXPLORATORY DATA ANALYSIS: GETTING TO KNOW YOUR DATA
 EXPLORATORY DATA ANALYSIS: GETTING TO KNOW YOUR DATA Michael A. Walega Covance, Inc. INTRODUCTION In broad terms, Exploratory Data Analysis (EDA) can be defined as the numerical and graphical examination
5. Linear Regression
 5. Linear Regression Outline.................................................................... 2 Simple linear regression 3 Linear model............................................................. 4
SPSS Guide: Regression Analysis
 SPSS Guide: Regression Analysis I put this together to give you a step-by-step guide for replicating what we did in the computer lab. It should help you run the tests we covered. The best way to get familiar
Lecture 11: Confidence intervals and model comparison for linear regression; analysis of variance
 Lecture 11: Confidence intervals and model comparison for linear regression; analysis of variance 14 November 2007 1 Confidence intervals and hypothesis testing for linear regression Just as there was
2015 Workshops for Professors
 SAS Education Grow with us Offered by the SAS Global Academic Program Supporting teaching, learning and research in higher education 2015 Workshops for Professors 1 Workshops for Professors As the market
EDUCATION AND VOCABULARY MULTIPLE REGRESSION IN ACTION
 EDUCATION AND VOCABULARY MULTIPLE REGRESSION IN ACTION EDUCATION AND VOCABULARY 5-10 hours of input weekly is enough to pick up a new language (Schiff & Myers, 1988). Dutch children spend 5.5 hours/day
Didacticiel - Études de cas
 1 Topic Regression analysis with LazStats (OpenStat). LazStat 1 is a statistical software which is developed by Bill Miller, the father of OpenStat, a wellknow tool by statisticians since many years. These
Outline. Topic 4 - Analysis of Variance Approach to Regression. Partitioning Sums of Squares. Total Sum of Squares. Partitioning sums of squares
 Topic 4 - Analysis of Variance Approach to Regression Outline Partitioning sums of squares Degrees of freedom Expected mean squares General linear test - Fall 2013 R 2 and the coefficient of correlation
Big Data Analysis with Revolution R Enterprise
 REVOLUTION WHITE PAPER Big Data Analysis with Revolution R Enterprise By Joseph Rickert January 2011 Background The R language is well established as the language for doing statistics, data analysis, data-mining
MSwM examples. Jose A. Sanchez-Espigares, Alberto Lopez-Moreno Dept. of Statistics and Operations Research UPC-BarcelonaTech.
 MSwM examples Jose A. Sanchez-Espigares, Alberto Lopez-Moreno Dept. of Statistics and Operations Research UPC-BarcelonaTech February 24, 2014 Abstract Two examples are described to illustrate the use of
Week 5: Multiple Linear Regression
 BUS41100 Applied Regression Analysis Week 5: Multiple Linear Regression Parameter estimation and inference, forecasting, diagnostics, dummy variables Robert B. Gramacy The University of Chicago Booth School
Psychology 405: Psychometric Theory Homework on Factor analysis and structural equation modeling
 Psychology 405: Psychometric Theory Homework on Factor analysis and structural equation modeling William Revelle Department of Psychology Northwestern University Evanston, Illinois USA June, 2014 1 / 20
Basic Statistical and Modeling Procedures Using SAS
 Basic Statistical and Modeling Procedures Using SAS One-Sample Tests The statistical procedures illustrated in this handout use two datasets. The first, Pulse, has information collected in a classroom
Developing Risk Adjustment Techniques Using the SAS@ System for Assessing Health Care Quality in the lmsystem@
 Developing Risk Adjustment Techniques Using the SAS@ System for Assessing Health Care Quality in the lmsystem@ Yanchun Xu, Andrius Kubilius Joint Commission on Accreditation of Healthcare Organizations,
Lucky vs. Unlucky Teams in Sports
 Lucky vs. Unlucky Teams in Sports Introduction Assuming gambling odds give true probabilities, one can classify a team as having been lucky or unlucky so far. Do results of matches between lucky and unlucky
Chapter 7: Simple linear regression Learning Objectives
 Chapter 7: Simple linear regression Learning Objectives Reading: Section 7.1 of OpenIntro Statistics Video: Correlation vs. causation, YouTube (2:19) Video: Intro to Linear Regression, YouTube (5:18) -
MODEL I: DRINK REGRESSED ON GPA & MALE, WITHOUT CENTERING
 Interpreting Interaction Effects; Interaction Effects and Centering Richard Williams, University of Notre Dame, http://www3.nd.edu/~rwilliam/ Last revised February 20, 2015 Models with interaction effects
THE OPEN SOURCE SOFTWARE R IN THE STATISTICAL QUALITY CONTROL
 1. Miriam ANDREJIOVÁ, 2. Zuzana KIMÁKOVÁ THE OPEN SOURCE SOFTWARE R IN THE STATISTICAL QUALITY CONTROL 1,2 TECHNICAL UNIVERSITY IN KOŠICE, FACULTY OF MECHANICAL ENGINEERING, KOŠICE, DEPARTMENT OF APPLIED
MULTIPLE LINEAR REGRESSION ANALYSIS USING MICROSOFT EXCEL. by Michael L. Orlov Chemistry Department, Oregon State University (1996)
") MULTIPLE LINEAR REGRESSION ANALYSIS USING MICROSOFT EXCEL by Michael L. Orlov Chemistry Department, Oregon State University (1996) INTRODUCTION In modern science, regression analysis is a necessary part
MULTIPLE LINEAR REGRESSION ANALYSIS USING MICROSOFT EXCEL by Michael L. Orlov Chemistry Department, Oregon State University (1996) INTRODUCTION In modern science, regression analysis is a necessary part
An Introduction to Spatial Regression Analysis in R. Luc Anselin University of Illinois, Urbana-Champaign http://sal.agecon.uiuc.
 An Introduction to Spatial Regression Analysis in R Luc Anselin University of Illinois, Urbana-Champaign http://sal.agecon.uiuc.edu May 23, 2003 Introduction This note contains a brief introduction and
1.1. Simple Regression in Excel (Excel 2010).
.") .. Simple Regression in Excel (Excel 200). To get the Data Analysis tool, first click on File > Options > Add-Ins > Go > Select Data Analysis Toolpack & Toolpack VBA. Data Analysis is now available under
.. Simple Regression in Excel (Excel 200). To get the Data Analysis tool, first click on File > Options > Add-Ins > Go > Select Data Analysis Toolpack & Toolpack VBA. Data Analysis is now available under
Technical Paper. Performance of SAS In-Memory Statistics for Hadoop. A Benchmark Study. Allison Jennifer Ames Xiangxiang Meng Wayne Thompson
 Technical Paper Performance of SAS In-Memory Statistics for Hadoop A Benchmark Study Allison Jennifer Ames Xiangxiang Meng Wayne Thompson Release Information Content Version: 1.0 May 20, 2014 Trademarks
WebFOCUS RStat. RStat. Predict the Future and Make Effective Decisions Today. WebFOCUS RStat
 Information Builders enables agile information solutions with business intelligence (BI) and integration technologies. WebFOCUS the most widely utilized business intelligence platform connects to any enterprise
Lets suppose we rolled a six-sided die 150 times and recorded the number of times each outcome (1-6) occured. The data is
 occured. The data is") In this lab we will look at how R can eliminate most of the annoying calculations involved in (a) using Chi-Squared tests to check for homogeneity in two-way tables of catagorical data and (b) computing
In this lab we will look at how R can eliminate most of the annoying calculations involved in (a) using Chi-Squared tests to check for homogeneity in two-way tables of catagorical data and (b) computing
50 Cragwood Rd, Suite 350 South Plainfield, NJ 07080. Victoria Commons, 613 Hope Rd Building #5, Eatontown, NJ 07724
 COURSE SYLLABUS SAS 50 Cragwood Rd, Suite 350 South Plainfield, NJ 07080 Victoria Commons, 613 Hope Rd Building #5, Eatontown, NJ 07724 130 Clinton Rd, Fairfield, NJ 07004 Avtech Institute of Technology
An introduction to using Microsoft Excel for quantitative data analysis
 Contents An introduction to using Microsoft Excel for quantitative data analysis 1 Introduction... 1 2 Why use Excel?... 2 3 Quantitative data analysis tools in Excel... 3 4 Entering your data... 6 5 Preparing
R FOR SAS AND SPSS USERS. Bob Muenchen
 R FOR SAS AND SPSS USERS Bob Muenchen I thank the many R developers for providing such wonderful tools for free and all the r help participants who have kindly answered so many questions. I'm especially
HLM software has been one of the leading statistical packages for hierarchical
 Introductory Guide to HLM With HLM 7 Software 3 G. David Garson HLM software has been one of the leading statistical packages for hierarchical linear modeling due to the pioneering work of Stephen Raudenbush
ECLT5810 E-Commerce Data Mining Technique SAS Enterprise Miner -- Regression Model I. Regression Node
 Enterprise Miner - Regression 1 ECLT5810 E-Commerce Data Mining Technique SAS Enterprise Miner -- Regression Model I. Regression Node 1. Some background: Linear attempts to predict the value of a continuous
Big Data Analysis with Revolution R Enterprise
 Big Data Analysis with Revolution R Enterprise August 2010 Joseph B. Rickert Copyright 2010 Revolution Analytics, Inc. All Rights Reserved. 1 Background The R language is well established as the language
Electronic Thesis and Dissertations UCLA
 Electronic Thesis and Dissertations UCLA Peer Reviewed Title: A Multilevel Longitudinal Analysis of Teaching Effectiveness Across Five Years Author: Wang, Kairong Acceptance Date: 2013 Series: UCLA Electronic
Importing Data into R
 1 R is an open source programming language focused on statistical computing. R supports many types of files as input and the following tutorial will cover some of the most popular. Importing from text
2. Making example missing-value datasets: MCAR, MAR, and MNAR
 Lecture 20 1. Types of missing values 2. Making example missing-value datasets: MCAR, MAR, and MNAR 3. Common methods for missing data 4. Compare results on example MCAR, MAR, MNAR data 1 Missing Data
Notes. Statistical consulting is like a final exam on steroids.
 Notes Statistical consulting is like a final exam on steroids. A statistical consultant usually works as part of a team on a project and provides statistical knowledge for the team. That team may comprise
A Handbook of Statistical Analyses Using R. Brian S. Everitt and Torsten Hothorn
 A Handbook of Statistical Analyses Using R Brian S. Everitt and Torsten Hothorn CHAPTER 6 Logistic Regression and Generalised Linear Models: Blood Screening, Women s Role in Society, and Colonic Polyps
This chapter reviews the general issues involving data analysis and introduces
 Research Skills for Psychology Majors: Everything You Need to Know to Get Started Data Preparation With SPSS This chapter reviews the general issues involving data analysis and introduces SPSS, the Statistical
Practical Data Science with Azure Machine Learning, SQL Data Mining, and R
 Practical Data Science with Azure Machine Learning, SQL Data Mining, and R Overview This 4-day class is the first of the two data science courses taught by Rafal Lukawiecki. Some of the topics will be
Time Series Analysis with R - Part I. Walter Zucchini, Oleg Nenadić
 Time Series Analysis with R - Part I Walter Zucchini, Oleg Nenadić Contents 1 Getting started 2 1.1 Downloading and Installing R.................... 2 1.2 Data Preparation and Import in R.................
Using Excel for Statistical Analysis
 2010 Using Excel for Statistical Analysis Microsoft Excel is spreadsheet software that is used to store information in columns and rows, which can then be organized and/or processed. Excel is a powerful
Time Series Analysis of Aviation Data
 Time Series Analysis of Aviation Data Dr. Richard Xie February, 2012 What is a Time Series A time series is a sequence of observations in chorological order, such as Daily closing price of stock MSFT in
n + n log(2π) + n log(rss/n)
 + n log(rss/n)") There is a discrepancy in R output from the functions step, AIC, and BIC over how to compute the AIC. The discrepancy is not very important, because it involves a difference of a constant factor that cancels
There is a discrepancy in R output from the functions step, AIC, and BIC over how to compute the AIC. The discrepancy is not very important, because it involves a difference of a constant factor that cancels
I n d i a n a U n i v e r s i t y U n i v e r s i t y I n f o r m a t i o n T e c h n o l o g y S e r v i c e s
 I n d i a n a U n i v e r s i t y U n i v e r s i t y I n f o r m a t i o n T e c h n o l o g y S e r v i c e s Linear Regression Models for Panel Data Using SAS, Stata, LIMDEP, and SPSS * Hun Myoung Park,
High-Frequency Data Modelling with R software
 High-Frequency Data Modelling with R software Piotr Wójcik University of Warsaw, Faculty of Economic Sciences QFRG-Eurex Conference 2012-12-05 Piotr Wójcik (WNE UW) QFRG-Eurex Conference 1 / 28 What is
9.2 User s Guide SAS/STAT. Introduction. (Book Excerpt) SAS Documentation
 SAS Documentation") SAS/STAT Introduction (Book Excerpt) 9.2 User s Guide SAS Documentation This document is an individual chapter from SAS/STAT 9.2 User s Guide. The correct bibliographic citation for the complete manual
SAS/STAT Introduction (Book Excerpt) 9.2 User s Guide SAS Documentation This document is an individual chapter from SAS/STAT 9.2 User s Guide. The correct bibliographic citation for the complete manual
MISSING DATA TECHNIQUES WITH SAS. IDRE Statistical Consulting Group
 MISSING DATA TECHNIQUES WITH SAS IDRE Statistical Consulting Group ROAD MAP FOR TODAY To discuss: 1. Commonly used techniques for handling missing data, focusing on multiple imputation 2. Issues that could
Business Valuation Review
 Business Valuation Review Regression Analysis in Valuation Engagements By: George B. Hawkins, ASA, CFA Introduction Business valuation is as much as art as it is science. Sage advice, however, quantitative
Using R and the psych package to find ω
 Using R and the psych package to find ω William Revelle Department of Psychology Northwestern University February 23, 2013 Contents 1 Overview of this and related documents 1 2 Install R and relevant packages
Advanced Big Data Analytics with R and Hadoop
 REVOLUTION ANALYTICS WHITE PAPER Advanced Big Data Analytics with R and Hadoop 'Big Data' Analytics as a Competitive Advantage Big Analytics delivers competitive advantage in two ways compared to the traditional
Exercises on using R for Statistics and Hypothesis Testing Dr. Wenjia Wang
 Exercises on using R for Statistics and Hypothesis Testing Dr. Wenjia Wang School of Computing Sciences, UEA University of East Anglia Brief Introduction to R R is a free open source statistics and mathematical
Data Mining: An Overview of Methods and Technologies for Increasing Profits in Direct Marketing. C. Olivia Rud, VP, Fleet Bank
 Data Mining: An Overview of Methods and Technologies for Increasing Profits in Direct Marketing C. Olivia Rud, VP, Fleet Bank ABSTRACT Data Mining is a new term for the common practice of searching through
Final Exam Practice Problem Answers
 Final Exam Practice Problem Answers The following data set consists of data gathered from 77 popular breakfast cereals. The variables in the data set are as follows: Brand: The brand name of the cereal
Time-Series Regression and Generalized Least Squares in R
 Time-Series Regression and Generalized Least Squares in R An Appendix to An R Companion to Applied Regression, Second Edition John Fox & Sanford Weisberg last revision: 11 November 2010 Abstract Generalized
Can Annuity Purchase Intentions Be Influenced?
 Can Annuity Purchase Intentions Be Influenced? Jodi DiCenzo, CFA, CPA Behavioral Research Associates, LLC Suzanne Shu, Ph.D. UCLA Anderson School of Management Liat Hadar, Ph.D. The Arison School of Business,
Section Format Day Begin End Building Rm# Instructor. 001 Lecture Tue 6:45 PM 8:40 PM Silver 401 Ballerini
 NEW YORK UNIVERSITY ROBERT F. WAGNER GRADUATE SCHOOL OF PUBLIC SERVICE Course Syllabus Spring 2016 Statistical Methods for Public, Nonprofit, and Health Management Section Format Day Begin End Building
Introduction to Longitudinal Data Analysis
 Introduction to Longitudinal Data Analysis Longitudinal Data Analysis Workshop Section 1 University of Georgia: Institute for Interdisciplinary Research in Education and Human Development Section 1: Introduction
Please follow these guidelines when preparing your answers:
 PR- ASSIGNMNT 3000500 Quantitative mpirical Research The objective of the pre- assignment is to review the course prerequisites and get familiar with SPSS software. The assignment consists of three parts:
Adverse Impact and Test Validation Book Series: Multiple Regression. Introduction. Comparison of Compensation using
 Adverse Impact and Test Validation Book Series: Multiple Regression Using Multiple Regression to Examine Compensation Practices Introduction Reasons for Investigating Pay Equity: The Equal Pay Act of 1963
R language in data mining techniques and statistics
 American Journal of Software Engineering and Applications 2013; 2(1) : 7-12 Published online February 20, 2013 (http://www.sciencepublishinggroup.com/j/ajsea) doi: 10.11648/j. ajsea.20130201.12 R language
Interactions involving Categorical Predictors
 Interactions involving Categorical Predictors Today s Class: To CLASS or not to CLASS: Manual vs. program-created differences among groups Interactions of continuous and categorical predictors Interactions
SPSS Resources. 1. See website (readings) for SPSS tutorial & Stats handout
 for SPSS tutorial & Stats handout") Analyzing Data SPSS Resources 1. See website (readings) for SPSS tutorial & Stats handout Don t have your own copy of SPSS? 1. Use the libraries to analyze your data 2. Download a trial version of SPSS
Analyzing Data SPSS Resources 1. See website (readings) for SPSS tutorial & Stats handout Don t have your own copy of SPSS? 1. Use the libraries to analyze your data 2. Download a trial version of SPSS
Prediction Analysis of Microarrays in Excel
 New URL: http://www.r-project.org/conferences/dsc-2003/ Proceedings of the 3rd International Workshop on Distributed Statistical Computing (DSC 2003) March 20 22, Vienna, Austria ISSN 1609-395X Kurt Hornik,