SAVE POD AND FAR Normalization for Event Frequency in Performance Metrics (IFR Example)
|
|
|
- Kelly Lambert
- 10 years ago
- Views:
Transcription
 Matthew Lorentson August")
1 SAVE POD AND FAR Normalization for Event Frequency in Performance Metrics (IFR Example) Matthew Lorentson August
 Matthew")
2 High Points POD and FAR must not be used individually to summarize performance Performance metrics must be normalized to account for the gross influence of event frequency Use a moving average to evaluate progress and trends 2


3 IFR POD GPRA FY15 AOP Milestone for Aviation Program: Methodology for improved measurement of forecast accuracy for GPRA Metrics IFR FAR GPRA 3

4 TPIX = POD x SR Index use solves POD or FAR overemphasis TPIX easy to calculate (advantage over CSI) TPIX exhibits strong linear correlation with IFR Frequency 4 IFR Frequency range (right axis, in red) is magnified compared to IFR Total Performance Index range (right axis, in blue) to emphasize comparable distribution shapes
 to emphasize comparable")
/2 CSI = 1/[1/POD+(1/SR)-1] TPIX = POD x")
5 Performance Indices It is essential to recall that there is no universal approach to verification, but rather that the procedure selected needs to match the specific objectives of the study - Roebber, 2009 Avg = (POD + SR)/2 CSI = 1/[1/POD+(1/SR)-1] TPIX = POD x SR 5
/2 CSI = 1/[1/POD+(1/SR)-1] TPIX =")

6 6 Month POD FAR SR TPIX CSI Avg. IFR Freq. Jan % Example POD = SR = IFR Frequency = 9.07% POD x SR = TPIX x =

7 Month POD FAR SR TPIX CSI Avg. IFR Freq. 7 TAF IFR Performance Correlates with Observed IFR Jan %

8 Moving Average TPIX residuals represent performance relative to all months Month to month variability is high, standard deviation = ~200 TPIX Points Like stocks and commodities, singleday performance, or even monthly volatility, should not be used to make long-term investment decisions performance is a long-term prospect, thus we should use moving averages (and 12-month lag) 8

9 Single Location Example: ORD ORD exhibits a wide range of IFR Frequency, higher IFR Frequency typically in winter months Recent performance, according to the eight-year monthly sample, is very good in relative terms 9

10 Summary POD and FAR must not be used individually to summarize performance Performance metrics must be normalized to account for the gross influence of event frequency Use a moving average to evaluate progress and trends 10

11 Details of Methodology Peer-reviewed article published Dec 2013 Coordinated with Performance Branch Better represents actual forecast performance 11

12 Questions Thanks to Kevin Stone at Aviation & Space Weather Branch for input on this presentation 12

13 Backup Slides 13

14 Total Performance Index Total Performance Index (TPIX) POD = Probability of Detection FAR = False Alarm Ratio 1-FAR = Success Ratio (SR) TPIX = POD * (1-FAR) Comparable to Critical Success Index (CSI) but easier to understand and calculate from POD and FAR CSI = 1 [(100/POD)+(100/1-FAR)-1] 14

15 Geometric Relationship*: POD, SR, CSI, TPIX, and Bias TPIX can be visualized on this graph as a quadrilateral area calculated by multiplying Probability of Detection by Success Ratio. Dashed lines = Bias (POD/SR) Solid contour = CSI. Blue square = TPIX example Using whole numbers, the blue square area with POD and SR scores of 65 (Bias = 1.0) produces a TPIX of 4225 and CSI of ~4815. TPIX and CSI are maximized in the form of a square when bias = Roebber, P., 2009: Visualizing Multiple Measures of Forecast Quality. Wea. Forecasting, 24, [Available online at: Cross and shape figures represent various forecast averages discussed by Roebber; half circles represent TAF and MOS TAF averages (MOS in gray).

16 New GPRA Metric: Improvement Over Predicted Score Fiscal Year Improvement Over Predicted 12 Month Moving Avg. IFR GPRA Goals (based on trend) FY (Oct-Sep) Month # Predicted Actual Performance FY (Oct-Sep) Month # Goal Actual Performance (month #)
 Month # Goal Actual Performance 2015 72 85.03 2016 84 93.78 2017 96 102.52 2018 108 111.27 2019 120 120.")
17 New GPRA Metric: Improvement Over Predicted Score Fiscal Year Improvement Over Predicted 12 Month Moving Avg. IFR GPRA Goals (based on trend) FY (Oct-Sep) Month # Predicted Actual Performance FY (Oct-Sep) Month # Goal Actual Performance (month #) = Goal Performance trend over time 17
 Month # Goal Actual Performance 2015 72 85.03 2016 84 93.78 2017 96 102.52 2018 108 111.27 2019 120 120.")
18 Western Region Climate Artifacts of performance regimes are evident in large-samples Western Region: significant diversity in its climate profile coastal vs. mountain During stratus season, IFR conditions appear easier to forecast thus seasons, and different climate regimes, should be measured separately 18

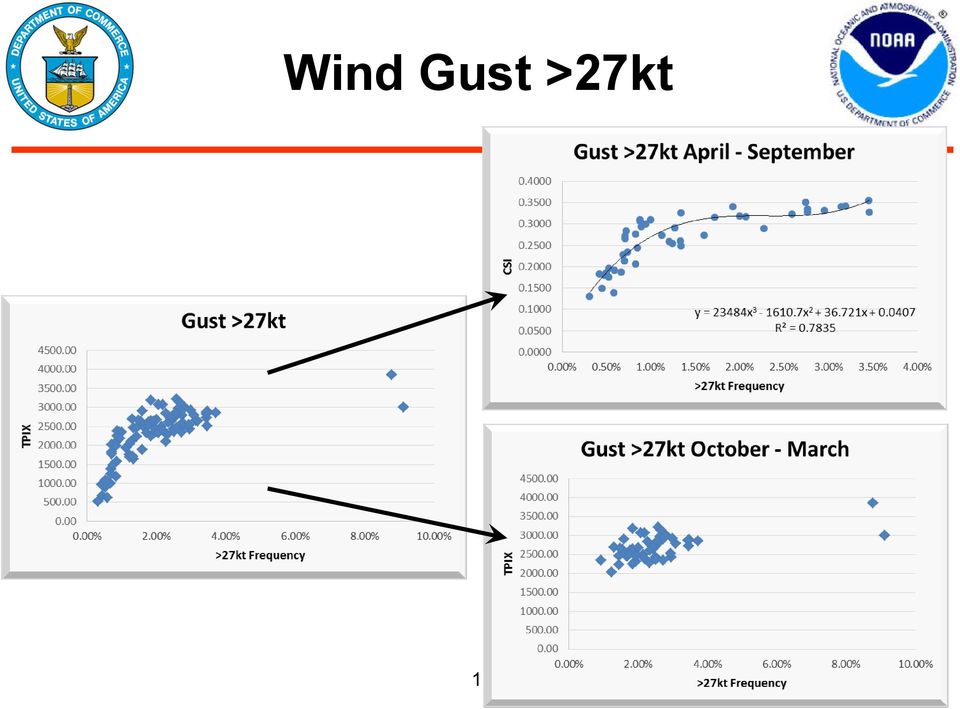
19 Wind Gust >27kt 19
20 Single Location Example: LAS LAS exhibits low IFR Frequency, thus an unusable sample Recent performance, according to the eightyear monthly sample, is very good in relative terms 20

Industry Environment and Concepts for Forecasting 1
 Table of Contents Industry Environment and Concepts for Forecasting 1 Forecasting Methods Overview...2 Multilevel Forecasting...3 Demand Forecasting...4 Integrating Information...5 Simplifying the Forecast...6
Natural Gas Wholesale Prices at PG&E Citygate as of November 7, 2006
 QUARTERLY GAS ISSUES UPDATE December 26 I. Supply Issues Wholesale Natural Gas Prices Above normal temperatures and a lack of hurricane activity caused market prices to decrease in October. By November,
1 Define Management. Explain Mintzberg Managerial Roles. 12M
 Question Paper Code :GMB11T01 MANAGEMENT AND ORGANIZATIONAL BEHAVI0R 1 Define Management. Explain Mintzberg Managerial Roles. 2 Define Social Responsibility. Explain the Arguments for and against Social
Exponential Smoothing with Trend. As we move toward medium-range forecasts, trend becomes more important.
 Exponential Smoothing with Trend As we move toward medium-range forecasts, trend becomes more important. Incorporating a trend component into exponentially smoothed forecasts is called double exponential
Algorithmic Trading Session 1 Introduction. Oliver Steinki, CFA, FRM
 Algorithmic Trading Session 1 Introduction Oliver Steinki, CFA, FRM Outline An Introduction to Algorithmic Trading Definition, Research Areas, Relevance and Applications General Trading Overview Goals
Forecasting in STATA: Tools and Tricks
 Forecasting in STATA: Tools and Tricks Introduction This manual is intended to be a reference guide for time series forecasting in STATA. It will be updated periodically during the semester, and will be
PREDICTIVE ANALYTICS VS. HOTSPOTTING
 PREDICTIVE ANALYTICS VS. HOTSPOTTING A STUDY OF CRIME PREVENTION ACCURACY AND EFFICIENCY EXECUTIVE SUMMARY For the last 20 years, Hot Spots have become law enforcement s predominant tool for crime analysis.
NASA Explorer Schools Pre-Algebra Unit Lesson 2 Student Workbook. Solar System Math. Comparing Mass, Gravity, Composition, & Density
 National Aeronautics and Space Administration NASA Explorer Schools Pre-Algebra Unit Lesson 2 Student Workbook Solar System Math Comparing Mass, Gravity, Composition, & Density What interval of values
USING SIMULATED WIND DATA FROM A MESOSCALE MODEL IN MCP. M. Taylor J. Freedman K. Waight M. Brower
 USING SIMULATED WIND DATA FROM A MESOSCALE MODEL IN MCP M. Taylor J. Freedman K. Waight M. Brower Page 2 ABSTRACT Since field measurement campaigns for proposed wind projects typically last no more than
OPTIONS TRADING AS A BUSINESS UPDATE: Using ODDS Online to Find A Straddle s Exit Point
 This is an update to the Exit Strategy in Don Fishback s Options Trading As A Business course. We re going to use the same example as in the course. That is, the AMZN trade: Buy the AMZN July 22.50 straddle
(More Practice With Trend Forecasts)
") Stats for Strategy HOMEWORK 11 (Topic 11 Part 2) (revised Jan. 2016) DIRECTIONS/SUGGESTIONS You may conveniently write answers to Problems A and B within these directions. Some exercises include special
Stats for Strategy HOMEWORK 11 (Topic 11 Part 2) (revised Jan. 2016) DIRECTIONS/SUGGESTIONS You may conveniently write answers to Problems A and B within these directions. Some exercises include special
Contact Center Math:
 Operations Summit 2012 Contact Center Math: Managing g by the Numbers Presented by: Session Overview In today s session, you will learn to: Establish a balanced set of performance objectives that align
Climate and Weather. This document explains where we obtain weather and climate data and how we incorporate it into metrics:
 OVERVIEW Climate and Weather The climate of the area where your property is located and the annual fluctuations you experience in weather conditions can affect how much energy you need to operate your
The Main Page of RE STATS will provide the range of data at the very top of the page.
 RE STATS Navigator can be accessed from Tempo under the Financials Tab at the top. It will be your bottom option under the drop down menu. The Main Page of RE STATS will provide the range of data at the
PREDICTIVE ANALYTICS vs HOT SPOTTING
 PREDICTIVE ANALYTICS vs HOT SPOTTING A STUDY OF CRIME PREVENTION ACCURACY AND EFFICIENCY 2014 EXECUTIVE SUMMARY For the last 20 years, Hot Spots have become law enforcement s predominant tool for crime
Chapter 6 The Tradeoff Between Risk and Return
 Chapter 6 The Tradeoff Between Risk and Return MULTIPLE CHOICE 1. Which of the following is an example of systematic risk? a. IBM posts lower than expected earnings. b. Intel announces record earnings.
How To Measure Performance
 How to Write Great Performance Measures Part of a Continuing Series on: Performance Monitoring and Program Evaluation Sponsored by NOAA s SEE Evaluation Committee John Bortniak Member, SEE Evaluation Committee
Volatility: Implications for Value and Glamour Stocks
 Volatility: Implications for Value and Glamour Stocks November 2011 Abstract 11988 El Camino Real Suite 500 P.O. Box 919048 San Diego, CA 92191-9048 858.755.0239 800.237.7119 Fax 858.755.0916 www.brandes.com/institute
Visualization Quick Guide
 Visualization Quick Guide A best practice guide to help you find the right visualization for your data WHAT IS DOMO? Domo is a new form of business intelligence (BI) unlike anything before an executive
4. Simple regression. QBUS6840 Predictive Analytics. https://www.otexts.org/fpp/4
 4. Simple regression QBUS6840 Predictive Analytics https://www.otexts.org/fpp/4 Outline The simple linear model Least squares estimation Forecasting with regression Non-linear functional forms Regression
Welcome to Math 7 Accelerated Courses (Preparation for Algebra in 8 th grade)
") Welcome to Math 7 Accelerated Courses (Preparation for Algebra in 8 th grade) Teacher: School Phone: Email: Kim Schnakenberg 402-443- 3101 [email protected] Course Descriptions: Both Concept and Application
Welcome to Math 7 Accelerated Courses (Preparation for Algebra in 8 th grade) Teacher: School Phone: Email: Kim Schnakenberg 402-443- 3101 [email protected] Course Descriptions: Both Concept and Application
LESSON 4 Missing Numbers in Multiplication Missing Numbers in Division LESSON 5 Order of Operations, Part 1 LESSON 6 Fractional Parts LESSON 7 Lines,
 Saxon Math 7/6 Class Description: Saxon mathematics is based on the principle of developing math skills incrementally and reviewing past skills daily. It also incorporates regular and cumulative assessments.
8. Time Series and Prediction
 8. Time Series and Prediction Definition: A time series is given by a sequence of the values of a variable observed at sequential points in time. e.g. daily maximum temperature, end of day share prices,
DESCRIPTIVE STATISTICS. The purpose of statistics is to condense raw data to make it easier to answer specific questions; test hypotheses.
 DESCRIPTIVE STATISTICS The purpose of statistics is to condense raw data to make it easier to answer specific questions; test hypotheses. DESCRIPTIVE VS. INFERENTIAL STATISTICS Descriptive To organize,
An innovative approach combining industrial process data analytics and operator participation to implement lean energy programs: A Case Study
 An innovative approach combining industrial process data analytics and operator participation to implement lean energy programs: A Case Study Philippe Mack, Pepite SA Joanna Huddleston, Pepite SA Bernard
Ratios and Proportional Relationships Set 1: Ratio, Proportion, and Scale... 1 Set 2: Proportional Relationships... 8
 Table of Contents Introduction...v Standards Correlations... viii Materials List... x... 1 Set 2: Proportional Relationships... 8 The Number System Set 1: Integers and Absolute Value... 15 Set 2: Comparing
Correlation key concepts:
 CORRELATION Correlation key concepts: Types of correlation Methods of studying correlation a) Scatter diagram b) Karl pearson s coefficient of correlation c) Spearman s Rank correlation coefficient d)
Pattern Recognition and Prediction in Equity Market
 Pattern Recognition and Prediction in Equity Market Lang Lang, Kai Wang 1. Introduction In finance, technical analysis is a security analysis discipline used for forecasting the direction of prices through
Huai-Min Zhang & NOAAGlobalTemp Team
 Improving Global Observations for Climate Change Monitoring using Global Surface Temperature (& beyond) Huai-Min Zhang & NOAAGlobalTemp Team NOAA National Centers for Environmental Information (NCEI) [formerly:
OPTIMIZING THE USE OF VHA s FEE BASIS CLAIMS SYSTEM (FBCS)
") VA-CASE VISN 11 VA Center for Applied Systems Engineering OPTIMIZING THE USE OF VHA s FEE BASIS CLAIMS SYSTEM (FBCS) The Fee Basis Claims System (FBCS) Optimization initiative aims to improve, standardize,
VA-CASE VISN 11 VA Center for Applied Systems Engineering OPTIMIZING THE USE OF VHA s FEE BASIS CLAIMS SYSTEM (FBCS) The Fee Basis Claims System (FBCS) Optimization initiative aims to improve, standardize,
PdM Overview. Predictive Maintenance Services
 PdM Overview Predictive Maintenance Services Objective Assessments Maximize Uptime, Lower Costs Predictive Maintenance (PdM) solutions from Rexnord Industrial Services help manage the condition of your
Demand forecasting & Aggregate planning in a Supply chain. Session Speaker Prof.P.S.Satish
 Demand forecasting & Aggregate planning in a Supply chain Session Speaker Prof.P.S.Satish 1 Introduction PEMP-EMM2506 Forecasting provides an estimate of future demand Factors that influence demand and
PITFALLS IN TIME SERIES ANALYSIS. Cliff Hurvich Stern School, NYU
 PITFALLS IN TIME SERIES ANALYSIS Cliff Hurvich Stern School, NYU The t -Test If x 1,..., x n are independent and identically distributed with mean 0, and n is not too small, then t = x 0 s n has a standard
Ch.3 Demand Forecasting.
 Part 3 : Acquisition & Production Support. Ch.3 Demand Forecasting. Edited by Dr. Seung Hyun Lee (Ph.D., CPL) IEMS Research Center, E-mail : [email protected] Demand Forecasting. Definition. An estimate
Cloud Model Verification at the Air Force Weather Agency
 2d Weather Group Cloud Model Verification at the Air Force Weather Agency Matthew Sittel UCAR Visiting Scientist Air Force Weather Agency Offutt AFB, NE Template: 28 Feb 06 Overview Cloud Models Ground
Glencoe. correlated to SOUTH CAROLINA MATH CURRICULUM STANDARDS GRADE 6 3-3, 5-8 8-4, 8-7 1-6, 4-9
 Glencoe correlated to SOUTH CAROLINA MATH CURRICULUM STANDARDS GRADE 6 STANDARDS 6-8 Number and Operations (NO) Standard I. Understand numbers, ways of representing numbers, relationships among numbers,
QUANTITATIVE METHODS FOR MANAGEMENT
 3rd Term MBA-2016 QUANTITATIVE METHODS FOR MANAGEMENT COURSE OUTLINE 1. Introduction The main task of a manager is to make decisions. To make decisions managers need information. Information is spread
r a t her t han a s a f e haven
 r a t her t han a s a f e haven For Professional Advisers only - not for onward distribution Investors exposure to gold continues to grow but we believe that more consideration of the risks is needed.
Chapter 9. The Valuation of Common Stock. 1.The Expected Return (Copied from Unit02, slide 39)
") Readings Chapters 9 and 10 Chapter 9. The Valuation of Common Stock 1. The investor s expected return 2. Valuation as the Present Value (PV) of dividends and the growth of dividends 3. The investor s required
Readings Chapters 9 and 10 Chapter 9. The Valuation of Common Stock 1. The investor s expected return 2. Valuation as the Present Value (PV) of dividends and the growth of dividends 3. The investor s required
430 Statistics and Financial Mathematics for Business
 Prescription: 430 Statistics and Financial Mathematics for Business Elective prescription Level 4 Credit 20 Version 2 Aim Students will be able to summarise, analyse, interpret and present data, make predictions
Demand Forecasting to Increase Profits on Perishable Items
 Demand Forecasting to Increase Profits on Perishable Items Ankur Pandey Arun Chaubey Sanchit Garg Shahid Siddiqui Sharath Srinivas Forecasting Analytics, ISB Over stock Wastage Ordering/ Inventory of Perishable
The Point-Slope Form
 7. The Point-Slope Form 7. OBJECTIVES 1. Given a point and a slope, find the graph of a line. Given a point and the slope, find the equation of a line. Given two points, find the equation of a line y Slope
Prentice Hall: Middle School Math, Course 1 2002 Correlated to: New York Mathematics Learning Standards (Intermediate)
") New York Mathematics Learning Standards (Intermediate) Mathematical Reasoning Key Idea: Students use MATHEMATICAL REASONING to analyze mathematical situations, make conjectures, gather evidence, and construct
New York Mathematics Learning Standards (Intermediate) Mathematical Reasoning Key Idea: Students use MATHEMATICAL REASONING to analyze mathematical situations, make conjectures, gather evidence, and construct
OMBU ENTERPRISES, LLC. Process Metrics. 3 Forest Ave. Swanzey, NH 03446 Phone: 603-209-0600 Fax: 603-358-3083 E-mail: OmbuEnterprises@msn.
 OMBU ENTERPRISES, LLC 3 Forest Ave. Swanzey, NH 03446 Phone: 603-209-0600 Fax: 603-358-3083 E-mail: [email protected] Process Metrics Metrics tell the Process Owner how the process is operating.
PART 3 CASH FLOW FORMULA:
 PART 3 CASH FLOW FORMULA: And, now, back to the question that started this series: What is the secret to SUCCESSFULLY FORECASTING CASH? BY STEVEN D. LORDS FORECASTING CASH In Cash Flow Formula Part 1,
How To Implement Your Own Sales Performance Dashboard An Introduction to the Fundamentals of Sales Execution Management
 How To Implement Your Own Sales Performance Dashboard An Introduction to the Fundamentals of Sales Execution Management Learning Objectives The Business Problems To Be Addressed ID & Baseline the Sales
MGT 267 PROJECT. Forecasting the United States Retail Sales of the Pharmacies and Drug Stores. Done by: Shunwei Wang & Mohammad Zainal
 MGT 267 PROJECT Forecasting the United States Retail Sales of the Pharmacies and Drug Stores Done by: Shunwei Wang & Mohammad Zainal Dec. 2002 The retail sale (Million) ABSTRACT The present study aims
Capital Market Theory: An Overview. Return Measures
 Capital Market Theory: An Overview (Text reference: Chapter 9) Topics return measures measuring index returns (not in text) holding period returns return statistics risk statistics AFM 271 - Capital Market
TD is currently among an exclusive group of 77 stocks awarded our highest average score of 10. SAMPLE. Peers BMO 9 RY 9 BNS 9 CM 8
 Updated April 16, 2012 TORONTO-DOMINION BANK (THE) (-T) Banking & Investment Svcs. / Banking Services / Banks Description The Average Score combines the quantitative analysis of five widely-used investment
AN APPROACH TO INCORPORATING DEMAND UNCERTAINTY IN NAS-WIDE MODELING
 AN APPROACH TO INCORPORATING DEMAND UNCERTAINTY IN NAS-WIDE MODELING William Baden, Glenn Foster, David Millner, George Solomos Center for Advanced Aviation System Development (CAASD) The MITRE Corporation
LeSueur, Jeff. Marketing Automation: Practical Steps to More Effective Direct Marketing. Copyright 2007, SAS Institute Inc., Cary, North Carolina,
 Preface. Overview. PART 1: Marketing Financials. Chapter 1 Profit and Loss Fundamentals. Chapter 2 Profit and Loss Component Details. Chapter 3 Managing the P&L. Chapter 4 Measuring Marketing Effectiveness.
Qi Liu Rutgers Business School ISACA New York 2013
 Qi Liu Rutgers Business School ISACA New York 2013 1 What is Audit Analytics The use of data analysis technology in Auditing. Audit analytics is the process of identifying, gathering, validating, analyzing,
Paper 1. Calculator not allowed. Mathematics test. First name. Last name. School. Remember KEY STAGE 3 TIER 5 7
 Ma KEY STAGE 3 Mathematics test TIER 5 7 Paper 1 Calculator not allowed First name Last name School 2009 Remember The test is 1 hour long. You must not use a calculator for any question in this test. You
Forecaster comments to the ORTECH Report
 Forecaster comments to the ORTECH Report The Alberta Forecasting Pilot Project was truly a pioneering and landmark effort in the assessment of wind power production forecast performance in North America.
Forecasting Analytics. Group members: - Arpita - Kapil - Kaushik - Ridhima - Ushhan
 Forecasting Analytics Group members: - Arpita - Kapil - Kaushik - Ridhima - Ushhan Business Problem Forecast daily sales of dairy products (excluding milk) to make a good prediction of future demand, and
Solar Input Data for PV Energy Modeling
 June 2012 Solar Input Data for PV Energy Modeling Marie Schnitzer, Christopher Thuman, Peter Johnson Albany New York, USA Barcelona Spain Bangalore India Company Snapshot Established in 1983; nearly 30
Indian School of Business Forecasting Sales for Dairy Products
 Indian School of Business Forecasting Sales for Dairy Products Contents EXECUTIVE SUMMARY... 3 Data Analysis... 3 Forecast Horizon:... 4 Forecasting Models:... 4 Fresh milk - AmulTaaza (500 ml)... 4 Dahi/
Promotional Forecast Demonstration
 Exhibit 2: Promotional Forecast Demonstration Consider the problem of forecasting for a proposed promotion that will start in December 1997 and continues beyond the forecast horizon. Assume that the promotion
Sample of Best Practices
 Sample of Best Practices For a Copy of the Complete Set Call Katral Consulting Group 954-349-1281 Section 1 Planning & Forecasting Retail Best Practice Katral Consulting Group 1 of 7 Last printed 2005-06-10
An Empirical Analysis of Determinants of Commercial and Industrial Electricity Consumption
 1 Business and Economics Journal, Volume 2010: BEJ-7 An Empirical Analysis of Determinants of Commercial and Industrial Electricity Consumption Richard J Cebula*, Nate Herder 1 *BJ Walker/Wachovia Professor
NEW MEXICO Grade 6 MATHEMATICS STANDARDS
 PROCESS STANDARDS To help New Mexico students achieve the Content Standards enumerated below, teachers are encouraged to base instruction on the following Process Standards: Problem Solving Build new mathematical
Data Practice with FRED Measures of Inflation Objectives
 Data Practice with FRED Measures of Inflation Objectives In this FRED data practice, you will learn: About different ways to measure inflation (CPI, (steps 4-14), GDP deflator (step 15) Different ways
Eðlisfræði 2, vor 2007
 [ Assignment View ] [ Pri Eðlisfræði 2, vor 2007 28. Sources of Magnetic Field Assignment is due at 2:00am on Wednesday, March 7, 2007 Credit for problems submitted late will decrease to 0% after the deadline
JetBlue Airways Stock Price Analysis and Prediction
 JetBlue Airways Stock Price Analysis and Prediction Team Member: Lulu Liu, Jiaojiao Liu DSO530 Final Project JETBLUE AIRWAYS STOCK PRICE ANALYSIS AND PREDICTION 1 Motivation Started in February 2000, JetBlue
Cloud/Hydrometeor Initialization in the 20-km RUC Using GOES Data
 WORLD METEOROLOGICAL ORGANIZATION COMMISSION FOR BASIC SYSTEMS OPEN PROGRAMMME AREA GROUP ON INTEGRATED OBSERVING SYSTEMS EXPERT TEAM ON OBSERVATIONAL DATA REQUIREMENTS AND REDESIGN OF THE GLOBAL OBSERVING
Automating IT Capacity Management
 Automating IT Capacity Management Ingo Schulz Product Manager IT Intelligence SAS International Agenda Introduction The IT Capacity Planning Methodology IT Capacity Planning leveraging SAS IT Intelligence
SEI s Approach to Asset Allocation
 SEI s Approach to Asset Allocation Presented by: Jim Smigiel Managing Director and Portfolio Manager Portfolio Strategies Group What is diversification? Sharpe ratio? Peak Sharpe Ratio Loss of efficiency:
Outline: Demand Forecasting
 Outline: Demand Forecasting Given the limited background from the surveys and that Chapter 7 in the book is complex, we will cover less material. The role of forecasting in the chain Characteristics of
Choosing Colors for Data Visualization Maureen Stone January 17, 2006
 Choosing Colors for Data Visualization Maureen Stone January 17, 2006 The problem of choosing colors for data visualization is expressed by this quote from information visualization guru Edward Tufte:
Algebra 1 2008. Academic Content Standards Grade Eight and Grade Nine Ohio. Grade Eight. Number, Number Sense and Operations Standard
 Academic Content Standards Grade Eight and Grade Nine Ohio Algebra 1 2008 Grade Eight STANDARDS Number, Number Sense and Operations Standard Number and Number Systems 1. Use scientific notation to express
Time Series Analysis: Basic Forecasting.
 Time Series Analysis: Basic Forecasting. As published in Benchmarks RSS Matters, April 2015 http://web3.unt.edu/benchmarks/issues/2015/04/rss-matters Jon Starkweather, PhD 1 Jon Starkweather, PhD [email protected]
STT 200 LECTURE 1, SECTION 2,4 RECITATION 7 (10/16/2012)
") STT 200 LECTURE 1, SECTION 2,4 RECITATION 7 (10/16/2012) TA: Zhen (Alan) Zhang [email protected] Office hour: (C500 WH) 1:45 2:45PM Tuesday (office tel.: 432-3342) Help-room: (A102 WH) 11:20AM-12:30PM,
STT 200 LECTURE 1, SECTION 2,4 RECITATION 7 (10/16/2012) TA: Zhen (Alan) Zhang [email protected] Office hour: (C500 WH) 1:45 2:45PM Tuesday (office tel.: 432-3342) Help-room: (A102 WH) 11:20AM-12:30PM,
Smoothing methods. Marzena Narodzonek-Karpowska. Prof. Dr. W. Toporowski Institut für Marketing & Handel Abteilung Handel
 Smoothing methods Marzena Narodzonek-Karpowska Prof. Dr. W. Toporowski Institut für Marketing & Handel Abteilung Handel What Is Forecasting? Process of predicting a future event Underlying basis of all
Volatility in the Overnight Money-Market Rate in Bangladesh: Recent Experiences PN 0707
 Volatility in the Overnight Money-Market Rate in Bangladesh: Recent Experiences PN 0707 Md. Shahiduzzaman* Mahmud Salahuddin Naser * Abstract This paper tries to investigate the pattern of volatility in
What Causes Climate? Use Target Reading Skills
 Climate and Climate Change Name Date Class Climate and Climate Change Guided Reading and Study What Causes Climate? This section describes factors that determine climate, or the average weather conditions
Determine If An Equation Represents a Function
 Question : What is a linear function? The term linear function consists of two parts: linear and function. To understand what these terms mean together, we must first understand what a function is. The
Extra-Tropical Cyclones in a Warming Climate:
 Extra-Tropical Cyclones in a Warming Climate: Observational Evidence of Trends in Frequencies and Intensities in the North Pacific, North Atlantic, & Great Lakes Regions David Levinson Scientific Services
BETTING ON CLIMATE CHANGE
 Overview: Students will compare breakup records from the Tanana River, in Alaska, recorded by the Nenana Ice Classic, to the timing of bud burst in the Interior and speculate about the relationship between
2) The three categories of forecasting models are time series, quantitative, and qualitative. 2)
 The three categories of forecasting models are time series, quantitative, and qualitative. 2)") Exam Name TRUE/FALSE. Write 'T' if the statement is true and 'F' if the statement is false. 1) Regression is always a superior forecasting method to exponential smoothing, so regression should be used
Exam Name TRUE/FALSE. Write 'T' if the statement is true and 'F' if the statement is false. 1) Regression is always a superior forecasting method to exponential smoothing, so regression should be used
Common Core Unit Summary Grades 6 to 8
 Common Core Unit Summary Grades 6 to 8 Grade 8: Unit 1: Congruence and Similarity- 8G1-8G5 rotations reflections and translations,( RRT=congruence) understand congruence of 2 d figures after RRT Dilations
Please see the Seasonal Changes module description.
 Overview Children will measure and graph the precipitation on the playground throughout the year using a rain gauge. Children will also observe satellite images of clouds and begin to investigate how clouds
Analyzing Weather Data
 Analyzing Weather Data Lesson Concept Link Scientists analyze data gathered from weather tools to predict weather. At the beginning of this unit, each measuring tools was introduced, and over time students
Project Title: Quantifying Uncertainties of High-Resolution WRF Modeling on Downslope Wind Forecasts in the Las Vegas Valley
 University: Florida Institute of Technology Name of University Researcher Preparing Report: Sen Chiao NWS Office: Las Vegas Name of NWS Researcher Preparing Report: Stanley Czyzyk Type of Project (Partners
Smalian s Formula 4. November 1, 2011 4-1
 Smalian s Formula 4 November 1, 011 4-1 Scaling Manual Ministry of Forests, Lands and NRO 4.1 Smalian's Formula From the inception of cubic scaling the Smalian formula, which calculates logs on the basis
700 Analysis and Reporting
 Jefferson Science Associates, LLC 700 Analysis and Reporting Project Control System Manual Revision 7-50 - 700 Analysis and Reporting This chapter of the JSA Project Control System Manual explains how
Expert Color Choices for Presenting Data
 Expert Color Choices for Presenting Data Maureen Stone, StoneSoup Consulting The problem of choosing colors for data visualization is expressed by this quote from information visualization guru Edward
Not Your Dad s Magic Eight Ball
 Not Your Dad s Magic Eight Ball Prepared for the NCSL Fiscal Analysts Seminar, October 21, 2014 Jim Landers, Office of Fiscal and Management Analysis, Indiana Legislative Services Agency Actual Forecast
Q2 2015 Earnings Conference Call. July 30, 2015
 Q2 2015 Earnings Conference Call July 30, 2015 Industry Data and Forward-Looking Statements Disclaimer Broadwind obtained the industry and market data used throughout this presentation from our own research,
Numeracy Targets. I can count at least 20 objects
 Targets 1c I can read numbers up to 10 I can count up to 10 objects I can say the number names in order up to 20 I can write at least 4 numbers up to 10. When someone gives me a small number of objects
Diversifying with Negatively Correlated Investments. Monterosso Investment Management Company, LLC Q1 2011
 Diversifying with Negatively Correlated Investments Monterosso Investment Management Company, LLC Q1 2011 Presentation Outline I. Five Things You Should Know About Managed Futures II. Diversification and
Executive Summary. Abstract. Heitman Analytics Conclusions:
 Prepared By: Adam Petranovich, Economic Analyst [email protected] 541 868 2788 Executive Summary Abstract The purpose of this study is to provide the most accurate estimate of historical
Module 6: Introduction to Time Series Forecasting
 Using Statistical Data to Make Decisions Module 6: Introduction to Time Series Forecasting Titus Awokuse and Tom Ilvento, University of Delaware, College of Agriculture and Natural Resources, Food and