SECTION B Wetland Assessment
|
|
|
- Alexis Grant
- 5 years ago
- Views:
Transcription
 Ltd November 2014 SECTION B Wetland Assessment Prepared by: Scie")
1 AQUATIC ECOLOGICAL ASSESSMENT AND WETLAND STUDIES AS PART OF THE WATER USE LICENSING PROCESS FOR THE CONSTRUCTION OF A POWERLINE FROM THE CASHAN SUB-STATION TO THE NEW PROPOSED SUB-STATION Prepared for SRK Consulting (Pty) Ltd November 2014 SECTION B Wetland Assessment Prepared by: Scientific Aquatic Services Report author: Mmampe Aphane Report Reviewer N. van de Haar (Pri. Sci. Nat) Report Reference: SAS Date: November 2014 Scientific Aquatic Services CC CC Reg No 2003/078943/23 Vat Reg. No Geldenhuis Road Malvern East Ext Tel: Fax: / admin@sasenvironmental.co.za
2 SAS November 2014 TABLE OF CONTENTS TABLE OF CONTENTS... ii LIST OF FIGURES... iv LIST OF TABLES... iv GLOSSARY OF TERMS... vi ACRONYMS... vii 1 INTRODUCTION Scope Assumptions and Limitations Indemnity and Terms of Use of this Report Legislative requirements METHOD OF ASSESSMENT Desktop Study Ecoregion National Freshwater Ecosystems Priority Areas (NFEPA) Classification System for Wetlands and other Aquatic Ecosystems in South Africa Level 1: Inland systems Level 2: Ecoregions & NFEPA Wetland Vegetation Groups Level 3: Landscape Setting Level 4: Hydrogeomorphic Units Wetland Function Assessment Index of Habitat Integrity (IHI) Riparian Vegetation Response Assessment Index (VEGRAI) WET-Health Assessment Level of Evaluation Framework for the Assessment Units of Assessment Quantification of Present State of a Wetland Assessing the Anticipated Trajectory of Change Overall Health of the Wetland Ecological Importance and Sensitivity (EIS) Recommended Ecological Category Wetland and Riparian Delineation IMPACT ASSESSMENT Mitigation Measure Development Recommendations GENERAL IMPORTANCE OF THE PROPOSED POWERLINE ROUTE Ecoregions Importance According to the Gauteng Conservation Plan (V3) and North West Province C Plan National Freshwater Ecosystem Priority Areas (NFEPA) (2011) National Protected Area Expansion Strategy (NPAES, 2010) Biome and Bioregion Vegetation type and Landscape Characteristics RESULTS: WETLAND ASSESSMENT Wetland and Riparian System Characterisation Wetland Function Assessment WET-Health Assessment Index of habitat integrity (IHI) Riparian Vegetation Response Assessment Index (VEGRAI) Ecological Importance and Sensitivity (EIS) Recommended Ecological Category (REC) Wetland and Riparian Area Delineation and Sensitivity Mapping ii
3 SAS November TOWER SPECIFIC MITIGATIONS IMPACT ASSESSMENT Impact Analyses General management and good housekeeping practices Rivers Impact 1: impacts on river recharge, inundation and instream flow Impact 2: impacts due to sedimentation, canalisation and erosion Impact 3: impacts on ecological and sociocultural service provision Impact 4: impacts on instream habitat Impact 5: impacts on refugia for aquatic species Unchannelled valley bottom wetland Impact 1: impacts on wetland recharge, inundation and streamflow Impact 2: impacts due to sedimentation, canalization and erosion Impact 3: impacts on ecological and sociocultural service provision Impact 4: impacts on wetland habitat Dams and Channels Impact 1: impacts on wetland recharge, inundation and instream flow Impact 2: impacts due to sedimentation, canalization and erosion Impact 3: impacts on ecological and sociocultural service provision Impact 4: impacts on wetland habitat IMPACT RATINGS AND MINIMISATION CONCLUSION RECOMMENDATIONS REFERENCES iii
4 SAS November 2014 LIST OF FIGURES Figure 1: Digital satellite image depicting the location of the proposed powerline route and towers in relation to surrounding areas Figure 2: The proposed powerline route depicted on a 1: topographical map in relation to the surrounding area Figure 3: Map of Level 1 Ecoregions of South Africa, with the approximate position of the proposed powerline route indicated in red Figure 4: The Aquatic Ecoregion and quaternary catchment associated with the proposed powerline route Figure 5: Ecological Support Areas and Critical Biodiversity Areas associated with the proposed powerline route, according to the North West and the Gauteng C-Plan.. 27 Figure 6: Rivers indicated by the NFEPA database associated with the proposed powerline route Figure 7: The NPAES database indicating the formally protected area in the vicinity of the proposed powerline route Figure 8: Location of wetlands and river features identified in close proximity of the proposed powerline route Figure 9: Location of wetlands and river features identified in close proximity of the proposed powerline route Figure 10: Location of wetlands and river features identified in close proximity of the proposed powerline route Figure 11: Imperata cylindrica observed within the unchannelled valley bottom wetland Figure 12: Representative photographs of the rivers identified Figure 13: Representative photographs of the dams identified in field Figure 14: Representative photographs of the previously mined are Figure 15: Representative photographs of the channels identified in field Figure 16: Radar plot of services provided by the of the HGM units identified in field Figure 17: Wetland delineations with associated buffer zones Figure 18: Wetland delineations with associated buffer zones Figure 19: Wetland delineations with associated buffer zones LIST OF TABLES Table 1: Classification structure for Inland Systems, up to Level Table 2: Hydrogeomorphic (HGM) Units for the Inland System, showing the primary HGM Types at Level 4A and the subcategories at Level 4B to 4C Table 3: Classes for determining the likely extent to which a benefit is being supplied Table 4: Descriptions of the A-F ecological categories (after Kleynhans, 1996, 1999) Table 5: Descriptions of the A-F ecological categories Table 6: Impact scores and categories of Present State used by WET-Health for describing Table 7: the integrity of wetlands Trajectory of Change classes and scores used to evaluate likely future changes to the present state of the wetland Table 8: Descriptions of the EIS Categories Table 9: Description of REC classes Table 10: Criteria for Assessing Significance of Impacts Table 11: Interpretation of Impact Rating Table 12: Summary of the ecological status of quaternary catchment A21F based on Kleynhans Table 13: Characterisation of the wetland and river features intersected by the proposed powerline route, according to the Classification System (Ollis et al., 2013) iv
5 SAS November 2014 Table 14: Functions and service provision for the HGM units identified Table 15: Summary of results of the WET-Health Assessment Table 16: The overall PES score for the rivers Table 17: The overall VEGRAI score rivers Table 18: The EIS score for the features that will be intercepted by the proposed powerline route Table 19: Tower specific impacts and mitigations for the proposed powerline route Table 20: Tower specific impacts and mitigations for the proposed powerline route Table 21: Construction phase impact ratings and proposed mitigation measures for the wetland and river features along the alternative powerline Table 22: Operational phase impact ratings and proposed mitigation measures for the wetland and river features along the alternative powerline Table 23: Construction phase impact ratings and proposed mitigation measures for the wetland and river features along the alternative powerline Table 24: Operational phase impact ratings and proposed mitigation measures for the wetland and river features along the alternative powerline Table 25: A summary of the results obtained from the assessment of the ecological impacts for alternative powerline Table 26: A summary of the results obtained from the assessment of the ecological impacts for alternative powerline v
6 SAS November 2014 GLOSSARY OF TERMS Alien vegetation Biome Bioregion Ecoregion Indigenous vegetation Plants that do not occur naturally within the area but have been introduced either intentionally or unintentionally. Major regional communities encompassing similar flora and fauna, identifiable at a global scale. A composite spatial terrestrial unit defined on the basis of similar biotic and physical features and processes at the regional scale. An ecoregion is a "recurring pattern of ecosystems associated with characteristic combinations of soil and landform that characterise that region. Vegetation occurring naturally within a defined area. vi
7 SAS November 2014 ACRONYMS BAR CSIR EIA EIS EISC EAP FEPA DEMC DWA DWAF GIS GPS HGM m mm NEMA NFEPA NPAES PEMC PES REC SAIAB SANBI SANParks SAS subwma WMA WRC Basic Assessment Report Council of Scientific and Industrial Research Environmental Impact Assessment Ecological Importance and Sensitivity Ecological Importance and Sensitivity Classification Environmental Assessment Practitioner Freshwater Ecosystem Priority Areas Desired Ecological Management Class Department of Water Affairs Department of Water Affairs and Forestry Geographic Information System Global Positioning System Hydro-geomorphic Metres Millimetres National Environmental Management Act National Freshwater Ecosystem Priority Areas National Protected Area Expansion Strategy Present Ecological Management Class Present Ecological State Recommended Ecological Category South African Institute of Aquatic Biodiversity South African National Biodiversity Institute South African National Parks Scientific Aquatic Services Sub-Water Management Area Water Management Area Water Research Commission vii
8 SAS November INTRODUCTION Scientific Aquatic Services (SAS) was appointed to conduct an aquatic ecological assessment and wetland studies as part of the water use licensing process for the construction of a proposed powerline route from the Cashan sub-station to the new proposed sub-station. Two alternative lines were proposed for this study, one of which being the existing line which may be upgraded (alternative 1). The second alternative is to develop a new line (alternative 2). The alternative powerline 1 is located adjacent to the R560 Road. Alternative line 2 runs approximately parallel, at a distance of approximately 1km from the alternative powerline 1. A site visit was conducted on the 28 th October During the site visit, wetland areas were delineated and an assessment was conducted in order to define the Present Ecological Status (PES) and Ecological Importance and Sensitivity (EIS) thereof, as well as to determine wetland functionality and service provision in terms of ecological and socio-economic functioning of the systems, in order to guide construction activities within the project footprint and to inform the Water Use Licence Application (WULA) to be submitted for the proposed powerline route. An impact assessment on the wetland resources of the powerline development was performed to determine the significance of the perceived impacts on the receiving environment. In addition, mitigatory measures were developed which aim to minimise the impacts, followed by an assessment of the significance of the impacts after mitigation, assuming that they are fully implemented. This report, after consideration and the description of the ecological integrity of the proposed powerline route, must guide the Environmental Assessment Practitioner (EAP), regulatory authorities and developing proponent, by means of the presentation of results and recommendations, as to the ecological viability of the proposed development activities. 1


9 SAS November 2014 Figure 1: Digital satellite image depicting the location of the proposed powerline route and towers in relation to surrounding areas. 2

10 SAS November 2014 Figure 2: The proposed powerline route depicted on a 1: topographical map in relation to the surrounding area. 3
11 SAS November Scope Specific outcomes in terms of the wetland and river assessment are as follows: Delineation of all wetland and riparian features along the proposed powerline route development according to DWA (Department of Water Affairs, 2005): A Practical Guideline Procedure for the Identification and Delineation of Wetlands and Riparian Zones ; Classification of wetland features according the Classification System for Wetlands and other Aquatic Ecosystems in South Africa as defined by Ollis et al., 2013; Define the wetland services provided by the resources according to the method of Kotze et al., 2009; Assess the wetland health according to the resource directed measures guideline as defined by Macfarlane et al., (2009) as well as the procedure for the assessment of the Index of Habitat Integrity (IHI) status by Kleynhans (1996), to obtain the Present Ecological State (PES) of the wetland feature and riparian features; Determination of the Ecological Importance and Sensitivity (EIS); Advocate a Recommended Ecological Category (REC) for the features based on the findings of the EIS assessment; Determine the environmental impacts of the proposed development on the wetland and river resources that would be intersected by the proposed powerline route; and Define mitigatory measures to minimise impacts should the proposed development proceed. 1.2 Assumptions and Limitations The following assumptions and limitations are applicable to this report: The wetland assessment is confined to the proposed powerline route footprint and does not include the neighbouring and adjacent properties, which were only considered as part of the desktop assessment; The wetland delineation as presented in this report is regarded as a best estimate of the wetland boundary based on the site conditions present at the time of assessment. Global Positioning System (GPS) technology is inherently inaccurate and some inaccuracies due to the use of handheld GPS instrumentation may occur. If more accurate assessments are required the wetland will need to be surveyed and pegged according to surveying principles; Wetlands and terrestrial zones create transitional areas where an ecotone is formed as vegetation species change from terrestrial to wetland species. Within this transition zone 4
12 SAS November 2014 some variation of opinion on the wetland boundary may occur, however if the DWA 2005 method is followed, all assessors should get largely similar results; and With ecology being dynamic and complex, certain aspects (some of which may be important) may have been overlooked. It is, however, expected that the proposed powerline route has been accurately assessed and considered, based on the field observations undertaken. 1.3 Indemnity and Terms of Use of this Report The findings, results, observations, conclusions and recommendations given in this report are based on the author s best scientific and professional knowledge as well as available information. The report is based on survey and assessment techniques which are limited by time and budgetary constraints relevant to the type and level of investigation undertaken and SAS CC and its staff reserve the right to modify aspects of the report including the recommendations if and when new information may become available from ongoing research or further work in this field, or pertaining to this investigation. Although SAS CC exercises due care and diligence in rendering services and preparing documents, SAS CC accepts no liability and the client, by receiving this document, indemnifies SAS CC and its directors, managers, agents and employees against all actions, claims, demands, losses, liabilities, costs, damages and expensed arising from or in connection with services rendered, directly or indirectly by SAS CC and by the use of the information contained in this document. This report must not be altered or added to without the prior written consent of the author. This also refers to electronic copies of this report which are supplied for the purposes of inclusion as part of other reports, including main reports. Similarly, any recommendations, statements or conclusions drawn from or based on this report must make reference to this report. If these form part of a main report relating to this investigation or report, this report must be included in its entirety as an appendix or separate section to the main report. 1.4 Legislative requirements National Water Act (NWA) In terms of the NWA, the following is applicable: The water act recognises that the entire ecosystem and not just the water itself in any given water resource constitutes the resource and as such needs to be conserved; 5
13 SAS November 2014 No activity may therefore take place within a watercourse, unless it is authorised by the DWA; The General Authorisation, specifically addressing the water uses defined under Section 21 (c) & (i) of the NWA, as published in the Government Gazette No , dated 18 December 2009, Regulations No. 1199, Replacement of General Authorisation in terms of Section 39 of the NWA, 1998 (Act 36 of 1998), provides a set of requirements which is an authorisation to which a water user must comply. If the water user cannot comply or the water use related activities exceed the conditions or exclusions of the General Authorisation then a water use licence application is required; and Any area within a wetland or riparian zone is therefore excluded from development unless authorisation is obtained from the DWA in terms of Section 21 (c & i). National Environmental Management Act The National Environmental Management Act (NEMA) (Act 107 of 1998) as amended and the associated Regulations (No R. 544 and No R. 545), states that prior to any development taking place within a wetland or riparian area, an environmental authorisation process needs to be followed. This could follow either the Basic Assessment Report (BAR) process or the Environmental Impact Assessment (EIA) process depending on the scale of the impact. 2 METHOD OF ASSESSMENT 2.1 Desktop Study Prior to the commencement of the field assessment, a background study, including a literature review, was conducted in order to determine the ecoregion of the larger aquatic system in close proximity of the proposed powerline route. Aspects considered as part of the literature review are discussed in the sections that follow. 2.2 Ecoregion When assessing the ecology of any area (aquatic or terrestrial), it is important to know which ecoregion the proposed powerline route is located within. This knowledge allows for improved interpretation of data to be made, since reference information and representative species lists are often available on this level of assessment to guide the assessment. The database was consulted for the quaternary catchment of concern in order to define the EIS, PEMC and DEMC. The findings are based on a study undertaken by Kleynhans (1999) as part of 6
14 SAS November 2014 A procedure for the determination of the ecological reserve for the purpose of the national water balance model for South African rivers. 2.3 National Freshwater Ecosystems Priority Areas (NFEPA) The NFEPA project is a multi-partner project between the Council of Scientific and Industrial Research (CSIR), Water Research Commission (WRC), South African National Biodiversity Institute (SANBI), DWA, South African Institute of Aquatic Biodiversity (SAIAB) and South African National Parks (SANParks). The project responds to the reported degradation of freshwater ecosystem condition and associated biodiversity, both globally and in South Africa. It uses systematic conservation planning to provide strategic spatial priorities of conserving South Africa s freshwater biodiversity, within the context of equitable social and economic development. The NFEPA project aims to identify a national network of freshwater conservation areas and to explore institutional mechanisms for their implementation. Freshwater ecosystems provide a valuable natural resource, with economic, aesthetic, spiritual, cultural and recreational value. However, the integrity of freshwater ecosystems in South Africa is declining at an alarming rate, largely as a consequence of a variety of challenges that are practical (managing vast areas of land to maintain connectivity between freshwater ecosystems), socio-economic (competition between stakeholders for utilisation) and institutional (building appropriate governance and comanagement mechanisms). The NFEPA database was searched for information in terms of conservation status of rivers, wetland habitat and wetland features present along the proposed powerline route. 2.4 Classification System for Wetlands and other Aquatic Ecosystems in South Africa All wetland or riparian features encountered along the proposed powerline route were assessed using the Classification System for Wetlands and other Aquatic Ecosystems in South Africa. User Manual: Inland Systems, hereafter referred to as the classification system (Ollis et al., 2013). A summary of Levels 1 to 4 of the classification system are presented in Table 1 and 2, below. 7
15 SAS November 2014 Table 1: Classification structure for Inland Systems, up to Level 3. WETLAND / AQUATIC ECOSYSTEM CONTEXT LEVEL 1: SYSTEM Inland Systems LEVEL 2: REGIONAL SETTING DWA Level 1 Ecoregions OR NFEPA WetVeg Groups OR Other special framework LEVEL 3: LANDSCAPE UNIT Valley Floor Slope Plain Bench (Hilltop / Saddle / Shelf) Table 2: Hydrogeomorphic (HGM) Units for the Inland System, showing the primary HGM Types at Level 4A and the subcategories at Level 4B to 4C. FUNCTIONAL UNIT LEVEL 4: HYDROGEOMORPHIC (HGM) UNIT HGM type Longitudinal zonation/ Landform / Landform / Inflow drainage Outflow drainage A B C Mountain headwater stream Active channel Riparian zone Mountain stream Active channel Riparian zone Transitional Active channel Riparian zone Upper foothills Active channel Riparian zone River Lower foothills Active channel Riparian zone Lowland river Active channel Riparian zone Rejuvenated bedrock fall Active channel Riparian zone Rejuvenated foothills Active channel Riparian zone Upland floodplain Active channel Riparian zone Channelled valley-bottom wetland (not applicable) (not applicable) Unchannelled valley-bottom wetland (not applicable) (not applicable) Floodplain wetland Floodplain depression (not applicable) Floodplain flat (not applicable) Depression Exorheic With channelled inflow Without channelled inflow Endorheic With channelled inflow Without channelled inflow 8
16 SAS November 2014 FUNCTIONAL UNIT LEVEL 4: HYDROGEOMORPHIC (HGM) UNIT HGM type Longitudinal zonation/ Landform / Landform / Inflow drainage Outflow drainage A B C Dammed With channelled inflow Without channelled inflow Seep With channelled outflow (not applicable) Without channelled outflow (not applicable) Wetland flat (not applicable) (not applicable) Level 1: Inland systems From the classification system, Inland Systems are defined as aquatic ecosystems that have no existing connection to the ocean 1 (i.e. characterised by the complete absence of marine exchange and/or tidal influence) but which are inundated or saturated with water, either permanently or periodically. It is important to bear in mind, however, that certain Inland Systems may have had an historical connection to the ocean, which in some cases may have been relatively recent Level 2: Ecoregions & NFEPA Wetland Vegetation Groups For Inland Systems, the regional spatial framework that has been included at Level 2 of the classification system is that of DWA s Level 1 Ecoregions for aquatic ecosystems (Kleynhans et al., 2005). There are a total of 31 Ecoregions across South Africa, including Lesotho and Swaziland (figure below). DWA Ecoregions have most commonly been used to categorise the regional setting for national and regional water resource management applications, especially in relation to rivers. The Vegetation Map of South Africa, Swaziland and Lesotho (Mucina & Rutherford, 2006) groups vegetation types across the country according to Biomes, which are then divided into Bioregions. To categorise the regional setting for the wetland component of the NFEPA project, wetland vegetation groups (referred to as WetVeg Groups) were derived by further splitting Bioregions into smaller groups through expert input (Nel et al., 2011). There are currently 133 NFEPA WetVeg Groups. It is envisaged that these groups could be used as a special framework for the classification of wetlands in national- and regional-scale conservation planning and wetland management initiatives. 1 Most rivers are indirectly connected to the ocean via an estuary at the downstream end, but where marine exchange (i.e. the p resence of seawater) or tidal fluctuations are detectable in a river channel that is permanently or periodically connected to the ocean, it is defined as part of the estuary. 9

17 Figure 3: Map of Level 1 Ecoregions of South Africa, with the approximate position of the proposed powerline route indicated in red. 10
18 2.4.3 Level 3: Landscape Setting At Level 3 of the proposed classification System, for Inland Systems, a distinction is made between four Landscape Units (Table 1) on the basis of the landscape setting (i.e. topographical position) within which an HGM Unit is situated, as follows (Ollis et al., 2013): Slope: an included stretch of ground that is not part of a valley floor, which is typically located on the side of a mountain, hill or valley; Valley floor: The base of a valley, situated between two distinct valley side-slopes; Plain: an extensive area of low relief characterised by relatively level, gently undulating or uniformly sloping land; Bench (hilltop/saddle/shelf): an area of mostly level or nearly level high ground (relative to the broad surroundings), including hilltops/crests (areas at the top of a mountain or hill flanked by down-slopes in all directions), saddles (relatively high-lying areas flanked by down-slopes on two sides in one direction and up-slopes on two sides in an approximately perpendicular direction), and shelves/terraces/ledges (relatively high-lying, localised flat areas along a slope, representing a break in slope with an up-slope one side and a down-slope on the other side in the same direction); Level 4: Hydrogeomorphic Units Eight primary HGM Types are recognised for Inland Systems at Level 4A of the classification system (Table 2), on the basis of hydrology and geomorphology (Ollis et al., 2013), namely: River: a linear landform with clearly discernible bed and banks, which permanently or periodically carries a concentrated flow of water; Channelled valley-bottom wetland: a valley-bottom wetland with a river channel running through it; Unchannelled valley-bottom wetland: a valley-bottom wetland without a river channel running through it; Floodplain wetland: the mostly flat or gently sloping land adjacent to and formed by an alluvial river channel, under its present climate and sediment load, which is subject to periodic inundation by over-topping of the channel bank; Depression: a landform with closed elevation contours that increases in depth from the perimeter to a central area of greatest depth, and within which water typically accumulates; Wetland Flat: a level or near-level wetland area that is not fed by water from a river channel, and which is typically situated on a plain or a bench. Closed elevation contours are not evident around the edge of a wetland flat; 11
19 Seep: a wetland area located on (gently to steeply) sloping land, which is dominated by the colluvial (i.e. gravity-driven), unidirectional movement of material down-slope. Seeps are often located on the side-slopes of a valley but they do not, typically, extend into a valley floor. The above terms have been used for the primary HGM Units in the classification system to try and ensure consistency with the wetland classification terms currently in common usage in South Africa. Similar terminology (but excluding categories for channel, flat and valleyhead seep ) is used, for example, in the recently developed tools produced as part of the Wetland Management Series including WET-Health (Macfarlane et al., 2008), WET-IHI (DWAF, 2007) and WET-EcoServices (Kotze et al., 2009). 2.5 Wetland Function Assessment The importance of a water resource, in ecological social or economic terms, acts as a modifying or motivating determinant in the selection of the management class. 2 The assessment of the ecosystem services supplied by the identified wetlands was conducted according to the guidelines as described by Kotze et al (2009). An assessment was undertaken that examines and rates the following services according to their degree of importance and the degree to which the service is provided: Flood attenuation; Stream flow regulation; Sediment trapping; Phosphate trapping; Nitrate removal; Toxicant removal; Erosion control; Carbon storage; Maintenance of biodiversity; Water supply for human use; Natural resources; Cultivated foods; Cultural significance; Tourism and recreation; and Education and research. 2 Department of Water Affairs and Forestry, South Africa Version 1.0 of Resource Directed Measures for Protection of Water Resources,
20 The characteristics were used to quantitatively determine the value, and by extension sensitivity, of the wetlands. Each characteristic was scored to give the likelihood that the service is being provided. The scores for each service were then averaged to give an overall score to the wetland. Table 3: Classes for determining the likely extent to which a benefit is being supplied. Score Rating of the likely extent to which the benefit is being supplied <0.5 Low Moderately low Intermediate Moderately high >3 High 2.6 Index of Habitat Integrity (IHI) To assess the PES of the riparian features, the IHI for South African floodplain and channelled valley bottom wetland types (Department of Water Affairs and Forestry Resource Quality Services, 2007) was used. The WETLAND-IHI is a tool developed for use in the National Aquatic Ecosystem Health Monitoring Programme (NAEHMP). The WETLAND-IHI has been developed to allow the NAEHMP to include floodplain and channelled valley bottom wetland types to be assessed. The output scores from the WETLAND-IHI model are presented in A-F ecological categories (table below), and provide a score of the PES of the habitat integrity of the wetland or riparian system being examined. Table 4: Descriptions of the A-F ecological categories (after Kleynhans, 1996, 1999). Ecological PES % Description Category Score A % Unmodified, natural. B 80-90% Largely natural with few modifications. A small change in natural habitats and biota may have taken place but the ecosystem functions are essentially unchanged. C 60-80% Moderately modified. Loss and change of natural habitat and biota have occurred, but the basic ecosystem functions are still predominantly unchanged. D 40-60% E 20-40% Largely modified. A large loss of natural habitat, biota and basic ecosystem functions has occurred % Seriously modified. The loss of natural habitat, biota and basic ecosystem functions is extensive. Seriously modified. The loss of natural habitat, biota and basic ecosystem functions is extensive. 13
21 Ecological Category PES % Score Description F 0-20% Critically/Extremely modified. Modifications have reached a critical level and the system has been modified completely with an almost complete loss of natural habitat and biota. In the worst instances, the basic ecosystem functions have been destroyed and the changes are irreversible. 2.7 Riparian Vegetation Response Assessment Index (VEGRAI) The VEGRAI is designed for qualitative assessment of the response of riparian vegetation to impacts in such a way that qualitative ratings translate into quantitative and defensible results 3. Results are defensible because their generation can be traced through an outlined process (a suite of rules that convert assessor estimates into ratings and convert multiple ratings into an Ecological Category). Table 5: Descriptions of the A-F ecological categories. Ecological category Description Score (% of total) A Unmodified, natural B Largely natural with few modifications. A small change in natural habitat and biota may have taken place but the ecosystem functions are essentially unchanged. C Moderately modified. Loss and change of natural habitat have occurred, but the basic ecosystem functions are still predominately unchanged. D Largely modified. A large loss of natural habitat, biota and basic ecosystem functions has occurred. E Seriously modified. The loss of natural habitat, biota and basic ecosystem functions is extensive. F Critically modified. Modifications have reached a critical level and the lotic system has been modified completely with an almost complete loss of natural habitat and biota. In the worst instances the basic ecosystem functions have been destroyed and the changes are irreversible WET-Health Assessment Healthy wetlands are known to provide important habitats for wildlife and to deliver a range of important goods and services to society. Management of these systems is therefore essential if these attributes are to be retained within an ever changing landscape. The primary purpose of this assessment is to evaluate the ecophysical health of wetlands, and in so doing promote their conservation and wise management. 3 Kleynhans et al,
22 2.8.1 Level of Evaluation Two levels of assessment are provided by WET-Health: Level 1: Desktop evaluation, with limited field verification. This is generally applicable to situations where a large number of wetlands need to be assessed at a very low resolution; or Level 2: On-site evaluation. This involves structured sampling and data collection in a single wetland and its surrounding catchment Framework for the Assessment A set of three modules has been synthesised from the set of processes, interactions and interventions that take place in wetland systems and their catchments: hydrology (water inputs, distribution and retention, and outputs), geomorphology (sediment inputs, retention and outputs) and vegetation (transformation and presence of introduced alien species) Units of Assessment Central to WET-Health is the characterisation of HGM Units, which have been defined based on geomorphic setting (e.g. hillslope or valley-bottom; whether drainage is open or closed), water source (surface water dominated or sub-surface water dominated) and pattern of water flow through the wetland unit (diffusely or channelled) as described under the Classification System for Wetlands and other Aquatic Ecosystems in Section Quantification of Present State of a Wetland The overall approach is to quantify the impacts of human activity or clearly visible impacts on wetland health, and then to convert the impact scores to a Present State score. This takes the form of assessing the spatial extent of impact of individual activities and then separately assessing the intensity of impact of each activity in the affected area. The extent and intensity are then combined to determine an overall magnitude of impact. The impact scores and Present State categories are provided in Table
23 Table 6: Impact scores and categories of Present State used by WET-Health for describing the integrity of wetlands. Impact category Description Impact score range None Unmodified, natural A Small Moderate Large Serious Largely natural with few modifications. A slight change in ecosystem processes is discernible and a small loss of natural habitats and biota may have taken place. Moderately modified. A moderate change in ecosystem processes and loss of natural habitats has taken place but the natural habitat remains predominantly intact. Largely modified. A large change in ecosystem processes and loss of natural habitat and biota and has occurred. The change in ecosystem processes and loss of natural habitat and biota is great but some remaining natural habitat features are still recognizable B C D E Present State category Critical Modifications have reached a critical level and the ecosystem processes have been modified completely with an almost complete loss of natural habitat and biota F Assessing the Anticipated Trajectory of Change As is the case with the Present State, future threats to the state of the wetland may arise from activities in the catchment upstream of the unit or within the wetland itself or from processes downstream of the wetland. In each of the individual sections for hydrology, geomorphology and vegetation, five potential situations exist depending upon the direction and likely extent of change (Table 77). Table 7: Trajectory of Change classes and scores used to evaluate likely future changes to the present state of the wetland. Change Class Description HGM change score Symbol Substantial improvement State is likely to improve substantially over the next 5 years 2 Slight improvement State is likely to improve slightly over the next 5 years 1 Remain stable State is likely to remain stable over the next 5 years 0 Slight deterioration State is likely to deteriorate slightly over the next 5 years -1 Substantial deterioration State is expected to deteriorate substantially over the next 5 years -2 16
24 2.8.6 Overall Health of the Wetland Once all HGM Units have been assessed, a summary of health for the wetland as a whole needs to be calculated. This is achieved by calculating a combined score for each component by areaweighting the scores calculated for each HGM Unit. Recording the health assessments for the hydrology, geomorphology and vegetation components provides a summary of impacts, Present State, Trajectory of Change and Health for individual HGM Units and for the entire wetland. 2.9 Ecological Importance and Sensitivity (EIS) The method used for the EIS determination was adapted from the method as provided by DWA (1999) for floodplains. The method takes into consideration PES scores obtained for WET-Health and the IHI as well as function and service provision to enable the assessor to determine the most representative EIS category for the wetland/river features or group being assessed. A series of determinants for EIS are assessed on a scale of 0 to 4, where 0 indicates no importance and 4 indicates very high importance. The mean of the determinants is used to assign the EIS category as listed in Table 8 below. Table 8: Descriptions of the EIS Categories. EIS Category Very high Wetlands/rivers that are considered ecologically important and sensitive on a national or even international level. The biodiversity of these wetlands is usually very sensitive to flow and habitat modifications. High Wetlands/rivers that are considered to be ecologically important and sensitive. The biodiversity of these wetlands may be sensitive to flow and habitat modifications. Moderate Wetlands/rivers that are considered to be ecologically important and sensitive on a provincial or local scale. The biodiversity of these wetlands is not usually sensitive to flow and habitat modifications. Low/marginal Wetlands/rivers that are not ecologically important and sensitive at any scale. The biodiversity of these wetlands is ubiquitous and not sensitive to flow and habitat modifications. Range of Mean >3 and <=4 >2 and <=3 >1 and <=2 >0 and <=1 Recommended Ecological Management Class 4 A B C D 4 Ed s note: Author to confirm exact wording for version
25 2.10 Recommended Ecological Category A high management class relates to the flow that will ensure a high degree of sustainability and a low risk of ecosystem failure. A low management class will ensure marginal maintenance of sustainability, but carries a higher risk of ecosystem failure. 5 The REC (Table 9) was determined based on the results obtained from the PES, reference conditions and EIS of the resource (sections above), followed by realistic recommendations, mitigation, and rehabilitation measures to achieve the desired REC. A wetland may receive the same class for the PES as the REC if the wetland is deemed in good condition, and therefore must stay in good condition. Otherwise, an appropriate REC should be assigned in order to prevent any further degradation as well as enhance the PES of the wetland feature. Table 9: Description of REC classes. Class A B C D Description Unmodified, natural Largely natural with few modifications Moderately modified Largely modified 2.11 Wetland and Riparian Delineation For the purposes of this investigation, a wetland and a riparian habitat are defined in the national water Act (1998) as stated below: A wetland is a land which is transitional between terrestrial and aquatic systems where the water table is usually at or near the surface, or the land is periodically covered with shallow water, and which land in normal circumstances supports or would support vegetation typically adapted to life in saturated soil. Riparian habitat is defined as including the physical structure and associated vegetation of the areas associated with a watercourse which are commonly characterized by alluvial soils, and which are inundated or flooded to an extent and with a frequency sufficient to support vegetation of species with a composition and physical structure distinct from those of adjacent areas. The wetland zone delineation took place according to the method presented in the final draft of A practical field procedure for identification and delineation of wetlands and riparian areas 5 Department of Water Affairs and Forestry, South Africa Version 1.0 of Resource Directed Measures for Protection of Water Resources
26 published by the DWA in February The foundation of the method is based on the fact that wetlands have several distinguishing factors including the following: The presence of water at or near the ground surface; Distinctive hydromorphic soils; Vegetation adapted to saturated soils; and The presence of alluvial soils in stream systems. By observing the evidence of these features in the form of indicators, wetland zones and riparian zones can be delineated and identified. If the use of these indicators and the interpretation of the findings are applied correctly, then the resulting delineation can be considered accurate (DWA, 2005). Wetland zones can be divided into three zones (DWA, 2005). The permanent zone of wetness is nearly always saturated. The seasonal zone is saturated for a significant part of the rainy season and the temporary zone surrounds the seasonal zone and is only saturated for a short period of the year, but is saturated for a sufficient period, under normal circumstances, to allow for the formation of hydromorphic soils and the growth of wetland vegetation. The object of this study was to identify the outer boundary of the temporary zone and then to identify a suitable buffer zone around the wetland area. Riparian zones have noticeable stream banks as well as an active channel which constitute of alluvial soils and isolated areas of bedrock in some areas. In addition, distinctive change in vegetation abundance as well as diversity is usually noted in the riparian zone when compared to the surrounding terrestrial zones. Where applicable the edge of the riparian zone was delineated. 3 IMPACT ASSESSMENT The anticipated impacts associated with the proposed project have been assessed according to SRK s standardised impact assessment methodology which is presented below. This methodology has been utilised for the assessment of environmental impacts where the consequence (severity of impact, spatial scope of impact and duration of impact) and likelihood (frequency of activity and frequency of impact) have been considered in parallel to provide an impact rating and hence an interpretation in terms of the level of environmental management required for each impact. 19
27 The first stage of any impact assessment is the identification of potential environmental activities 6, aspects 7 and impacts which may occur during the commencement and implementation of a project. This is supported by the identification of receptors 8 and resources 9, which allows for an understanding of the impact pathway and an assessment of the sensitivity to change. Environmental impacts 10 (social and biophysical) are then identified based on the potential interaction between the aspects and the receptors/resources. The significance (degree to which the impact may cause irreplaceable loss of resources) of the impact is then assessed by rating each variable numerically according to defined criteria as outlined in Table The purpose of the rating is to develop a clear understanding of influences and processes associated with each impact. The severity 11, spatial scope 12 and duration 13 of the impact together comprise the consequence of the impact and when summed can obtain a maximum value of 15. The frequency of the activity 14 and the frequency of the impact 15 together comprise the likelihood of the impact occurring and can obtain a maximum value of 10. The values for likelihood and consequence of the impact are then read off a significance rating matrix table as shown in Table This matrix thus provides a rating on a scale of 1 to 150 (low, medium low, medium high or high) based on the consequence and likelihood of an environmental impact occurring. Natural and existing mitigation measures, including built-in engineering designs, are included in the pre-mitigation assessment of significance. Measures such as demolishing of infrastructure, and reinstatement and rehabilitation of land, are considered post-mitigation. 6 An activity is a distinct process or task undertaken by an organisation for which a responsibility can be assigned. Activities also include facilities or pieces of infrastructure that are possessed by an organisation. 7 An environmental aspect is an element of an organisations activities, products and services which can interact with the environment. The interaction of an aspect with the environment may result in an impact. 8 Receptors comprise, but are not limited to people or man-made structures. 9 Resources include components of the biophysical environment. 10 Environmental impacts are the consequences of these aspects on environmental resources or receptors of particular value or sensitivity, for example, disturbance due to noise and health effects due to poorer air quality. Receptors can comprise, but are not limited to, people or human-made systems, such as local residents, communities and social infrastructure, as well as components of the biophysical environment such as aquifers, flora and palaeontology. In the case where the impact is on human health or wellbeing, this should be stated. Similarly, where the receptor is not anthropogenic, then it should, where possible, be stipulated what the receptor is. 11 Severity refers to the degree of change to the receptor status in terms of the reversibility of the impact; sensitivity of receptor to stressor; duration of impact (increasing or decreasing with time); controversy potential and precedent setting; threat to environmental and health standards. 12 Spatial scope refers to the geographical scale of the impact. 13 Duration refers to the length of time over which the stressor will cause a change in the resource or receptor. 14 Frequency of activity refers to how often the proposed activity will take place. 15 Frequency of impact refers to the frequency with which a stressor (aspect) will impact on the receptor. 20

28 Table 10: Criteria for Assessing Significance of Impacts 21
29 Table 11: Interpretation of Impact Rating Consequence Likelihood High 76 to 150 Improve current management Medium High 40 to 75 Maintain current management Medium Low 26 to 39 Low 1 to 25 No management required SIGNIFICANCE = CONSEQUENCE x LIKELIHOOD 3.1 Mitigation Measure Development The following points present the key concepts considered in the development of mitigation measures for the proposed development: Mitigation and performance improvement measures and actions that address the risks and impacts 16 are identified and described in as much detail as possible. Measures and actions to address negative impacts will favour avoidance and prevention over minimisation, mitigation or compensation. Desired outcomes are defined, and have been developed in such a way as to be measurable events with performance indicators, targets and acceptable criteria that can be tracked over defined periods, with estimates of the resources (including human resource and training requirements) and responsibilities for implementation. 3.2 Recommendations Recommendations were developed to address and mitigate potential impacts on the wetland ecology associated with the development related to the features identified. These recommendations also include specific management measures applicable to individual Wetland 16 Mitigation measures should address both positive and negative impacts 22
30 Management Units as well as general management measures which apply to the aquatic ecosystem as a whole. 4 GENERAL IMPORTANCE OF THE PROPOSED POWERLINE ROUTE 4.1 Ecoregions When assessing the ecology of any area (aquatic or terrestrial), it is important to know which ecoregion the proposed powerline route is located within. This knowledge allows for improved interpretation of data to be made, since reference information and representative species lists are often available on this level of assessment to guide the assessment. The proposed powerline route falls within the Western Bankenveld Ecoregion and within the A21F quaternary catchment (Figure 4). Table 12: Summary of the ecological status of quaternary catchment A21F based on Kleynhans Catchment Resource EIS PESC DEMC A21F Magalies River Moderate CLASS B CLASS C: Moderately Sensitive Systems The points below summarise the impacts on the aquatic resources in A21F quaternary catchment (Kleynhans 1999): The aquatic resources within this quaternary catchment have been significantly affected by med modification. Significant flow modifications have taken place. Significant impacts have occurred as a result of introduced instream biota such as Oncorhynchys mykiss and Cyprinus carpio. Impact due to inundation is significant. Riparian zones and stream bank conditions are considered to be highly impacted on due to cultivated land in the area and exotics. An impact on the aquatic community, due to altered water quality, is deemed to affect the catchment significantly. In terms of ecological functions, importance and sensitivity, the following points summarise the conditions of riverine systems in the A21F catchment: Moderate diversity of habitat types. 23
31 Little importance in terms of conservation. Significant sensitivity to flow requirements especially effecting Chiloglanis pretoriae and Amphilius uranoscopus. Little importance in terms of migration of aquatic species. Insignificant in terms of rare and endemic species conservation. The ecology of the riverine resources is not considered to be sensitive to changes in water quality. Significant importance as a source of refugia for aquatic species. The catchment is considered to be sensitive to water flow changes. The catchment has a significant importance in term of species richness in the area. 24

32 Figure 4: The Aquatic Ecoregion and quaternary catchment associated with the proposed powerline route. 25
33 4.2 Importance According to the Gauteng Conservation Plan (V3) and North West Province C Plan The Gauteng Conservation Plan 2014 (C-plan version 3.3) focuses on the mapping of biodiversity priority areas within Gauteng, compiled by the Gauteng Department of Agricultural and Rural Development (GDARD). Therefore, the C-Plan 3.3 was consulted in order to determine sitespecific issues and areas considered sensitive. The following features are indicated for the study area: The proposed powerline is located within an Ecological Support Area (ESA) as well as the Critical Biodiversity Area (CBA) as indicated in Figure 5; 26

34 Figure 5: Ecological Support Areas and Critical Biodiversity Areas associated with the proposed powerline route, according to the North West and the Gauteng C-Plan. 27
35 4.3 National Freshwater Ecosystem Priority Areas (NFEPA) (2011) The NFEPA database was consulted with regards to areas in close proximity to or traversed by the proposed powerline route that may be of ecological importance. Aspects applicable to the proposed powerline route are discussed below: The proposed powerline route falls within the Crocodile (West) and Marico Water Management Area (WMA). Each Water Management Area is divided into several SubWater Management Areas (subwma) and the subwma indicated is the Upper Crocodile; According to the NFEPA database, both natural and artificial wetlands are present within close proximity to the proposed powerline route, and some are of these wetlands are intersected by the powerline development; The proposed powerline route traverses two rivers (Figure 6) namely: Magalies River, classified as a PES Class C (moderately modified); and Klein River, classified as a PES Class C (moderately modified). None of the rivers were recognised as flagship rivers; The subwma is not regarded important in terms of fish sanctuaries, rehabilitation or corridors; The subwma is not considered important in terms of translocation and relocation zones for fish; and The subwma is not listed as a fish Freshwater Ecosystem Priority Area (FEPA). 28

36 Figure 6: Rivers indicated by the NFEPA database associated with the proposed powerline route. 29
37 4.4 National Protected Area Expansion Strategy (NPAES, 2010) The goal of National Protected Area Expansion Strategy (NPAES) is to achieve cost effective protected area expansion for ecological sustainability and adaptation to climate change. The NPAES sets targets for protected area expansion, provides maps of the most important areas for protected area expansion, and makes recommendations on mechanisms for protected area expansion. It deals with land-based and marine protected areas across all of South Africa s territory (SANBI BGIS). According to the NPAES database the alternative powerline 2 is located 100m north of the Cradle of Humankind World Heritage Site as presented in Figure 7 below. 4.5 Biome and Bioregion Biomes are broad ecological units that represent major life zones extending over large natural areas (Rutherford, 1997). The proposed powerline route falls within the Savanna biome. Biomes are further divided into bioregions, which are spatial terrestrial units possessing similar biotic and physical features, and processes at a regional scale. The proposed powerline route is situated within the Central Bushveld Bioregion (Mucina & Rutherford, 2006). 4.6 Vegetation type and Landscape Characteristics While biomes and bioregions are valuable as they describe broad ecological patterns, they provide limited information on the actual species that are expected to be found in an area. Knowing which vegetation type an area belongs to provides an indication of the floral composition that would be found if the assessment site was in a pristine condition, which can then be compared to the observed floral list and so give an accurate and timely description of the ecological integrity of the assessment site. When the proposed development is superimposed on the vegetation types of the surrounding area it is clear that the proposed development falls within the Central Sandy Bushveld and Zeerust Thornveld vegetation type (Mucina & Rutherford, 2006). 30

38 Figure 7: The NPAES database indicating the formally protected area in the vicinity of the proposed powerline route. 31
39 5 RESULTS: WETLAND ASSESSMENT 5.1 Wetland and Riparian System Characterisation The wetland and river features identified during the site visit can be divided into four Hydrogeomorphic Units (HGM units) namely rivers, artificial dams considered as depressions for the purposes of this study, unchannelled valley bottom wetlands and artificial channels representative of channelled valley bottom wetlands. The approximate location of the features is shown in Figures 8-10 below. Table 13: Characterisation of the wetland and river features intersected by the proposed powerline route, according to the Classification System (Ollis et al., 2013). Feature River 1 Level 1: System Inland: An ecosystem that has no existing connection to the ocean but which is inundated or saturated with water, either permanently or periodically. Level 2: Regional Setting Ecoregion: The powerline development falls within the Western Bankenveld Ecoregion. NFEPA WetVeg Group: Central Bushveld Group 5 (Vulnerable) Level 3: Landscape unit Valley floor: The typically gently sloping, lowest surface of a valley Level 4: Hydrogeomorphic (HGM) unit HGM Type River: A linear landform with clearly discernible bed and banks, which permanently or periodically carries a concentrated flow of water River 2 Inland: An ecosystem that has no existing connection to the ocean but which is inundated or saturated with water, either permanently or periodically. Ecoregion: The powerline development falls within the Western Bankenveld Ecoregion. NFEPA WetVeg Group: Central Bushveld Group 5 (Vulnerable) and Central Bushveld Group 1(Critically Endangered) Valley floor: The typically gently sloping, lowest surface of a valley River: A linear landform with clearly discernible bed and banks, which permanently or periodically carries a concentrated flow of water Unchannelled valley bottom Inland: An ecosystem that has no existing connection to the ocean but which is inundated or saturated with water, either permanently or periodically. Ecoregion: The powerline development falls within the Western Bankenveld Ecoregion. NFEPA WetVeg Group: Central Bushveld Group 5 (Vulnerable) and Central Bushveld Group 1(Critically Endangered) Valley floor: The typically gently sloping, lowest surface of a valley Unchannelled valley bottom: A valley bottom wetland without a river channel running through it. 32
40 Channel 2 River 1 Channel 1 Dam 1 Figure 8: Location of wetlands and river features identified in close proximity of the proposed powerline route 33
41 Dam 2 Channel 3 Dam 5 Previously mined area Dam 6 Figure 9: Location of wetlands and river features identified in close proximity of the proposed powerline route. 34
42 Dam 3 Unchannelled valley bottom Dam 4 River 2 Figure 10: Location of wetlands and river features identified in close proximity of the proposed powerline route. 35

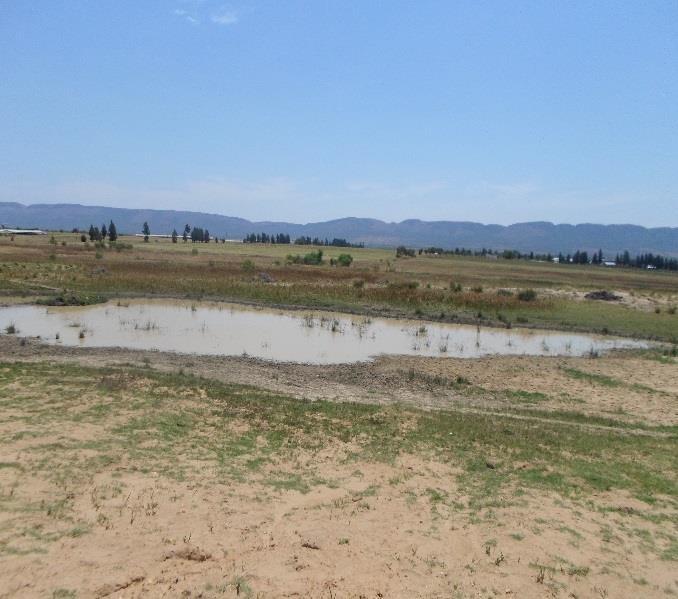
43 The SAS August 2014 NATURAL FEATURES For the purposes of this study only the naturally occurring features were assessed. These features include one unchannelled valley bottom wetland, River 1 and River 2. Unchannelled valley bottom wetland The unchannelled valley bottom wetland was situated on the eastern portion of the proposed powerline route and had two impoundments, one of which was located upstream whereas the other was located downstream. Imperata cylindrica as illustrated in Figure 11 below. Figure 11: Imperata cylindrica observed within the unchannelled valley bottom wetland. River 1 and River 2 Both rivers had low vegetation cover, however there was limited erosion observed mainly as a result of livestock grazing and trampling within certain areas. 36


44 River 1 River 2 Figure 12: Representative photographs of the rivers identified. ARTIFICIAL FEATURES Dams Most of the dams observed during site visit were created due to excavations and soil dumping as a result of historical mining activities. Therefore these features did not form part of the assessment since they are artificial. There was a pump observed where dam 1 was located, therefore it was definitely being used for irrigation purposes. Dam 2 might have been anthropogenically formed for irrigation purposes, however from what was observed on site, water was being pumped into the dam instead of being abstracted. Where Dam 5 is located seems to have been a channelled valley bottom wetland previously and was transformed into a leisure park. The figures below illustrates all artificial dams observed during site visit. 37

45 Dam 1 Dam 2 Dam 3 Dam 4 38

46 Dam 5 Figure 13: Representative photographs of the dams identified in field. Previously mined area There was a previously mined area observed on site. The area was mainly dominated by Eucalyptus tree spp as well as wetland species such as Canna indica, Zantedeschia aethiopia, Imperata cylindrica and Typha capensis. The figure below is the representation of the area and vegetation observed. 39

47 Figure 14: Representative photographs of the previously mined are. Artificial channels Three artificial channels were observed and may have been formed to intercept water for irrigation purposes. None of the channels displayed wetland characteristics as defined by DWA 2005, therefore they were not considered as natural wetlands. The figures below represents the channels observed. 40


48 Channel 1 Channel 2 Channel 3 Figure 15: Representative photographs of the channels identified in field 41
49 5.2 Wetland Function Assessment The ecosystem function and service provision assessment of each wetland and river feature were assessed utilising the WET-Ecoservices (Kotze et al. 2009) method as previously described. The results of the assessment are tabulated below and presented in the radar plot in Figure
50 Table 14: Functions and service provision for the HGM units identified. Ecosystem services River 1 River 2 Unchannelled valley bottom Flood attenuation 1 1,6 1,4 Streamflow regulation 1,4 1,2 1,4 Sediment trapping 1,8 1,4 1,6 Phosphate assimilation 1,4 1 2,4 Nitrate assimilation 1,1 1 2,1 Toxicant assimilation 1,6 1,1 2,6 Erosion control 1,7 2 2,7 Carbon Storage 2 1,7 1,3 Biodiversity maintenance 1,3 1,1 1 Water Supply 0,8 0,5 0,8 Harvestable resources 0 0 0,2 Cultural value Cultivated foods Tourism and recreation Education and research SUM 14,1 12,6 17,5 Average score 0,9 0,8 1,2 43
51 Ecosystem Services River 1 River 2 Unchannelled valley bottom Education and research Tourism and recreation Cultivated foods Cultural value Flood attenuation Streamflow regulation Sediment trapping Phosphate assimilation Nitrate assimilation Harvestable resources Toxicant assimilation Water Supply Erosion control Biodiversity maintenance Carbon Storage Figure 16: Radar plot of services provided by the of the HGM units identified in field The features had no importance in terms of direct services provision (harvestable resources, cultural value, cultivated foods, tourism and recreation as well as education and research), this is due to the location and inaccessibility of the features. River 1 The feature obtained an average score of 0.9 which implies that the feature is able to provide ecological services and functioning at a moderately low level. The riparian vegetation was low at the time of the assessment. This affected the ability of the feature to trap sediments and slow down the flow of water in the riparian zone. Although the vegetation and surface roughness was low, the feature was not significantly eroded, and this can 44
52 be due to the low runoff intensity of the soil. Sediment deposited within the feature was from the horse stable adjacent the feature as well as a few agricultural activities downstream. The fence across the river as well as a bridge that collapsed inside the river channel caused an obstruction to water flow, and resulted in an intermediate score for biodiversity maintenance. The feature has moderately low importance for flood attenuation. River 2 The feature obtained an average score of 0.8 which implies that the feature is able to provide ecological services and functioning at a moderately low level. The upper portion of the feature was dry as compared to the lower portion which had a permanent zone. In addition there was evidence of livestock trampling observed within the feature, which has led to the reduction of vegetation cover. Due to land use activities such as mining and agriculture, water quality is expected to be low. The feature obtained a moderately score for biodiversity maintenance, and this is mainly due to the low vegetation cover within the feature as well as obstructive infrastructure noted such as roads, fences and powerlines. Although the feature is intermediately channelled upstream, water is still able to overtop the banks. However, the downstream portion was extremely incised and wide making it impossible for water to overtop the banks, hence there was no evidence of wetland conditions. For phosphate assimilation, nitrate assimilation, and toxicant assimilation, the feature obtained a moderately low score, due to the low vegetation cover. Unchannelled Valley Bottom The feature obtained an average score of 1.2 which implies that the feature is able to provide ecological services and functioning at a moderately low level. The feature has high vegetation cover which plays an important role in trapping sediments and toxicants, hence the moderately high score for water quality enhancement services. Agricultural activities, historical mining activities as well as current mining activity surrounding the feature, contributes to sediment and toxicant deposition, however due to the presence of dams on the upper and the lower portions of the feature, not much sediment was observed within the wetland. 45
53 Regardless of the high vegetation cover and overall good ecological condition of the wetland, the feature obtained a moderately low biodiversity maintenance score, mainly as a result of the low indigenous vegetation cover extent around the wetland zone as well as the modification of the sediment regime, hydrological regime and water quality regime. The feature has intermediate importance in terms of sediment trapping, stream flow regulation and flood attenuation, this can be attributed to the diffuse nature of the feature as well as vegetation cover. 5.3 WET-Health Assessment Due to the limited time available on site to assess the wetland features, a Level 1 WET-Health assessment was applied to the unchannelled valley bottom wetland to assess its integrity. Three modules were assessed, namely hydrology, geomorphology and vegetation. The results of this assessment are summarised in the table below. Table 15: Summary of results of the WET-Health Assessment. Feature Unchannelled Valley Bottom Impact Score Hydrology Geomorphology Vegetation Change Score Impact Score Change Score Impact Score Change Score Overall PES Category D B C C Unchannelled Valley Bottom The feature obtained a score that falls within category C (moderately modified) which implies that moderate change in ecosystem processes and loss of natural habitat has taken place but the natural habitat remains predominantly intact. The hydrology of the feature has been largely modified by the creation of the two dams both upstream and downstream of the feature, as well as the presence of the road adjacent the feature which increases water input. All these activities will alter the natural hydrological regime as well as vegetation structure overtime In addition, agricultural activities and mining activities neighbouring the feature contributes to sediment deposition which further modifies the geomorphology. The vegetation of this feature was modified by vegetation clearing during the creation of the dams, however indigenous vegetation is still persistent and abundant in a large portion of the wetland. 46
54 5.4 Index of habitat integrity (IHI) The protocol Index of Habitat Integrity (IHI) for South African floodplain and channelled valley bottom wetland types (Department of Water Affairs and Forestry Resource Quality Services, 2007) was used to assess the rivers observed on site. Table 16: The overall PES score for the rivers. Wetland Hydrology Geomorphology Water Quality Vegetation Overall Score PES Category River 1 C C C C 1.5 C River 2 C/D C D C 1.6 C River 1 The river obtained an overall score that indicates that the feature falls within the PES Category C (moderately modified), this implies that there has been loss and change of natural habitat and biota, but the basic ecosystem functions are still predominantly unchanged. The geomorphology of the feature has been moderately modified by the creation of a drain that is located on the west, parallel to the feature. In addition there was a bare area with a horse stable adjacent the feature which contributed to sediment deposition within the feature. The hydrology of the feature has been modified by the presence of a concrete bridge that collapsed. The obstruction altered the normal velocities and flow patterns within the feature. Although the vegetation cover within this feature was low, the expected water quality was moderately modified due to sediment deposition into the river. River 2 The river obtained an overall score that indicates that the feature falls within the PES Category C which is moderately modified. There was channel widening observed upstream of the feature, and this was due to minor bank erosion observed. This activity led to the moderate modification of the geomorphology of the feature. In addition, livestock trampling and grazing resulted in the alteration of the geomorphology as well as low vegetation cover. Due to the presence of a tar road and a bridge, there was increased water input downstream of this feature, and with sediment from the cultivated land water quality could be low. 47
55 5.5 Riparian Vegetation Response Assessment Index (VEGRAI) Table 17: The overall VEGRAI score rivers. Feature VEGRAI % VEGRAI EC Marginal Weighted Non-Marginal Weighted Rating Rating River C River C The scores attained for the VEGRAI assessment indicates that both features fall within Ecological Category C. The assessments indicates that the riparian vegetation has been moderately modified, and loss and change of natural habitat have occurred, but the basic ecosystem functions are still predominately unchanged. The non-woody component has undergone a higher degree of transformation in both the marginal and non-marginal zones. The main cause of vegetation modification is the presence of agricultural fields as well as invasion of alien species such as Melia azedarach and Asparagus laricinus 5.6 Ecological Importance and Sensitivity (EIS) The EIS was applied to all features in order to ascertain the levels of ecological importance and sensitivity associated with each crossing, and to inform in part the REC. The results of this assessment are presented below. 48
56 Table 18: The EIS score for the features that will be intercepted by the proposed powerline route. Determinant Channelled Valley River 1 River 2 Bottom Score Confidence Score Confidence Score Confidence PRIMARY DETERMINANTS 1. Rare & Endangered Species Populations of Unique Species Species/taxon Richness Diversity of Habitat Types or Features Migration route/breeding and feeding site for wetland species 6. PES as determined by WET Health /IHI assessment 7. Importance in terms of function and service provision MODIFYING DETERMINANTS 8. Protected Status according to NFEPA Wetveg Ecological Integrity TOTAL MEAN OVERALL EIS C C C As can be seen from these results, all features obtained scores that falls within EIS category C (moderate), which implies that the features are considered to be ecologically important and sensitive on a provincial or local scale. However, the biodiversity of these features is not usually sensitive to flow and habitat modifications. 49
57 5.7 Recommended Ecological Category (REC) The REC for the wetland and river systems that would be intercepted by the proposed powerline route was determined, taking into consideration the results of the eco services and function, WET- Health and/or IHI assessments as well as the EIS assessments. All features assessed undergone moderate levels of transformation, overall they are considered to provide ecoservices at a moderately low level. Therefore, a REC Category C was assigned to all the features assessed in order to ensure the maintenance of present levels of ecological services and functioning of the wetland and rivers are retained. None of the wetland and rivers should be permitted to deteriorate any further. 5.8 Wetland and Riparian Area Delineation and Sensitivity Mapping During the assessment, the following indicators were used to ascertain the boundaries of the temporary zones of the wetland and river features: Terrain units were used to determine in which parts of the landscape the wetland features are most likely to occur. The features occur within a valley floor landscape unit; Vegetation was used to identify the wetland boundary through the identification of the distribution of both facultative and obligate wetland vegetation associated with soils that are frequently saturated; Saturated soils were not present in all wetland features, however, it was noted and taken into consideration in areas where it was observed; Any activities proposed within the wetland or river boundaries, including rehabilitation, must be authorised by the DWA in terms of Section 21 (c) & (i) of the National Water Act (Act 36 of 1998). The mitigation measures as provided, if implemented in conjunction with the mitigatory measures outlined in Section 9.1, are considered sufficient to maintain the PES and to achieve the REC determined following the assessment. The wetland and river delineation and associated 32m buffer zone are conceptually presented in Figures below. 50

58 TB TD Figure 17: Wetland delineations with associated buffer zones. 51

59 Figure 18: Wetland delineations with associated buffer zones. 52

60 Figure 19: Wetland delineations with associated buffer zones. 53
1.7.0 Floodplain Modification Criteria
 1.7.0 Floodplain Modification Criteria 1.7.1 Introduction These guidelines set out standards for evaluating and processing proposed modifications of the 100- year floodplain with the following objectives:
Guideline: Works that interfere with water in a watercourse watercourse diversions. September 2014
 Guideline: Works that interfere with water in a watercourse watercourse diversions September 2014 This publication has been compiled by the Department of Natural Resources and Mines. State of Queensland,
GLOSSARY OF TERMS CHAPTER 11 WORD DEFINITION SOURCE. Leopold
 CHAPTER 11 GLOSSARY OF TERMS Active Channel The channel that contains the discharge Leopold where channel maintenance is most effective, sediment are actively transported and deposited, and that are capable
Macro water sharing plans the approach for unregulated rivers
 Macro water sharing plans the approach for unregulated rivers Access and trading rules for pools Leading policy and reform in sustainable water management Publisher NSW Office of Water Level 18, 227 Elizabeth
Description of Simandou Archaeological Potential Model. 13A.1 Overview
 13A Description of Simandou Archaeological Potential Model 13A.1 Overview The most accurate and reliable way of establishing archaeological baseline conditions in an area is by conventional methods of
Payments for Ecosystem Services: towards improved biodiversity conservation and water security in South Africa, a semi-arid, developing country
 Payments for Ecosystem Services: towards improved biodiversity conservation and water security in South Africa, a semi-arid, developing country Jane Turpie & James Blignaut Introduction Ecosystems largely
Interim Technical Guidelines for the Development of Environmental Management Plans for Underground Infrastructure Revised - July 2013.
 Interim Technical Guidelines for the Development of Environmental Management Plans for Underground Infrastructure Revised - July 2013 Rationale Underground infrastructure may be at risk from valley, streambank
5.0 ENVIRONMENTAL IMPACT ASSESSMENT METHODS
 5.0 ENVIRONMENTAL IMPACT ASSESSMENT METHODS The methods that are used to conduct the environmental impact assessment (EIA) of the Project are described in this section. The EIA uses a methodological framework
Integrated Restoration Prioritization
 Integrated Restoration Prioritization Habitat Restoration and Environmental Monitoring Projects Section Restoration Services Division Definition Restoration Prioritization is a process of combining various
Restoration Planning and Development of a Restoration Bank
 Restoration Planning and Development of a Restoration Bank Black Creek Pioneer Village, South Theatre 8:30 a.m. to 3:30 p.m. Habitat Restoration and Environmental Monitoring Projects Section Restoration
How To Get A Degree In Environmental Science
 CAPACITYFORCATCHMENTS UMNGENIECOLOGICAL INFRASTRUCTUREPROJECT COURSESANDWORKSHOPSFORABETTERUMNGENICATCHMENT WESSA,inpartnershipwithWWFandfundedbytheMaasMaasenFund,isimplementinga capacitydevelopmentprojectintheumngenicatchmentinkzn.ingrowingthiswork,wehave
33 CFR PART 332 COMPENSATORY MITIGATION FOR LOSSES OF AQUATIC RESOURCES. Authority: 33 U.S.C. 401 et seq. ; 33 U.S.C. 1344; and Pub. L. 108 136.
 33 CFR PART 332 COMPENSATORY MITIGATION FOR LOSSES OF AQUATIC RESOURCES Authority: 33 U.S.C. 401 et seq. ; 33 U.S.C. 1344; and Pub. L. 108 136. Source: 73 FR 19670, Apr. 10, 2008, unless otherwise noted.
Rhode Island NRCS received approximately $2.4 million in ARRA funds to implement four floodplain easement projects.
 American Recovery and Reinvestment Act (ARRA) Emergency Watershed Protection Program Floodplain Easements Rhode Island Natural Resources Conservation Service Rhode Island NRCS received approximately $2.4
1 Introduction. 1.1 Key objective. 1.2 Why the South Esk
 1 Introduction 1.1 Key objective The aim of this study is to identify and assess possible options for improving the quality of the river channel and habitats in the River South Esk catchment whilst helping
River Wensum Restoration Strategy Swanton Morley Restoration Scheme Reach 14a
 River Wensum Restoration Strategy Swanton Morley Restoration Scheme Reach 14a At a glance River restoration benefits: Improved planform, channel cross-section, flow variation and sediment process. Improved
General Permit for Activities Promoting Waterway - Floodplain Connectivity [working title]
![General Permit for Activities Promoting Waterway - Floodplain Connectivity [working title]](/thumbs/39/18645965.jpg "General Permit for Activities Promoting Waterway - Floodplain Connectivity [working title]") General Permit for Activities Promoting Waterway - Floodplain Connectivity [working title] Purpose These rules set forth the conditions under which a person may, without an individual removal-fill permit
General Permit for Activities Promoting Waterway - Floodplain Connectivity [working title] Purpose These rules set forth the conditions under which a person may, without an individual removal-fill permit
1 in 30 year 1 in 75 year 1 in 100 year 1 in 100 year plus climate change (+30%) 1 in 200 year
 1 in 200 year") Appendix C1 Surface Water Modelling 1 Overview 1.1 The Drain London modelling was designed to analyse the impact of heavy rainfall events across each London borough by assessing flow paths, velocities
Appendix C1 Surface Water Modelling 1 Overview 1.1 The Drain London modelling was designed to analyse the impact of heavy rainfall events across each London borough by assessing flow paths, velocities
Earth Science. River Systems and Landforms GEOGRAPHY 1710. The Hydrologic Cycle. Introduction. Running Water. Chapter 14.
 Earth Science GEOGRAPHY 1710 River Systems and Landforms DAVID R. SALLEE Robert W. Christopherson Charlie Thomsen Chapter 14 Introduction Rivers and streams are dynamic systems that continually adjust
WILLOCHRA BASIN GROUNDWATER STATUS REPORT 2009-10
 WILLOCHRA BASIN GROUNDWATER STATUS REPORT 2009-10 SUMMARY 2009-10 The Willochra Basin is situated in the southern Flinders Ranges in the Mid-North of South Australia, approximately 50 km east of Port Augusta
Guide to agrichemical use in Resource Management Plans Northland Region as at October 2011
 Guide to agrichemical use in Resource Management Plans Northland Region as at October 2011 Northland Regional Air Quality Plan Note: This guide is intended to assist users and applicators understanding
March 2008. Prepared by: Irvine Ranch Water District. 15600 Sand Canyon Avenue. Irvine, CA 92618. Contact: Natalie Likens (949) 453-5633
 453-5633") ADDENDUM TO THE MICHELSON WATER RECLAMATION PLANT PHASE 2 & 3 CAPACITY EXPANSION PROJECT FEBRUARY 2006 FINAL ENVIRONMENTAL IMPACT REPORT AND THE SAN JOAQUIN FRESHWATER MARSH ENHANCEMENT PLAN REVISED SEPTEMBER
ADDENDUM TO THE MICHELSON WATER RECLAMATION PLANT PHASE 2 & 3 CAPACITY EXPANSION PROJECT FEBRUARY 2006 FINAL ENVIRONMENTAL IMPACT REPORT AND THE SAN JOAQUIN FRESHWATER MARSH ENHANCEMENT PLAN REVISED SEPTEMBER
London Borough of Waltham Forest LOCAL FLOOD RISK MANAGEMENT STRATEGY. Summary Document
 LOCAL FLOOD RISK MANAGEMENT STRATEGY Summary Document October 2013 Local Flood Risk Management Strategy Summary 1 Introduction 2 Partner responsibilities 3 What do we know about flooding in the borough?
CLARIFICATION OF WETLAND SOIL CRITERIA FOR HUMAN-ALTERED AND HUMAN-TRANSPORTED SOILS IN CONNECTICUT
 Natural Resources Conservation Service Connecticut Department of Energy and Environmental Protection CLARIFICATION OF WETLAND SOIL CRITERIA FOR HUMAN-ALTERED AND HUMAN-TRANSPORTED SOILS IN CONNECTICUT
1. Purpose and scope. 2. SEPA's role in hydropower and planning
 Page no: 1 of 10 1. Purpose and scope 1.1 The purpose of this note is to provide guidance on the approach that we will take when dealing with hydropower development management consultations. We welcome
MANAGEMENT STANDARD CLOSURE PLANNING
 AngloGold Ashanti Limited \ Reg. No.1944/017354/06 76 Jeppe Street \ Newtown \ 2001 \ PO Box 62117 \ Marshalltown \ 2107 \ South Africa Tel +27 (0)11 637 6000 \ Fax +27 (0)11 637 6624 \ Website: www.anglogoldashanti.com
APPLICATION OF GEOSPATIAL TECHNOLOGIES FOR SUSTAINABLE ENVIRONMENTAL MANAGEMENT
 APPLICATION OF GEOSPATIAL TECHNOLOGIES FOR SUSTAINABLE NATURAL RESOURCES AND ENVIRONMENTAL MANAGEMENT IN MALAYSIA By James Dawos Mamit, Ph.D. Deputy Minister Ministry of Natural Resources and Environment,
23.1 RENEWABLE ENERGY
 Proposed Hastings District Plan as Amended 23.1 Renewable Energy 23.1 RENEWABLE ENERGY 23.1.1 INTRODUCTION The use of energy is of fundamental importance to the function and development of our society.
IUCN Guidelines to Avoid Impacts of Water Resources Projects on Dams and Other Water Infrastructure
 IUCN Guidelines to Avoid Impacts of Water Resources Projects on Dams and Other Water Infrastructure (December 2013) IUCN does not engage in projects which involve the design, construction or rehabilitation
Gold Ray Dam Interagency Technical Team Meeting
 Gold Ray Dam Interagency Technical Team Meeting Agenda Public Outreach, Funding, Monitoring EA/BA/Permit Updates Deconstruction Plans Fish Passage & Salvage Plan Hydraulic Modeling Next Steps Public Outreach,
Draft Environmental Impact Statement. PORT OF OSWEGO AUTHORITY Lead Agency, State Environmental Quality Review Act
 CENTERSTATE NY INLAND PORT DRAFT SCOPING DOCUMENT FOR THE Draft Environmental Impact Statement PORT OF OSWEGO AUTHORITY Lead Agency, State Environmental Quality Review Act SEPTEMBER 30, 2015 INTRODUCTION
BB CONSTRAINTS MAPPING
 BB CONSTRAINTS MAPPING ENTER HERE BACK TO CONTENTS The Bowen Gas Project (the Project) constraints analysis has been developed to support the environmental framework approach as detailed in the Environmental
ENVIRONMENTAL IMPACT ASSESSMENTS AND ENVIRONMENTAL IMPACT STATEMENTS
 GOVERNMENT OF BERMUDA Department of Planning ENVIRONMENTAL IMPACT ASSESSMENTS AND Section 1: Introduction... 2 Section 2: What are Environmental Impact Assessments and Environmental Impact Statements and
Water Forever: South West Margaret River Forum
 Questions from the MRREC 1. How much water is currently being taken from each well/bore and region in the South West? This is a question for the water regulator the Department of Water. Please note information
BEST PRACTICE NOTE LANDSCAPE ASSESSMENT AND SUSTAINABLE MANAGEMENT 10.1 NZILA. Members Documentation
 BEST PRACTICE NOTE LANDSCAPE ASSESSMENT AND SUSTAINABLE MANAGEMENT 10.1 NZILA Members Documentation Background In August 2008, the New Zealand Institute of Landscape Architects (NZILA) Education Foundation
4.2 Buena Vista Creek Watershed
 Buena Vista Creek Watershed 4.2 Buena Vista Creek Watershed Watershed Overview The Buena Vista Creek Watershed is the fourth-largest system within the Carlsbad Hydrologic Unit. The watershed extends approximately
ENVIRONMENT ACT PROPOSED TERMS OF REFERENCE FOR PUBLIC REVIEW AND COMMENT NOVA SCOTIA DEPARTMENT OF TRANSPORTATION AND PUBLIC WORKS
 ENVIRONMENT ACT PROPOSED TERMS OF REFERENCE FOR PUBLIC REVIEW AND COMMENT NOVA SCOTIA DEPARTMENT OF TRANSPORTATION AND PUBLIC WORKS Beaver Bank Bypass Highway 101 to the Beaver Bank Road Halifax County,
Origins and causes of river basin sediment degradation and available remediation and mitigation options. Feedback from the Riskbase workshop
 Origins and causes of river basin sediment degradation and available remediation and mitigation options Feedback from the Riskbase workshop Corinne Merly 1, Olivier Cerdan 1, Laurence Gourcy 1 Emmanuelle
How To Manage Water Resources
 NB: Unofficial translation; legally binding texts are those in Finnish and Swedish Ministry of the Environment, Finland Government Decree on Water Resources Management (1040/2006) Given in Helsinki on
INDONESIA - LAW ON WATER RESOURCES,
 Environment and Development Journal Law LEAD INDONESIA - LAW ON WATER RESOURCES, 2004 VOLUME 2/1 LEAD Journal (Law, Environment and Development Journal) is a peer-reviewed academic publication based in
Green Infrastructure Case Study Template
 Green Infrastructure Case Study Template The aim of the exercise is to provide information on how the elements of the Green Infrastructure Strategy are implemented at national level and to provide case
Proposed Terms of Reference for EIA studies
 1 Proposed Terms of Reference for EIA studies Base line data collection will be collected for the Post-Monsoon season 2016 (September to November 2016) in study area and 10 kms radius from project site.
Environmental Guidelines for Preparation of an Environmental Management Plan
 2013 Environmental Guidelines for Preparation of an Environmental Management Plan Environmental Management Division Environmental Protection Agency 3/13/2013 ENVIRONMENTAL GUIDELINES FOR PREPARATION OF
Official Journal of the European Communities. (Acts whose publication is obligatory)
") 22.12.2000 L 327/1 I (Acts whose publication is obligatory) DIRECTIVE 2000/60/EC OF THE EUROPEAN PARLIAMT AND OF THE COUNCIL of 23 October 2000 establishing a framework for Community action in the field
22.12.2000 L 327/1 I (Acts whose publication is obligatory) DIRECTIVE 2000/60/EC OF THE EUROPEAN PARLIAMT AND OF THE COUNCIL of 23 October 2000 establishing a framework for Community action in the field
EU China River Basin Management Programme
 Ministry of Water Resources Ministry of Environmental Protection EU China River Basin Management Programme Technical Report 075 Water Resource Supply Security Strategy Analysis Ben Piper, Zhang Wang and
Broken Arrow Public Schools AP Environmental Science Objectives Revised 11-19-08
 1 st six weeks 1 Identify questions and problems that can be answered through scientific investigation. 2 Design and conduct scientific investigations to answer questions about the world by creating hypotheses;
ENVIRONMENTAL AND SOCIAL RISK ASSESSMENT IN LENDING
 ENVIRONMENTAL AND SOCIAL RISK ASSESSMENT IN LENDING Barclays has a strong and longstanding commitment to managing the environmental and social risks associated with commercial lending. We recognise that
approval of matters specified in conditions; and The Town and Country Planning (Development Management Procedure) (Scotland) Regulations 2013
 (Scotland) Regulations 2013") Application for: planning permission; planning permission in principle; further applications; approval of matters specified in conditions; and mineral workings (if the planning authority do not have a
Application for: planning permission; planning permission in principle; further applications; approval of matters specified in conditions; and mineral workings (if the planning authority do not have a
Designed and produced by geo-graphicsdesign.com DP 300 3/02
 Designed and produced by geo-graphicsdesign.com DP 300 3/02 Guidance for Developers and Regulators Purpose This booklet is produced on behalf of the North East Scotland Flooding Advisory Group and is intended
Appendix C - Risk Assessment: Technical Details. Appendix C - Risk Assessment: Technical Details
 Appendix C - Risk Assessment: Technical Details Page C1 C1 Surface Water Modelling 1. Introduction 1.1 BACKGROUND URS Scott Wilson has constructed 13 TUFLOW hydraulic models across the London Boroughs
Catchment Scale Processes and River Restoration. Dr Jenny Mant Jenny@therrc.co.uk. The River Restoration Centre therrc.co.uk
 Catchment Scale Processes and River Restoration Dr Jenny Mant Jenny@therrc.co.uk The River Restoration Centre therrc.co.uk 3 Main Catchment Elements Hydrology Energy associated with the flow of water affects
Basics of Sustainability. Environmental Impact Assessments (EIA)
") Basics of Sustainability 8 Environmental Impact Assessments (EIA) 1 Contents Page Aims... 2 Introduction... 3 The Objectives of EIAs... 3 Developments that Require an EIA... 4 Key Stages of an EIA... 6
Basics of Sustainability 8 Environmental Impact Assessments (EIA) 1 Contents Page Aims... 2 Introduction... 3 The Objectives of EIAs... 3 Developments that Require an EIA... 4 Key Stages of an EIA... 6
RE: Docket # COE 2010 0035; ZRIN 0710 ZA05 Submitted via email to NWP2012@usace.army.mil and Rulemaking Portal at www.regulations.gov.
 April 18, 2011 U.S. Army Corps of Engineers Attn: CECW CO R 441 G Street, N.W. Washington, DC 20314 1000 RE: Docket # COE 2010 0035; ZRIN 0710 ZA05 Submitted via email to NWP2012@usace.army.mil and Rulemaking
FLOOD PLAIN DESIGNATION AND PROTECTION
 CITY OF RICHMOND FLOOD PLAIN DESIGNATION AND PROTECTION BYLAW NO. 8204 EFFECTIVE DATE - SEPTEMBER 8, 2008 CONSOLIDATED FOR CONVENIENCE ONLY This is a consolidation of the bylaws listed below. The amendment
Floodplain Connectivity in Restoration Design
 Floodplain Connectivity in Restoration Design 2015 Symposium on Restoration in a Contaminated Environment: Lessons Learned and Challenges in Moving Forward Part II April 2015 Karin Boyd Applied Geomorphology,
MULTI-AGENCY COMPENSATORY MITIGATION PLAN CHECKLIST 1
 MULTI-AGENCY COMPENSATORY MITIGATION PLAN CHECKLIST 1 Mitigation Goals and Objectives o Describe functions lost at impact site o Describe functions to be gained at mitigation site o Describe overall watershed
BLACK/HARMONY/FAREWELL CREEK WATERSHED EXISTING CONDITIONS REPORT CHAPTER 12 - STORMWATER MANAGEMENT
 Harmony Creek subwatershed Harmony Creek subwatershed BLACK/HARMONY/FAREWELL CREEK WATERSHED EXISTING CONDITIONS REPORT CHAPTER 12 - STORMWATER MANAGEMENT April 2011 TABLE OF CONTENTS 1.0 INTRODUCTION...
LYNDE CREEK WATERSHED EXISTING CONDITIONS REPORT CHAPTER 12 - STORMWATER MANAGEMENT
 Whitby CLOCA Whitby CLOCA LYNDE CREEK WATERSHED EXISTING CONDITIONS REPORT CHAPTER 12 - STORMWATER MANAGEMENT June 2008 TABLE OF CONTENTS 1.0 INTRODUCTION... 3 2.0 STUDY AREA AND SCOPE... 4 3.0 METHODOLOGY...
CHAPTER 24: ENVIRONMENTAL MANAGEMENT
 Central Eyre Iron Project Environmental Impact Statement CHAPTER 24: ENVIRONMENTAL MANAGEMENT CHAPTER 24 ENVIRONMENTAL MANAGEMENT COPYRIGHT Copyright Iron Road Limited, 2015 All rights reserved This document
Vulnerability Assessment of New England Streams: Developing a Monitoring Network to Detect Climate Change Effects
 Vulnerability Assessment of New England Streams: Developing a Monitoring Network to Detect Climate Change Effects National Water Quality Monitoring Council 2012 Meeting Britta Bierwagen, National Center
Note on Draft Progress Report Template
 Note on Draft Progress Report Template The Draft Progress Report template is provided as a guide to applicants on possible reporting requirements for the Biodiversity Fund. This actual report will be provided
Explanatory Memorandum to the Conservation of Habitats and Species (Amendment) Regulations 2012
 Regulations 2012") Explanatory Memorandum to the Conservation of Habitats and Species (Amendment) Regulations 2012 This Explanatory Memorandum has been prepared by the Environment and Sustainable Development Department and
Explanatory Memorandum to the Conservation of Habitats and Species (Amendment) Regulations 2012 This Explanatory Memorandum has been prepared by the Environment and Sustainable Development Department and
720 Contour Grading. General. References. Resources. Definitions
 720 Contour Grading General Contour grading directs water to a desired point, prevents erosion, provides noise deflection, provides visual fit of the facility into the landscape, and protects desirable
LEAGUE NOTES ON APPROVED COMMUNITY WATER SUPPLY PLAN
 1 AUGUST 2011 LEAGUE NOTES ON APPROVED COMMUNITY WATER SUPPLY PLAN KEY ELEMENTS OF THE PLAN: 1. Replace the existing unsafe Ragged Mountain dam with a new dam and raise the reservoir pool level initially
Avison Management Services Ltd. COMPANY PROFILE
 Avison Management Services Ltd. COMPANY PROFILE Providing resource management through environmental leadership. Mission Statement: We are committed to providing high quality, timely, and cost effective
Sec. 22a-1a page 1 (4-97)
") Department of Environmental Protection Sec. 22a-1a page 1 (4-97) TABLE OF CONTENTS Connecticut Environmental Policy Act Definitions... 22a-1a- 1 Determination of sponsoring agency.... 22a-1a- 2 Determination
Department of Environmental Protection Sec. 22a-1a page 1 (4-97) TABLE OF CONTENTS Connecticut Environmental Policy Act Definitions... 22a-1a- 1 Determination of sponsoring agency.... 22a-1a- 2 Determination
REFERENCE. All National Grid personnel who plan and perform work involving protected water resources are responsible for:
 EG-30NY ENVIRONMENTAL GUIDANCE PAGE 1 of 9 DATE 10/1/10 EP 3 Natural Resource Protection 1.0 SCOPE AND RESPONSIBILITIES National Grid s New York service territory encompasses thousands of wetlands, lakes,
WETLAND RESTORATION PROGRAM WATER ACT APPROVAL ADMINISTRATIVE GUIDE
 WETLAND RESTORATION PROGRAM WATER ACT APPROVAL ADMINISTRATIVE GUIDE May 24, 2005 Table of Contents Introduction...3 Definitions...3 Types of Wetland Restorations...4 Re-Contouring...4 Engineered...4 Water
Protected Area Categories and Management Objectives
 Protected Area Categories and Management Objectives A protected area is defined as: An area of land and/or sea especially dedicated to the protection and maintenance of biological diversity, and of natural
CONNECTIVITY CONSERVATION AND ECOLOGICAL RESTORATION ADVENTURES IN A GLOBAL BIODIVERSITY HOTSPOT
 CONNECTIVITY CONSERVATION AND ECOLOGICAL RESTORATION ADVENTURES IN A GLOBAL BIODIVERSITY HOTSPOT A presentation addressing Aichi Targets: 5 By 2020, the rate of loss of all natural habitats, including
ENVIRONMENTAL IMPACT ASSESSMENT PROCESS PROPOSED PHASE 2 EXPANSION OF THE TRANSNET IRON ORE HANDLING FACILITY, SALDANHA
 ENVIRONMENTAL IMPACT ASSESSMENT PROCESS PROPOSED PHASE 2 EXPANSION OF THE TRANSNET IRON ORE HANDLING FACILITY, SALDANHA BACKGROUND INFORMATION DOCUMENT 1 BACKGROUND Transnet Limited s (Transnet) existing
DESIGN OF A DECISION SUPPORT SYSTEM AND SCENARIO GENERATOR FOR THE ASSESSMENT OF LAND USE IMPACTS ON WATER RESOURCES WITHIN A WATER MANAGEMENT AREA
 DESIGN OF A DECISION SUPPORT SYSTEM AND SCENARIO GENERATOR FOR THE ASSESSMENT OF LAND USE IMPACTS ON WATER RESOURCES WITHIN A WATER MANAGEMENT AREA April 2001 Prepared for DWAF/DFID STRATEGIC ENVIRONMENTAL
Biological Diversity and Tourism: Development of Guidelines for Sustainable Tourism in Vulnerable Ecosystems
 Biological Diversity and Tourism: Development of Guidelines for Sustainable Tourism in Vulnerable Ecosystems Secretariat of the Convention on Biological Diversity Foreword The rapid and often uncontrolled
Climate Change: A Local Focus on a Global Issue Newfoundland and Labrador Curriculum Links 2010-2011
 Climate Change: A Local Focus on a Global Issue Newfoundland and Labrador Curriculum Links 2010-2011 HEALTH Kindergarten: Grade 1: Grade 2: Know that litter can spoil the environment. Grade 3: Grade 4:
8.0 ENVIRONMENTAL PROTECTION MONITORING AND FOLLOW-UP
 8.0 ENVIRONMENTAL PROTECTION MONITORING AND FOLLOW-UP 8.1 INTRODUCTION Mitigation measures, monitoring and other follow-up actions identified in Chapter 7 (Environmental Effects Assessment and Mitigation)
QUESTIONS AND ANSWERS WATERS OF THE U.S. PROPOSAL
 QUESTIONS AND ANSWERS WATERS OF THE U.S. PROPOSAL Key Background Congress enacted the modern Clean Water Act in 1972 to address pollution entering the nation s waters to complement statutes such as the
Calculating Credits and Debits for Compensatory Mitigation in Wetlands of Western Washington
 Calculating Credits and Debits for Compensatory Mitigation in Wetlands of Western Washington Final Report March 2012 Publication #10-06-011 This page is left blank on purpose Calculating Credits and Debits
Revising the Nantahala and Pisgah Land Management Plan Preliminary Need to Change the Existing Land Management Plan
 Revising the Nantahala and Pisgah Land Management Plan Preliminary Need to Change the Existing Land Management Plan Throughout the Plan 1. There is a fundamental need for the revised plan to address how
Plan Plus Volume 1 No 1 2002 (117-123)
") Plan Plus Volume 1 No 1 2002 (117-123) APPLICATION OF GIS (GEOGRAPHIC INFORMATION SYSTEM) FOR LANDSLIDE HAZARD ZONATION AND MAPPING DISASTER PRONE AREA: A STUDY OF KULEKHANI WATERSHED, NEPAL Purna Chandra
Plan Plus Volume 1 No 1 2002 (117-123) APPLICATION OF GIS (GEOGRAPHIC INFORMATION SYSTEM) FOR LANDSLIDE HAZARD ZONATION AND MAPPING DISASTER PRONE AREA: A STUDY OF KULEKHANI WATERSHED, NEPAL Purna Chandra
Belmont Forum Collaborative Research Action on Mountains as Sentinels of Change
 Belmont Forum Collaborative Research Action on Mountains as Sentinels of Change 1. Background and rationale Mountains exist in many regions of the world and are home to a significant fraction of the world
Madagascar: Makira REDD+
 project focus Madagascar: Makira REDD+ Madagascar is considered to be one of the top five biodiversity hotspots in the world due to more than 75% of all animal and plant species being endemic while less
THE NATURAL RESOURCES AND ENVIRONMENT ORDINANCE (CAP. 84 - LAWS OF SARAWAK, 1958 Ed.)
") THE NATURAL RESOURCES AND ENVIRONMENT ORDINANCE (CAP. 84 - LAWS OF SARAWAK, 1958 Ed.) THE NATURAL RESOURCES AND ENVIRONMENT (PRESCRIBED ACTIVITIES) ORDER, 1994 (Made under section 11A(1)) (Incorporating
THE NATURAL RESOURCES AND ENVIRONMENT ORDINANCE (CAP. 84 - LAWS OF SARAWAK, 1958 Ed.) THE NATURAL RESOURCES AND ENVIRONMENT (PRESCRIBED ACTIVITIES) ORDER, 1994 (Made under section 11A(1)) (Incorporating
3. The submittal shall include a proposed scope of work to confirm the provided project description;
 QIN Shoreline Master Program Project Summary The Shoreline Master Program (SMP) development process for the Quinault Indian Nation (QIN) includes the completion of inventory and analysis report with corresponding
Protecting Floodplain. While Reducing Flood Losses
 Protecting Floodplain Natural and Beneficial i Functions While Reducing Flood Losses Jon Kusler Association of State Wetland Managers 518 872 1804; jon.kusler@aswm.org Report available at: http://aswm.org/pdf_lib/nbf.pdf
How To Conduct An Environmental Impact Assessment
 Proposed Terms of Reference for EIA studies 1. Introduction The proposed expansion of Bulk Drugs & Intermediates manufacturing unit by M/s. Sri Krishna Pharmaceuticals Limited (Unit V). is located at Plot
CALDER PARK PROJECT STAGE 1. EPBC Act Approval Compliance Report (EPBC 2012/6439)
") CALDER PARK PROJECT STAGE 1 EPBC Act Approval Compliance Report (EPBC 2012/6439) Prepared for: METRO TRAINS MELBOURNE Level 28, 80 Collins Street, Melbourne, VIC 3000 Prepared by: Kellogg Brown & Root
CALDER PARK PROJECT STAGE 1 EPBC Act Approval Compliance Report (EPBC 2012/6439) Prepared for: METRO TRAINS MELBOURNE Level 28, 80 Collins Street, Melbourne, VIC 3000 Prepared by: Kellogg Brown & Root
TERMS OF REFERENCE. for an ENVIRONMENTAL IMPACT ASSESSMENT. for a PROPOSED RESORT DEVELOPMENT
 TERMS OF REFERENCE for an ENVIRONMENTAL IMPACT ASSESSMENT for a PROPOSED RESORT DEVELOPMENT at BIG AND LITTLE PELICAN CAY PORTLAND BIGHT, ST. CATHERINE, JAMAICA TABLE OF CONTENTS BACKGROUND 4 1. Executive
Improving the physical condition of Scotland s water environment. A supplementary plan for the river basin management plans
 Improving the physical condition of Scotland s water environment A supplementary plan for the river basin management plans Contents Executive summary... 2 1. Introduction... 3 2. Vision... 4 3. Taking
Aiding the Hydro-scheme development process. Web-links to useful information sources
 Aiding the Hydro-scheme development process. Web-links to useful information sources Web-pages are in bold. These pages aim at providing developers, land-owners, decision makers and advisors with a collation
Oregon. Climate Change Adaptation Framework
 Oregon Climate Change Adaptation Framework Oregon Environmental Quality Commission Climate Change Adaptation Framework Presentation at a glance: Purposes of the framework Participating agencies Climate
Initial Assessment of Potential Flood Mitigation for Communities Downstream of Googong Dam
 Initial Assessment of Potential Flood Mitigation for Communities Downstream of Googong Dam ICON WATER AND QUEANBEYAN CITY COUNCIL Summary Report 8006314 25 June 2015 Initial Asssessment of Potential Flood
Regulatory Features of All Coastal and Inland Ecological Restoration Limited Projects
 Eligibility Checklist This Ecological Restoration Limited Project Eligibility Checklist guides the applicant in determining if their project is eligible to file as an Inland or Coastal Ecological Restoration
AN INITIATIVE TO IMPROVE
 L OW E R C A R M E L R I V E R A N D L AG O O N F L O O D P L A I N R E S TO R AT I O N A N D E N H A N C E M E N T P R O J E C T AN INITIATIVE TO IMPROVE FLOOD PROTECTION RESTORE AND PROTECT RIPARIAN
2.1 Environmental Responsibility & Land Capability
 2.1 Environmental Responsibility & Land Capability Introduction The Land use permissibility of a development in a particular under the zone, as indicated by the Lake Macquarie LEP 2004 does not mean indication
ROAD/ROUTE SURVEY AND CLEARANCE
 ROAD/ROUTE SURVEY AND CLEARANCE 1. GENERAL INTRODUCTION 1.1 The purpose of this Road/Route Survey and Clearance Chapter is to define the minimum standards and procedures for Road/Route Survey and Clearance
SPA Annual Report for 2002 September, 2003 Montgomery County Department of Environmental Protection Page 125. Evaluation and Recommendations
 Montgomery County Department of Environmental Protection Page 125 Evaluation and Recommendations Monitoring efforts in the Special Protection Areas continue to provide the kind of information needed to
ESSENTIAL COMPONENTS OF WATER-LEVEL MONITORING PROGRAMS. Selection of Observation Wells
 ESSENTIAL COMPONENTS OF WATER-LEVEL MONITORING PROGRAMS Before discussing the uses and importance of long-term water-level data, it is useful to review essential components of a water-level monitoring
STORMWATER MANAGEMENT CHECKLIST
 STORMWATER MANAGEMENT CHECKLIST *This checklist must be completed and part of the Land Disturbing Permit submittal for review if the acreage disturbed is one (1) acre or more: I. SUPPORTING DATA Narrative
Thank you to all of our 2015 sponsors: Media Partner
 Thank you to all of our 2015 sponsors: Media Partner Channel Naturalization: Planning and Implementation in Peel Region TRIECA March 25 & 26, 2015 Peel Region Channel Remediation Strategy An Urban Context
Sustainability Brief: Water Quality and Watershed Integrity
 Sustainability Brief: and Watershed Integrity New Jersey depends on water resources for the health of our people, the strength of our economy, and the vitality of our ecosystems. The quality of our water
Biodiversity Concepts
 Biodiversity Concepts WHAT IS BIODIVERSITY? Biodiversity is the variety of life on Earth. For any kind of animal or plant each individual is not exactly the same as any other; nor are species or ecosystems.