FSAE i2 Data Analysis Seminar Software Download & Installation
|
|
|
- Giles Cummings
- 10 years ago
- Views:
Transcription


1 FSAE i2 Data Analysis Seminar Software Download & Installation MoTeC software is available for download from the website at: com 1

2 i2 Standard vs i2 Pro i2 Standard Single overlay lap Simple maths functions Corrected speed / distance Filter, scale and offset + - * / 15 Worksheets 5 time/distance graphs 10 Channels per graph 5 Outing graphs 2 Histograms 1 Scatter plot 1 Mixture map 1 Track Report Section Times i2 Pro Multiple overlay laps Advanced mathematics user maths global maths flexible Expressions Unlimited display components Unlimited workbooks Unlimited worksheets User definable track sections/sectors Lap Reports Statistics zoom Suspension Analysis Video Multiple projects Program Basic i2 Introduction Reliability and Safety Evaluating Driver Performance Evaluating Chassis Performance Data Maintenance 2

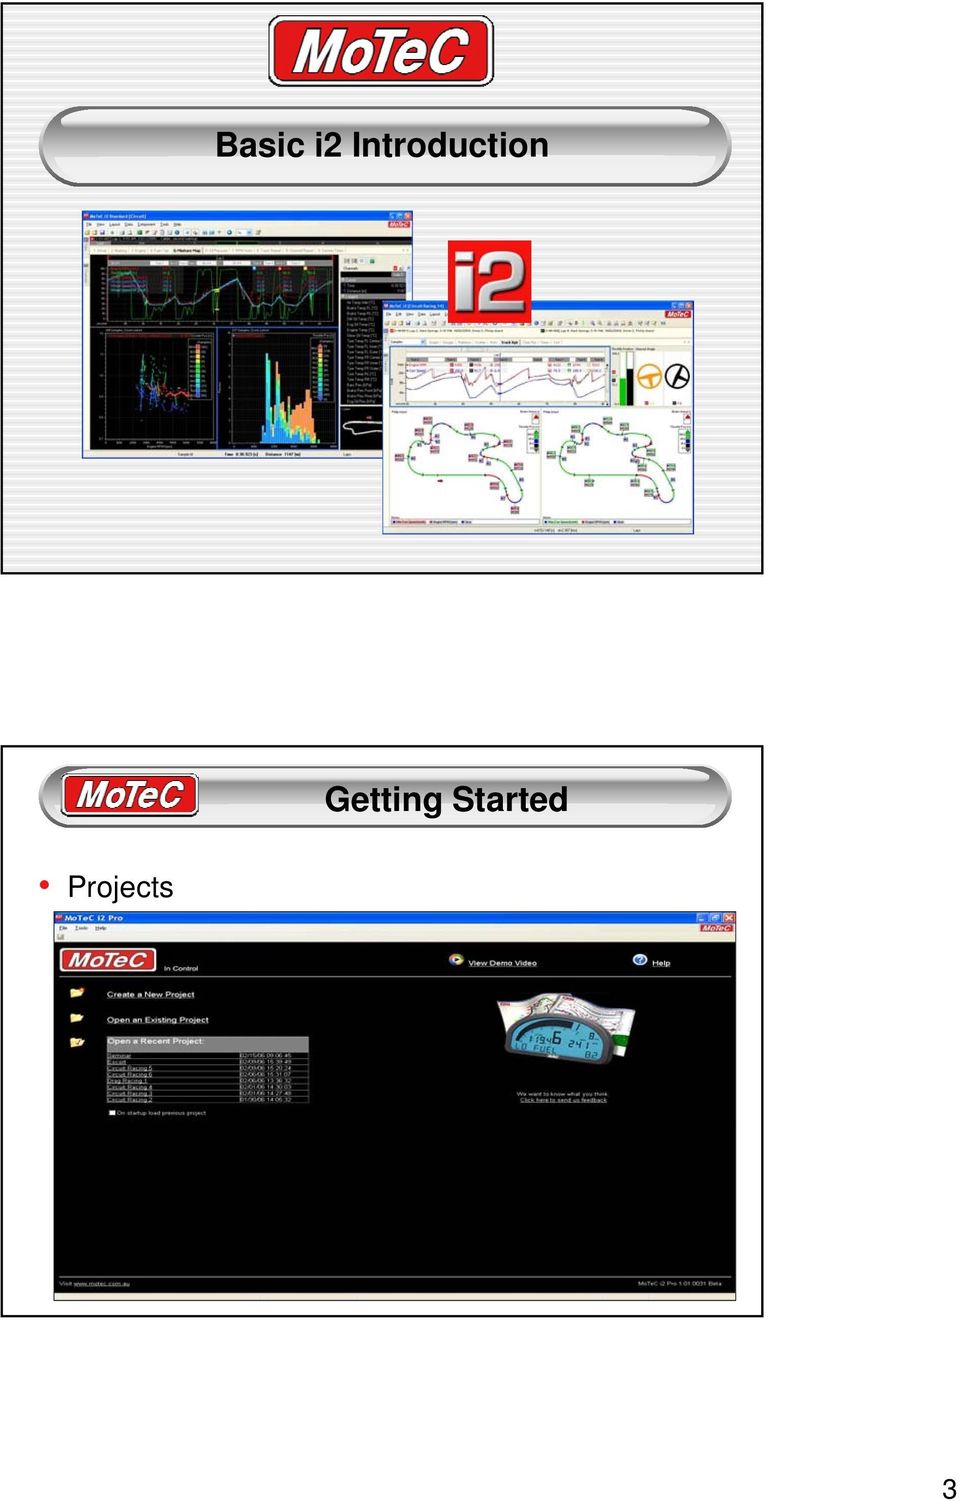
3 Basic i2 Introduction Getting Started Projects 3


 Pull-down menu File / Open")
 F8, then Icon 5) F8, then")
4 Creating a New Project To move, save or copy a project, simply move that folder and everything but your data goes with it. Math, graphs, etc. On the new computer, it won t automatically show in the recent project list so you ll have to Open an Existing Project the first time. Open a Log Data File 5 ways to open files: 1) Pull-down menu File / Open Log File 2) Ctrl O 3) Icon on toolbar 4) F8, then Icon 5) F8, then right-click Open file dialog and icons 4


5 Data Window Lap Selection Main Overlay Other overlay laps FILE DETAILS Venue, Event Driver, Vehicle Date, Session Time, Comment and Filename Lap List Other overlay laps Overlay 0 Main Workbook Setup Worksheets should be grouped into workbooks by their type, such as Engine, Driver, Chassis, Suspension or they can be grouped for different people such as Engineer, Driver A, Driver B, Team Owner. Workbooks Worksheets 5


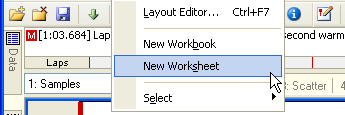

6 New Workbook New Worksheet 6


 -> Add")
7 Adding Components Layout Add menu Right click on blank area of worksheet Available Components: Time / Distance Graph Outing Graph Histogram Suspension Histogram Scatter Plot Mixture Map FFT Video Track Report Track Position Rainbow track map Time Report Channel Report Gauges (various types) -> Add Time / Distance Graph 7
 -> Add Time /")


8 Adding Channels View properties of the selected channel Category or Alphabetic view still applies Search the channel list Channels Window Category Alphabetic Order Category Logged Order Alphabetic List Channel Properties Search Box Categories 8


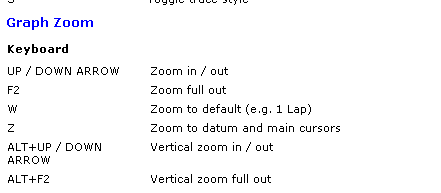
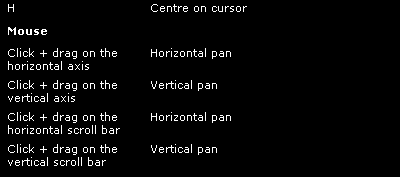
9 Zoom Functions Mouse scroll Keyboard shortcuts Scroll bars Zoom Icons Horiz Zoom out full F2 Zoom to cursors Zoom window Horiz Zoom Default - W Vert Zoom out full Double click and drag to zoom Zoom in Horiz Vert Zoom in Zoom out Horiz Vert Zoom out Zoom & Pan Resize & Slide bar to Zoom & Pan Icon Shortcut keys Arrow keys Double Click, Drag & Click If you accidentally double click, hit Esc key To Zoom: use scroll wheel Double click to zoom out vertically To Pan: slide bottom x-axis 9


10 Time / Distance Graph 1 Lap select, Zoom and Scroll X axis Channel name Min Max Avg Value at cursor Time / Distance Graph 2 Active Channel mark F9 toggles the Time / Distance axis Rescale / Vertical Zoom group with active channel by dragging arrows 10


11 Resizing and Layout Click and drag edges to resize Click left corner to move Click and drag Splitter to resize Groups Values Box Hide/Show Track Map Show difference between Main and Ref laps Time and Distance at Cursor Channels on the graph. box = active channel Values of all channels. 11


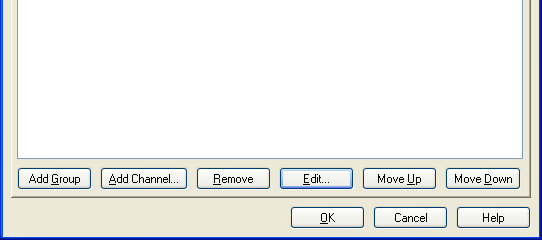
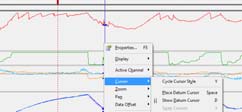
12 Datum Cursor Show differences between 2 points on a graph Graph Properties 1 Creating a graph Channels Groups 12


13 Graph Properties 2 Display Title Layout Info Options Options Cursor Trace Channel Properties Unit Decimal Places Colour Up Sampling Scaling Info Edit Channel Colour Scheme 13

 A number of simplified maths functions are provided to avoid the need to use the expression editor for")

14 Channel Options on a Graph Hide Remove Edit Maths Filter Scale / Offset Zero at Cursor Previous Next Channel Properties Maths Simple Maths Functions (Filter, Scale & Offset) A number of simplified maths functions are provided to avoid the need to use the expression editor for simple operations like Filtering and Scale & Offset. All other functions must be performed using the Expression Editor. Note that these functions modify the original channel they do not create a new channel. To create a new channel use the corresponding functions in the expression editor. 14


![Pres front [psi] /](/docs-images/17/81460/images/15-1.png "( Brake Pres front")
![[psi] + Brake Pres](/docs-images/17/81460/images/15-2.jpg "Rear [psi]) Type")

15 Example Maths Expression Brake Pres front [psi] / ( Brake Pres front [psi] + Brake Pres Rear [psi]) Type Maths Expression Old Method of Data Analysis 15
![[psi] + Brake Pres Rear [psi]) Type](/docs-images/40/81460/images/page_15.jpg "Maths Expression Old Method of Data")
16 New Method of Data Analysis Download the data every time the car enters Begin with the vital channels such as: Engine temps, pressures Battery voltages Then look at the performance data Listen to the driver Observe first what the car is doing and then try to understand why Reliability and Safety 16


 channel report Selected laps channel")
17 Program Channel Reports Temperatures Pressures Battery Voltages Useful Tips Using the Channel Reports Main and reference lap details All laps channel report Selected laps (main and overlay) channel report Selected laps channel report by sectors 17
 channel report Selected laps channel")


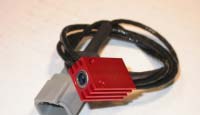

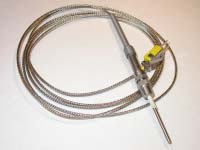
18 Zoom out to Entire Run Temperature Sensors Three major types of sensors: Thermistor Thermocouple Infrared 18


19 Reading Temperatures Max Engine Temp The maximum temps for each channel by lap Engine Temperature Problem Engine Temp too high 19


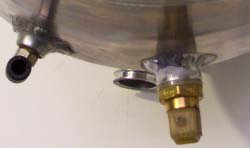
20 Pressure Sensors Different sensors available in Absolute or Gauge Standard d sensors so s ranges from PSI Can measure Fuel and Oil Pressure Reading Pressures Pressure summary per lap 20


21 Oil Pressure Problem Fuel Pressure Problem Fuel Pressure low 21


22 Reading Battery Voltages Battery Voltage looks noisy Useful Tips Max and Min lines in blue and red Oil Pressure decreasing with Engine Temp Battery voltage now looks fine 22


23 Annotations Evaluating Driver Performance 23


24 Driver Analysis Channels Engine RPM Wheel Speed Comparing Laps Throttle Position Steering Lateral and Longitudinal G Brake Pressure Reading Engine RPM Trace Upshift Downshift Straight Wheelspin Braking Corner 24


25 Wheel Speed Sensors Toothed wheel and sensor arrangement Accurate calibration in Dash/ECU software is required Measurement Sensors required Outcome Vehicle speed Lap by lap speed comparisons Wheel lockups under braking Driven wheels slip Gear selection trace Track Mapping Driver analysis Wheel speed Wheel speed, lap beacon Wheel speeds, front and rear Wheel speeds, front and rear Wheel speed, RPM, throttle position Wheel speed, Accelerometer, Beacon Wheel speed, G sensor Top speed, minimum corner speeds, corrected ground speed, corner Compare each lap for speed, overlay to find driver mistakes or faster race lines Brake locking into corners, help determine incorrect setup Diagnose traction problems, evaluate driver performance, find the slip ratio of the driving wheels Create accurate gearing charts to see whether gear selection is correct, driver analysis Create visual representations of the track for reference when examining data, virtual segment time. Extensive driver analysis through lap overlays, minimum and maximum speed comparisons, and accelerating/braking efficiency. Reading a Wheel Speed Trace Each wheel speed value at the cursor The Min, Max, Average wheel speed values The four wheel speeds overlayed against each other 1Hz GPS Speed trace 25

 Where")


26 Comparing Laps - Overlays Reference Lap (Black) Faster Main Lap (Red) Where Did I Lose Time? Where biggest gain is made? Higher minimum corner speed Brakes being released 26

27 Overlayed Track Map Both cars as they compare to each other in that part of the lap Throttle Position Sensors Measurement Sensors required Outcome Throttle position Throttle Use of the engine, Linear potentiometer Accelerator cable Pedal Throttle histogram Throttle Time at full speed Average throttle Throttle Quantify handling Throttle speed Throttle See the agressivity of the driver on the throttle/pedal Brake position Brake pedal, See how the and when the drier brakes pressures brakes Brake pedal Brake speed Braking speed, reactivity position Clutch position Clutch position Driver ability to change gears Throttle, G sensor, Extensive driver analysis through lap Driver analysis RPM overlays, acceleration timing. 27


28 Reading a Throttle Trace This is where the rear wheels have lost traction Here you can see the driver lifting the throttle to stop the wheel spin Steering Sensors Rotary Sensors. Interlocking geared teeth. Can measure steering wheel rotation. 28


, or")
29 Reading a Steering Trace The steering trace can be visualised by displaying it as a gauge. G Force Sensors Can be used to measure Acceleration, Deceleration, Cornering and Vertical Forces It is important to mount the accelerometer at (as close as possible), or directly below the centre of gravity. 29


30 Reading a G Force Trace G Force long and lateral alongside braking and throttle Reading Brake Pressure Trace Brake pressures and temps shown both on graph and as gauges for clarity. 30


31 Driver Analysis Topics Straight Line Acceleration Braking Analysis Understeer/Oversteer Driving Line Driver Consistency Straight Line Acceleration Race Starts, 0-100kmh and 0-400m times use Datum Cursor 31


32 Straight Line Acceleration Duration of an Upshift use Datum Cursor Wheel Spin Following the wheel speed traces here, you can see wheel spin where the two blue lines rise above the red and orange lines, peaking at 12km/h front to rear speed difference 32


33 Rate of Change Measurement You can easily measure rate change using the Datum cursor. Below see the acceleration (in KM/h/Sec) of a V8 Supercar at Phillip Island in 5 th gear. You should keep this number in mind when dyno tuning your car next time. Throttle Histogram 33


34 Braking Analysis Brake pressure reduction Throttle blips from heel and toe braking Brake Pressures Rear brakes locking up Driver releasing pedal to unlock rear wheels 34


35 Brake Pressure Scatter Plot Front/Rear brake pressures zoom linked to histogram Calculated brake bias channel Of the 25,500 samples, most pressures above 180psi exist between 43% and 55% bias Brake Pressure Scatter Plot 2 Here is a brake pressure scatter plot from a poorly performing brake system 35


36 Wheel Lockup In this slide, you can see where the rear right wheel speed drops significantly below the speed of the front wheels Understeer Speed Increases Slightly Steering Increases leading to a Smooth Understeer Constant Lateral G- Force Throttle lifting by Driver 36


37 Oversteer Rear wheel speed here is 6km/h faster than the undriven fronts The throttle is lifted to reduce the wheel spin The steering trace and gauge show the driver winding on opposite lock Driving Line Analysis Accelerating Cornering This method maintains the highest minimum corner speed possible through a corner. Driving the Traction Circle is the fastest way through this corner. Braking 37


38 Late Apex Line When a corner precedes a long straight, it might be better to NOT drive the Traction Circle. That is no trail braking. A later apex results in a lower minimum corner speed, but allows a faster exit speed. That extra exit speed is carried down the entire length of the straight. Variance Speed Higher minimum speed, but can t get on the throttle as early seconds slower in middle of corner, but 0.15 faster down straight. Net gain = 0.10 seconds TP GPS Race Line Analysis 38


39 GPS Race Line Analysis Use Time Report Driver Consistency Blue = fastest section times Eclectic is the theoretical best lap time if you add up all of the fastest sections. Fastest Rolling Lap 39


40 Section and Split Times Corner section times for all laps. All section times for all laps Straight section times for all laps Times from the split beacons from all laps Split times and section markers for selected lap Evaluating Chassis Performance 40


41 Program Brake Temperatures Linear Potentiometers Suspension Analysis Damper Histogram Tyre Temperatures Brake Temp Sensor Working temperature of your brake Are your ducts cooling efficiently? 41


42 Brake Temp Analysis From the brake pad manufacturer know the temperature range within the braking system is operating at its peak performance From the data we can see if we are achieving the desired temperatures. Then decide what we need to do with brake ducts Entire race Brake Temp Data 42


43 Brake Temp Data Single Lap Linear Potentiometers Standard lengths from 50mm to 200mm Standard lengths from 50mm to 200mm Uses include position measurement of suspension, pedals, levers etc. 43


44 Installation and Calibration The most common installation configuration for linear potentiometers is on the shock absorber Suspension Analysis In this example, the front suspension goes negative under braking. Therefore, for suspension position, bump or compression is negative. This is the easiest convention for people to follow. 44

45 Talk to the Driver The experience of your driver, the comments that he gives and the way he feels the car will all affect the analysis of the data. Is there a balance problem in just one corner? Or is it in all right handers? Zoom into the corner(s) and look at what the damper position is at each corner of the car with relation to the G trace and other channels Damper Histogram To spend more time in a region, stiffen that region. To spend less time in a region, soften that region. Graph of AMOUNT OF TIME spent at different DAMPER SPEEDS Rebound High Speed Low Speed Bump High Speed A few tips about the damper speed histogram: It can really only be used for a whole lap (the linear potentiometers must be in the same position at the beginning and the end of the damper analysis) Always use the same number of bins Use a Min and Max such that the whole shock speed histogram covers 95% of the measured shock speeds Always use the same numbers for the Max and Min shock speed (for later comparison) The shape of the histogram should be symmetrical The shock speed histogram can also be used to tune the spring and Anti Roll Bar Always use the same scale on the Y axis (for later comparison) 45


46 Damper Histogram Analysis Example of gain made using damper histogram analysis Damper Histogram with modified damper settings Damper histogram with initial bump/rebound settings Tyre Temp Sensors Ti Tc To IR temp Sensor installation RIGHT TYRE Example of tyre Temp installation 46


47 Tyre Temps Quick Guide T INSIDE < T CENTRE < T OUTSIDE Not enough camber, or too much toe in. T INSIDE < T CENTRE > T OUTSIDE Tyre pressure too high. T INSIDE < T CENTRE = T OUTSIDE Not enough camber, or tyre pressure too high and too much toe in. T INSIDE > T CENTRE < T OUTSIDE Tyre pressure too low. T INSIDE > T CENTRE > T OUTSIDE Too much camber, or too much toe out. T INSIDE > T CENTRE = T OUTSIDE Too much camber, or tyre pressure too low and too much toe out. T INSIDE = T CENTRE < T OUTSIDE Not enough camber, or tyre pressure too low and too much toe in. T INSIDE = T CENTRE > T OUTSIDE Too much camber, or tyre pressure too high and too much toe out. T INSIDE = T CENTRE = T OUTSIDE OK Tyre Temp Sensors On the right part of the graph, the temperatures are the ones as seen in the pits when the car stops. On the left part of the graph, you get an idea of what is really happening on the track. 47


48 Tyre Temp Sensors Corner temps Data Maintenance 48
49 Contents Weekend Checklist Organising Log Files Details Editor Exporting Data Summary Sheet Setup Sheets Weekend Checklist Start of Weekend Update Details Editor Event General comments about meeting or test session. Venue Track name and the directory to which log files will be placed (very important). Vehicle Update any changes since the vehicle last ran, including gear ratios. Check Sensors Use Monitor Active Channels or scrolling through the Warm-up page on the dash to check that all sensor values are appropriate for that sensor and fix any that are wrong. Zero Sensors If required zero G Sensors, Suspension Sensors, Steering, etc. Logging Check that logging templates loaded are appropriate for the day. For instance a template configured for race logging with slower rates and fewer channels than practice logging might be loaded from the previous race. Venue Dependant Variables Load new Reference Laps for Lap Time Gain/Loss change. Beacons and Lap Times Make sure that the Beacon Receiver is on the correct side of the car, or GPS coordinates are correct. Before/After each session Details Editor Update any changes made to the vehicle and enter details about the session (practice, qualifying, race, etc.). At the end of the day Make sure that you collect your Beacon Transmitter. 49


 Icon on")
50 Organising Log Files Organising your logged data into specific folders for events so you can access them quickly Organise by Venue and Year In Dash Manager you can setup the directory that you want all your log files to go when you download the data View / Edit Details File 1 File 2 5 ways to Edit Details: 1) Pull-down menu Tools / Details 2) In the open file window 3) Icon on toolbar 4) Shortcut key Ctrl-D 5) F8, then icon 50


51 Edit Details Chassis # or Car #, used for the name of the Excel setup sheet. Shows in open window Doesn t show in open window Exporting Data Export to Matlab,.csv file or to the clipboard for use in Excel, etc. For Component export, only the channels shown get exported. For File export, all channels get exported. All data is exported at the same rate. Exporting to.ld file allows you to share your data with another competitor but only the channels you have graphed. 51


52 Exporting Channel Report Data Creating a Summary Sheet Export the channel reports and paste in Excel. 52


53 Setup Sheets Excel sheet for importing constants to be used in math equations, which can vary by session. This file can be located anywhere, just make sure you enable macros. Exit Excel once finished making changes. You must enter the date & time of your download. Roll equation uses Track Front & Track Rear You can delete columns which aren t in use. You can create your own columns, names and select units. You can leave blanks where the value doesn t change from session to session. Keyboard Shortcuts See the Help File for See the Help File for a complete list of Keyboard Shortcuts 53


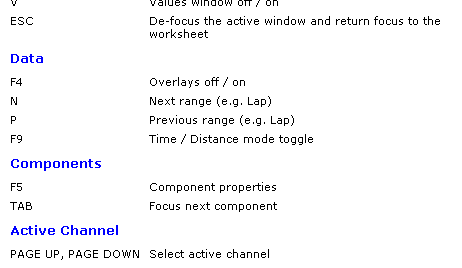


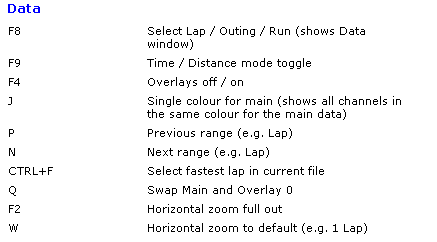
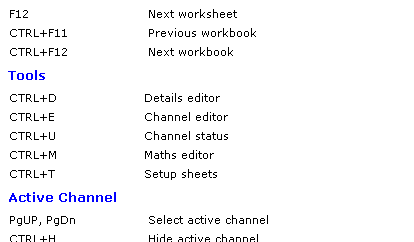

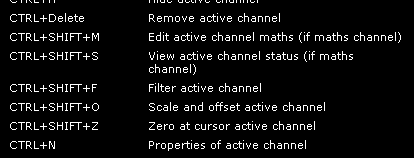
54 Keyboard Shortcuts Keyboard Shortcuts 2 54


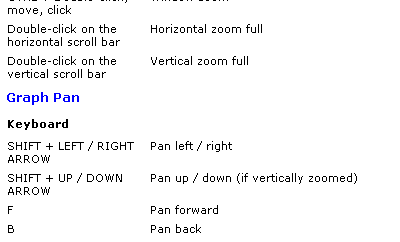


55 Keyboard Shortcuts 3 Keyboard Shortcuts 4 55
Data Analysis Software
 Data Analysis Software Compatible with all Race Technology products Fully integrated video support Accurate track maps Graphs generated with a single mouse click for fast analysis Automatically splits
Introduction to Google SketchUp (Mac Version)
") Introduction to Google SketchUp (Mac Version) This guide is handy to read if you need some basic knowledge to get started using SketchUp. You will see how to download and install Sketchup, and learn how
Introduction to Google SketchUp (Mac Version) This guide is handy to read if you need some basic knowledge to get started using SketchUp. You will see how to download and install Sketchup, and learn how
Introduction to SketchUp
 Introduction to SketchUp This guide is handy to read if you need some basic knowledge to get started using SketchUp. You will see how to download and install Sketchup, and learn how to use your mouse (and
Excel 2007 Basic knowledge
 Ribbon menu The Ribbon menu system with tabs for various Excel commands. This Ribbon system replaces the traditional menus used with Excel 2003. Above the Ribbon in the upper-left corner is the Microsoft
Generative Drafting. Page 1 1997 2001 DASSAULT SYSTEMES. IBM Product Lifecycle Management Solutions / Dassault Systemes
 Generative Drafting Page 1 Tutorial Objectives Description This Tutorial is an introduction to Generative Drafting. Message To show how CATIA V5 allows the user to automatically generate associative drafting
Scientific Graphing in Excel 2010
 Scientific Graphing in Excel 2010 When you start Excel, you will see the screen below. Various parts of the display are labelled in red, with arrows, to define the terms used in the remainder of this overview.
Getting Started with Excel 2008. Table of Contents
 Table of Contents Elements of An Excel Document... 2 Resizing and Hiding Columns and Rows... 3 Using Panes to Create Spreadsheet Headers... 3 Using the AutoFill Command... 4 Using AutoFill for Sequences...
How to make a line graph using Excel 2007
 How to make a line graph using Excel 2007 Format your data sheet Make sure you have a title and each column of data has a title. If you are entering data by hand, use time or the independent variable in
Introduction to the TI-Nspire CX
 Introduction to the TI-Nspire CX Activity Overview: In this activity, you will become familiar with the layout of the TI-Nspire CX. Step 1: Locate the Touchpad. The Touchpad is used to navigate the cursor
Plots, Curve-Fitting, and Data Modeling in Microsoft Excel
 Plots, Curve-Fitting, and Data Modeling in Microsoft Excel This handout offers some tips on making nice plots of data collected in your lab experiments, as well as instruction on how to use the built-in
Introduction. Drenth Motorsport Gearboxes Fleuweweg 10 7468 AG Enter The Netherlands Phone: +31 (0)547 38 26 96 Fax: +31 (0)547 38 20 65
547 38 26 96 Fax: +31 (0)547 38 20 65") 25.03.0023 Introduction The display comes with a software application. With the software application information shown on the display can be adjusted. There are different modes to adjust: the shape of
25.03.0023 Introduction The display comes with a software application. With the software application information shown on the display can be adjusted. There are different modes to adjust: the shape of
Migrating to Excel 2010 from Excel 2003 - Excel - Microsoft Office 1 of 1
 Migrating to Excel 2010 - Excel - Microsoft Office 1 of 1 In This Guide Microsoft Excel 2010 looks very different, so we created this guide to help you minimize the learning curve. Read on to learn key
Copyright 2010 ALFANO S.A. All rights reserved.
 Manual of use 1 Copyright 2010 ALFANO S.A. All rights reserved. The reproduction, transfer, distribution or storage of part of or the totality of the contents of this document in whatever form is prohibited
Table of Contents. INTRODUCTION...v. How to Use This Manual...v Terms Used in this Manual...v Fonts Used in this Manual...v
 Table of Contents INTRODUCTION...v How to Use This Manual...v Terms Used in this Manual...v Fonts Used in this Manual...v PC Hardware Requirements...vi Software Installation...vii Installing DataWorker
Quick Reference Manual
 Quick Reference Manual ii TABLE OF CONTENTS This guide first leads you through the basics of Logger Pro, including software installation procedures. You will learn how to collect data, manually enter data,
Intro to Excel spreadsheets
 Intro to Excel spreadsheets What are the objectives of this document? The objectives of document are: 1. Familiarize you with what a spreadsheet is, how it works, and what its capabilities are; 2. Using
Applying a circular load. Immediate and consolidation settlement. Deformed contours. Query points and query lines. Graph query.
 Quick Start Tutorial 1-1 Quick Start Tutorial This quick start tutorial will cover some of the basic features of Settle3D. A circular load is applied to a single soil layer and settlements are examined.
Plotting: Customizing the Graph
 Plotting: Customizing the Graph Data Plots: General Tips Making a Data Plot Active Within a graph layer, only one data plot can be active. A data plot must be set active before you can use the Data Selector
Creating Drawings in Pro/ENGINEER
 6 Creating Drawings in Pro/ENGINEER This chapter shows you how to bring the cell phone models and the assembly you ve created into the Pro/ENGINEER Drawing mode to create a drawing. A mechanical drawing
Create a Poster Using Publisher
 Contents 1. Introduction 1. Starting Publisher 2. Create a Poster Template 5. Aligning your images and text 7. Apply a background 12. Add text to your poster 14. Add pictures to your poster 17. Add graphs
Introduction to MS WINDOWS XP
 Introduction to MS WINDOWS XP Mouse Desktop Windows Applications File handling Introduction to MS Windows XP 2 Table of Contents What is Windows XP?... 3 Windows within Windows... 3 The Desktop... 3 The
Excel -- Creating Charts
 Excel -- Creating Charts The saying goes, A picture is worth a thousand words, and so true. Professional looking charts give visual enhancement to your statistics, fiscal reports or presentation. Excel
GoodReader User Guide. Version 1.0 GoodReader version 3.16.0
 GoodReader User Guide Version 1.0 GoodReader version 3.16.0 Contents Operating GoodReader 1 Send PDF files to Your ipad 2 Copy Files with itunes 2 Copy Files to a Cloud Service 5 Download Files from the
Excel macros made easy
 IT Training Excel macros made easy Jane Barrett, IT Training & Engagement Team Information System Services Version 1.1 Scope Learning outcomes Understand the concept of what a macro is and what it does.
Windows XP Pro: Basics 1
 NORTHWEST MISSOURI STATE UNIVERSITY ONLINE USER S GUIDE 2004 Windows XP Pro: Basics 1 Getting on the Northwest Network Getting on the Northwest network is easy with a university-provided PC, which has
Help. Contents Back >>
 Contents Back >> Customizing Opening the Control Panel Control Panel Features Tabs Control Panel Lists Control Panel Buttons Customizing Your Tools Pen and Airbrush Tabs 2D Mouse and 4D Mouse Tabs Customizing
Using Microsoft Word. Working With Objects
 Using Microsoft Word Many Word documents will require elements that were created in programs other than Word, such as the picture to the right. Nontext elements in a document are referred to as Objects
Instructions for Use. CyAn ADP. High-speed Analyzer. Summit 4.3. 0000050G June 2008. Beckman Coulter, Inc. 4300 N. Harbor Blvd. Fullerton, CA 92835
 Instructions for Use CyAn ADP High-speed Analyzer Summit 4.3 0000050G June 2008 Beckman Coulter, Inc. 4300 N. Harbor Blvd. Fullerton, CA 92835 Overview Summit software is a Windows based application that
Handout: Word 2010 Tips and Shortcuts
 Word 2010: Tips and Shortcuts Table of Contents EXPORT A CUSTOMIZED QUICK ACCESS TOOLBAR... 2 IMPORT A CUSTOMIZED QUICK ACCESS TOOLBAR... 2 USE THE FORMAT PAINTER... 3 REPEAT THE LAST ACTION... 3 SHOW
SC Analysis Software. The software provides 5 main functions:
 SC Analysis Software Contents 1. Introduction 2. Rowing Record 3. Installing Software 4. Connecting to PC 5. Selecting a Record 6. Chart a Record 7. Display Splits 8. Setting Up SC 9. Synchronised Video
Introduction to Autodesk Inventor for F1 in Schools
 Introduction to Autodesk Inventor for F1 in Schools F1 in Schools Race Car In this course you will be introduced to Autodesk Inventor, which is the centerpiece of Autodesk s digital prototyping strategy
Create A Collage Of Warped Photos
 Create A Collage Of Warped Photos In this Adobe Photoshop tutorial, we re going to learn how to create a collage of warped photos. Now, don t go letting your imagination run wild here. When I say warped,
Introduction to Autodesk Inventor for F1 in Schools
 F1 in Schools race car Introduction to Autodesk Inventor for F1 in Schools In this course you will be introduced to Autodesk Inventor, which is the centerpiece of Autodesk s Digital Prototyping strategy
SECTION 2-1: OVERVIEW SECTION 2-2: FREQUENCY DISTRIBUTIONS
 SECTION 2-1: OVERVIEW Chapter 2 Describing, Exploring and Comparing Data 19 In this chapter, we will use the capabilities of Excel to help us look more carefully at sets of data. We can do this by re-organizing
Audi R8 LMS Cup 2015. Technical Restrictions/Guidelines PUBLISHED version 1.0: 20 March 2015.
 Audi R8 LMS Cup 2015 Technical Restrictions/Guidelines PUBLISHED version 1.0: 20 March 2015. CONTENTS Specific Technical Restrictions and Guidelines.... 3 General Adjustments Information.... 3 TR1. Tyre
Navios Quick Reference
 Navios Quick Reference Purpose: The purpose of this Quick Reference is to provide a simple step by step outline of the information needed to perform various tasks on the system. We begin with basic tasks
Excel 2010: Create your first spreadsheet
 Excel 2010: Create your first spreadsheet Goals: After completing this course you will be able to: Create a new spreadsheet. Add, subtract, multiply, and divide in a spreadsheet. Enter and format column
ECDL. European Computer Driving Licence. Spreadsheet Software BCS ITQ Level 2. Syllabus Version 5.0
 European Computer Driving Licence Spreadsheet Software BCS ITQ Level 2 Using Microsoft Excel 2010 Syllabus Version 5.0 This training, which has been approved by BCS, The Chartered Institute for IT, includes
Basic Excel Handbook
 2 5 2 7 1 1 0 4 3 9 8 1 Basic Excel Handbook Version 3.6 May 6, 2008 Contents Contents... 1 Part I: Background Information...3 About This Handbook... 4 Excel Terminology... 5 Excel Terminology (cont.)...
SMART Board Tips & Tricks (version 9.0) Getting Started. SMART Tools vs. SMART Notebook software
 Getting Started. SMART Tools vs. SMART Notebook software") SMART Board Tips & Tricks (version 9.0) Getting Started SMART Tools vs. SMART Notebook software Click the SMART Board icon (in the system tray at the bottom right of your screen) to access the SMART Board
SMART Board Tips & Tricks (version 9.0) Getting Started SMART Tools vs. SMART Notebook software Click the SMART Board icon (in the system tray at the bottom right of your screen) to access the SMART Board
Fleet Maintenance Software
 Fleet Maintenance Software Welcome Thank you for taking time to review FleetWise VB Maintenance Management Made Simple. This guide is intended to provide a quick overview of installing the software and
Software Manual. For. MadgeTech 4 Data Logger Software
 Software Manual For MadgeTech 4 Data Logger Software Introduction 7 About MadgeTech, Inc... 8 Software Overview 9 Getting Started... 10 System Requirements...10 Software Installation: Installing the MadgeTech
iracing Car Setup Guide
 iracing Car Setup Guide (With Technical Contributions by Dale Earnhardt Jr. & Barry Waddell) Table of Contents 1) Purpose:...2 2) Important Points:...2 3) Definitions:...3 4) Road Course Chassis...3 a)
Appendix C. Vernier Tutorial
 C-1. Vernier Tutorial Introduction: In this lab course, you will collect, analyze and interpret data. The purpose of this tutorial is to teach you how to use the Vernier System to collect and transfer
iracing Setup Guide DRAFT Page 1 of 27 Contents (With Technical Contributions by Dale Earnhardt Jr. & Barry Waddell)
") iracing Setup Guide DRAFT (With Technical Contributions by Dale Earnhardt Jr. & Barry Waddell) Contents 1) Purpose:... 2 2) Important Points:... 3 3) Definitions:... 4 4) Road Course Chassis... 5 a) Tires...
iracing Setup Guide DRAFT (With Technical Contributions by Dale Earnhardt Jr. & Barry Waddell) Contents 1) Purpose:... 2 2) Important Points:... 3 3) Definitions:... 4 4) Road Course Chassis... 5 a) Tires...
A Guide to Using Excel in Physics Lab
 A Guide to Using Excel in Physics Lab Excel has the potential to be a very useful program that will save you lots of time. Excel is especially useful for making repetitious calculations on large data sets.
Excel 2002. What you will do:
 What you will do: Explore the features of Excel 2002 Create a blank workbook and a workbook from a template Format a workbook Apply formulas to a workbook Create a chart Import data to a workbook Share
Windows Movie Maker 2012
 Windows Movie Maker 2012 Open Windows Movie Maker A shortcut for Movie Maker should be on the desktop, but if it is not, you can search for the program by touching the right edge of the screen and swiping
Microsoft Access 2010 Overview of Basics
 Opening Screen Access 2010 launches with a window allowing you to: create a new database from a template; create a new template from scratch; or open an existing database. Open existing Templates Create
Manual. OIRE Escuela de Profesiones de la Salud. Power Point 2007
 Power Point 2007 Manual OIRE Escuela de Profesiones de la Salud Power Point 2007 2008 The New Power Point Interface PowerPoint is currently the most common software used for making visual aids for presentations.
Absorbance Spectrophotometry: Analysis of FD&C Red Food Dye #40 Calibration Curve Procedure
 Absorbance Spectrophotometry: Analysis of FD&C Red Food Dye #40 Calibration Curve Procedure Note: there is a second document that goes with this one! 2046 - Absorbance Spectrophotometry. Make sure you
Navigator Software. Contents 1. NAVIGATOR SOFTWARE 2. INSTALLATION 3. USING NAVIGATOR SOFTWARE 3.1 STARTING THE PROGRAM 3.
 Navigator Software Contents 1. NAVIGATOR SOFTWARE 2. INSTALLATION 3. USING NAVIGATOR SOFTWARE 3.1 STARTING THE PROGRAM 3.2 SYSTEM SET UP 3.3 LOAD DATA FILE 3.3.1 LOADING PARTIAL FILES 3.4 DATA TABLE WINDOW
This activity will show you how to draw graphs of algebraic functions in Excel.
 This activity will show you how to draw graphs of algebraic functions in Excel. Open a new Excel workbook. This is Excel in Office 2007. You may not have used this version before but it is very much the
Volvo Parts Corporation 04-02-03 Volvo Trip Manager. Contents
 User s Manual Contents Functional Overview...4 Welcome to Volvo Trip Manager...4 About the documentation...4 Information Downloading...5 Vehicle Groups...6 Warning Messages...6 Reports...7 Trend Report...7
product. Please read this instruction before setup your VenomXTM.
 Tuact Corp. Ltd. TM Venom X mouse controller combo Setup Software Instruction Thank you for purchasing our VenomXTM product. Please read this instruction before setup your VenomXTM. Introduction Venom
10 Thomas, Irvine, CA 92618 USA Tel: (949) 465-0900 Fax: (949) 465-0905 Toll Free: (800) 23 FUTEK
 465-0900 Fax: (949) 465-0905 Toll Free: (800) 23 FUTEK") Table of Contents Software Overview... - 4 - Product Key... - 5 - Model Selection... - 6 - Device Selection... - 7 - Menu... - 8 - File... - 8 - Edit... - 8 - View... - 8 - Format... - 8 - Help... - 9
Table of Contents Software Overview... - 4 - Product Key... - 5 - Model Selection... - 6 - Device Selection... - 7 - Menu... - 8 - File... - 8 - Edit... - 8 - View... - 8 - Format... - 8 - Help... - 9
QUICK TUNE EFI INSTRUCTION MANUAL
 QUICK TUNE EFI INSTRUCTION MANUAL Step 1: Loading the CB quick Tune Software to your PC A) Take the CB Quick Tune installation CD and load it into your PC. A window will pop up asking to have all programs
6 DATA ACQUISITION CONTENTS. 2012 Release 6 DATA ACQUISITION 2
 G. DATA ACQUISITION 6 DATA ACQUISITION CONTENTS 6 DATA ACQUISITION 2 6.1 OPERATING SOFTWARE 3 6.1.1 PRESENTATION 3 6.1.2 ETHERNET COMMUNICATIONS 4 6.1.3 COMMUNICATION WIRE 5 6.1.4 VISION 4.17.08 LITE APPLICATION
Basic AutoSketch Manual
 Basic AutoSketch Manual Instruction for students Skf-Manual.doc of 3 Contents BASIC AUTOSKETCH MANUAL... INSTRUCTION FOR STUDENTS... BASIC AUTOSKETCH INSTRUCTION... 3 SCREEN LAYOUT... 3 MENU BAR... 3 FILE
KaleidaGraph Quick Start Guide
 KaleidaGraph Quick Start Guide This document is a hands-on guide that walks you through the use of KaleidaGraph. You will probably want to print this guide and then start your exploration of the product.
Advanced Presentation Features and Animation
 There are three features that you should remember as you work within PowerPoint 2007: the Microsoft Office Button, the Quick Access Toolbar, and the Ribbon. The function of these features will be more
Excel 2007: Basics Learning Guide
 Excel 2007: Basics Learning Guide Exploring Excel At first glance, the new Excel 2007 interface may seem a bit unsettling, with fat bands called Ribbons replacing cascading text menus and task bars. This
DataPA OpenAnalytics End User Training
 DataPA OpenAnalytics End User Training DataPA End User Training Lesson 1 Course Overview DataPA Chapter 1 Course Overview Introduction This course covers the skills required to use DataPA OpenAnalytics
Password Memory 6 User s Guide
 C O D E : A E R O T E C H N O L O G I E S Password Memory 6 User s Guide 2007-2015 by code:aero technologies Phone: +1 (321) 285.7447 E-mail: [email protected] Table of Contents Password Memory 6... 1
Microsoft Migrating to Word 2010 from Word 2003
 In This Guide Microsoft Word 2010 looks very different, so we created this guide to help you minimize the learning curve. Read on to learn key parts of the new interface, discover free Word 2010 training,
Project Management within ManagePro
 Project Management within ManagePro This document describes how to do the following common project management functions with ManagePro: set-up projects, define scope/requirements, assign resources, estimate
Using Excel for Handling, Graphing, and Analyzing Scientific Data:
 Using Excel for Handling, Graphing, and Analyzing Scientific Data: A Resource for Science and Mathematics Students Scott A. Sinex Barbara A. Gage Department of Physical Sciences and Engineering Prince
Interactive Excel Spreadsheets:
 Interactive Excel Spreadsheets: Constructing Visualization Tools to Enhance Your Learner-centered Math and Science Classroom Scott A. Sinex Department of Physical Sciences and Engineering Prince George
Task Card #2 SMART Board: Notebook
 Task Card #2 SMART Board: Notebook Objectives: Participants will learn how to utilize the SMART Notebook. Table of Contents: Launching The SMART Notebook Page 1 Entering Text Page 1 Top Toolbar Page 2
Ohio University Computer Services Center August, 2002 Crystal Reports Introduction Quick Reference Guide
 Open Crystal Reports From the Windows Start menu choose Programs and then Crystal Reports. Creating a Blank Report Ohio University Computer Services Center August, 2002 Crystal Reports Introduction Quick
Adobe InDesign Creative Cloud
 Adobe InDesign Creative Cloud Beginning Layout and Design November, 2013 1 General guidelines InDesign creates links to media rather than copies so -Keep all text and graphics in one folder -Save the InDesign
Graphing Parabolas With Microsoft Excel
 Graphing Parabolas With Microsoft Excel Mr. Clausen Algebra 2 California State Standard for Algebra 2 #10.0: Students graph quadratic functions and determine the maxima, minima, and zeros of the function.
MetroBoston DataCommon Training
 MetroBoston DataCommon Training Whether you are a data novice or an expert researcher, the MetroBoston DataCommon can help you get the information you need to learn more about your community, understand
Event Record Monitoring and Analysis Software. Software Rev. 3.0 and Up. User s Guide
 Event Record Monitoring and Analysis Software Software Rev. 3.0 and Up User s Guide 2 Contents Contents Chapter 1: About ERMAWin 4 Chapter 2: Overview 5 About this Manual 5 System Requirements 5 Installing
Linkage 3.2. User s Guide
 Linkage 3.2 User s Guide David Rector Wednesday, April 06, 2016 Table of Contents Table of Contents... 2 Installation... 3 Running the Linkage Program... 3 Simple Mechanism Tutorial... 5 Mouse Operations...
XCal-View user manual
 XCal-View user manual XCal-View user manual M-9925-0107-04 1 Introduction to XCal-View About XCal-View Renishaw XCal-View software has been written as a direct replacement for the previous analysis package
Using Excel as a Management Reporting Tool with your Minotaur Data. Exercise 1 Customer Item Profitability Reporting Tool for Management
 Using Excel as a Management Reporting Tool with your Minotaur Data with Judith Kirkness These instruction sheets will help you learn: 1. How to export reports from Minotaur to Excel (these instructions
Microsoft Excel 2010 Tutorial
 1 Microsoft Excel 2010 Tutorial Excel is a spreadsheet program in the Microsoft Office system. You can use Excel to create and format workbooks (a collection of spreadsheets) in order to analyze data and
Working with Excel in Origin
 Working with Excel in Origin Limitations When Working with Excel in Origin To plot your workbook data in Origin, you must have Excel version 7 (Microsoft Office 95) or later installed on your computer
Appendix A How to create a data-sharing lab
 Appendix A How to create a data-sharing lab Creating a lab involves completing five major steps: creating lists, then graphs, then the page for lab instructions, then adding forms to the lab instructions,
DAS202Tools v1.0.0 for DAS202 Operating Manual
 DAS202Tools v1.0.0 for DAS202 Operating Manual DAT102Tools 1.0.0 Manual Table of context 2 Table of Contents 1 General Information... 3 2 PC... Configuration Requirements 3 3 Software Installation... 3
QUIT MACSCHOOL AND DRAG YOUR SERVER ICONS TO THE TRASH OR HIT THE DISCONNECT BUTTON BESIDE THE SERVER ICON IN THE TOP SIDEBAR
 Macintosh Operating System OSX 10.3.x STARTING YOUR COMPUTER Logging in Whenever you start your computer, you will need to enter your computer password at the log in screen. When the log in screen appears,
Basic 2D Design Be sure you have the latest information!
 Basic 2D Design mastercam x getting started tutorials Basic 2D Design December 2011 Be sure you have the latest information! Information might have been changed or added since this document was published.
First Time On-Campus Remote Desktop Connection ipad Edition
 First Time On-Campus Remote Desktop Connection ipad Edition General: This guide is a step-by-step guide for configuring and using an ipad to remotely connect to a work computer from on campus. This guide
Excel 2003 Tutorial I
 This tutorial was adapted from a tutorial by see its complete version at http://www.fgcu.edu/support/office2000/excel/index.html Excel 2003 Tutorial I Spreadsheet Basics Screen Layout Title bar Menu bar
X-Trade Brokers Dom Maklerski S.A. XTB Expert Builder. Tutorial. Michał Zabielski 2010-08-05
 X-Trade Brokers Dom Maklerski S.A. XTB Expert Builder Tutorial Michał Zabielski 2010-08-05 Table of Contents Installation...3 Legal notification...7 Initial adjustments / Preferences...8 Language...8 Platform
What s New V 11. Preferences: Parameters: Layout/ Modifications: Reverse mouse scroll wheel zoom direction
 What s New V 11 Preferences: Reverse mouse scroll wheel zoom direction Assign mouse scroll wheel Middle Button as Fine tune Pricing Method (Manufacturing/Design) Display- Display Long Name Parameters:
ArcGIS. Tips and Shortcuts. for Desktop
 ArcGIS Tips and Shortcuts for Desktop Map Navigation Refresh and redraw the display. F5 Suspend the map s drawing. F9 Zoom in and out. Center map. Roll the mouse wheel backward and forward. Hold down Ctrl
GUIDELINES FOR PREPARING POSTERS USING POWERPOINT PRESENTATION SOFTWARE
 Society for the Teaching of Psychology (APA Division 2) OFFICE OF TEACHING RESOURCES IN PSYCHOLOGY (OTRP) Department of Psychology, Georgia Southern University, P. O. Box 8041, Statesboro, GA 30460-8041
Finding and Opening Documents
 In this chapter Learn how to get around in the Open File dialog box. See how to navigate through drives and folders and display the files in other folders. Learn how to search for a file when you can t
Computer Training Centre University College Cork. Excel 2013 Level 1
 Computer Training Centre University College Cork Excel 2013 Level 1 Table of Contents Introduction... 1 Opening Excel... 1 Using Windows 7... 1 Using Windows 8... 1 Getting Started with Excel 2013... 2
Introduction To Microsoft Office PowerPoint 2007. Bob Booth July 2008 AP-PPT5
 Introduction To Microsoft Office PowerPoint 2007. Bob Booth July 2008 AP-PPT5 University of Sheffield Contents 1. INTRODUCTION... 3 2. GETTING STARTED... 4 2.1 STARTING POWERPOINT... 4 3. THE USER INTERFACE...
Monthly Payroll to Finance Reconciliation Report: Access and Instructions
 Monthly Payroll to Finance Reconciliation Report: Access and Instructions VCU Reporting Center... 2 Log in... 2 Open Folder... 3 Other Useful Information: Copying Sheets... 5 Creating Subtotals... 5 Outlining
Spreadsheets and Laboratory Data Analysis: Excel 2003 Version (Excel 2007 is only slightly different)
") Spreadsheets and Laboratory Data Analysis: Excel 2003 Version (Excel 2007 is only slightly different) Spreadsheets are computer programs that allow the user to enter and manipulate numbers. They are capable
Spreadsheets and Laboratory Data Analysis: Excel 2003 Version (Excel 2007 is only slightly different) Spreadsheets are computer programs that allow the user to enter and manipulate numbers. They are capable
Studying Topography, Orographic Rainfall, and Ecosystems (STORE)
") Studying Topography, Orographic Rainfall, and Ecosystems (STORE) Basic Lesson 3: Using Microsoft Excel to Analyze Weather Data: Topography and Temperature Introduction This lesson uses NCDC data to compare
Studying Topography, Orographic Rainfall, and Ecosystems (STORE) Basic Lesson 3: Using Microsoft Excel to Analyze Weather Data: Topography and Temperature Introduction This lesson uses NCDC data to compare
Understand the Sketcher workbench of CATIA V5.
 Chapter 1 Drawing Sketches in Learning Objectives the Sketcher Workbench-I After completing this chapter you will be able to: Understand the Sketcher workbench of CATIA V5. Start a new file in the Part
GelAnalyzer 2010 User s manual. Contents
 GelAnalyzer 2010 User s manual Contents 1. Starting GelAnalyzer... 2 2. The main window... 2 3. Create a new analysis... 2 4. The image window... 3 5. Lanes... 3 5.1 Detect lanes automatically... 3 5.2
Microsoft PowerPoint 2010
 Microsoft PowerPoint 2010 Starting PowerPoint... 2 PowerPoint Window Properties... 2 The Ribbon... 3 Default Tabs... 3 Contextual Tabs... 3 Minimizing and Restoring the Ribbon... 4 The Backstage View...
PowerPoint 2007: Basics Learning Guide
 PowerPoint 2007: Basics Learning Guide What s a PowerPoint Slide? PowerPoint presentations are composed of slides, just like conventional presentations. Like a 35mm film-based slide, each PowerPoint slide