Data-centric Business Process Modelling: A Comparison of Methods
|
|
|
- Earl Harrison
- 10 years ago
- Views:
Transcription
1 Data-centric Business Process Modelling: A Comparison of Methods By W.L.M. van de Crommert BSc Industrial Engineering Student identity number: In partitial fulfilment of the requirements for the degree of Master of Science In Operations Management and Logistics Supervisors: prof. dr. ir. H.A. Reijers, TU/e dr. ir. I.T.P. Vanderfeesten, TU/e

2 MANAGEMENT SUMMARY Subject headings: data-centric, process, modelling, methods, evaluation 1

3 MANAGEMENT SUMMARY Management Summary As the environment and competition of firms is dynamic and increasingly complex, businesses should be able to continuously adapt their way of working in order to remain competitive. In this attempt to remain competitive and act on changes in technology and environment, business processes play an important role. Business process design and redesign, often used under the heading of Business Process Management, is well known and used in practice. In the last decade however, also new initiatives were proposed; so-called data-driven methods try to extend the activity-centric approaches, by focusing on the main data-objects in the process. Although different attempts exist, much is currently unknown about these initiatives. Even though the ideas sound promising, many alternatives exist and few of these methods are currently actively used. In a previous study (Diaz Garcia, 2011) carefully selected three leading methods and conducted a first comparative study on these methods, identifying strengths that were claimed by the developers of the methods, and using an experiment to test whether these strengths were perceived by users as well. This study continues were the previous ended. Again the Data-driven Process Structures of the University of Ulm, Product Based Workflow Design of the Eindhoven University of Technology, and Artifact-Centric Process Modelling of IBM Watson Research Laboratory, are considered. However, in contrast to the study performed by Diaz Garcia, this study tries to acquire more specified information on the user s perceptions towards the methods. Four main phases can be distinguished in this study: 1. In the first phase, literature is studied in order to capture claims made by the developers of the methods, that address one or multiple quality attributes. The five quality attributes used in this Theoretical Evaluation are: Functionality, Usability, Efficiency, Maintainability, and Flexibility. The obtained claims are used to create an overview of the contents and focus of the methods, and at the same time enable the mapping of the methods to each other. An overview of this set of claims can be found in Table The second phase, called the Empirical Evaluation, includes three workshop sessions in which participant actively work with one of the methods. Not only do they read about the important entities of a method, they are also provided with examples and even exercises, in order to obtain some hands-on experience. A questionnaire and discussion are used to gather the users perceptions of the methods. 3. The third phase is used to compare the claims acquired in the Theoretical Evaluation with the perceptions obtained in the Empirical Evaluation. Perceptions can support or contradict the claims, and sometimes are indecisive. In addition it can occur that claims are unaddressed in the workshops, or perceptions are identified that do not directly relate to a claim. These are captured as well. 4. Using both the claims of the developers and the statements made by the participants, the different methods are individually evaluated. After stating a methods strengths and weaknesses, the methods are compared to one another, capturing relative strengths and weaknesses, as well as opportunities for improvement. 2

4 MANAGEMENT SUMMARY One of the main findings of this study was that indeed users currently are not used to using methods that go beyond ordinary process modelling. Struggling with fairly simply examples, it can be said that an extensive training is required in order to use these kind of methods for complex, practical situations. With respect to the Data-Driven Process Structures, proposed by the University of Ulm, it can be said that this method is very efficient and highly maintainable. This high efficiency and maintainability is achieved using very generic models, which can be difficult to formulate. Though the method is currently most often applied in the manufacturing domain, where structured products are modelled, it might be interesting to use this method in other environments, in order to test its applicability to other domains. The Product-Based Workflow Design focused not on efficiency of modelling or on maintainability, but instead is used to optimise the process that is modelled. Users of the workshops struggled with the complexity of negative paths (knock-outs), used in the Product Data Model; participants preferred a tree-like structure without these alternative routings. The final method discussed, Artifact-Centric Process Modelling, proved to be fairly difficult for the participants. The creation of these models proved to be fairly complex; and even though the artifacts described are self-explaining, the models that incorporate these artifacts are still difficult for business users. The claimed added value for analysing, managing, and controlling the business operations, in addition, remained somewhat unclear. As can be seen, each of these methods has its own strengths and weaknesses; it might however be possible for these (and other) methods, to tackle some of their own weaknesses by incorporating functionality that is based on other methods. Artifact-Centric Process Modelling, for example, could try to incorporate some of the aspects of efficiency and maintainability, used in Data-Driven Process Structures. For PBWD it might be interesting to increase its readability, improving understandability for business users. As can be seen, data-centric process modelling methods can still be improved; refinements are required to all of the methods. However, data-centric modelling methods do propose some interesting ideas for improving the analysis, management, and control of business operations. 3

5 ACKNOWLEDGEMENTS Acknowledgements The Master Thesis in front of you is the result of the research I conducted during the past seven months. Many persons helped me and supported me during this process, and I would like to express my thanks to them here. First of all, I would like to thank my supervisors: Hajo Reijers, for the interesting discussions we had that helped me push my research to a higher level, and Irene Vanderfeesten, for her continuous support and optimism. Both of you helped me to overcome periods in which progress came to a halt, finding new spirit to tackle the encountered problems. Secondly, I would like to thank the people who contributed to this thesis in one way or another. Manfred Reichert from the Ulm University, and Emily Rong Liu from the IBM Watson Research Laboratory, who helped me adjusting and improving the tutorials. Furthermore, I would like to thank all business professionals and students that participated in the workshops, and thereby contributed to results of the Empirical Evaluation. I also thank my colleagues from the Paviljoen, especially Han and SG, for the estimated total of 1000 cups of coffee we drank together, and the often welcome distraction during long days. Han, special thanks for the feedback and discussions on different parts of my study. Patricks, thanks for the wonderful time I had in Eindhoven, you were great. The last words are for my family, for their continuous support and confidence in me. You encouraged me, and helped me to put things in perspective. Thank you all. Wim van de Crommert Eindhoven, January

6 CONTENTS Contents List of Figures... 6 List of Tables Introduction Research Goal Research Design Structure of the Report Preliminaries Business Process Management Process Modelling Perspectives Data-driven Process Structures Product-based Workflow Design Artifact-centric Process Modelling Qualitative Research Method Evaluation Model Theoretical Evaluation Quality and quality attributes Claims by Developers Empirical Evaluation Methodology Results Results Evaluation: Data-Driven Process Structures Evaluation: Product-Based Workflow Design Evaluation: Artifact-Centric Process Modelling Discussion Discussion Method Evaluations Comparison of Methods Conclusion Limitations and Future Research Future Research References Appendices

7 LIST OF FIGURES List of Figures Figure 1 - Research Design... 8 Figure 2 - Data Model Figure 3 - Lifecycle Coordination Model Figure 4 - Data Structure Figure 5 - Data-driven Process Structure Figure 6 - Product Data Model Figure 7 - Step 1 : Create Business Artifact Information Model Figure 8 - Step 2: Create Artifact Lifecycles Figure 9 - Method Evaluation Model Figure 10 - Overview of Workshop Structure Figure 11 - Perceived Ease of Use Figure 12 - Perceived Usefulness List of Tables Table 1 - Step 3: Create Services Table 2 - Step 4: Create Associations Table 3 - Different Levels of Coding Table 4 - Selected Quality Attributes Table 5 - Articles Used for Claims Table 6 - Hierarchy of Coding Table 7 - Theoretical Evaluation: Claims by Developers Table 8 - Cronbach's alpha Table 9 - Overview Discussion: Data-Driven Process Structures Table 10 - Overview Discussion - Product-Based Workflow Design Table 11 - Overview Discussion - Artifact-Centric Process Modelling Table 12 - Results exercises: Data-Driven Process Structures Table 13 - Results exercises: Product-Based Workflow Design Table 14 - Results exercises: Artifact-Centric Process Modelling Table 15 - DDPS: Strengths and Weaknesses Table 16 - PBWD: Strengths and Weaknesses Table 17 - ACPM: Strengths and Weaknesses Table 18 - Schematic Overview of Comparison of Methods

8 INTRODUCTION 1 Introduction As the environment and competition of firms is dynamic and increasingly complex, businesses should continuously adapt their way of working in order to remain competitive. In this attempt to remain competitive and act on changes in technology and environment, business processes play an important role; both physical, like manufacturing processes and logistics, and nonphysical processes (e.g. digital forms). The field that addresses the design, redesign and management of processes is called Business Process Management (BPM) (Hammer, 2010), (Van der Aalst, Ter Hofstede, & Weske, 2003). The activity-centric approach of BPM is widely known and accepted. In the last decade however, also new initiatives were proposed that aim at improving activity-centric methods; so-called data-centric methods try to extend the activity-centric approaches, by focusing on the main data-objects in the process. Although different attempts exist, much is unknown regarding these initiatives. Therefore, in this study, the data-centric methods of three institutes are evaluated: Data-driven Process Structures of the University of Ulm, Product Based Workflow Design of the Eindhoven University of Technology, and Artifact-Centric Process Modelling of IBM Watson Research Laboratory. These methods were selected as the main data-centric BPM approaches by Diaz Garcia in his master thesis on the Evaluation of Data-Centric Process Modelling Approaches (Diaz Garcia, 2011). Although the selected methods are leading examples, the field of data-driven process modelling approaches is still in its infancy; none of the previously named methods is widely accepted nor used. In order to test the users perceptions (perceived ease of use and perceived usefulness) of the methods, Diaz Garcia provided participants with a brief description of the approach, followed by a set of models that were created using the method (Diaz Garcia, 2011). This thesis in contrast uses a more active approach: using an empirical setting, participants are provided with self-explaining tutorials, including examples and exercises. Using this hands-on experience, participants are better able to point out strengths and weaknesses of the different methods. Furthermore, a structured approach is used to extract the claimed strengths and weaknesses of the three methods from literature, enabling a comparison of the strengths and weaknesses claimed by the developers, with the ones perceived by participants of the workshops. 1.1 Research Goal As briefly mentioned at the beginning of this chapter, three methods will be evaluated on both a theoretical and practical level: not only will the study be used to determine the functionality and added value claimed, but also how these aspects are perceived by users, in order to better understand and compare these different methods. The research goal can be formulated as follows: Create a better understanding of both the claimed and the perceived strengths and weaknesses of Data-Driven Process Structures, Product-Based Workflow Design, and Artifact-Centric Process Modelling. In order to acquire an answer to this goal, three questions can be described: 7
 (Hammer, 2010), (Van der Aalst, Ter Hofstede, & Weske, 2003).")
9 INTRODUCTION 1. What are the theoretical differences between the selected methods? 2. What are the modellers perceptions towards the different methods? 3. What are the main strengths and weaknesses of the selected methods? The first research question is addressed by performing an in-depth analysis (literature review) of the three different methods. Different quality attributes are used to take all important characteristics into account; a schematic overview helps in comparing the different methods. In order to gather information on modellers attitudes towards the different methods, a survey is set up to collect information on users perceptions towards the method and specific aspects of this method. Using the Method Evaluation Model (Moody, 2003), information on the users perceived ease of use and perceived usefulness is collected. Furthermore, a discussion will be used to acquire information on specific aspects of the approaches. The final research question helps to define possibilities to improve different aspects of the selected methods. Using the results from both theoretical and empirical evaluation, strengths and weaknesses (e.g. in representation, number of models, complexity, et cetera) are considered. Knowledge obtained here can be used to propose improvements for the existing methods. 1.2 Research Design Four main stages in the research design can be defined, which will be further explained in their corresponding subsections. Theoretical Evaluation (Ch.3) Empirical Evaluation (Ch.4) Results (Ch.5) Discussion (Ch.6) Gathering Developer s Claims Gathering User s Perceptions Compare Claims and Perceptions Explain findings Figure 1 - Research Design Theoretical Evaluation In the first phase, which is described in Chapter 3, the available literature is studied in order to find claims made by the developers, regarding functionality or attributes of the method. Using a stepwise coding method, based on the Grounded Theory used in qualitative research, claims are gathered, coded, grouped in concepts, and finally allocated to one of five quality attributes: Functionality, Usability, Efficiency, Maintainability, and Flexibility. The result of the Theoretical Evaluation is a set of claims for each of the methods that indicates what is claimed in literature with respect to different quality attributes Empirical Evaluation Though it is interesting to determine theoretical differences between the methods, this study in addition tries to determine what the perceived similarities and differences of the studied methods are. Therefore, a tutorial is created and respondents are gathered, in order to test the methods in an empirical setting. A total of three workshops is conducted; one for each of the 8

10 INTRODUCTION methods. The workshops provide different sources of information: a questionnaire, the models created in the exercises, and a group discussion. In order to extract the information from this final source, again Grounded Theory Coding is used. The result of the Empirical Evaluation is a set of users perceptions for each of the methods, which again are categorised using the five quality attributes Results In the third phase, the results from the Theoretical Evaluation and the Empirical Evaluation are combined: the claims of the developers are compared to the participants perceptions, in order to check whether or not they are consistent with one another. Though most of the important claims are addressed in the workshops, some of the claims were not provided any attention during the workshops; these claims therefore cannot be tested in this section. As a final point, participants perceptions that are not captured in claims, will be mentioned at the end of a method s section, as these results might be interesting for the discussion Discussion Whereas the third phase does not provide an interpretation of the obtained results, in the fourth phase such an interpretation is provided. Often the results of the Empirical Evaluation support the claims of the developers, obviating the need for an extensive discussion. In other cases however, claims might only be supported partially, or even contradicted by the results of the workshops. Especially when the outcomes of the Empirical Evaluation are counterintuitive, the discussion is used to provide possible explanations of the obtained results. In addition to the interpretation of the results and their causes for an individual method, the second part of the discussion makes a comparison of the different methods, identifying relative strengths and weaknesses of the methods to each other. Opportunities for improvement for each of the methods will be addressed here as well. 1.3 Structure of the Report This document is structured as follows: - Chapter 2 - Preliminaries introduces the Business Process Management discipline, three data-centric methods, Grounded Theory Coding, and the Method Evaluation Model. - Chapter 3 - Theoretical Evaluation documents the process of the Theoretical Evaluation, selecting relevant articles and extracting the claims. - Chapter 4 - Empirical Evaluation describes the Empirical Evaluation, the creation of materials for the workshops, and the extraction of information from the obtained data. - Chapter 5 - Results documents the combination of the results of both evaluations. - Chapter 6 - Discussion describes the interpretation of the results obtained in Chapter 5, and in addition makes a comparison of the three methods. - Chapter 7 - Conclusion summarises the study, addresses the limitations of the study, and provides directions for future research. 9

11 PRELIMINARIES 2 Preliminaries Before the actual study is reported upon, first some prior knowledge is considered. The concepts and theories used in this thesis will first be briefly introduced in this chapter. The chapter is structured as follows: first, some general information on BPM and, more specifically, datadriven modelling will be provided. Though briefly, this section addresses basic knowledge required to understand this thesis. After this general introduction, a more in depth view on three data-centric modelling methods will be provided: Data-Driven Process Structures (2.3), Product-Based Workflow Design (2.4), and Artifact-Centric Process Modelling (2.5), which together form the subject of this study, will be granted a closer look. The final topic addressed in this chapter is an evaluation method used in the empirical evaluation of this study. 2.1 Business Process Management Although different definitions of BPM exist, (Van der Aalst, Ter Hofstede, & Weske, 2003) provide a very clear yet complete definition of BPM: Supporting business processes using methods, techniques, and software to design, enact, control, and analyse operational processes involving humans, organisations, applications, documents and other sources of information. When decomposing this definition, one sees that it involves business processes (what), methods techniques and software (how), to design, enact, control, analyse (why), involving humans, organisation, applications, documents and other sources (with whom). Although not included in the definition by (Van der Aalst, Ter Hofstede, & Weske, 2003), BPM is seen as a continuous process; a good design is never final, since environment and techniques continuously change (Hammer, 2010). BPM helps to achieve both operational benefits (consistency, cost, speed, quality, service) and strategic benefits (flexibility, globalisation, merger, ERP implementation) (Hammer, 2010). Business Process Management provides the benefit that seemingly incompatible goals can be achieved by creating a new design for the process. 2.2 Process Modelling Perspectives In (Diaz Garcia, 2011) a clear overview of different BPM perspectives and their goals is provided. The author distinguishes four different perspectives of process modelling, from which the last three tackle problems encountered by the first and most common modelling technique: the activity-centric approach. Activity-centric Process Modelling: In this traditional type of process modelling, the set of activities that need to be executed, their relations and order of execution, are key concepts; workflow patterns are a well-known example of such an approach. The limitation of activitycentric approaches is the need of a highly structured process; when the process is more dynamic, only idealised models can be created (as accurate models become unmanageable), which merely 10

12 PRELIMINARIES serve as idea rather than as concrete model. The lack of flexibility is the major problem concerning activity-centric process modelling approaches. Data-driven Process Modelling: Data-driven or information-driven approaches are based on informational entities handled in a process, which are used as central driver for the design. As many different types of information entities exist or can be created by combining information into new entities, multiple data-driven approaches exist. Organisational-based Process Modelling: This approach focuses on the different roles in the process, the actions that correspond with these different roles, and the interactions between roles which are required to achieve a certain business goal. Goal-oriented Process Modelling: As indicated by the name, goal-oriented process modelling focuses on the ultimate goals instead of a focus on the path to achieve these goals. Goals are statements which declare what has to be achieved or avoided in a company (Kueng & Kawalek, 1997). Goals are decomposed into sub-goals which in turn can be directly allocated to activities. This study will focus on Data-centric Business Process Modelling methods. In a preceding study, Diaz Garcia selected three methods that were renown, covered distinct groups of datacentric methods, and showed prominence of the data perspective (instead of relying on traditional activity-centric modelling techniques). Furthermore, from a practical point of view, he only selected those methods for which it was possible to directly inquire the promoter researchers. The three selected methods are the Data-Driven Process Structures, Product-Based Workflow Design and Artifact-Centric Process Modelling (Diaz Garcia, 2011). Each of these methods will be discussed in the following sections: section 2.3 will address the Data-Driven Process Structures of the University of Ulm and Daimler Chrysler, section 2.4 addresses the Product- Based Workflow Design from the Eindhoven University of Technology, and section 2.5 addresses the Artifact-Centric Modelling from IBM Watson Research Laboratory. 2.3 Data-driven Process Structures Developed in a collaboration between the University of Ulm and Daimler, Data-driven Process Structures proposes a separation of the data structure on the one hand from process logic on the other. Modelling efforts can be reduced by increasing reusability and maintainability, facilitated by the separation of data and process logic Main entities The data-driven process structures approach consists of two different levels: the model level and the instance level. Each of these two levels in turn consists of two models, resulting in a total of four models (Müller, Reichert, & Herbst, 2006), (Müller, Reichert, & Herbst, 2007). Step 1. Definition of the Data Model Step 2. Definition of the Life Cycle Coordination Model Step 3. Definition of Data Structures Step 4. Automatic creation of Data-driven Process Structures Model level Instance level 11

13 PRELIMINARIES Data Model. The first model created is the Data Model. This model shows all object types incorporated in the model, as well as the relation types between object types. Object types often represent levels of hierarchy, such as system, subsystem, and part. Object Lifecycles. Second step in the creation of a data-driven process is the creation of object lifecycles. Object lifecycles in data-driven process structures are, in contrast to lifecycles in the artefact-centric approach, not based on a specific object, but merely on an object type. For each object type specified in the data model, a lifecycle is created. When the object types defined in the data model are replaced by object lifecycles, and relation types are replaced by relations between lifecycles, one obtains the Lifecycle Coordination Model (LCM). Data Structure. In the third step, a Data Model (as created in the first step) is instantiated: object types are replaced by actual objects (including name, type,..) and the corresponding relations are drawn, thereby creating a Data Structure. It is possible that a subsystem is used by, though not included in, a system; this can be represented by the relations. Data-driven Process Structure. The fourth and final step is the automatic creation of a datadriven process structure. Based on the LCM and the Data Structure, the generally defined lifecycles of the LCM can be instantiated using the objects defined in the data structure Example: Car Navigation System To illustrate the described method, the method will be used to explain the addition of a navigation system to a car (Müller, Reichert, & Herbst, 2008). The release management (RLM), which systematically tests and releases different systems, subsystems, and components, requires several processes to be executed for each electrical component. These processes should be synchronised with processes of other components (test an assembly only after its components are tested individually). Note that the first two steps are performed by domain experts and are not specific for the navigation system, but for the automotive domain as a whole. Figure 2 - Data Model Figure 3 - Lifecycle Coordination Model The first step is the definition of a Data Model by a domain expert, shown in Figure 2. As can be seen, three levels of hierarchy are defined: TotalSystem, SubSystem, and Component. There are only two different types of relations (hassubsys and hascomponent) indicating that all SubSystems (Components) are related to the TotalSystem (SubSystem) in an identical way. 12


.")
14 PRELIMINARIES Figure 3 shows the Lifecycle Coordination Model: the object lifecycles and relations between these lifecycles. From this representation the link between the object type TotalSystem and the object lifecycle for TotalSystem, as well as its position in the hierarchy, immediately becomes clear. The relation types defined in the Data Model are also specified; the states of the different object types are connected to each other. With the first two models defined, the model level is completed. The third model created is the instantiation of the Data Model, and is called the Data Structure (Figure 4). This level is the first level in which the Navigation System has a role: the navigation system is a SubSystem used in the TotalSystem (Car B), and includes the Main Unit as only Component. Figure 4 - Data Structure Figure 5 - Data-driven Process Structure The final model created is the Data-driven Process Structure (Figure 5). This automatically generated model is constructed in a similar manner as the LCM in Figure 3; the objects of the Data Structure are replaced with object lifecycles, and the relations are added as well Remarks The most beneficial aspect of Data-driven Process Structures is that changes can be made fairly easy: changing the product does not automatically imply a complete redesign of the process structure, but is driven by changes of the product s data structure; these changes are automatically mapped to adaptations of the corresponding process structure, thereby saving efforts when evolving the process instance structure. In addition, data-driven process structures can easily contain many elements as they are constructed automatically. 2.4 Product-based Workflow Design The next method discussed origins from the Eindhoven University of Technology, and is named Product-based Workflow Design (PBWD) (Reijers, Limam, & Van der Aalst, 2003). Inspired by the manufacturing field and the Bill Of Materials (BOM), in which production, inventory management, and purchase management is driven by the structure of the product, PBWD proposes a similar approach for more data-intensive processes; using dependencies between 13
.")
15 PRELIMINARIES data elements, workflow models can be created (Kamphuis, Vanderfeesten, Reijers, & Van Hattem, 2008), (Vanderfeesten, Reijers, & Van der Aalst, 2011) Main entities Product-based Workflow Design is inspired by the Bill Of Materials used in manufacturing; however, since some of the aspects of the BOM are unnecessary (for example, cardinalities), an adjusted model for data-centric processes, the Product Data Model, is created (Reijers, Limam, & Van der Aalst, 2003). The main entities of the PDM are discussed below. Data Element. Represented as circles that contain the name of the object (or a letter representing this name), data elements are objects that contain specific information. Some elements are determined by the external environment ( leaf elements ), while other elements are determined by combining information of other objects. Once determined, data elements have fixed values (i.e. they cannot be updated). A special instance of a data element is the Top Data Element, for which the outcome has to be determined, it is the end product/final decision. Production Rule. A production rule (represented by a black dot) is used to combine information of data elements to create a value for another element. In the provided example, information of data elements B and C is combined to create a value for data element A. Rules can be either concrete or abstract; for both types an example is provided. - Concrete A = 3 * B + C - Abstract Human judgment on suitability of A based on elements B and C Attributes of Production Rule. Attributes provide information about other characteristics of activating the production rule. For example an identifier, cost and time can be provided. Product Data Model (PDM). This is the main entity of PBWD. It provides a complete overview of the different data elements and their relations, as well as the according production rules Example: the Helicopter Pilot This example shows the product data model that describes the process to determine someone s suitability to become a helicopter pilot (Reijers, Limam, & Van der Aalst, 2003). The top element is A, which corresponds to the suitability to become a helicopter pilot. Decisions are based upon psychological fitness, physical fitness (B and C), latest results of a suitability test from the last two years (D), and the quality of reflexes and eyesight (E and F). As can be seen from the arrows leading directly to a, a decision can be made based upon a combination of psychological and physical fitness {B,C}, results of a previous test {D}, or {F} quality of eyesight. In a similar way, a value for c can be obtained using the results from {E,F}. A decision (either positive or negative) can be made using one of the above described sets of data elements. However, to be able to choose the optimal path, additional information is required about time and cost. This kind of information is added to production rules; executing 14
, data elements are objects that contain specific information.")
16 PRELIMINARIES a production rule has a specified cost and time; the optimal path is determined by the selected optimisation criterion. Using the model and its constraints, the best solution with respect to a performance indicator (cost, time) can be selected. For the leaf elements in this example (elements that are acquired from external environment) no attributes of the production rules are specified; one can consider the cost and time for creating these elements to be zero. Using heuristics (Kamphuis, Vanderfeesten, Reijers, & Van Hattem, 2008) or by using the PDM directly (Vanderfeesten, Reijers, & Van der Aalst, 2011), a workflow can be created which is executable. However, both of these methods are not very sophisticated such that most often the PDM is used to obtain new insights in the process and is used as an aid in creating new workflow designs Remarks Figure 6 - Product Data Model Product-based Workflow Design proposes a true clean sheet method, only considering the actual data elements used in the process and their relations to each other. In addition, from the methods discussed, PBWD is the only one that is able to generate optimised processes. Limitation of the method is the required creation of a PDM, based on for example product specification, handbooks, production procedures, et cetera. Furthermore, the automatic generation of workflow designs is not yet refined, forcing manual creation of workflow designs. As a final comment, it can be seen as a limitation that data elements cannot be updated, making PBWD a more static method in this sense. 2.5 Artifact-centric Process Modelling IBM s Artifact-centric Process Modelling approach for the design of data-centric business process models is based on the concepts of business artifacts and their lifecycles. By combining data and behavioural properties, an approach is developed that can be used to analyse, manage, 15

17 PRELIMINARIES and control business operations (Nigam & Caswell, 2003), (Bhattacharya, Gerede, Hull, Liu, & Su, 2007) Main entities In the Artifact-centric Process Modelling approach, five different types of entities can be distinguished: artifacts, a business artefact information model, lifecycles, services, and associations. Together these five are the Business Operations Model, the logical specification of business process execution. Business Artifact. Concrete, self-describing, and unique entity that corresponds to a key data object. Artifacts have attributes that contain all information required for executing business processes. One of these attributes is an artifact s unique identity (ID) that cannot be changed; the other attributes of artifacts can be changed at will. An example of an artifact could be a customer, an invoice, or a task. Business Artifact Information Model. Overview of all artifacts in a system, including their relations to each other and the corresponding cardinalities. In addition, attributes of artifacts are included as well. Business artifact information models can be described perfectly using Entity-Relationship (ER)-models. Business Artifact (macro-level) Lifecycle. The lifecycle of an artifact provides its end-to-end process; it describes the states of an artifact from creation to disposal. Artifact may have different life expectancies: some live short, others long, and some are essentially permanent. Service. Unit of work that is meaningful to the business process. Services make changes to one or more artifacts; these changes are transactional; the service has exclusive control over the involved artifacts when making changes. Each service can be decomposed in four properties, which define the actual service in a structured manner. The four key aspects are Inputs, Outputs, Pre-conditions, and Effects (IOPE). For all required changes, the artifact and attribute that are changed are specified. When an artifact changes state as a result of the service, this is defined here as well. Association Rules. Changes made by services to artifacts are subject to a number of constraints. These constraints can be procedural (order of execution) or declarative (based on rules and properties) and are captured in rules. For each association rule an Event, Condition, and Action (ECA) are defined. When required, the person performing the action can be added as well ( By ) Example: the Restaurant Case A brief example, based on Nigam and Caswell (Nigam & Caswell, 2003), is shown here to illustrate the described method. The example considers a restaurant case, in which the restaurant offers a menu consisting of different meal options (e.g. pasta, pizza), thereby offering the opportunity to specify some additional features of the meal option (e.g. sauce). Since the specified meals can be very diverse, the required ingredients are not always directly available; unavailable ingredients should be prepared first (e.g. cutting vegetables). For each customer 16

18 PRELIMINARIES the restaurant keeps a Guest Check, on which the different ordered goods and their prices are listed. The first step in creating an artefact-centric process model is selecting all important artifacts and linking them to one another. Customer_ID Status Customer 1 GuestCheck_ID Status Total 1 Guest Check N 1 N Specified Meal N Meal_ID Status Type Ingredients Menu_ID Description 1 Menu 1 N 1 Meal Option Meal_ID Type Options Figure 7 - Step 1 : Create Business Artifact Information Model Figure 7 shows the five main artifacts that can be distinguished from the case description (blue rectangles). Where most artifacts are relatively straightforward, meal option and specified meal might require some explanation: on the menu, different meal options are specified. When a customer selects one of these meal options, he or she should directly make some choices regarding for example sauce and side dish; these choices are captured in the artifact specified meal, which in turn can be sent to the kitchen. Further note that all artifacts have different attributes (yellow ellipse), though all of them have an own, unique, identity (ID). In the second step lifecycles of artifacts are created. The case description did not provide much information regarding the lifecycle of artifacts; therefore there is relatively much freedom in creating these lifecycles. The lifecycle of the artifact Customer will be explained in Figure 8; other lifecycles are created in a similar way. When a new customer enters the restaurant, he/she will be allocated to a table. The customer is offered a menu, from which a meal can be selected (or specified, referring to the names used in the artifact information model). A customer then waits for the meal to arrive and starts eating when it does. During or after eating, new meals and/or drinks can be ordered from the menu. If the customer is done eating, he or she asks for the check, pays, and leaves the restaurant. Allocated to Table Order Specified Waiting for Order Consuming Order Finished Wait for Guest Check Payed Figure 8 - Step 2: Create Artifact Lifecycles 17
.")
19 PRELIMINARIES When artifacts are defined and linked, and lifecycles are created, the third step is to define the Services that can change states and attributes of artifacts. In Table 1 the service CreateCustomerProfile is specified. As can be seen, no input artifacts are required; a Customer artifact is created when a new customer arrives that is not yet created in the system. This customer directly gets an ID and is put in state Allocated to Table. Service Input Output CreateCustomerProfile (none) Customer Pre-condition Customer is not yet created Effects - Define Customer ID - Define state of Customer (Allocated to Table) Table 1 - Step 3: Create Services Rule 1 Register New Customer Events Order is received Conditions Customer is not yet registered Actions Invoke CreateCustomerProfile Table 2 - Step 4: Create Associations The final step considered of artifact-centric process modelling is the creation of Rules. Rules determine when a Service is invoked: at a certain event, that meets specified conditions, the according action is performed. The rule stated in Table 2 specifies when service CreateCustomerProfile is invoked. Four steps are currently defined in the creation of an artifact-centric process model. However, the final step performed did not directly lead to a process model; two additional steps can be performed that result in the actual creation of a process model, being i) Design of Conceptual Flow Diagram, and ii) Workflow realisation. These steps are considered too complex for inclusion in this thesis; in addition, as the other approaches also stop modelling at this point, this decision should not influence the evaluation Remarks Artifact-centric process modelling provides overviews of all important artifacts and their relations. In addition, the use of lifecycles allows greater flexibility to artifacts, including revisioning, checks, et cetera. Services and associations clearly specify which artifacts and attributes are changed, in what situation, and what conditions should be met. Although very specific, this set of models and tables might result in a relatively complex method, especially when models become bigger (Bhattacharya, Gerede, Hull, Liu, & Su, 2007); in addition, the relations between all models and tables in this method even further increase its complexity. 2.6 Qualitative Research With the methods under study discussed in the previous three sections, this section will focus on the qualitative research aspect of this study. As social changes in the world occur rapidly and frequently, traditional deductive methodologies are often difficult to apply. Instead of using deductive methodologies, which test hypotheses from theoretical models using empirical evidence, inductive strategies can often be applied; these inductive strategies do not start from theories and testing to quantify the problem, but try to explore or define the problem at hand; empirical data is used to develop theories for the topic of study. 18

20 PRELIMINARIES An approach that is often used in qualitative research is the Grounded Theory. Using this methodology, one is able to extract information from different types of data (e.g. text, observations, illustrations, spoken word), using a stepwise approach. The next section will elaborate on Grounded Theory Coding, and the aspects relevant for this study Grounded Theory Coding One research method which enables one to extract valuable information from text, observations, spoken word, et cetera, is the Grounded Theory (Glaser & Strauss, 1967), (Strauss & Corbin, 1998). Using a stepwise coding approach, this method is used to analyse data in order to develop one or multiple theories that are grounded in data, i.e. are based on the data from the used sources. The method should not be seen as an attempt to create a single truth; it tries to conceptualise what is going on in the data (Flick, 2009). It can be said that Grounded Theory operates in a reverse fashion from traditional social science research. Instead of formulating hypotheses and test them using the available data, data is obtained, coded, grouped, and finally categorised; the obtained categories can be used to formulate theories, or hypotheses. Stage Purpose Codes Identifying anchors that allow the key points of the data to be gathered Concepts Collections of codes of similar content that allows the data to be grouped Categories Broad groups of similar concepts that are used to generate a theory Theory A collection of explanations that explain the subject of the research Table 3 - Different Levels of Coding Four main phases can be determined (Flick, 2009): 1. Initial phase 2. Conceptual phase 3. Selective Phase 4. Reflexive phase Initial phase After the field and target population are selected and the required data is gathered, the first coding can be done. This open coding is not restricted in any ways, and is most often used to familiarise oneself with the data, creating a deeper understanding of the text (Flick, 2009). Codes are attached to the data, which are still closely related to the text; codes that are similar or even identical can be grouped into concepts, which are the basic building blocks of theories. Conceptual phase Using the codes and concepts determined in the initial phase, this second phase is used to define and refine categories, which are used to relate different concepts to a single category. While concepts are often self-describing, categories are more abstract descriptions. 19
. Using a stepwise coding approach, this method is used to analyse data in order to develop one or multiple theories that are grounded in data, i.e. are based on the data from the used sources.")
21 PRELIMINARIES Selective phase In the selective phase, the categories defined in the second phase are evaluated, comparing the core concepts of a category to those of another. In this selective phase, theories can be formulated and checked against the data. As the different levels of coding (codes, concepts, and categories) are documented in a structured manner, the coding can be used for formulating different theories as well. Reflexive phase In the reflexive phase, the quality of the used methodology is evaluated. Two quality attributes are important in this evaluation: Reliability and Validity of the method. Both these quality attributes will be briefly discussed here, thereby addressing how to tackle possible problems. Reliability. Two aspects regarding reliability are of importance. The first considers a clear separation of statements made by the subjects under study, and statements and interpretations made by the researcher. This distinction should be clear in order to create objective theories, theories that are really grounded in theory. Secondly, the methodology used to extract the information should be clearly and unambiguously defined, enabling others to trace the steps of the researcher. Validity. The validity concept discussed here is procedural validity. Elaborating on the second aspect of reliability, which states that the used procedure should be clearly defined, procedural validity describes some concrete aspects. Wolcott defines nine important aspects of validity: (1) The researcher should refrain from talking in the field but rather should listen as much as possible. He or she should (2) produce notes that are as exact as possible, (3) begin to write early, and in a way (4) which allows readers of his or her notes and reports to see for themselves. This means providing enough data for readers to make their own inferences and follow those of the researcher. The report should be as complete (5) and candid (6) as possible. The researcher should seek feedback on his or her findings and presentations in the field or from his or her colleagues (7). Presentations should be characterised by a balance (8) between the various aspects and (9) by accuracy in writing. (Wolcott, 1990). The main idea that becomes clear from these nine aspects, are that the researcher should try to limit his own input in the discussion, capture the statements of subjects as exactly as possible, and document the used approach completely and transparently. Validity is further increased if feedback is provided and used for improving the used approach. 2.7 Method Evaluation Model Where research often focuses on validating statements, which are either supported or not, evaluating methods is far less straightforward, since they only have pragmatic value: instead of right or wrong, methods are merely effective or ineffective. In order to try and evaluate the design methods of information systems, (Moody, 2003) uses the Technology Acceptance Model 20

22 PRELIMINARIES (TAM) as a starting point. TAM measures whether or not users accept the proposed technology; Moody adapts this model in such a way that is can be used to evaluate technology design methods. The three main aspects of TAM are perceived ease of use, perceived usefulness, and intention to use. Perceived ease of use corresponds to the extent to which a person believes that using the particular system will be free of effort. Perceived usefulness corresponds to the extent to which a person believes that using the particular system will help achieve the intended objectives. Intention to use corresponds to the extent to which a user intends to use the particular system (Moody, 2003). To measure the success of a method, two dimensions are proposed: 1. Actual efficacy: whether the method improves performance of the task a. Actual efficiency: how well are the achievements compared to the required efforts? b. Actual effectiveness: how well are the objectives achieved? 2. Adoption in practice: whether the method is used in practice. Moody stresses the fact that although a model can be superior to another model, the model is unsuccessful if it is not used in practice. A model which is used in practice but does not improve the performance of the task (or at least not significantly) can be considered unsuccessful as well. Figure 9 - Method Evaluation Model 21
23 THEORETICAL EVALUATION 3 Theoretical Evaluation In this chapter, the Theoretical Evaluation will be described. The first section of this chapter addresses the definition of quality, and the selection of quality attributes. These definitions and selected attributes will be used in both the Theoretical Evaluation (described in this chapter) and in the Empirical Evaluation (described in Chapter 4). For all three modelling methods, literature is studied for statements made by the developers of the methods, which address aspects and attributes of the different methods. Using Grounded Theory Coding, as described in section 2.6.1, these statements are coded and grouped, resulting in a set of claims made by the developers; which is the end product of this Theoretical Evaluation. 3.1 Quality and quality attributes Before any evaluation (Theoretical or Empirical) can be conducted, one should first define quality, and define and select quality attributes. The following two subsections address these definitions, which will be used in the Theoretical Evaluation as well as in the Empirical Evaluation Quality Before defining different attributes of quality, a definition for quality is provided first. The IEEE Standard Glossary of Software Engineering Terminology (IEEE, 1990) proposes two alternative definitions: 1. The degree to which a system, component, or process meets specified requirements; 2. The degree to which a system, component, or process meets customer or user needs or expectations. The first definition addresses the specified requirements of an entity, while the second focuses the customer s needs and expectations. In the Theoretical Evaluation the focus is on the specified requirements: capturing claims made by the developers, which address aspects and attributes of the methods. In this first evaluation, the quality attributes are only used to group the different aspects and attributes of the selected methods. The second evaluation, the Empirical Evaluation, focuses on the users perspective (capturing the needs and expectations of the users), thereby addressing the second definition of quality Quality attributes The ISO/IEC 9126 (Software Engineering - Product Quality) is an international standard for the evaluation of software quality. Though the evaluation considered in this report is not directly a software quality evaluation, the ISO standard provides a great starting point for evaluating conceptual modelling methods. The six different quality attributes distinguished by ISO/IEC 9126, being functionality, reliability, usability, efficiency, maintainability, and portability, will be briefly addressed, providing short definitions of these attributes as used in the IEEE Standards. As already mentioned, not all concepts described in ISO/IEC 9126 are directly useful for this evaluation. Since the selected concepts are normally considered in a software environment, some of the selected attributes relate specifically to software, and are not 22
24 THEORETICAL EVALUATION suitable for evaluating a conceptual modelling method. The attributes that not suit conceptual modelling will be discussed first. Reliability, specifically in its provided definition of a system performing under stated conditions for a specific period of time, is not considered, since the actual creation of a system or model is outside the (selected) scope of the method. Using the same reasoning, portability ( the ease with which a system or component can be transferred from one hardware or software environment to another. ) can be left out as well. An important attribute that is not incorporated in the ISO/IEC 9126, but that might be interesting for this study, is flexibility. Although flexibility is to some extent related to portability, it better fits the quality of process modelling methods. Flexibility is defined by the IEEE as The ease with which a system or component can be modified for use in applications or environments other than those for which it was specifically designed. (IEEE, 1990). The flexibility attribute thus takes into account whether the approach is usable in a variety environments, or that it is constrained to specific environments or domains. The complete list of quality attributes selected for this study can be found in Table 4. Quality attribute Functionality Definition A defined objective or characteristic action of a system or component. Usability Efficiency Maintainability Flexibility Table 4 - Selected Quality Attributes 3.2 Claims by Developers The ease with which a user can learn to operate, prepare inputs for, and interpret outputs of a system or component. The degree to which a system or component performs its designated functions with minimum consumption of resources. The ease with which a software system or component can be modified to correct faults, improve performance or other attributes, or adapt to a changed environment. The ease with which a system or component can be modified for use in applications or environments other than those for which it was specifically designed. Literature of the selected methods is explored for quotes made by developers regarding aspects and attributes of their method. These quotes are coded and grouped using Grounded Theory Coding, after which claims can be defined. These claims are used to create a mapping of the selected methods to each other; such a mapping is essential for a fair comparison, as the methods differ in origin, use, and goal. The selection of articles will be discussed in section 3.2.1, the coding process will be discussed in section 3.2.2, and the acquired claims are provided in section Finally, section explains how the table of claims can be used in the comparison of methods Selecting Articles An important aspect of this Theoretical Evaluation is the selection of articles, as it determines the quality of claims as well as the maximum number of claims extracted. Note that a large 23
25 THEORETICAL EVALUATION number of claims not necessarily implies a better method; additional claims merely indicate that more is studied (or at least claimed) by developers. Method Year Article # Cited DDPS PBWD ACPM (2007) Müller, D., Reichert, M., & Herbst, J. (2007). Data-Driven Modeling and Coordination of Large Process Structures. Lecture Notes in Computer Science, 4803, (2008) Müller, D., Reichert, M., & Herbst, J. (2008). A New Paradigm for the Enactment and Dynamic Adaptation of Data-Driven Process Structures. Lecture Notes in Computer Science, 5074, (2003) Reijers, H., Limam, S., & Van der Aalst, W. (2003). Product-Based Workflow Design. Journal of Management Information Systems, 20(1), (2011) Vanderfeesten, I., Reijers, H., & Van der Aalst, W. (2011). Product-Based Workflow Support. Information Systems, 36(2), (2003) Nigam, A., & Caswell, N. (2003). Business Artifacts: An Approach to Operational Specification. IBM Systems Journal, 42(3), (2007) Bhattacharya, K., Gerede, C., Hull, R., Liu, R., & Su, J. (2007). Towards Formal Analysis of Artifact-Centric Business Process Models. LNCS, Table 5 - Articles Used for Claims The following approach is used to determine the set of articles. First, the names of the different methods were inserted in the Google Scholar search engine. The articles that indeed related to the methods targeted in this study (using knowledge from previous search attempts, authors, and abstracts) were selected and sorted in a decreasing order of times cited. For each method, the two articles that were cited most were used as input for the Theoretical Evaluation. An exception is made for (Vanderfeesten, Reijers, & Van der Aalst, 2011): while (Vanderfeesten, Reijers, & Van der Aalst, 2008) was cited more often, it considered a conference proceeding, while another article from the same authors and with a (nearly) identical title was published in a journal. Table 5 provides an overview of the selected articles Coding the Articles The articles selected in section are studied and directly coded; codes capture the essence of quotes from the articles. This first open coding helps understanding the article, while at the same time it initiates the coding process. Similar or identical codes can be grouped into concepts; these collections of codes describe the underlying idea of multiple codes. The final level in this coding hierarchy is obtained when similar concepts are grouped in order to obtain categories. Categories are special in this study, as they correspond to the quality attributes selected in section For each of these categories (or quality attributes ), theories ( claims ) can be defined, using the different levels of coding as a guide. An overview of the used hierarchy of coding is provided in Table 6. Level Quote Codes Concepts Categories Theory Purpose Direct statements made (often text or recording) Capturing essence of quote, noise removed Collections of codes of similar content, capturing its underlying idea Groups of related concepts; in this study, categories correspond to Quality Attributes Idea of what is actually going on in the data; in this study, theories correspond to Claims Table 6 - Hierarchy of Coding 24
26 THEORETICAL EVALUATION Using this transparent approach, claims can be derived from text, while remaining all original information intact. The coding process is not only used for identifying internal similarities in a method; formed concepts can also be used externally, identifying topics addressed in multiple methods. The resulting set of claims for each method is grounded in literature, and can be used in the evaluation and comparison of the three data-centric methods. Please note that this theoretical evaluation itself is not intended to judge or rate the methods; its most important goal is to create a mapping of the methods to each other, thereby providing a basis for a fair empirical evaluation Acquired Claims Table 7 contains all claims that were extracted from the literature, clustered to their corresponding quality attributes; note that this clustering neither adds nor removes information, as it merely proposes an order of representation of the selected claims. The original coding tables can be found in Appendix D (DDPS), Appendix E (PBWD), and Appendix F (ACPM). In order to enhance understanding of the set of claims provide in Table 7, some examples and interesting parts of the table will be highlighted. From Table 7 one can for example deduce that with respect to Efficiency, all methods allow multiple instantiations of their models (see D6, P8, and A7). While Product-Based Workflow Design mentions the creation of different process models based on different optimisation criteria, Artifact-Centric Process Modelling and Data-Driven Process Structures stresses the specification and instantiation of generic schemas with multiple customisations. The claims that are allocated to Flexibility even show greater similarities; all developers claim that their method is applicable in other domains, though the developers of PBWD temper this by stating that a clear concept of the product should exist (claim P11). Not all claims made by the developers are purely positive claims. For example claim D5 (attribute: Usability) addresses that experts should require profound business knowledge in order to be able to create the models used in the approach; this could be explained as negative, as creating the models becomes a task that can only be performed by some experts. It should therefore be noted that once these claims will be tested, one should carefully take into account whether the support/contradiction considers positive or negative statements. The set of claims that is provided in Table 7 is most importantly intended to be in accordance with the selected literature; it might be that additions to this table could be made when additional articles were selected, or when the developers themselves were asked to provide input based on the given quality attributes. However, as the used articles were selected with great care and the claims were extracted in a comprehensive and structured manner, the set of claims should be at least representative. 25
27 METHODS THEORETICAL EVALUATION Data-driven Process Structures Product-Based Workflow Design Artifact-Centric Process Modelling FUNCTIONALITY -Goal of method D1 Data-driven modelling of large process structures; ensuring correct coordination, reducing modelling efforts, and providing mechanisms for maintenance. P1 Method that (re)designs a process reasoning from the desired outcome, without directly discussing how to achieve it. A1 A2 Representation usable by business people to analyse, manage, and control business operations Substantial new insights can be acquired by managers -How to achieve goal D2 Separation of data and process logic, leading to an enact able process structure P2 Analytical, clean sheet approach: rational and quantitative way of deriving an optimised process design. A3 Declarative approach, that incorporates formality required for rigorous design and analysis -IT Support D3 IT Support for automated creation and soundness checks P3 PDM (in)directly used to steer workflow: basis for process model. USABILITY -Understandability P4 P5 Created models are accepted by end users as valid and workable. Based on existing concept (BOM) A4 A5 Intuitive appeal to business managers, somewhat foreign to business process professionals Based on existing methods and techniques -User: ease of use D4 Intuitive integration of data and (sub-)processes enables users to instantiate and adapt model without process knowledge (by adapting data structure at a high level of abstraction). -Expert: ease of use D5 Process experts require profound domain knowledge to create data model and LCM. P6 P7 Efforts required to collect data for PDM differs for every company. Constructing PDM is manual task A6 Identifying artifacts is an iterative process that requires understanding of entire business process. EFFICIENCY -Multiple instantiations of models D6 Instantiating different data structures and generating the respective data-driven process structures P8 Using different optimisation criteria, different process models can be created. A7 Enabling specification of generic schema with multiple customisations. -Automated creation D7 Automated creation of Process Structure P9 Algorithms and PBWS can be used to automatically generate process models or recommendations for carrying out operations. -Reusability D8 Standardising processing of objects in order to increase the reuse of process models and reducing modelling efforts. -Reduce modelling efforts D9 Separation of data and process logic results in a reduction of modelling efforts. A8 Separation of data management concerns from process flow concerns -Optimising process P10 Optimisation of the process by including optimisation criteria. MAINTAINABILITY -Changing models D10 Changes can be made at datalevel (during either build time or runtime) and are automatically translated into corresponding adaptations of the process A9 Changes can be made to conceptual flow and business workflow, while preserving the same Business Operations Model. FLEXIBILITY -Other environments D11 Usable in other environments, not specifically the engineering domain. P11 Restricted to fields where clear concept of the products to be delivered exists. A10 Usable in other environments, particularly in the use of consumed and non-consumed goods. Note: for the derivation of the quotes and the corresponding articles, see Appendix D (DDPS), Appendix E (PBWD), Appendix F (ACPM). Table 7 - Theoretical Evaluation: Claims by Developers 26
28 THEORETICAL EVALUATION Comparison Table 7 can be used to compare the methods. Using the categories and concepts in the left column, one can pick a concept that is addressed by multiple methods, and compare the methods on that concept. The high level description of the concept enables the comparison between methods. It should however be noted that the identified claims merely address the same concept; the exact contents of the claims might be different. An example is provided in order to illustrate the described approach. Suppose one wants to know whether models should be created by hand or can be generated automatically. At the header Efficiency, one will find Automated Creation, and will see that at least to some extent the Data-Driven Process Structures and the Product-Based Workflow Design claim to provide some automated creation possibilities (and hence can be compared). Two important notes should be made regarding the use of Table 7. Firstly, one should note that the concepts are defined using the selected articles. Therefore, the list of concepts might not be complete: the concepts should only be seen as a classification of the identified claims, an aid in reading the table and identifying similarities and differences. The second aspect to consider is that an empty cell in Table 7 does not necessarily imply that the method does not have any initiatives regarding this concept; the concept is merely not discussed in the selected articles. Though the selected articles should provide an objective and representative set of claims, it is possible that specific concepts are not addressed in the selected articles, and thereby not captured in Table 7. 27
29 EMPIRICAL EVALUATION 4 Empirical Evaluation For the Empirical Evaluation of the three methods, workshops are used to acquire peoples perceptions and opinions about the selected methods. A total of three workshop sessions is conducted; in each of these sessions one of the methods is studied and discussed, thereby obtaining the participants impressions of the method. This chapter addresses the approach used for this Empirical Evaluation, and is structured as follows: first, in section 4.1, the used methodology is discussed. Next, in section 4.2, the actual results of the Empirical Evaluation are provided. In Chapter 5 these results will be combined with the results from the Theoretical Evaluation. 4.1 Methodology The three methods are evaluated in a workshop setting. The idea of these workshops is to provide participants with a tutorial of one of the methods, which the respondents have to study. Hereafter, a brief questionnaire is filled in, capturing participants first impressions, followed by a group discussion in which different strengths, weaknesses, ambiguities and improvement opportunities are discussed among the participants. The workshop sessions conclude with discussing the solutions of the exercises. In addition to the three workshops, people unable to attend at one of the sessions were given the possibility to participate digitally, thereby only participating in the first two steps (the tutorial and questionnaire). See Figure 10 for an overview of the layout of the workshops. Study Tutorial Fill in Questionnaire Group Discussion Solutions to Exercises Study theory, examples, and make exercises In each of this chapter s following subsections, the different elements of the workshops are studied in greater detail: the tutorials (section 4.1.1), questionnaire (section 4.1.2), discussion questions (section 4.1.3), respondents (section 4.1.4), the workshop setup (section 4.1.5), and finally the approach to extract results from the discussion (section 4.1.6) Tutorials Questionnaire capturing demographics and first perceptions Figure 10 - Overview of Workshop Structure Participants discuss method Proposed solutions are presented In order to provide the participants with sufficient knowledge to evaluate the different methods, tutorials are created that should be clear and correct. The goal of the tutorials is not to provide a complete manual for the methods; instead it should be seen as a first introduction to the method, showing its ideas and opportunities. The tutorials are created to be self-explaining; no input of the researcher during the workshops is required. A first draft of the tutorials is created based on the existing literature. The tutorials are then revised by developers of the method, thereby ensuring that the contents of the tutorial are correct. After adjustments are made and additional information received from the developers is included, two master students are asked to study the tutorials in order to identify any 28
30 EMPIRICAL EVALUATION existing unclear sections or figures, which are then adapted or removed as well. The resulting tutorials are in this way approved on both content and understandability. The tutorials are created using the following structure. First, a general description of the method is provided, defining the goal and approach used in the method. Next, the main concepts of the method, including all entities, models, and tables created, are described. An example is then used to illustrate the method, followed by a number of exercises to get some hands-on experience. This last part of the tutorial, that contains the exercises, is also used as information source for the empirical evaluation. The complete tutorials can be found in Appendix A (DDPS), Appendix B (PBWD), and Appendix C (ACPM) Questionnaire A brief questionnaire is created that should be filled in directly after the tutorial is completed. The questionnaire consists of two parts: the first part addresses demographic traits of the participants and their experience with process modelling. These questions are based on the demographic questionnaire as used in the Cheetah Experimental Platform (Pinggera, Zugal, & Weber, 2010). Cheetah Experimental Platform is developed in order to foster experimental research on business process modelling; it enables the quick assembly of workflows, and in addition can include questionnaires, used for capturing additional data (e.g. demographic data). The questionnaire used for obtaining this demographic data, was provided by one of Cheetah s experts. This part of the questionnaire provides insights into the composition of the group of participants, as well as into their previous experience with modelling and with different modelling methods. The second part of the questionnaire focuses on the first impressions regarding perceived ease of use, perceived usefulness, and intention to use, as proposed in (Moody, 2003). This section of the questionnaire thus captures the respondents first impressions of the method, before discussing any of the methods aspects with the other participants. It thereby provides a good impression of the respondents perceptions of the method, based on the tutorial alone. The complete questionnaire can be found in Appendix G Discussion questions After the tutorial and questionnaire, discussion questions are proposed to share and discuss ideas among the participants. As the participants in a single workshop session all received an identical tutorial, they can discuss their own interpretation of any ambiguities present. The discussion will thereby capture the interpretations of the participants; the way they think the method is intended or should function best. In order to facilitate a structured analysis, all discussions are recorded such that they can be literally analysed in a later stadium. 29
31 EMPIRICAL EVALUATION The questions addressed in the discussion are the following: 1. Were there unclear sections regarding method or application of method? 2. What do you think are strong points of this approach? 3. What is in your opinion a limitation or weakness of this approach? 4. Was the method complete? What was lacking? 5. How versatile do you think the method is? 6. Do you have any suggestions for improving the method? Though the questions are stated here as a list of things to be discussed, the discussion was semi-structured; the statements were shown on a slide as a guideline for the discussion, a set of interesting topics to address. A semi-structured discussion enables participants to elaborate on their responses, disclosing important and often hidden perceptions (Qu & Dumay, 2011); it is in this sense very useful for obtaining users perceptions Participants The participants for the workshops were volunteers gathered from the mailing list of the BPM Round Table Eindhoven 1 ; this is a group of business professionals and academics with an interest in business process management and modelling. It should be noted that members of this mailing list are merely interested in the subject, not necessarily experts in process modelling. However, as the participants volunteered, most of them are likely to have at least some experience in the modelling of processes and an interest in data-centric modelling approaches. All members of the mailing list received an with an invitation for the workshop. After a reminder was sent, a total of 26 positive responses was received: fourteen respondents that were able to participate in the workshop sessions and twelve participants willing to attend the digital sessions. The fourteen respondents that were able to attend at the workshops were allocated to one of the sessions. Due to planning restrictions, these initial groups differed in size; six graduate students were therefore asked to complement the groups such that each workshop session contained six or seven participants. The professionals that registered for digital participation were distributed evenly over the three sessions (four digital participants for each of the methods) Workshop setup Three different workshop sessions are conducted; one for each of the selected methods. All these workshops have an identical outline. First, the tutorials are handed out and studied by the participants. The tutorial and the corresponding exercises are self-explaining, individual assignments; no questions regarding contents can be asked. After completing the tutorial, the questionnaire (see section 4.1.2) is handed out in which a first evaluation of the method is made. Next, the participants discuss any present ambiguities, strengths, weaknesses, and possible improvement opportunities. This discussion is recorded, to be able to analyse it in detail in a later stadium. The session ends by showing the participants the solutions as proposed by 1 For more information on the BPM Round Table: 30
32 EMPIRICAL EVALUATION the developers of the method. Digital participants only participate in the first two steps; they cannot join the discussion and are not provided with proposed solutions Extracting Results from Discussion Whereas the questionnaire includes clear variables and constructs, these variables and constructs are less prominently present in the discussion. In order to extract the information from the recording of the discussion, several steps were made to quantify the information included in the discussion. The first step in extracting users perceptions from the data, is the creation of an excerpt of the discussion, which is based on the recordings of the discussions. Though not identical to a transcript, which is a written record of spoken language, the excerpt serves an identical purpose. It can be seen as a set of quotes made by the participants, capturing their statements and responses to each other. Each quote is identified by a number, which can be used to relocate the specific quote. After the quotes are captured, Grounded Theory Coding is used to code these statements in a structured manner. Using an approach similar to the one used for the extraction of claims from literature (discussed in section 3.2.2), codes are used to capture the essence of the quotes. As multiple codes might address the same quality attribute, codes are categorised to the different quality attributes defined in This grouping of coding is a subjective task; some of the quotes could have been allocated to another attribute as well. However, no information is lost due to the mere fact that the division does not add or remove any information from the table; it only provides an overview of the quotes extracted from the discussion and their location in the table. An overview of the extracted results of the discussion can be found in Appendix I (DDPS), Appendix J (PBWD), and Appendix K (ACPM). 4.2 Results Results obtained in this empirical study are obtained from three different sources. The first information obtained is received from the questionnaire, filled in by all respondents individually. In addition to the information obtained from the questionnaire, the results extracted from the discussion provide another source of data. The final source of information can be found in the exercises that were included in the tutorials. The next subsections are divided in an identical way. First all information obtained from the questionnaire is provided, for each of the three methods. In section the results extracted from the discussion will be addressed, again for all methods separately Results of Questionnaire In this subsection the results of the questionnaire are considered. The first part of the questionnaire includes demographic questions for the participants, as well as some questions regarding their modelling experience. The second part of the questionnaire addresses the participants first impression towards the method. Using the Method Evaluation Model (Moody, 2003), as described in section 2.7, the participants perceptions towards ease of use, usefulness, and intention to use, are considered. 31
33 EMPIRICAL EVALUATION User demographics. The participants of the workshop sessions were business professionals as well as students, invited via the mailing list of the BPM Round Table. A total of 29 people were willing to participate (93% male); 20 professionals and 9 students. Of these participants, 9 were novices in modelling, 15 intermediates and 5 experts. Other demographic details can be found in Appendix O. User perceptions. Although the used questionnaire and its constructs are already tested by Moody for their validity and reliability (Moody, 2003), an additional check is performed in this study to verify the results obtained by Moody. This ensures that the results from this study are in accordance with the study performed by Moody, before conclusions are drawn from the acquired data. Validity The questionnaire used to acquire information on the perceived usefulness, perceived ease of use, and intention to use, is constructed and validated by Moody (Moody, 2003). Unfortunately, the number of participants in this study is far below the minimum requirements for conducting a factor analysis (rule-of-thumb is 200 participants, (Field, 2005)), which therefore cannot be performed. For this reason, the validity of the questionnaire is not checked. Reliability As already mentioned, the relatively small sample size hinders the use of a factor analysis for checking the validity. Calculating the reliability of the components is however possible using a relatively small sample size. For each of the constructs, a reliability analysis is conducted, using Cronbach s alpha. Cronbach s alpha measures how much of the variation in a scale is due to systematic rather than due to measurement error. For the three constructs tested in the questionnaire the following values were obtained for Cronbach s alpha. Construct # items Cronbach s alpha Perceived Ease of Use 6 0,771 Perceived Usefulness 7 0,742 Intention to Use 2 0,522 Table 8 - Cronbach's alpha In literature a score for Cronbach s alpha above 0,7 is often considered acceptable (Field, 2005); the score for Intention to Use is below this rule-of-thumb cut-off point. This low score for Cronbach s alpha indicates a systematic error; furthermore, as the scale only consists of two items, it is impossible to delete an item that causes this low score for Cronbach s alpha. The scales Perceived Ease of Use and Perceived Usefulness, which have a value for Cronbach s alpha greater than the cut-off point, will be evaluated in the following section. The value obtained for Intention to Use is below this cut-off point; Intention to Use is therefore omitted from further analysis. 32
34 EMPIRICAL EVALUATION Scores Since the number of participants was relatively low, it is difficult to detect significant differences between perceived ease of use and perceived usefulness for the different methods. An impression of the participants responses to the questionnaire (or better, the tutorial), can be provided using a boxplot (Figure 11 and Figure 12). From the boxplot it can be seen that PBWD is perceived as most easily usable; nearly 75% of the participants rated the ease of use with a score above three (which is the score for neutral ). DDPS scores worst on perceived ease of use, with over 75% of the respondents giving a score below three. Interestingly, DDPS scores relatively high on perceived usefulness. PBWD, which is perceived as relatively easy to use, in turn scores worst on the perceived usefulness. The Artifact-Centric approach has a median score above three for perceived usefulness, though the scores are ranging from less than two to four. Figure 11 - Perceived Ease of Use Figure 12 - Perceived Usefulness In order to check whether or not students structurally provided different answers in the questionnaire, separate boxplots are generated for students and experts (Appendix H). The most interesting differences were perceived at DDPS, which contained a relatively large number of students. After checking whether or not these differences were significant (see Appendix H) it can be concluded that these differences were not. Therefore, all participants were included in the further evaluation Results of Discussion The second data source considered is the group discussion. As explained in section 4.1.6, the recorded discussion is coded using the Grounded Theory, thereby extracting the users perceptions towards the method in a structured and objective manner. After coding the quotes from the discussion, stating whether they were positive (+), negative ( ), or neutral/undecided (±) in nature, and grouping them to their corresponding quality attribute (see section 4.1.6), a table is created for each of the three methods that contains this information. For each of these tables a brief description per quality attribute is added, identifying main issues discussed. The overview of perceptions from the participants of the workshops can be found in Table 9 (DDPS), Table 10 (PBWD), and Table 11 (ACPM). 33
35 EMPIRICAL EVALUATION Data-Driven Process Structures Label Table 9 - Overview Discussion: Data-Driven Process Structures Functionality. Controlling the workflow, and invoking sub processes according to specific states, is a positively evaluated aspect of functionality. A negative aspect addressed the limited details incorporated in the models, which are perceived as vital for the creation of workflows. Usability. Hierarchy is perceived as one of the major benefits of the method: it improves readability and enables reasoning using abstract models. Furthermore, known concepts are incorporated in the method, which are easily recognised by users. Creating the Data Model and LCM is done by an expert, while a user should be able to instantiate the Data Model. However, the abstract model Data Model is perceived too complex for users, making instantiation difficult. In addition, the definition of a generic Data Model suitable for all different situations, is perceived as difficult as well. The final remark addresses the automatically derived Process Structures: these models quickly become unreadable and chaotic. Efficiency. The most often mentioned perceived aspect of efficiency is the automated generation of a workflow. Modellers only need to define the Data Models and an LCM, and based on the Data Structure (defined by the user) and the LCM, a model is generated. In addition, Data Models and OLCs can be easily reused, which is efficient as well. Maintainability. Adaptations to the model, both in processes and data elements, can be made in their corresponding place. This reduces the risk of errors compared to systems in which a single change has to be made in several places. Furthermore, as the model is generated automatically, these adaptations can be automatically translated into a new process design. Flexibility. The method is applicable in many different environments. The generic structure can be seen as one of the major advantages for use in different environments. 34 Quotes Functionality + Controlling workflow using data 12, 27, 28, 36, 38 Missing details: roles, triggers, process view, origin of data 45, 56, 64, 65, 66, 67 Usability + Hierarchy improves readability 31, 51, 53 + Increased understanding by using existing concepts/methods 46, 60 + User only has to instantiate data model 14, 16, 20 ± System boundaries should be clearly defined 25, 39, 47, 49 ± Abstract model should fit concrete situations 6, 9, 10, 13, 17, 21 ± Fit of completeness and readability 1 32, 33, 41 Unclear overview: large models 34, 35, 37, 40, 52 Business analyst requires profound business knowledge 22, 23 Abstract models for analysts: too complex for users 1, 3, 4, 7, 8, 19, 63 Efficiency + Automated generation of workflow 15, 54, 62 + Reusability of models 29, 42, 43, 59 + Separation of data and process logic 44 Maintainability + Adaptation of model in one place 11, 30, 57 + Automatically translate adaptations into a new process 55, 58 Flexibility + Generic model 26, 61 + Usable in other environments 5, 26, 50, Though represented at usability, this label also refers to functionality: balancing completeness (functionality) and readability (usability)
36 EMPIRICAL EVALUATION Product-Based Workflow Design Label Quotes Functionality + PDM basis for redesign: orderless, insights in indirect processes, 14, 22, 26, 27, 28, 29, 33, and benefits in large processes 58, 64, 66, 72 + Explicitly defined rules 41, 73 ± PDM is no end product 21, 34, 39 Missing details: input, roles, triggers, different views 7, 40, 62, 65, 69, 74 Usability + Business analyst creates PDM 13 + PDM understood by customer 35, 36 + Increased understanding by using existing concepts/methods 60, 71 ± Fit between completeness/understandability 4, 31, 53 ± Alternative approaches could reduce complexity of PDM 3, 5, 46, 48, 49, 55 Abstract models for analysts: too complex for users 32, 37, 44, 61 PDM does not help reasoning 19, 25 Difficulties in use: alternative paths, orderless, rules, tables 1, 9, 43, 47, 59, 63 Unclear overview: direct/alternative paths, large models 2, 30, 52, 54, 56, 57 Efficiency + Optimising: order, cost, and time 15, 16, 17, 18, 20, 23, 24, 42, 67 Maintainability Flexibility + Usable in other environments 38, 70 Practical problems less straightforward 11, 12 Table 10 - Overview Discussion - Product-Based Workflow Design Functionality. A PDM can be seen as a basis for redesign; the mapping of required and explicitly defined operations and data elements provides valuable insights for businesses. Note that the creation of a PDM is not a goal on its own; it should be used as a basis for redesign (e.g. optimising a workflow). As a PDM is sequence independent, an objective optimisation can be performed. Some comments were made regarding the limited details used in a PDM. Usability. Alternative paths which are required for the completeness of a PDM, add additional links between operations and elements; the overview of a PDM becomes blurred by these alternative routings, and the readability of the PDM decreases as well. Alternatives were proposed to reduce the effect of alternative routings. Regarding usability for the client, no consensus was reached; it is unclear whether or not business professionals are able to understand a PDM and use it for reasoning, without intensive training. Efficiency. PBWD offers opportunities to optimise the process. The PDM is based on the structure of the product and not the existing process; this objectivity ensures that only required operations are included, thereby optimising cost, time, etc. Maintainability. In the discussion, maintainability was not addressed. Flexibility. According to the participants, the method is applicable in almost every domain. However, to some participants it is unclear how problems in practice can be modelled using this method. 35
37 EMPIRICAL EVALUATION Artifact-Centric Process Modelling Label Table 11 - Overview Discussion - Artifact-Centric Process Modelling Quotes Functionality + Structured method: capturing knowledge, roles, and rules 12, 15, 16, 33 + Interaction of artifacts and lifecycles: communication, workflow 18, 19, 20, 24, 29, 39 + Hierarchy of artifacts possible 26 + New insights in process 8, 11, 28, 46 Missing details: input, output 36, 40 Usability + Increased understanding by using existing concepts/methods 45 ± System boundaries should be clearly defined 1, 2, 3, 6, 27 Abstract models for analysts: too complex for users 7, 13, 14 Difficulties in use: determination of artifacts, attributes, flow, and 4, 5, 23, 31, 34, 47 rules Limited understandability: artefact not intuitive, unclear added value, confusing reasoning, and non-self-explanatory method. Efficiency + Reusability of Artifacts and Lifecycles 21 Maintainability Adaptation of models in several places 9, 10, 30 Flexibility + Usable in other environments 32, 37, 44 17, 22, 25, 35, 38, 43 Functionality. Using rules and formal descriptions, this method is very structured. By defining and coupling artifacts and lifecycles or artifacts, interactions between these artifacts become clear, and new insights can be acquired. However, for this method to work, systems boundaries should be clearly set, and additional information for Services and Rules should be included in the model. Usability. The participants had difficulties with artifact and lifecycles models; it is for example difficult for modellers to select all important artifacts and include the required attributes of these artifacts, or to define the Rules that state when Services are invoked. Overall, the added value of the method was somewhat unclear to the participants. Many of the modelling techniques used are however familiar to the users, which increasing the understandability of the method. Efficiency. Though every artifact needs to be created separately, different workflows can use the same artifacts; they do not need to be created for every different workflow one would like to model. The reusability of artifacts contributes to the method s efficiency. Maintainability. Adaptations to the model have to be made in multiple places. Especially in larger systems, the number and complexity of required changes increases. Flexibility. The respondents agree that the method is defined very broadly and thereby applicable in different situations. 36
38 EMPIRICAL EVALUATION Results of Exercises A final interesting source of data can be found in the answers provided to the exercises. All respondents present at the sessions, as well as most digital respondents, were able to provide answers to exercises in the form of drawings. In this section these drawings will be evaluated. Though the participants already have shared their views and opinions regarding the method, a closer look at their solutions to the exercises is provided. This not only provides additional insights to their real understanding of the method and its models, it also provides an indication from which part of the method possible difficulties arise. It is neither likely nor required that the provided answers are identical to the proposed solutions; if the participant grasped the idea and created answers similar to the proposed solutions, these will be evaluated as good. If the participant merely copied the examples of the tutorial, the rating will be fair. If the participant created an incorrect answer or produced a wrong model, this will be evaluated as poor, and if no answer was provided at all, nil is assigned. Note that nil can be assigned both to models participant did not know how to create, as well as to models that were not created due to time constraints; the final exercises are hence likely to have a relative high number of missing input, i.e. nils. Data-Driven Process Structures Table 12 provides a summary of the evaluation of the created models. The creation of lifecycles was often well done. Some of the participants made a fairly easy lifecycle, though this is probably not caused by a lack of understanding. Creating an LCM based on these OLCs did not lead to problems for most participants either, though some participants forgot (or possibly omitted) the initiators for SubSystems/Components. Good Fair Poor Nil 2a Create Object Lifecycles 78% 11% 11% 2b Create LCM 78% 22% 3 Create Data Structure 67% 22% 11% Table 12 - Results exercises: Data-Driven Process Structures Product-Based Workflow Design A summary is provided for the evaluation of the exercises created for the Product-Based Workflow Design in Table 13. As can be seen, relatively high scores were obtained for the first exercises; however, when the complexity of the assignments increased, these scores dropped. Good Fair Poor Nil 1.1 Select Data Elements 100% 1.2 Create Product Data Model 78% 12% 2.2 Create Product Data Model 63% 25% 12% 2.3 Create Production Rules 50% 38% 12% Table 13 - Results exercises: Product-Based Workflow Design 37
39 EMPIRICAL EVALUATION The respondents had quite some problems with alternative paths; both the idea of alternative paths as well as the identification of these paths. One participant for example showed multiple paths to the top element, while each of these paths included one of the requirements for qualification for the Dutch citizenship : this completely changed the functionality of the PDM (instead of knockouts, all these paths were now obligatory when applying for a Dutch citizenship). Artifact-Centric Process Modelling A summary of the results of the exercises is provided in Table 14. As can be seen, a relatively large percentage of the respondents had difficulties with the exercises: especially lifecycles, services, and rules were difficult assignments for the respondents. Lifecycles differed considerably in level of detail. While some described complete processes of entering and ordering, others described only major changes, like registering, editing, and archiving. Both are possibilities, though the information in the lifecycles should be relevant for other artifacts and/or lifecycles. Good Fair Poor Nil 1a Identify Artifacts 60% 30% 10% 1b Provide lifecycles 40% 30% 30% 2a Logical Design Artifacts 70% 10% 10% 10% 2b Specify Services 40% 30% 20% 10% 2c Specify Rules 30% 30% 10% 30% Table 14 - Results exercises: Artifact-Centric Process Modelling 38
40 RESULTS 5 Results After gathering all results and representing them in a systematic way, the results can be combined into aggregated views on the quality attributes of the method. The claims of the developers gathered in the Theoretical Evaluation (literature) will be reviewed using the Empirical Evaluation (questionnaire, discussion and exercises); an aggregated view for each of the methods, organised per claim, will be provided. The next sections will be structured as follows. Each section starts with a brief overview of the scores for Perceived Ease of Use and Perceived Usefulness, as obtained from the questionnaire; this serves as a first impression. Next, the claims made by the developers (also see Table 7 on page 26) are listed, grouped by their corresponding quality attribute. Using the empirical results from the three available sources, these claims will be tested. There are four options for a claim, each of them with a corresponding colour code that directly indicates which of these four options is the case for the discussed claim. The four options are: 1. The claim is supported by the participants ( ); 2. There is no consensus amongst participants ( ); 3. Participants contradict the claim ( ); 4. The claim is not addressed in any of the sources ( ). A claim is contradicted if less than 35% of the participants support the claim; if support is between 35% and 65%, it is said that no consensus is reached; finally, a claim is said to be supported if at least 65% of the participants support the claim. In addition, it might occur that one statement supports, and another one contradicts a claim; in such a situation, it is said that no consensus is reached (option 2). One of the quality attributes, Functionality, is difficult to evaluate using the structured methodology proposed, as functionality sometimes is captured in other quality attributes; statements that can be grouped in other quality attributes (for example maintainability) cannot be found directly at Functionality. Functionality claims therefore can be tested using statements that are allocated to other quality attributes as well. For all claims at the other quality attributes holds that these are perfectly traceable using the proposed methodology. 5.1 Evaluation: Data-Driven Process Structures The results from the questionnaire, directly gathered after respondents finished the tutorial, indicated that 75% of the respondent provided a score below the neutral level of three for perceived ease of use. Interestingly, the usefulness perceived for this method was rated with 75% of the scores above neutral level. Both are in line with the study of (Diaz Garcia, 2011), and imply that although the respondents find the method difficult in use, the according benefits of using the method are well perceived. Using the results from the discussion and exercises, the developers claims are tested in order to further investigate these first findings. Furthermore, statements made by the participants that cannot be directly related to the developers claims will be addressed in the end of 39
41 RESULTS this section. An overview of the relations between claims made by developers and the perceptions obtained in the discussion is provided in Appendix L Functionality D1 Data-driven modelling of large process structures; ensuring correct coordination, reducing modelling efforts, and provide mechanisms for maintenance. D2 Separation of data and process logic, leading to an enactable process structure D3 IT Support for automated creation and soundness checks Claim D1 states the functionality in terms of reduced modelling efforts and mechanisms for maintenance; though currently classified in the quality attributes Efficiency and Maintainability, this claim is indeed supported by the respondents. The reduced modelling efforts are realised via the reusability of models and the automated generation of a workflow, while maintainability is realised by separating data and process logic (D2), thereby enabling the adaptation of the model in one place and the automated translation of these adaptations to a process structure. The actual IT Support (tool support) was not evaluated, so that D3 is neither supported nor contradicted Usability D4 Intuitive integration of data and (sub-)processes enables users to instantiate and adapt model without process knowledge (by adapting data structure at a high level of abstraction). D5 Process experts require profound domain knowledge to create data model and LCM. Although participants of the workshop only have worked with the method for a short period of time, the first impression they got on usability can yield interesting results. D5 is supported by the participants of the workshop; in addition to the profound knowledge required to create the models, participants however address that these models in addition are only usable for business analysts, as they would be too complex for managers and other users. Claim D4 is therefore contradicted: though participants do see the benefits when users only have to instantiate a data model, they question the interpretability of the abstract models for users Efficiency D6 Instantiating different Data Structures and generating the respective Data-Driven Process Structures D7 Automated creation of Process Structure D8 Standardising processing of objects in order to increase the reuse of process models and reducing modelling efforts. D9 Separation of data and process logic results in a reduction of modelling efforts. Regarding efficiency, D6 and D9 are supported: due to the separation of data and process logic, a Data Model can be used for creating different Data Structures and their corresponding Data- Driven Process Structures. The automated creation of a Process Structure based on the Data Model and the LCM, which makes the method efficient in both time and other resources, was also identified, thereby supporting D7. Finally, the participants identified the reusability of lifecycles and data models as one of the major contributors to the method s efficiency, which is in support of D8. 40
42 RESULTS Maintainability D10 Changes can be made at data-level and are automatically translated into corresponding adaptations of the process Adjustments to a model or process can be made in a single place, and can be automatically translated to a new process structure; D10, that addresses both the making of changes in one place and the automated translation, is therefore supported Flexibility D11 Usable in other environments, not specifically the engineering domain. Data-Driven Process Structures is identified as a very generic approach, thereby applicable in many different environments. Although often presented in an environment in which a hierarchical structure can be identified, the method is according to the claim not restricted to such an environment; as a result, many new applications can be proposed. The method could for example be used to decompose administrative processes, thereby still reaping the benefits of the method, according to the participants. D11 is supported Additional statements by participants Functionality + Controlling workflow using data Missing details: roles, triggers, process view, origin of data Usability + Hierarchy improves readability + Increased understanding by using existing concepts/methods Unclear overview: large models In addition to the statements that directly addressed one of the claims, some statements could not be allocated to one of them; these are addressed here. The additional statements regarding Functionality relate to the use of data to control the workflow (one of the strengths of a datadriven approach) as a positive aspect, and the lack of details in the used examples as a negative one. Usability is positively supported by the use of hierarchy, enabling reasoning on an abstract level, and the use of known concepts (structure similar to a Bill of Materials); it is negatively affected by the readability of the large, often chaotic Process Structures. 5.2 Evaluation: Product-Based Workflow Design Using the results from the questionnaire (Figure 11 and Figure 12), PBWD is perceived as easy to use, having 75% of the scores above the neutral level of three. The usefulness of the method in contrast is rated with almost 75% of the scores below neutral level. The method was by some of the participants not perceived as an aid, as they perceived that the insights obtainable by defining a PDM, would already be known by users. Though this statement can be (and, during the workshop, was) discussed, it explains the relatively low score. Using the results from the discussion and exercises, the developers claims are tested in order to further investigate these first findings. Appendix M provides an overview of the relation between the developers claims and the perceptions of the participants of the workshops. 41
43 RESULTS Furthermore, statements made by the participants that cannot be directly related to the developers claims will again be addressed in the end of this section Functionality P1 Method that (re)designs a process reasoning from the desired outcome, without directly discussing how to achieve it. P2 Analytical, clean sheet approach: rational and quantitative way of deriving an optimised process design. P3 PDM (in)directly used to steer a workflow: basis for process model. The PDM used in Product-Based Workflow Design is, conform to P1, perceived as a good basis for redesign: it is orderless, points out process dependencies, and provides insights in important aspects of the (re)designed process. In addition, since the method is orderless and uses very explicitly defined rules, an objective (re)design can be created, supporting P2. P3 was not addressed in the discussion Usability P4 Created models are accepted by end users as valid and workable. P5 Based on existing concept (BOM) P6 Efforts required to collect data for PDM differs for every company. P7 Constructing a PDM is a manual task According to some (five) participants, a PDM model is usable for customers: especially in systems that include many rules and calculations, a PDM structure would be perfectly understandable; other participants (four in total) however perceived the PDM as too complex for customers. For P4 therefore no consensus is reached. Similarities to a Bill of Materials are indeed identified by participants, supporting P5. Difficulties in collecting required data, as stated in P6, were not considered by the participants; they merely discussed difficulties in constructing a correct and complete PDM. The participants do indicate that the creation of a PDM is a task of a business analyst, able to derive and use abstract models. This indicates that they do see it as a manual task (P7) Efficiency P8 Using different optimisation criteria, different process models can be created. P9 Algorithms and PBWS can be used to automatically generate process models or recommendations for carrying out operations. P10 Optimisation of the process by including optimisation criteria. Though not mentioned directly, P8 is supported. The participants mentioned that the optimisation of the order can be based on a selected criterion: e.g. cost and time. Claim P9 is not addressed in the discussion. P10 on the contrary is one of the most often mentioned strengths of PBWD; it addresses its possibility to optimise processes. Since the PDM does not include any order, it can be used as objective view on the process, thereby deriving the optimal order of operations: all is in support of P10. 42
44 RESULTS Maintainability Maintainability is neither captured in a claim, nor addressed in the discussion. For PBWD, it is therefore left from the results and discussion Flexibility P11 Restricted to fields where clear concept of the products to be delivered exists. The participants of the workshop perceive the method as very broad applicable. They did not specifically mention the restriction of a process that includes a clear concept of the product as the developers did, though it was mentioned that practical problems are likely to be less straightforward, thereby more difficult to tackle using the proposed method. Combining these two statements, P11 is supported Additional statements by participants Functionality Missing details: input, roles, triggers, different views Usability PDM does not help reasoning Difficulties in use: alternative paths, orderless, rules, tables Unclear overview: direct/alternative paths, large models Participants addressed that the method as proposed in the tutorial lacked some important details, which are very interesting when redesigning a process. Furthermore, the PDM, which already is perceived as difficult by the participants, becomes obscured when alternative routings are included, especially in large models. Finally, using a PDM requires an alternative way of thinking (compared to activity-centric methods), which is also perceived as difficult by some of the experts; if not understood completely, a PDM does not help reasoning about optimising the process. 5.3 Evaluation: Artifact-Centric Process Modelling While for both DDPS and PBWD the results of the questionnaire were unambiguous, the results that relate to ACPM are somewhat more centred and thereby less easy to interpret. For Perceived Ease of Use holds that the obtained value exceeds the one for DDPS. For Perceived Usefulness exactly the neutral level is obtained, which is still above the Perceived Usefulness value obtained by PBWD. Using the results from the discussion, the developers claims are tested in order to further investigate these first findings. In the table in Appendix N the relations between claims of developers and perceptions of participants are provided. As was done for DDPS and PBWD, this section will address statements made by the participants that cannot be directly related to the developers claims at the end of this section. 43
45 RESULTS Functionality A1 Representation usable by business people to analyse, manage, and control business operations A2 Substantial new insights can be acquired by managers A3 Declarative approach, that incorporates formality required for rigorous design and analysis Claim A2 and A3 are discussed first. Claim A2 is supported: participants do think the method is able to provide new insights in the processes. Furthermore, using the structured approach of this method, knowledge, roles, and rules, required for rigorous design and analysis, can be captured. This all is in favour of claim A3, which therefore is supported. A1 is not fully supported: though the participants stated that the combination of artifacts and lifecycles was strong and showed the interaction of different artifacts in a system, this not necessarily means it can be used to analyse, manage, and control business operations Usability A4 Intuitive appeal to business managers, somewhat foreign to business process professionals A5 Based on existing methods and techniques A6 Identifying artifacts is an iterative process that requires understanding of entire business process. Claim A4, that addresses the intuitive appeal of the method, is contradicted by the participants: artifacts were seen as non-intuitive (for both business users and experts), and reasoning using the proposed method was perceived confusing. Although it should be noted that the developers state the method is intuitive for business managers (and the participants were business professionals and students), the participants perceived the method as too complex for business managers as well. The use of existing and known methods was seen as advantage, supporting claim A5. Claim A6 was not addressed; the participants neither had thorough business knowledge (of the process to be modelled in the exercises) nor time to iteratively discuss the selection of artifacts Efficiency A7 Enabling specification of generic schema with multiple specialisations. A8 Separation of data management concerns from process flow concerns The reuse of artifacts and lifecycles was addressed in the discussion. The participants stated that a workflow could reuse already defined artifacts for a new purpose; though less concrete formulated than in the claim, this partly supports A7. The separation of data management concerns from process flow concerns (A8) remained unaddressed in the workshop Maintainability A9 Changes can be made to conceptual flow and business workflow implementation, while preserving the same Business Operations Model. Since the participants were only provided with the task of creating a Business Operations Model, both conceptual flow and business workflow implementation were not addressed in the discussion, leaving claim A9 untested. 44
46 RESULTS Flexibility A10 Usable in other environments, particularly in the use of consumed and non-consumed goods. The method is perceived by the participants as very broad applicable; while the developers of the method further specify this to the consumed and non-consumed goods, the participants did not further elaborate on this statement: A10 is supported Additional statements by participants Functionality + Hierarchy of artifacts possible Missing details: input, output Usability Difficulties in use: determination of artifacts, attributes, flow, and rules Maintainability Adaptation of models in several places In addition to the interaction of artifacts and lifecycles, which are related to claim A1, the possibility to incorporate hierarchy in the method was mentioned as an additional strength of Functionality. A remark made to the formality currently incorporated in the method, was that additional details were required by participants of the workshops. Also with respect to Usability some negative statements were made: the models used in the method are difficult to determine, and of unclear additional value. Maintaining the models is in addition also difficult, as adaptations in artifacts or their lifecycles often result in making changes in multiple places. 45
47 DISCUSSION 6 Discussion The results from Chapter 5 will now be discussed more in depth; an interpretation of these obtained results will be provided, that gives possible explanations for these results. This section is structured as follows. First, in section 6.1, the methods will be discussed separately: for each of the quality attributes selected, the obtained results will be interpreted and explained. After these individual evaluations, a deliberate comparison of the methods will be made in section Discussion Method Evaluations For each of the quality attributes a small interpretation of the obtained results is provided: where in the previous chapter the different claims of the developers were only tested, this section proposes possible explanations for these differences. Both statements that directly addressed developers claims and those that did not, are taken into account in this discussion; statements that did not address claims can lead to the discovery of additional insights Data-Driven Process Structures The focus of Data-Driven Process Structures is to a great extent on the optimisation of modelling: the creation of efficient and easily maintainable models. The method is successful in achieving this goal, which will become clear from discussing the five quality attributes. Functionality The main goal of DDPS is to enable the coordination of large process structures, and at the same time reduce the modelling efforts required. By separating data and process logic, changes to objects and models can be made easily (see also section ). Using a high level view and generically defined objects and models, the reusability of these objects and models is enabled. Overall, an efficient and easily maintainable method is proposed. While the used examples and exercises missed details like roles, triggers, et cetera, these models were on purpose simplified to increase understandability, and in practice should be enriched (Müller, Reichert, & Herbst, 2006, p. 5). The remark that considered these missing details, is therefore at least partially due to limitations of the tutorial, and not directly related to the method. Usability Although the readability of the generated Process Structures might be seen as limitation of the method, this depends to a great extent on the goal of the model; a model that is used to correctly coordinate a workflow process is likely to be different from an overview model used for direct interpretation by business professionals. Furthermore, reasoning is perfectly possible on a more abstract level, using the Data Structure and the Lifecycle Coordination Model (instead of the Process Structure); a Data Structure can be used to determine which entities are related, and the LCM indicates what this relation looks like. 46
48 DISCUSSION Some difficulties were perceived in applying the proposed method and creating the (abstract) models. The participants perceived difficulties in the creation of generic lifecycles, especially when trying to apply the method in a domain other than manufacturing. Since process experts already had difficulties using the method, these difficulties are likely to be perceived as well by business people, which often lack abstract modelling skills. Although it is stressed by the developers that business people only need to define the instantiation of the Data Model, which should be less difficult than creating the models, business users might face difficulties when trying to fit a real process or product into the abstract models. Efficiency The category Efficiency incorporates one of the main strengths of this method: the reduction of modelling efforts. Using rather abstract, generically defined objects and models, the reusability of these objects and models is facilitated; at the same time, the process of choices and checks is standardised, ensuring them to be made at exactly the right time. In addition to the reusability of models, the automated creation of Process Structures further contributes to the efficiency of this method. DDPS makes no efforts regarding the optimisation of processes; all facets of efficiency included in the method aim at reducing modelling efforts. Maintainability With respect to maintainability, the Data-Driven Process Structures method provides some great functionality as well. Described as one of the main ideas behind the method, data and process logic are separated; changes to either product or process can be made in the corresponding place and, in addition, can be directly translated to the Process Structure. As changes can be made to product and process separately, and these are automatically translated to the new Process Structure, DDPS can be seen as highly maintainable. Flexibility The method is broadly applicable. In the examples often a BOM structure is proposed; however, complex hierarchical systems, in which objects can have multiple parents, should be possible as well. Though not claimed as a strict requirement, a hierarchical systems is required to reap the full benefits of the method. When applied in a non-hierarchical environment, the benefits mentioned at Efficiency (section ) will be reduced, as the reusability of OLCs will almost certainly decrease. Nonetheless, adaptations on data and process level are still possible in a non-hierarchical environment, making the maintainability of such processes its major strength. Strengths and weaknesses of Data-Driven Process Structures The major strengths of this approach can be found in its efficient modelling approach and the ease with which the created objects and models can be maintained. The method focuses on the efficiency of the modelling of processes; no attention is paid to the optimisation of the processes themselves. Regarding usability, Process Structures can quickly become unreadable; however, the goal of such a model is probably not the creation of an overview. Instead, a Process Structure should function as input for a workflow system, correctly coordinating a large process. A remark regarding the reusability of models, is the use of a hierarchical system in all available 47
49 DISCUSSION examples; although not stated as a formal restriction, the benefits of the methods are reaped best in a hierarchical environment. Table 15 summaries the strengths and weaknesses of the Data-Driven Process Structures method. Attribute Concept Explanation Usability Understandability Process Structure chaotic, abstract models are difficult to understand - User: ease of use Only instantiate Data Model, reasoning with abstract models difficult ± Expert: ease of use Creating generic lifecycles can be difficult ± Efficiency Reduce modelling efforts Reusability of models, automated generation ++ Optimise process No efforts regarding the optimisation of processes -- Maintainability Making adaptations Separated data and process logic, easily adjusting models ++ Flexibility Usable in other environments Usable in all environments, hierarchical environment preferred ± Table 15 - DDPS: Strengths and Weaknesses Product-Based Workflow Design PBWD proposes an analytical approach for business process redesign. Using an abstract model of an informational product, an optimised process can be created. Disregarding the existing order of tasks, taking only the dependencies between data elements into account, the method is able to provide insights in the optimisation of processes. Functionality Product-Based Workflow Design is proposed and perceived as an analytical, clean sheet approach that only considers the different data elements and the combining of these elements to achieve a value for the end product; it provides a structured overview of the data elements in a system, as well as their relations. The method uses a detailed view on the product to obtain objective insights into the optimisation opportunities of a redesign. If desired, additional details can be included to create models that better represent reality. Usability The main model of Product-Based Workflow Design, the PDM, is a fairly complex model. Especially when these models become larger, or incorporate more alternative routings (see for example Op2 in Figure 6), the overview of the models becomes blurred, making the models difficult to read. Different alternatives (for example use of logic, Lazy Evaluation) were suggested to reduce these alternative paths, and thereby the complexity of a PDM. When a PDM becomes easier to interpret, the usefulness of the method as a whole increases. As mentioned, a PDM might be complex for users to interpretate directly. However, it could be used by process experts as an aid to identify opportunities for improvement. Furthermore, reading a PDM (after some training sessions) should be possible for business professionals, certainly when the process described is already known by these professionals. Constructing a PDM might be fairly difficult, as all alternatives routings should be taken into account. However, a PDM can often be based on product definitions, work descriptions, et cetera. It is interesting to mention that although the participants of the workshop argued that it was difficult to create a PDM, their attempts actually resulted in quite good models. 48
50 DISCUSSION Efficiency Efficiency of modelling is provided only limited attention in this method. PBWD enables the use of different quality criteria to determine process models from a single PDM; the result is a number of models (one for each quality criterion selected) using the same PDM as input. The real value for efficiency is obtained when considering the optimisation of processes. Because the PDM does not include an order of tasks (the only order included is based on dependencies between data elements), it can be used to optimise the process. Dependent on the desired optimisation criterion (cost, time, quality) an optimised process can be determined. The efficiency of PBWD thus focuses on the creation of an efficient process; efficiency of modelling is only considered by the reusability of a PDM to create different processes based using different quality criteria. Maintainability Maintainability is not provided any attention in PBWD. Major changes (e.g. a change in regulations) are likely to have a large effect on the PDM, forcing modellers to create an entire new version of the Product Data Model. Note that a PDM only has to be adjusted when changes to data elements or dependencies occur, as it is unrelated to changes in processes. Flexibility Though not indicated in the discussion, the limitation regarding usage in other environments, mentioned by the developers, is definitely important. The method is only applicable in situations where a clear concept of the products to be delivered exists: without such concepts, no structure that leads to this product can be created. The proposed method could really lead to great insights in processes that do have such a structure, but reaping these benefits without such a structure will be difficult, if not impossible. Strengths and weaknesses of Product-Based Workflow Design One of PBWD s greatest strengths is its analytical, clean sheet approach in the (re)design of a process. Though business people might think they already know how to optimise the process, this method quantifies the different alternatives, providing insights into their costs and time. This objective view can be used in the analytical redesign. The proposed models are created on a detailed level, which is less intuitive for business people. In addition, the created models show many dependencies and alternative paths, which obscure the overview, especially in larger systems. The final weakness considered here is the limitation of flexibility: without a clearly described product, the method has limited value. Attribute Concept Explanation Usability Understandability Alternative paths not understood (alternatives proposed) - User: ease of use PDM readable when following traces ± Expert: ease of use PDM based on descriptions, alternative paths difficult ± Efficiency Reduce modelling efforts Creation of multiple models, using different criteria - Optimise process Optimising process using different criteria ++ Maintainability Making adaptations Major changes result in creation of complete new PDM ± Flexibility Usable in other environments Clear description of product is required - Table 16 - PBWD: Strengths and Weaknesses 49
51 DISCUSSION Artifact-Centric Process Modelling Artifact-Centric Process Modelling proposes a method that can be used by business people to analyse, manage and control business operations. The method makes use of artifacts, that are concrete and self-describing business entities. Using a variety of models and tables, the method can be used to model all kinds of business processes. Functionality Using a declarative approach, which is based on rules and properties, a method is proposed to analyse, manage, and control business operations. Formal described rules and deliveries are used to define what is required from which employee, at what event, et cetera. Though additional details should be included, the examples used were simplified in order to increase the understandability of the models. Artifacts, lifecycles, and relations, together provide an overview of the important entities in a process, which can be used to obtain new insights. Though the ideas are promising, it unfortunately remains unclear how the method is applied best, in order to acquire the most valuable insights. Usability One of the major problems addressed regarding Usability was the unclarity of the added value of the created models; the participants of the study had difficulties identifying these benefits. Two possible explanations for this problem are provided. The first one considers the examples and models used in the tutorial: the focus in the tutorial is on the first, conceptual steps of the redesign process, while the method as a whole should be used to determine its added value. A second explanation for the limited added value perceived considers the broad scope used in ACPM; in contrast to the other two methods discussed, Artifact-Centric Process Modelling tries to cover all aspects of BPM. This broad scope might obscure the overview of models, and in addition the exact goal of specific models. The identification of artifacts is a difficult task that requires profound knowledge of the process as well as an iterative identification process. Not only the creation of models is difficult; according to the participants of the workshops, interpreting the abstract models is difficult as well, especially for business users that lack abstract modelling skills. This is in contrast with the claimed intuitivity of the approach, though the effect might be reduced when the method is applied in a well-known environment (which was not the case in the workshop). Efficiency Concerning the reduction of modelling efforts, artifacts and their lifecycles are formulated in a generic way, which enables the reuse of common artifacts (for example Customer ). In addition, data management concerns are separated from process flow concerns, allowing for adaptations on separate levels. Furthermore, the developers of the method claim that generic schemas can be used to create models for multiple specialisations. No efforts are made in ACPM that regard the optimisation of the process. 50
52 DISCUSSION Maintainability The maintainability of the method is seen as one of its weaknesses. As there are numerous models and tables that are all interconnected, changes made to a model or table automatically have an effect on one or multiple others. When a system has to be adjusted in several places, this requires additional resources and, in addition, makes errors more likely to occur. Although the developers of the method state that changes can be made to the conceptual flow and business workflow without changing the Business Operations Model, making desired changes to the Operations Model is perceived as fairly complex and error-prone. Flexibility The method is very generic, making it applicable in nearly all (if not all) domains. In all domains important artifacts can be identified and related to one another. As the method does not require any specific characteristics, it can be seen as very flexible. Strengths and weaknesses of Artifact-centric Process Modelling One of the major strengths of this method is the formal description of rules and deliveries, making them explicit. Defining these models is however perceived by process experts as nonintuitive, sometimes even complex and confusing. And although artifacts should be self-describing, the numerous abstract models created by experts (overviews of artifacts, their lifecycles, and rules and services) are fairly complex for business users. A major strength of the method is its flexibility; the method is applicable in every environment. Attribute Concept Explanation Usability Understandability Unclear how to analyse, manage, and control - User: ease of use Abstract models difficult to use, numerous models - Expert: ease of use Difficult to determine correct and complete models - Efficiency Reduce modelling efforts Reusing artifacts + Optimise process No efforts regarding the optimisation of processes -- Maintainability Making adaptations Adaptations need to be made in multiple places - Flexibility Usable in other environments Usable in (nearly) all environments ++ Table 17 - ACPM: Strengths and Weaknesses 6.2 Comparison of Methods With an overview of all results in Chapter 5 and the discussion of these separate results in the first section of this chapter, a comparison between the three selected methods will be provided here. Using different concepts of the quality attributes, the methods can be compared, identifying relative strengths and weaknesses Functionality The three selected data-driven methods focus on different aspects. Data-Driven Process Structures proposes a method that enables the correct coordination of large process structures, while at the same time it reduces modelling efforts and increases maintainability; the focus is thus on optimising the modelling of (large) processes structures. Product-Based Workflow Design in contrast tries to optimise the process itself, by taking an analytical, clean sheet approach 51
53 DISCUSSION that optimises the ordering of operations given a selected optimisation criteria; the focus in this approach is on the creation of an optimised redesign. The Artifact-Centric approach proposes a representation that can be used by business professionals to analyse, manage, and control business operations, incorporating the formality for rigorous design and analysis. The three methodologies operate on different levels of abstraction. The model that uses the highest level of abstraction is DDPS: using generic structures to create an overview and coordination model for a large process. ACPM incorporates more details; concrete artifacts and their attributes are defined, and rules and services are formulated that make use of these artifacts and their attributes. Finally, PBWD uses a detailed approach, directly modelling elements of data that are of interest for the end product. As can be seen, the goals of the three methods, as well as the chosen approach to reach these goals, differ to quite some extent. In the following sections, the other quality attributes will be discussed, in order to identify exact advantages and disadvantages of the different methods towards each other Usability Usability is discussed using a number of concepts. The first concept considered is the understandability of the model, which addresses whether or not the general idea of the method is grasped, models are understood, et cetera. Second, the ease of use from a user perspective is discussed. This includes the tasks that should be performed by the users, and the reasoning based on the created models, for example. The final topic is similar to the second, though from an expert perspective. Understandability An important notion made during all workshop sessions was the complexity of data-centric methods, for both business users and process experts. Though process experts were able to grasp the general idea of a method or model, they doubted whether users were able to read the corresponding models and understand their added value. Especially in large systems, the models of all methods quickly grow in size, decreasing their readability. However, for DDPS holds that reasoning is possible on an abstract level, omitting the complexity of the Process Structures. With respect to PBWD, the Product Data Model can often be tracked from leafs to root element; reading it in a stepwise manner. ACPM does not include similar aspects that increase understandability. Furthermore, the added value of some of the created models is not always clear to users. The broad applicability of the method combined with the large number of models and tables, blurs the underlying idea of the individual models. Expert: ease of use For DDPS, the greatest difficulty perceived is the creation of the generic lifecycles, as these lifecycles should fit all objects that are allocated to the object type that is modelled. On a high level, these the processes in a single object type should be identical (e.g. test, assembly, et cetera). The creation of a PDM based on a work instruction or description of a situation was perfectly possible for experts. An unexpected difficulty perceived was the determination and 52
54 DISCUSSION use of alternative paths, though alternatives were proposed to avoid this type of routings. For ACPM, determining the required artifacts and their lifecycles is perceived as a difficulty, as is the creation of rules. As can be seen, each of the selected methods show difficulties for experts. Further investigating these problems shows that for DDPS and ACPM these difficulties are an important step of the modelling process (determining generic models, determine artifacts and attributes), while the problems encountered for PBWD might be overcome when the concept of alternative routings is adjusted or removed. Furthermore, for all methods holds that the ease of use is likely to be increased by the use of formal training sessions; difficulties perceived after such training sessions are likely to be even more valuable for the improving of methods. User: ease of use The only method in which the role of the user in the creation of models is explicitly defined, is DDPS. Though the participants in the workshop had doubts whether or not a user is able to fit a product in an already defined abstract model, a user might be able to do so after a training or when done together with a process expert. Although the creation of models is often done by process experts, the methods should be usable by business professionals. For DDPS holds that some of the models are fairly complex, though reasoning can also be done on lower levels. The Artifact-Centric approach states that their models are intuitively usable for business managers; although artifacts might be selfexplaining, the models that include multiple related artifacts are less easily interpreted. PBWD might be difficult to understand directly for users; readability is likely to be increased when it is considered in smaller parts. While each of the methods shows difficulties in use of the business users, it is likely that profound process knowledge reduces the encountered problems. When users of DDPS for example learn to reason in abstract models, they can use the Data Structure and LCM in reasoning. A similar statement holds for ACPM; when the models are familiar to business users, reasoning becomes possible. The method in which users encounter the most difficulties is PBWD, as PDMs quickly become large, complex models. A recently proposed initiative automatically aggregates related data elements of a (detailed, complex) PDM, resulting in a model that is easier interpretable for business users, without the loss of information (Van der Aa, 2013) Efficiency Efficiency is addressed in claims and statements using a variety of concepts. However, the used concepts can be grouped in two underlying ideas. Creating different processes from the same models, automated creation, reusability, and reducing modelling efforts all address the reduction of modelling efforts. The only concept that cannot be allocated to the reduction of modelling efforts, considers the optimisation of the process. The reduction of modelling efforts and the optimisation of processes will both be addressed here. 53
55 DISCUSSION Reduce modelling efforts The method that puts most emphasis on the efficiency of modelling, is Data-Driven Process Structures. The method enables the reusability of models, efficient adaptation of both data and processes, and automated creation of Process Structures, thereby providing functionality for increasing the efficiency of modelling. Although to a lesser extent, the ACPM method incorporates some similar initiatives. The created artifacts and lifecycles can be used in other process descriptions as well, assuming the artifacts have the same lifecycle in the new model. Note that this reusability is limited when compared to the reusability of DDPS, as DDPS is able to reuse the generic models for each object of a single object type in a process, while ACPM is proposed the reuse of objects in other processes. PBWD only facilitates the reusability of a PDM, in order to create a different process based on other quality criteria. This is hardly a real reduction of modelling efforts, making PBWD the method that performs worst for the reduction of modelling efforts. Optimise process Although its efforts to reduce modelling efforts are limited, PBWD instead provides opportunities to optimise the described process in an objective manner. Using optimisation criteria that can be defined by the users themselves, an optimal process order can be determined. Since users themselves can decide which criteria to include in the PDM, the optimisation of the process can be done using any desired criterion (or combinations of different criteria). Neither DDPS nor ACPM includes similar initiatives. Their only focus regarding efficiency is based on the reduction of modelling efforts Maintainability Regarding maintainability, DDPS exceeds the others. Data-Driven Process Structures allows for adaptations on either the data or process level; changes then are automatically translated into a new Process Structure, which incorporates the new structure or adapted processes. The other two methods do not have such functionality. Although for ACPM it is claimed that adaptations can be made to the data or process level, these adaptations often require changes at multiple places, since all models and tables are connected to one another. For PBWD, major changes require the construction of a new PDM, since it is difficult to identify the effects of large changes in the (interconnected) data elements. However, changes in process do not apply to a PDM, as it is process independent Flexibility All proposed methods are applicable in other environments than for which they were originally developed. However, some constraints should be taken into account. For DDPS holds that it is a very generic approach, applicable in many situations; the benefits of the approach are however obtained best when used in a hierarchical environment. In such an environment, the reusability of models is utilised best. 54
56 DISCUSSION PBWD deals with constraints as well. While the method can be used in different domains, it is important that a clear description of the end product is available. Without such an end product, PBWD is not applicable. Artifact-Centric Process Modelling can be applied in almost all, if not all, environments. The most important entities used in the models, artifacts, can be identified in all processes, as there are no constraints with respect to the exact contents of an artifact Schematic overview Using the quality attributes and the corresponding underlying concepts of these attributes, here a brief overview of the findings is presented. Note that this table should only be used in combination with the above provided discussion. In addition, no total score is addressed to the methods, as weights for the addressed concepts might differ for each situation. METHOD Category Concept DDPS PBWD ACPM Usability Understandability User: ease of use ± ± - Expert: ease of use ± ± - Efficiency Reduce modelling efforts Optimise process Maintainability Making adaptations to the model ++ ± - Flexibility Usable in other environments ± - ++ Table 18 - Schematic Overview of Comparison of Methods As can be seen, functionality is not taken into account in the above description. The methods all have different functionality, which cannot be expressed using the scoring method from Table 18. Which method best suits a business needs is dependent on the desired functionality (discussed in sections , , and for DDPS, PBWD, and ACPM respectively). The methods differ for example in level of abstraction, making the selection of a method highly dependent on the desired outcome of the use of the method. It is therefore of great importance to consider not only the quality attributes and concepts defined in Table 18, but to carefully consider the functionality of the different methods as well. 55
57 CONCLUSION 7 Conclusion In this study three data-centric process modelling methods are studied, in order to create a better understanding of both the claimed and perceived added value of these methods. The three methods that are selected are Data-Driven Process Structures, Product-Based Workflow Design and Artifact-Centric Process Modelling. Using the three research questions described in section 1.1, the findings of this study will be summarised. First research question The first question addresses the theoretical differences between the selected methods. After selecting five quality attributes (Functionality, Usability, Efficiency, Maintainability, and Flexibility), key articles for each of the methods are identified. Using Grounded Theory Coding, these articles are coded, and claims of the developers are determined. The result of this Theoretical Evaluation is an overview of the claimed aspects and attributes of all three methods, which is provided in Table 7. This table can be used as a basis for the comparison of the different methods. Second research question Rather than focusing on the theoretical similarities and differences between the methods alone, an Empirical Evaluation is conducted that identifies experts perceptions towards the method. Three workshop sessions are conducted (one for each method), in which participating experts study the method, make exercises, and discuss their experiences. Again, Grounded Theory Coding is used; this time to extract the participants perceptions towards the methods. From the Empirical Evaluation it becomes clear that data-centric modelling methods are perceived as fairly difficult. Although the participants were able to apply the methods to simple examples, various difficulties were encountered. The creation of models was often perceived as complex or ambiguous, and the often abstract models were perceived as difficult to interpret for business users. Third research question In order to obtain the main strengths and weaknesses of this approach, the results from the Theoretical Evaluation are combined with the results of the Empirical Evaluation. In this way, claimed and perceived aspects and attributes of the methods are combined and compared, thereby identifying the strengths and weaknesses of the approaches. In the Discussion (Chapter 6), further explanations for the obtained results are provided, and the methods are compared to each other. The five selected quality attributes are used to identify the methods strengths and weaknesses; not only can these strengths and weaknesses be used for selecting one of these data-centric methods, they can also be used for the improvement of the methods. One could for example investigate the opportunity to increase the reusability of models for the Artifact- Centric approach, by incorporating some of the aspects of DDPS. Another opportunity can be found in the flexibility of DDPS: while DDPS currently is applied in a manufacturing domain, it might be interesting to apply this method in a service domain. 56
58 CONCLUSION This study combines insights obtained from theory, with insights obtained in an empirical setting. The results of this study therefore do not only focus on theoretical similarities and differences, but take user perceptions into account as well. In the empirical study, some interesting weaknesses were identified; these weaknesses did not only relate to individual methods, but often addressed data-centric methods in general. As data-centric methods are not widely known yet, they may encounter opposition. This study however tries to show that although adjustments might be required for all of the methods, the initiatives are interesting, often provide added value to the current activity-centric approaches, and are worth further investigation. 7.1 Limitations and Future Research Some limitations to this study need to be mentioned. While some of these limitations posit opportunities for further research, others are merely mentioned in order to contribute to a complete and transparent study. The limitations are divided into limitations with respect to the materials used, and limitations that consider the evaluation method Materials Although the materials used in this study are created with great care, they are still created by a non-expert. Despite the fact that the contents of the tutorials are revised by the developers of the corresponding method, and the understandability is reviewed by two Master Students, it is still possible that the tutorials are incomplete, or somewhat unclear at given points. It might therefore be that problems perceived by the participants are caused by an error or ambiguity in the tutorial, hence not caused by limitations of the method. Furthermore, the questionnaire could have been better matched with the contents of the workshop and its desired results. Though Perceived Ease of Use and Perceived Usefulness do contribute to the evaluation, questions that more specifically addressed the selected quality attributes might have provide some interesting contributions Evaluation As the information obtained in the questionnaire and discussion all is based on the participants perceptions, all information in the study can be seen as perceived information. In order to acquire some information on for example actual efficiency, one should make use of some quantitative metrics. The time required for creating a model for example, is a perfect illustration of such a quantitative metric. Furthermore, the fairest comparison between methods would have been a comparison based on the same case. This in addition enables measuring the time required to complete the model, and can be used to evaluate the usefulness of the obtained models as well. Though in this study the use of different examples in the tutorials was well considered (optimally reaping a methods benefits), using a single case probably provides interesting insights as well. 57
59 CONCLUSION 7.2 Future Research Future studies can try to focus on a better triangulation: integrating questionnaires, exercises, and discussion even further. When these sources are better aligned, the results actively support each other. In addition, it would be interesting to evaluate the methods using a variety of cases; cases that apply the method in environments for which it is not originally developed. Furthermore, quantitative metrics could be included, in order to obtain quantitative information as well. Other future studies could aim at a deeper understanding of one quality attribute. While this study used a variety of quality attributes, a more in depth study would be interesting as well. One could for example select only aspects that relate to Usability, in order to obtain detailed insights on for example the understandability of models and the ease of use of the method. Another interesting direction is to test data-centric methods in real life situations. The methods in this study often use hypothetical examples, or variations on the same example. Using the methods in a practical situation might provide some interesting insights as well, as problems and difficulties are more likely to occur in real (often complex) situations. 58
60 REFERENCES 8 References Bhattacharya, K., Caswell, N., Kumaran, S., Nigam, A., & Wu, F. (2007). Artifact-Centered Operational Modeling: Lessons from Customer Engagements. IBM Systems Journal, 46(4), Bhattacharya, K., Gerede, C., Hull, R., Liu, R., & Su, J. (2007). Towards Formal Analysis of Artifact-Centric Business Process Models. LNCS, CEP. (2012). Tools, Cheetah Experimental Platform. Retrieved from Business Process Management Research Cluster: Diaz Garcia, H. (2011). Evaluation of Data-Centric Process Modeling Approaches. TU/e Master Thesis, BIS. Field, A. (2005). Discovering Statistics Using SPSS. London: Sage. Flick, U. (2009). An Introduction to Qualitative Research. London: SAGE Publications Ltd. Glaser, B., & Strauss, A. (1967). The Discovery of Grounded Theory: Strategies for Qualitative Research. Chicago: Aldine Publishing Company. Hammer, M. (2010). Handbook on Business Process Management 1. Berlin Heidelberg: Springer-Verlag. Hull, R. (2008). Artifact-Centric Business Process Models: Brief Survey of Research Results and Challenges. Lecture Notes in Computer Science, 5332, IEEE. (1990). IEEE Std New York: The Institute of Electrical and Electronics Engineers. Kamphuis, J., Vanderfeesten, I., Reijers, H., & Van Hattem, M. (2008). From Product Data Model to Process Model. Beta Working Paper. Kueng, P., & Kawalek, P. (1997). Goal-based Business Process Models: Creation and Evaluation. Business Process Management Journal, 3, Maes, A., & Poels, G. (2007). Evaluating Quality of Conceptual Modeling Scripts based on User Perceptions. Data and Knowledge Engineering, 63, Moody, D. (2003). The Method Evaluation Model: a Theoretical Model for Validating Information Systems Design Methods. 11th European Conference on Information Systems. Moody, D. (2005). Theoretical and Practical Issues in Evaluating the Quality of Conceptual Models: Current State and Future Directions. Data Knowledge and Engineering, 55, Müller, D., Herbst, J., Hammori, M., & Reichert, M. (2006). IT Support for the Release Management Process in the Automotive Industry. Lecture Notes in Computer Science, 4102, Müller, D., Reichert, M., & Herbst, J. (2006). Flexibility of Data-Driven Process Structures. Lecture Notes in Computer Science, 4103, Müller, D., Reichert, M., & Herbst, J. (2007). Data-Driven Modeling and Coordination of Large Process Structures. Lecture Notes in Computer Science, 4803, Müller, D., Reichert, M., & Herbst, J. (2008). A New Paradigm for the Enactment and Dynamic Adaptation of Data-Driven Process Structures. Lecture Notes in Computer Science, 5074,
61 REFERENCES Nigam, A., & Caswell, N. (2003). Business Artifacts: An Approach to Operational Specification. IBM Systems Journal, 42(3), Pinggera, J., Zugal, S., & Weber, B. (2010). Investigating the Process of Process Modeling with Cheetah Experimental Platform. 22nd International Conference on Advanced Information Systems Engineering (pp ). Hammamet, Tunisia: CEUR Workshop Proceedings. Qu, S., & Dumay, J. (2011). The Qualitative Research Interview. Qualitative Research in Accounting & Management, 8(3), Redding, G., Dumas, M., Ter Hofstede, A., & Iordachescu, A. (2008). Transforming Object Oriented Models to Process-oriented Models. BPD'07, (pp ). Brisbane, Australia. Reijers, H., Limam, S., & Van der Aalst, W. (2003). Product-Based Workflow Design. Journal of Management Information Systems, 20(1), Strauss, A., & Corbin, J. (1998). Basics of Qualitative Research. London: SAGE Publications Ltd. Van der Aa, J. (2013). Automated Activity Composition in Product-Based Workflow Design. Master Thesis (work-in-progress), Eindhoven University of Technology, Eindhoven. Van der Aalst, W., Ter Hofstede, A., & Weske, M. (2003). Business Process Management: a Survey. Lecture Notes in Computer Science, 2678, Vanderfeesten, I., Reijers, H., & Van der Aalst, W. (2008). Product-Based Workflow Support: Dynamic Workflow Execution. Lecture Notes in Computer Science, 5074, Vanderfeesten, I., Reijers, H., & Van der Aalst, W. (2011). Product-Based Workflow Support. Information Systems, 36(2), Vanderfeesten, I., Reijers, H., Van der Aalst, W., & Vogelaar, J. (2010). Automatic Support for Product-Based Workflow Design: Generation of Process Models from a Product Data Model. Lecture Notes in Computer Science, 6428, Venkatesh, V., Morris, M., Davis, G., & Davis, F. (2003). User Acceptance of Information Technology: Toward a Unified View. MIS Quarterly, 27(3), Wolcott, H. (1990). On Seeking and Rejecting: Validity in Qualitative Research. In W. Eisner, & A. Peshkin, Qualitative Inquiry in Education: The Continuing Debate (pp ). New York: Teachers College Press. 60
62 APPENDICES Appendices Appendix A. Tutorial: Data-Driven Process Structures 61
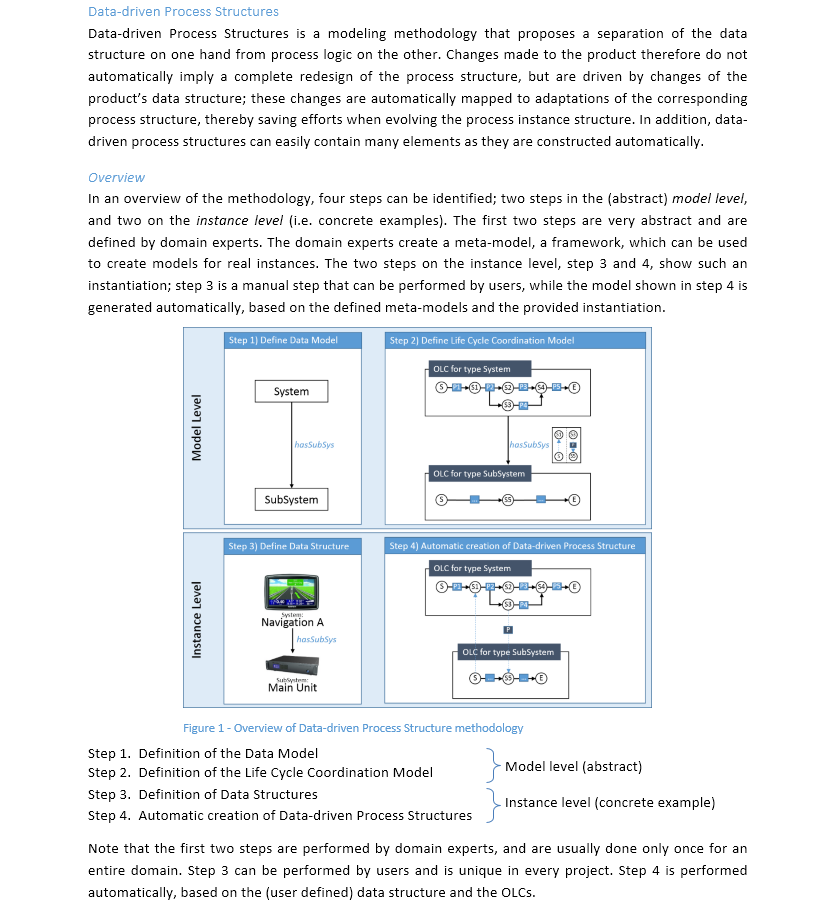
63 62 APPENDICES
64 63 APPENDICES
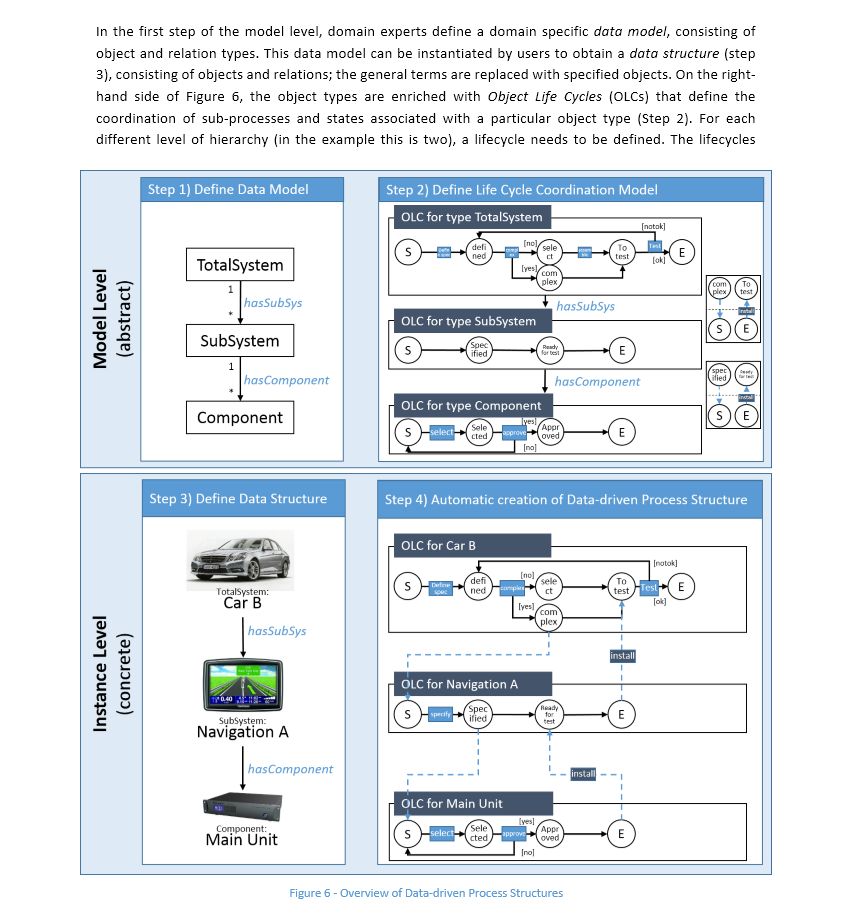
65 64 APPENDICES
66 65 APPENDICES
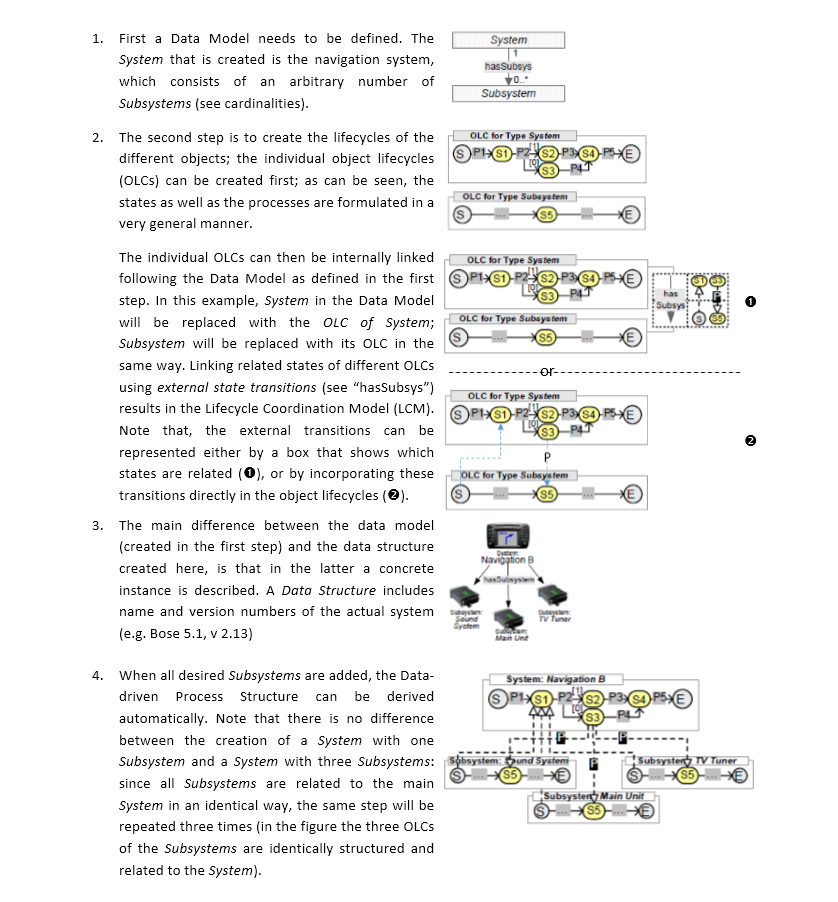
67 66 APPENDICES
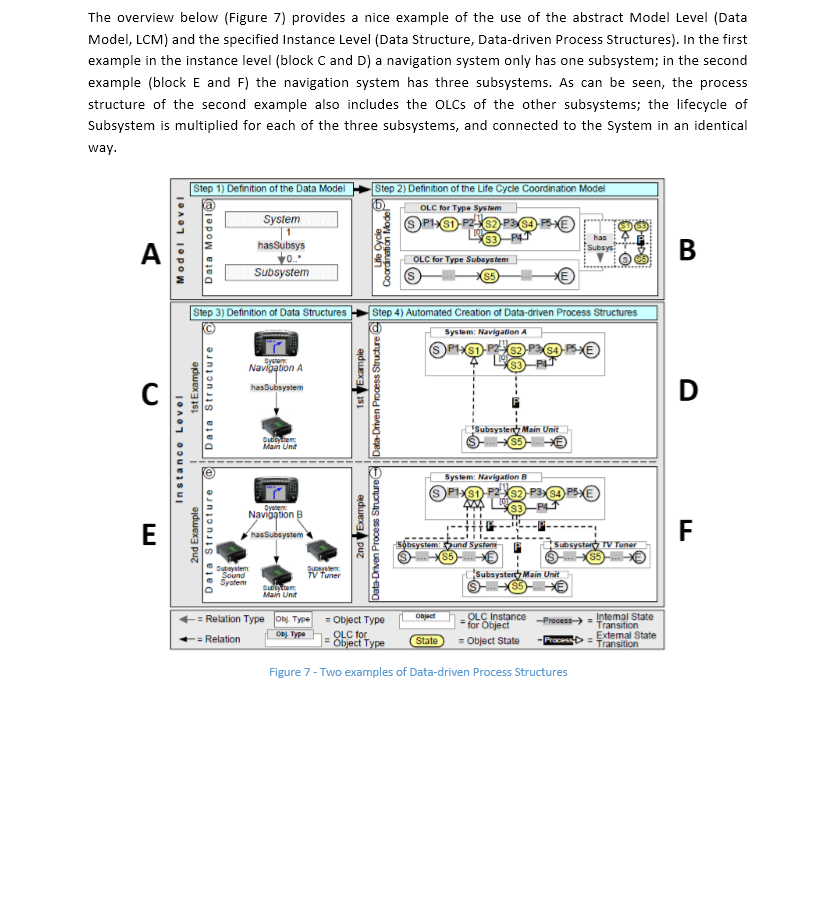
68 67 APPENDICES
69 68 APPENDICES
70 69 APPENDICES
71 70 APPENDICES
72 71 APPENDICES
73 APPENDICES Appendix B. Tutorial: Product-Based Workflow Design 72
74 73 APPENDICES
75 74 APPENDICES
76 75 APPENDICES
77 76 APPENDICES
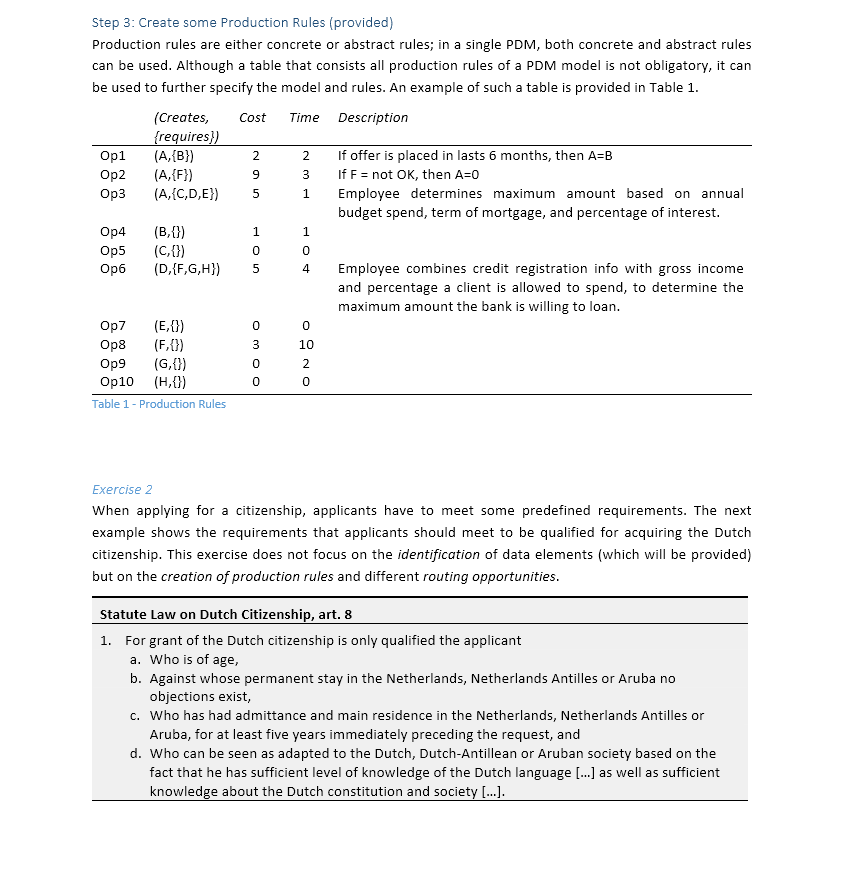
78 77 APPENDICES
79 78 APPENDICES
80 79 APPENDICES
81 APPENDICES Appendix C. Tutorial: Artifact-Centric Process Models 80
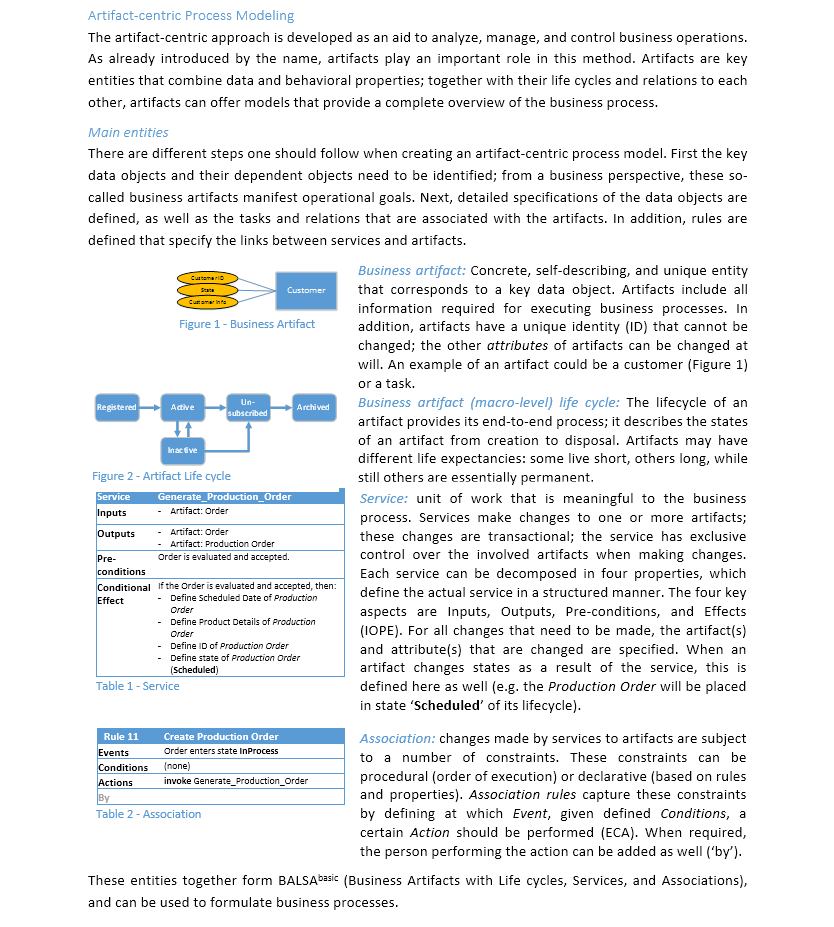
82 81 APPENDICES
83 82 APPENDICES
84 83 APPENDICES

85 84 APPENDICES
86 85 APPENDICES
87 86 APPENDICES
88 87 APPENDICES
89 88 APPENDICES
90 89 APPENDICES
91 Category Concept Code Claim Year Pg. Quote Efficiency Automated creation Automated Creation D automated creation of process structures based on data structures Efficiency Automated creation Automated Creation D Concept must enable automated creation of data-driven process structure Efficiency Automated creation Automated Creation D LCS can be automatically generated based on inputs Efficiency Automated creation Automated Creation D automated creation of process structures based on data structures Efficiency Automated creation Automated Creation D when changing product data structure at buildtime, related process structure can automatically be recreated Efficiency Automated creation Automated Creation D Based on object types and relationships, process structures can be specified at model level and automatically instantiated Efficiency Automated creation Automated Creation D corepro allows to instantiate different data structures and automatically create related process structures Efficiency Automated creation Automated Creation D data structure changes should be automatically transformed into corresponding process structures Efficiency Multiple instantiations of models Instantiate different Data Structures D instantiation of different data structures Efficiency Multiple instantiations of models Instantiate different Data Structures D for models with same behavior, one OLC is modelled (which can instantiated multiple times) Efficiency Multiple instantiations of models Instantiate different Data Structures D Different process structures can be automatically created by instantiating respective data structures Efficiency Reduce modeling efforts Reduce modeling efforts D Method reduces modeling efforts significantly Efficiency Reduce modeling efforts Reduce modeling efforts D Reduce modeling efforts for DDPS Efficiency Reduce modeling efforts Reduce modeling efforts D In order to reduce efforts, model and instance level are separated Efficiency Reduce modeling efforts Reduce modeling efforts D approach reduces modeling efforts for large process structures Efficiency Reusability Reduce modeling efforts: Reusability D increasing reusability Efficiency Reusability Reduce modeling efforts: Reusability D procedures for modifying different objects might slightly differ (eg different testing procedures for Sound System and TV Tuner) Flexibility Other environments Use in other environment D presented concept is not specific to the engineering domain Functionality Goal of method Data-driven specification D Data-driven modeling of large process structures, reducing modeling efforts and provide mechanisms for maintenance Functionality Goal of method Data-driven specification D data-driven specification of process structures at model level Functionality Goal of method Data-driven specification D Corepro supports the definition of the product data structure Functionality Goal of method Data-driven specification D Process structure describes dynamic aspects of given data structure Functionality Goal of method Data-driven specification D approach ensures correct coordination of processes Functionality Goal of method Modeling, enactment, adaptation D COREPRO provides techniques for modeling, enactment, (dynamic) adaptation of process strucutres based on data structures Functionality Goal of method Modeling, enactment, adaptation D corepro addresses full lifecycle of data driven process structures including modeling, enactment, (dynamic) adaptation Functionality How to achieve goal Separate data and process logic D Corepro enables definition of dynamic aspects of object and relations at model level Functionality How to achieve goal Separate data and process logic D model driven design in combination with instantiation mechanism For DDPS Functionality How to achieve goal Separate data and process logic D When changing, benefit from strong linkage between process structure and product data structure Functionality How to achieve goal Separate data and process logic D corepro follows model-driven (respectively data-driven) approach by differing between model and instance level Functionality IT Support Soundness checks D Corepro enables checking soundness on model level Functionality IT Support Soundness checks D corepro guanrantees soundness for every data-driven process structure based on sound LCM Functionality IT Support Soundness checks D COREPRO allows for checking soundness on model level Functionality IT Support Soundness checks D for static changes: soundness can be ensured if underlying LCM is sound Functionality IT Support Soundness checks D Corepro disallows dynamic changes of process structures which would lead to an inconsitent runtime situation Maintainability Changing models Data-driven adaptation D Provides mechanisms for maintaining DDPS Maintainability Changing models Data-driven adaptation D increasing maintainability Maintainability Changing models Data-driven adaptation D data-driven adaptation of process structures to deal with real world changes Maintainability Changing models Data-driven adaptation D COREPRO allows to insert objects and object relations into a given data structure as well as to remove them Maintainability Changing models Data-driven adaptation D COREPRO provides basic operations for inserting and deleting OLC instances as well as OLC dependencies Maintainability Changing models Data-driven adaptation: automatically translated D changes can be specified at data level and are automatically translated into corresponding adaptations, reducing efforts Maintainability Changing models Data-driven adaptation: automatically translated D data structure changes can automatically be translated into adaptations of the corresponding process structure Maintainability Changing models Data-driven adaptation: automatically translated D users adapt data structure, and these changes are automatically translated into corresponding adaptations of process structure Maintainability Changing models Data-driven adaptation: automatically translated D data driven process structures have to be dynamically adapted when related data structure is changed Maintainability Changing models - runtime Changing (dynamically) D new techniques for (dynamically) adapting data driven process structures Maintainability Changing models - runtime Changing (dynamically) D COREPRO provides new paradigm for changing data-driven process structures at runtime, reducing costs of change Usability Expert: ease of use Profound domain knowledge required D subprocess dependencies have to be defined Usability Expert: ease of use Profound domain knowledge required D definition of data model requires profound domain knowledge Usability Expert: ease of use Profound domain knowledge required D Process experts describe dynamic aspects of each object type Usability Expert: ease of use Profound domain knowledge required D Data model, Data structure, LCM are generated manually Usability User: ease of use Changes at high level of abstraction D changes can be introduced at high level of abstraction, reducing cost and complexity Usability User: ease of use Changes at high level of abstraction D Users must be able to perform changes at a high level of abstraction Usability User: ease of use Changes at high level of abstraction D approach enables adaptations of process structures at both build- and runtime at a high level of abstraction Usability User: ease of use Users can instantiate D intuitive and product-related integration of data and (sub-)processes Usability User: ease of use Users can instantiate D instantiation can be done by users Usability User: ease of use Users can instantiate D integrating data and process, allowing user without process knowledge to adapt process structure by adapting data structure Usability User: ease of use Users can instantiate D enable users to adapt complex process structures Used articles 2007: Müller, D., Reichert, M., & Herbst, J. (2007). Data-Driven Modeling and Coordination of Large Process Structures. Lecture Notes in Computer Science, 4803, : Müller, D., Reichert, M., & Herbst, J. (2008). A New Paradigm for the Enactment and Dynamic Adaptation of Data-Driven Process Structures. Lecture Notes in Computer Science, 5074, APPENDICES Appendix D. DDPS: Claims from Developers 90
92 APPENDICES Appendix E. PBWD: Claims from Developers Category Concept Code Claim Year Pg. Quote Efficiency Automated creation Automated creation of PM P in some cases the PDM can be converted into procedural model Efficiency Automated creation PDM itself as vehicle to steer WF execution P instead of deriving a WF design that in general is the best way to generate info-product, PDM itself is used to steer WF execution Efficiency Multiple instantiations of models Optimizing: create different models P Based on a cost optimal plan and PDM, all execution sequences of prod. rules can be derived that have positive prob. to deliver value for top element Efficiency Optimizing process Optimizing: order P Proposed method uses product specification to derive minimal number of required tasks to produce product Efficiency Optimizing process Optimizing: order P principles of optimally ordering tasks can be integrated Efficiency Optimizing process Optimizing: quality P quality is defined as the probability that an acceptable value of the top element can be determined Efficiency Optimizing process Optimizing: quality, cost, time P consider three important design criteria: quality, cost, time Flexibility Other environments Use in other environments P applicability of PBWD relies heavily on the ability to collect the type of data that is part of the PDM Flexibility Other environments Use in other environments P PBWD is restricted to fields where a clear concept of the products to be delivered exists. Flexibility Other environments Use in other environments P Deloitte applied the method four times in client engagements (minimum of 50% cost and 30% flow time reduction) Flexibility Other environments Use in other environments P focus on design of processes that deliver informational products Flexibility Other environments Use in other environments P adopted by various consultancy and service companies to improve the performance of various business processes in service domain Flexibility Other environments Use in other environments P product of a workflow process is an informational product, e.g. A decision Flexibility Other environments Use in other environments P information needed to construct PDM can be obtained from rules, work instructions, forms, descriptions, information systems, etc Functionality Goal of method Analytical redesign P method to design or redesign administrative business processes Functionality Goal of method Analytical redesign P Rigorous approach for business process improvement Functionality Goal of method Analytical redesign P Based on (client) input, process constructs the end product step-by-step Functionality Goal of method Analytical redesign P PDM is used as basis for designing process that respects dependencies between various data elements Functionality Goal of method Analytical redesign P PDM is used as basis for designing process that provides an attractive walk through along various required operations Functionality Goal of method Analytical redesign P initiatives exist that allow end users to flexibly decide on best possible way to create an informational product within limits of regulations and logical dependencies Functionality How to achieve goal Analytical, clean sheet P the product specification and three design criteria as starting point to derive favorable new design of WF process Functionality How to achieve goal Analytical, clean sheet P Proposed method is analytical and clean sheet, in order to counter problems of prevailing practice Functionality How to achieve goal Analytical, clean sheet P stimulate more rational and quantitative ways of process design Functionality How to achieve goal Analytical, clean sheet P carefully fix boundaries of the workflow to be redesigned Functionality How to achieve goal Analytical, clean sheet P No fair comparison with results of a participative redesign Functionality How to achieve goal Analytical, clean sheet P formal model, notion of conformance, possible quantification of design criteria Functionality How to achieve goal Analytical, clean sheet P method for process design that is repeatable, objective, and effective Functionality How to achieve goal Analytical, clean sheet P develop deep understanding of characteristics of informational product that is to be delivered Functionality How to achieve goal Analytical, clean sheet P attention to what is desired outcome, without directly discussing how to achieve it Functionality How to achieve goal Analytical, clean sheet P availability of various alternatives to achieve a particular outcome is exploited Functionality How to achieve goal Analytical, clean sheet P separation of concerns: PDM is based on functional requirements, while selected strategy focuses on performance Functionality IT Support Basis for process model P Product data model itself is proposed as the vehicle to steer a WF execution Functionality IT Support Basis for process model P do not aim at design of generic process, but provide a business user with direct support for delivering individual informational products Functionality IT Support Basis for process model P PBWS: business user determes on case-by-case basis the best possible way to create an informational product in accordance with PDM Functionality IT Support Basis for process model P IT tools have been developed to support administration of PDM, as well as algorithms that automatically generate WF designs based on PDM Usability Expert: ease of use Efforts for collecting data differ P Needed effort to collect this type of data differs from company to company; dependent on available data sources Usability Expert: ease of use Manually constructed models P Manually translating PBWD into PM is time consuming and error prone Usability Expert: ease of use Manually constructed models P construction of a PDM is a manual task Usability Understandability Based on existing concept P Inspired on manufacturing principles (BOM) Usability Understandability Based on existing concept P PDM is described by tree-like structure similar to a Bill of Material Usability User: ease of use Accepted by users P accepted by end users as valid and workable Usability User: ease of use Accepted by users P PBWS: an end user is supported on a case-by-case basis with recommendations on the most suitable way to carry out available operations in PDM 91 Used articles 2003: Reijers, H., Limam, S., & Van der Aalst, W. (2003). Product-Based Workflow Design. Journal of Management Information Systems, 20(1), : Vanderfeesten, I., Reijers, H., & Van der Aalst, W. (2011). Product-Based Workflow Support. Information Systems, 36(2),
93 APPENDICES Appendix F. ACPM: Claims from Developers Category Concept Code Claim Year Pg. Quote Efficiency Multiple instantiations of models Generic schemas for multiple customizations A the abstraction of artifacts and services facilitate customization of services flows Efficiency Reduce modeling efforts Separate Data and Process logic A Separation of data management concern from process flow concerns Flexibility Other environments Use in other environments A used in internal processes as well as for use with customers Flexibility Other environments Use in other environments A particularly in the use of consumed and nonconsumed goods Flexibility Other environments Use in other environments A artifact centric approach has been applied in various internal and external IBM client engagements Functionality Goal of method Analyze, manage, control business A representation that business people could use to analyze, manage, and control day to day business operations Functionality Goal of method Analyze, manage, control business A create a discription of a business that will be used by business people to manage the business Functionality Goal of method Analyze, manage, control business A real value comes from ownership, design, analysis of models by business owners Functionality Goal of method Analyze, manage, control business A value of arifact centric thinking lies in creation of a manageble, analyzable, flexible model, from perspective of a business person Functionality Goal of method Analyze, manage, control business A useful for designing the detailed operation of business processes for enterprises Functionality Goal of method Analyze, manage, control business A Business artifacts are information entities that capture process goals and allow for evaluating how thoroughly these goals are achieved Functionality Goal of method Analyze, manage, control business A artifact is an information record that allows for measuring whether or not the business is on track to achieve their business goals Functionality Goal of method Analyze, manage, control business A ACPM has been used for both business analysis and business driven development engagements Functionality Goal of method Analyze, manage, control business A enable managers to understand, design, and adapt their business operations Functionality Goal of method Analyze, manage, control business A Remain confident that managers' goals are accurately reflected in IT level WF Functionality Goal of method New insights A Operational models also provide a concrete underpinning to which strateg, organization, and application, issues can be connected Functionality Goal of method New insights A business artifacts are an abstraction to focus businesses on not just any information, but on the core entities Functionality Goal of method New insights A ACPM can be valuable for business transformations, as it makes key data in processes visible Functionality Goal of method New insights A using the framework, properties of process models are studied that concern both information perspective and control flows Functionality How to achieve goal Declarative approach (based on rules + properties) A at logical level this workflow model is largely declarative Functionality How to achieve goal Declarative approach (based on rules + properties) A services and associations are described in a declarative manner Functionality How to achieve goal Declarative approach (based on rules + properties) A business rules are specified in declarative languages, and easy to modify Functionality How to achieve goal Formal structure for rigorous design and analysis A based on formal structure suitable for use in rigorous design and design analysis Functionality How to achieve goal Formal structure for rigorous design and analysis A Operational model retains formality needed for reasoning and where applicable automated implementation Functionality How to achieve goal Formal structure for rigorous design and analysis A created models contain enough information for implementation teams Functionality How to achieve goal Formal structure for rigorous design and analysis A Operational model when fully developed has all info needed for creating an automation system Maintainability Changing models Flexibility in evolution of process A Additional information can be easily added to artifacts Maintainability Changing models Flexibility in evolution of process A support rich flexibility in the creation and evolution of business processes Maintainability Changing models Manage applications: reusability A realization independence (changes to conceptual flow and business workflow implementation while preserving same BOM) Maintainability Changing models Manage applications: reusability A separation into levels makes it easier to manage mappings between levels and reduce complexity of making changes at BOM level Usability Expert: ease of use Identifying artifacts: iterative process A Iteration steps to identify all artifacts Usability Expert: ease of use Identifying artifacts: iterative process A choice of key artifacts may require extended and animated discussion Usability Expert: ease of use Identifying artifacts: iterative process A Any process modeling engagement is iterative Usability Expert: ease of use Profound domain knowledge required A a technical challenge is to properly chain the services together or evolve the current WF of services to adapt for new business requirements Usability Expert: ease of use Profound domain knowledge required A identifying artifacts requires an understanding of the whole business process Usability Understandability Based on existing techniques and methods A approach is inspired by IDEF0 Usability Understandability Based on existing techniques and methods A superset relation to activity flow diagrams in UML Usability Understandability Based on existing techniques and methods A Zachman's information systems architecture Usability Understandability Based on existing techniques and methods A BALSA uses ER-model to specify format of artifacts Usability Understandability Intuitive for business people A key operation is recognition rather than classification Usability Understandability Intuitive for business people A amenable to business people and intuitive for business communications Usability Understandability Intuitive for business people A operation model is targeted at business user Usability Understandability Intuitive for business people A concept of artifacts appeared somewhat foreign to business process professionals Usability Understandability Intuitive for business people A operational business people grasped the concept quite fast Usability Understandability Intuitive for business people A business stakeholders can describe macro-level lifecycles 92 Used articles 2003: Nigam, A., & Caswell, N. (2003). Business Artifacts: An Approach to Operational Specification. IBM Systems Journal, 42(3), : Bhattacharya, K., Gerede, C., Hull, R., Liu, R., Su, J. (2007). Towards a Formal Analysis of Artifact-Centric Business Process Models. Lecture Notes in Computer Science, 4714,
94 APPENDICES Appendix G. Vraag Geslacht Leeftijd Beroep Questionnaire Hoe zou u uw ervarenheid in business process modelling en conceptueel modelleren beoordelen? Hoeveel jaar ervaring heeft u met process modelleren? Hoeveel procesmodellen heeft u geanalyseerd of gelezen in de laatste 12 maanden? (een jaar heeft ongeveer 250 werkdagen; wanneer u één model per dag zou lezen, zou dit gelijk staan aan 250 modellen per jaar) Hoeveel modellen heeft u gemaakt of aangepast in de laatste 12 maanden? Hoeveel activiteiten hadden deze modellen gemiddeld? Hoeveel werkdagen met formele training heeft u gevolgd in de laatste 12 maanden? (dit omvat cursussen, colleges, etc. 15 weken een college van 90 minuten somt op tot 3 werkdagen). Hoeveel werkdagen heeft u zelf gebruikt in de laatste 12 maanden om te leren proces modelleren? (dit omvat het oefenen met modellen, verplicht werken met modellen, zelfstudie, gebruik van tekstboeken, etc.) Met welke van de volgende methoden bent u bekend? Meerdere antwoorden zijn mogelijk. Met welke van de hiernaast gegeven methoden bent u bekend? Meerdere antwoorden zijn mogelijk. Man Vrouw Jonger dan 25 jaar jaar jaar Ouder dan 50 jaar Consultant Bedrijfsanalist Software Engineer Academicus Student Anders: Beginner Gevorderde Expert 0 1 jaar 2 4 jaar 5 10 jaar jaar Meer dan 20 jaar.. modellen.. modellen.. activiteiten.. werkdagen.. werkdagen BPMN Protos Petri-netten Unified Modeling Language (UML) IDEF0 BPM one Anders: Geen van deze methoden Product-Based Workflow Design Data-driven Process Structures Artifact-Centric Process Modelling Geen van deze methoden 93
95 APPENDICES Helemaal oneens Oneens Noch eens, noch oneens Eens Helemaal eens PEOU1 PU1 PU2 PEOU2 PU3 PEOU3 PU4 PU5 PEOU4 ITU1 PEOU5 PU6 PEOU6 PU7 ITU2 Ik vond de procedure van toepassing van de methode complex en lastig te volgen Ik denk dat deze methode de benodigde inspanning voor het documenteren van grote modellen zal verminderen. Grote modellen gemaakt met deze methode zijn lastiger te begrijpen voor gebruikers Al met al vond ik de methode lastig in het gebruik Deze methode maakt het voor gebruikers gemakkelijker te verifië ren of modellen correct zijn Ik vond de methode gemakkelijk te leren Al met al vond ik de methode nuttig Het gebruik van deze methode maakt het onderhouden van grote modellen moeilijker Ik vond het moeilijk de methode toe te passen op het voorbeeldmodel Ik zou deze methode zeker niet gebruiken om grote procesmodellen te documenteren Ik vond de regels van deze methode duidelijk en gemakkelijk te begrijpen Al met al denk ik dat deze methode geen effectieve oplossing geeft voor het representeren van grote modellen. Ik ben niet overtuigd dat ik competent ben deze methode in de praktijk toe te passen Al met al denk ik dat deze methode een verbetering geeft ten opzichte van de alternatieven Ik zou deze methode de voorkeur geven boven standaard procesmodellen wanneer ik moet werken met grote data modellen in de toekomst Eventuele opmerkingen:

96 APPENDICES Appendix H. Boxplots from Questionnaires Total Professionals Students 95
97 APPENDICES Independent Samples T est Levene's Test for Equality of Variances t-test for Equality of M eans F Sig. t df Sig. (2- tailed) M ean Std. Error Difference Difference 90% Confidence Interval of the Difference Lower Upper PEOU PU Equal variances assumed 2,241 0,178-0, ,605-0, ,5391-1, ,72969 Equal variances not assumed -0,492 3,751 0,65-0, , , ,99549 Equal variances assumed 0,018 0,897 0, ,436 0, , , ,01518 Equal variances not assumed 0,845 6,961 0,426 0, , , ,99993 Independent Samples T est Levene's Test for Equality of Variances F Sig. t df t-test for Equality of M eans Sig. (2- tailed) M ean Std. Error Difference Difference 90% Confidence Interval of the Lower Upper PEOU PU Equal variances assumed 2,316 0,167 0, ,503 0,375 0, , ,37026 Equal variances not assumed 1,396 7,94 0,201 0,375 0, , ,87506 Equal variances assumed 1,549 0,249 1, ,148 0, , , ,57516 Equal variances not assumed 3,138 7,999 0,014 0, , , ,16132 Independent Samples T est Levene's Test for Equality of Variances t-test for Equality of M eans F Sig. t df Sig. (2- tailed) M ean Std. Error Difference Difference 90% Confidence Interval of the Difference Lower Upper PEOU PU Equal variances assumed 0,948 0,359-0, ,479-0,3254 0, , ,48932 Equal variances not assumed -0,609 2,721 0,59-0,3254 0, , ,98714 Equal variances assumed 0,565 0,474 0, ,718 0, , , ,99498 Equal variances not assumed 0,454 6,235 0,665 0, , , ,87564 Interpretation: 1. For all tests holds that Levene s test for equality of variances is not significant; the null hypothesis of equal variances cannot be rejected; 2. For all methods, the two-tailed significance (equal variance assumed) is above 0,10; 3. Therefore, for all methods the means for students do not significantly differ from the means obtained for professionals; 4. The boxplots that include both students and professionals will be used in the evaluation. 96
98 APPENDICES Appendix I. DDPS: Quotes from Discussion Category Code Quote # 1 Usability Abstract models for analysts: too complex for users Vrij complex om snel te leren 1 2 NA NA Niet altijd een activiteit tussen verschillende states 1 3 Usability Abstract models for analysts: too complex for users Onderscheid abstracte/concrete model lastig 1 4 Usability Abstract models for analysts: too complex for users Doelgroep begrijpt abstracte model niet 1 5 Flexibility Use in other environments - Generic model Generiek model, gebruiken in andere situaties 1 6 Usability Abstract model should fit concrete situations Concrete model moet altijd passen in abstracte model 1 7 Usability Abstract models for analysts: too complex for users Abstracte modellen zijn voor ontwerpers, analisten 1 8 Usability Abstract models for analysts: too complex for users Gebruik van generiek model om concreet model aan user te laten zien 1 9 Usability Abstract model should fit concrete situations Sprake van een fit van modellen 2 10 Usability Abstract model should fit concrete situations Goed abstract model geschikt voor elke concrete uitvoering 1 11 Maintainability Adaptation of model in one place 1 model onderhouden 1 12 Functionality Controlling workflow using data Executie vindt plaats ahv abstracte model 1 13 Usability Abstract model should fit concrete situations Hoe weet je dat je de juiste fit hebt 1 14 Usability User only has to instantiate Data Model User definieert alleen data structure 1 15 Efficiency Automated generation of workflow Data Structure + LCM = process structure 1 16 Usability User only has to instantiate Data Model Voor user is het relatief eenvoudig 1 17 Usability Abstract model should fit concrete situations Complex om modellen te maken die overal op toepasbaar zijn 1 18 NA NA Waar start je nu? 1 19 Usability Abstract models for analysts: too complex for users User kan niet in abstracte modellen denken 1 20 Usability User only has to instantiate Data Model User moet alleen een structuur geven van het product 1 21 Usability Abstract model should fit concrete situations User moet product passen in abstract model 1 22 Usability Business Analyst requires profound business knowledge Verondersteld wordt dat analist business kennis heeft 1 23 Usability Business Analyst requires profound business knowledge Abstracte model moet aangepast worden aan de situatie 1 24 NA NA Automatisch begin je in relaties te denken 1 25 Usability System boundaries should be clearly defined Het moet duidelijk zijn was Sys, SubSys, etc zijn 1 26 Flexibility Use in other environments Lifecycles buiten hierarchische structuur mogelijk 1 27 Functionality Controlling workflow using data Automatisch flow aansturen aan hand van kenmerk 1 28 Functionality Controlling workflow using data Methode universeler toepasbaar door gebruik van states 1 29 Efficiency Reusability of models Hergebruik van lifecycles 1 30 Maintainability Adaptation of model in one place Veranderingen zijn eenvoudig op 1 plek door te voeren 1 31 Usability Hierarchy improves readability Hierarchie is goed in complexe systemen (anders onoverzichtelijk) 1 32 Usability Fit between completeness and readability Links tussen niveaus zijn lastig (hoeveel, welke niveaus) 1 33 Usability Fit between completeness and readability Afweging tussen niveaus/links en overzichtelijkheid 1 34 Usability Unclear overview Vrij snel onoverzichtelijke modellen 1 35 Usability Unclear overview: connexions Connecties tussen objects worden snel onduidelijk 2 36 Functionality Controlling workflow using data Keuze maken tussen twee processen 1 37 Usability Unclear overview: large models Model wordt in grote systemen onoverzichtelijk 2 38 Functionality Controlling workflow using data Als computer een WF maakt is onoverzichtelijkheid geen probleem 1 39 Usability System boundaries should be clearly defined Ontbreken richtlijnen voor afbakenen systemen en componenten 1 40 Usability Unclear overview Onoverzichtelijkheid wordt snel slechter 1 41 Usability Fit between completeness and readability Afweging tussen volledigheid/overzichtelijkheid 1 42 Efficiency Reusability of models Model mooi door herbruikbaarheid 1 43 Efficiency Reusability of models Efficient model 2 44 Efficiency Separation of data and process logic Hergebruik binnen een model (alleen input veranderen) 1 45 Functionality Missing details - Process view Hoe geef je volgorde weer? 1 46 Usability Increased understanding by using existing concepts/methods Structuur lijkt op bill of materials 1 47 Usability System boundaries should be clearly defined Hoe worden system boundaries bepaald 1 48 Functionality Hierarchy Handig om eerst individuele componenten te testen 1 49 Usability System boundaries should be clearly defined Mis de exacte definities 2 50 Flexibility Use in other environments - Generic model De methode is breed inzetbaar omdat hij erg generiek is 1 51 Usability Hierarchy improves readability De methode is erg overzichtelijk 1 52 Usability Unclear overview: complex models Niet toepasbaar voor complexe data modellen 2 53 Usability Hierarchy improves readability Gelaagdheid 1 54 Efficiency Automated generation of workflow Stap 4 (creeren model) kan volledig automatisch worden doorlopen 1 55 Maintainability Automatically translate adaptations Het model is door automatic creation eenvoudiger te bewerken 1 56 Functionality Missing details - Process view Sterk op definitie product gericht; stappen van produceren ontbreken 1 57 Maintainability Adaptation of model in one place Processen veranderen; modellen moeten gemakkelijk aan te passen zijn 1 58 Maintainability Automatically translate adaptations Proces hoeft niet noodzakelijk op de schop, bij verandering product 1 59 Efficiency Reusability of models Herbruikbaarheid van (deel)processen 1 60 Usability Increased understanding by using existing concepts/methods Aansluiting bij PBS/WBS; begrijpbaar voor projectmanagers 1 61 Flexibility Use in other environments Administratieve processen op deze wijze eenvoudig ontleed 1 62 Efficiency Automated generation of workflow Geautomatiseerd genereren van Process Structure 1 63 Usability Abstract models for analysts: too complex for users Conceptuele stap niet voor iedereen te begrijpen 1 64 Functionality Missing details - Roles Hier is niet te zien wie wat doet 1 65 Functionality Missing details - Triggers Triggers ontbreken 1 66 Functionality Missing details - Data origin Belangrijk te weten waar de betreffende data vandaan komt 1 67 Functionality Missing details - Process view Datamodel als leidraad voor procesmodel 1 97
99 Appendix J. PBWD: Quotes from Discussion 98 APPENDICES Category Code Quote # 1 Usability Difficulties in use: alternative paths Lastig alternatieve paden te bepalen 1 2 Usability Unclear overview: direct/alternative paths Zonder shortcuts blijft de boom veel netter, overzichtelijker 1 3 Usability Alternative approaches could reduce complexity of PDM Logica zou shortcuts overbodig maken 1 4 Usability Fit between completeness and readability Nuttig om alle paden te modelleren indien automatiseren niet kan 2 5 Usability Alternative approaches could reduce complexity of PDM Alternatieven om aantal kruisende lijnen te verminderen 1 6 NA Waar komt input vandaan 2 7 Functionality Missing details: triggers Hoe wordt het model getriggerd? 1 8 Functionality Leaf elements geven maken van info aan 1 9 Usability Difficulties in use: orderless Lastig om niet te denken in processen 1 10 NA Data is interessant; traject voor leaf elements hier minder interessant 2 11 Flexibility Practical problems less straightforward Praktijkproblemen lijken minder goed aan te sluiten 1 12 Flexibility Practical problems less straightforward Onduidelijk hoe praktijkproblemen aan te moeten pakken 1 13 Usability Business analyst creates PDM PDM wordt gemaakt door analist 1 14 Functionality PDM basis for redesign PDM als basis voor herontwerp 1 15 Efficiency Optimising: order Optimale volgorde kan worden beredeneerd 1 16 Efficiency Optimising: cost, time PDM helpt om achter snelste/goedkoopste stappen te komen 1 17 Efficiency Optimising: order Bij PBWD hoeven niet per se alle stappen doorlopen te worden 1 18 Efficiency Optimising: order Redeneren vanuit benodigdheden naar proces 1 19 Usability PDM doesn't help in reasoning PDM helpt niet bij redeneren 1 20 Efficiency Optimising: cost PDM helpt bij redeneren over kosten 1 21 Functionality PDM is no end product PDM is geen procesmodel 3 22 Functionality PDM basis for redesign PDM geeft procesafhankelijkheid aan 1 23 Efficiency Optimising: cost, time Relatief goedkope stappen met hoge knockout eerst 1 24 Efficiency Optimising: order PDM helpt bij redeneren over volgorde (want volgorde onafhankelijk) 1 25 Usability PDM doesn't help in reasoning Structuur van PDM helpt momenteel nog niet bij denkstappen 1 26 Functionality PDM basis for redesign Met tabellen erbij zou dit prima zijn voor redesign 1 27 Functionality PDM basis for redesign: Orderless Objectieve manier van aangeven wat gevolgen zijn van volgorde 1 28 Functionality PDM basis for redesign: Orderless Inzichten alleen verkregen als je volgorde eerst helemaal los laat 1 29 Functionality PDM basis for redesign: Orderless De methode is volgorde onafhankelijk 1 30 Usability Unclear overview: direct/alternative paths Expliciet modelleren van niet paden maakt model complex 1 31 Usability Fit between completeness and readability Model moet wel volledig blijven 1 32 Usability Abstract models for analysts: too complex for users PDM kun je niet gebruiken bij de klant 2 33 Functionality PDM basis for redesign PDM kan prima worden gebruikt als input voor procesmodel 1 34 Functionality PDM is no end product PDM is geen eindproduct 1 35 Usability PDM understood by customer In omgeving met regels en rekenregels snapt klant dit wel 1 36 Usability PDM understood by customer Klant kan eenvoudig volgen en nalopen (controleren) 1 37 Usability Abstract models for analysts: too complex for users Meer tekst en uitleg voor de klant is noodzakelijk 1 38 Flexibility Usable in other environments De methode is overal toepasbaar 1 39 Functionality PDM is no end product Methode moet geintegreerd worden met procesmodelleren 1 40 Functionality Missing details: input Ontbreekt waar processen, data, regels vandaan komen 1 41 Functionality Explicitly defined rules PDM maakt regels expliciet 1 42 Efficiency Optimising: order Optimale volgorde kan worden beredeneerd 1 43 Usability Difficulties in use: alternative paths Lastig alternatieve paden te bepalen 1 44 Usability Abstract models for analysts: too complex for users Effect van data-waarde op het te volgen pad is niet direct duidelijk 1 45 Functionality In regels kun je het effect van gegevens op het te volgen pad meenemen 1 46 Usability Alternative approaches could reduce complexity of PDM Vaak zijn waarden automatisch interpreteerbaar; nettere boom 1 47 Usability Difficulties in use: tables Tabel is snel te technisch, houd hem makkelijk voor de klant 1 48 Usability Alternative approaches could reduce complexity of PDM Tabel kun je veel in kwijt 1 49 Usability Alternative approaches could reduce complexity of PDM Boxjes zijn snel interpreteerbaar 1 50 Functionality Missing details: Quality Kwaliteit wordt niet behandeld in het model? 1 51 Functionality Missing details: Quality Kwaliteit hoeft niet meegenomen te worden in dit model 1 52 Usability Unclear overview: direct/alternative paths Alternatieve paden maken het model minder leesbaar 2 53 Usability Fit between completeness and readability Alle negatieve paden meenemen houdt het model compleet 1 54 Usability Unclear overview: large models PDM wordt snel wirwar van pijlen, overzicht raakt kwijt 2 55 Usability Alternative approaches could reduce complexity of PDM Lazy evaluation ipv alternative paths 1 56 Usability Unclear overview: large models Grote modellen zijn niet leesbaar voor klant 1 57 Usability Unclear overview: large models Clusteren oid om leesbaar te houden noodzakelijk 1 58 Functionality PDM basis for redesign: complex processes Het kan voordelen opleveren bij grote complexe processen 1 59 Usability Difficulties in use Modelleur en lezers hebben opleiding nodig in gebruik 1 60 Usability Increased understanding by using existing concepts/methods Vanuit een BOM naar product of dienst werken 1 61 Usability Abstract models for analysts: too complex for users Methode is niet snel te begrijpen 1 62 Functionality Missing details: roles Ontbreken van gegevens zoals uitvoerende, verantwoordelijke 1 63 Usability Difficulties in use: rules Opstellen van regels moeilijk 1 64 Functionality PDM basis for redesign Methode met name geschikt voor procesverbeteringsanalyse 1 65 Functionality Missing details Voor inzichtelijk maken van proces voor uitvoerende te weinig details 1 66 Functionality PDM basis for redesign Inzicht in belangrijke beslismomenten 1 67 Efficiency Optimising: cost, time Mogelijkheid tot verbeteren van efficiency van een proces 1 68 Functionality Extend to existing methods Mogelijk aanvulling op Lean methodiek 1 69 Functionality Missing details: roles Ontbreken van actoren en karakteristieken 1 70 Flexibility Usable in other environments Methode breed inzetbaar 1 71 Usability Increased understanding by using existing concepts/methods Vanuit een BOM naar product of dienst werken 1 72 Functionality PDM basis for redesign: indirect processes Waarde van indirecte processen in kaart brengen 1 73 Functionality Explicitly defined rules Concreet maken van business rules 1 74 Functionality Missing details: views Ontbreken van verschillende views voor verschillende doeleinden 1
100 APPENDICES Appendix K. ACPM: Quotes from Discussion Category Code Quote # 1 Usability System boundaries should be clearly defined Wat is precies een artifact 1 2 Usability System boundaries should be clearly defined Waar houd je op met een lifecycle 1 3 Usability System boundaries should be clearly defined Wat is de gedetailleerdheid van artefacten 1 4 Usability Difficulties in use: artifacts Gewend onderwerpen aan te kruisen, niet alles in tekst 1 5 Usability Difficulties in use: artifacts Wat zit er in een proces? Dat zijn je artefacten 1 6 Usability System boundaries should be clearly defined Duidelijk definieren welk niveau gewerkt wordt 1 7 Usability Abstract models for analysts: too complex for users Uitvoerende partij kan niks met het model 1 8 Functionality New insights in process Software ontwikkelaar die kijkt naar functioneren syst heeft hier iets aan 2 9 Maintainability Adaptation of models in several places Als iets verandert moet dit op verschillende punten doorgevoerd worden 1 10 Maintainability Adaptation of models in several places In grote systemen worden aanpassingen alleen lastiger 1 11 Functionality New insights in process Software ontwikkelaar heeft voordeel bij manier van modelleren 1 12 Functionality Structured method: rules Regels en voorschriften leiden tot gestructureerde methode 1 13 Usability Abstract models for analysts: too complex for users Alleen laatste stappen, flow, bruikbaar voor iedereen 1 14 Usability Abstract models for analysts: too complex for users Artifact models meer voor de techneuten 1 15 Functionality Structured method: roles Formeel opstellen van regels: Wie doet Wat 1 16 Functionality Structured method: knowledge Vastgelegde regels beter dan kennis in hoofden werknemers 1 17 Usability Limited understandability: what is added value Toegevoegde waarde states en lifecycles niet helemaal duidelijk 1 18 Functionality Interaction of artifacts and lifecycles Totaalproces moet hier nog boven, koppelen van lifecycles 1 19 Functionality Interaction of artifacts and lifecycles Aangegeven hoe objecten communiceren met elkaar 1 20 Functionality Interaction of artifacts and lifecycles Workflow stuurt artefacten 1 21 Efficiency Reusability of artifacts and lifecycles Andere workflow die gebruik maakt van dezelfde artefacten 1 22 Usability Limited understandability: confusing reasoning Moeilijke manier van redeneren, verwarrend tov process 1 23 Usability Difficulties in use: flow Moeilijk om alles weer in een flow te krijgen 1 24 Functionality Interaction of artifacts and lifecycles Verschillende lifecycles van artefacten laten samenwerken in systeem 1 25 Usability Limited understandability: artifacts not intuitive Niet echt intuitief om in artefacten te denken 2 26 Functionality Hierarchy of artifacts possible Hierarchie van artefacten is mogelijk 1 27 Usability System boundaries should be clearly defined Concrete afspraken mbt level of detail 1 28 Functionality New insights in process Inzichten in het proces worden verkregen 1 29 Functionality Interaction of artifacts and lifecycles Lifecycles bepalen hoe rules en services gestructureerd worden 1 30 Maintainability Adaptation of models in several places Veranderingen doorvoeren in grote modellen is complex 1 31 Usability Difficulties in use: rules Toepassen van rules is lastig 1 32 Flexibility Usable in other environments De methode is breed inzetbaar 1 33 Functionality Structured method Methode is gestructureerd en specifiek 1 34 Usability Difficulties in use: attributes Benodigde eigenschappen van artefacten lastig te bepalen 1 35 Usability Limited understandability: artifacts not intuitive Mix van artefacten en lifecycles was lastig 1 36 Functionality Missing details Te weinig info om methode te gebruiken bij systeemontwikkeling 1 37 Flexibility Usable in other environments De methode is redelijk breed inzetbaar 1 38 Usability Limited understandability: method not self-explaining De methode is niet zozeer zelf uitleggend 1 39 Functionality Interaction of artifacts and lifecycles De combinatie van artifacten en lifecycles is erg sterk 1 40 Functionality Missing details: input, output Ondergeschiktheid van input en output 1 41 NA Eenvoud van de methode 1 42 NA Start en Endstate zijn niet herkenbaar 1 43 Usability Limited understandability: method not self-explaining Services niet gealloceerd op arcs van lifecycles, niet direct duidelijk 1 44 Flexibility Usable in other environments Methode is breed inzetbaar 1 45 Usability Increased understanding by using existing concepts/methods Methode is herkenbaar door gebruik van bestaande technieken 1 46 Functionality New insights in process Focus is op kritieke procesovergangen ipv op een gehele flow 1 47 Usability Difficulties in use: Missing tooling Ontbreken van tooling om het modelleren te vergemakkelijken 1 99
101 APPENDICES Appendix L. FUNCTIONALITY -Goal of method (D1) DDPS: Linking Claims and Statements METHODS Positive Negative Undecided Reusability of models Separation of data and process logic Adaptation of model in one place -How to achieve (D2) Controlling workflow using data Abstract model should fit concrete situations -IT Support (D3) USABILITY -Understandability -User: ease of use (D4) Hierarchy improves readability Increased understanding by using existing concepts/methods User only has to instantiate data model Missing details: roles, triggers, process view, origin of data Unclear overview: large models Abstract models for analysts: too complex for users Fit of completeness and readability -Expert: ease of use (D5) Unclear overview: large models Business analyst requires profound business knowledge System boundaries should be clearly defined EFFICIENCY -Multiple instantiations of models (D6) -Automated creation (D7) Reusability of models Automated generation of workflow -Reusability (D8) -Reduce modelling efforts (D9) -Optimising process MAINTAINABILITY -Changes (D10) FLEXIBILITY -Other environments (D11) Reusability of models Reusability of models Separation of data and process logic Adaptation of model in one place Automatically translate adaptations into a new process Generic model Use in other environments 100
102 Appendix M. FUNCTIONALITY -Goal of method (P1) -How to achieve (P2) -IT Support (P3) USABILITY -Understandability (P4, P5) PBWD: Linking Claims and Statements METHODS Positive Negative Undecided PDM basis for redesign: orderless, insights in indirect processes, and benefits in large processes Explicitly defined rules Increased understanding by using existing concepts/methods Missing details: input, roles, triggers, different views PDM does not help reasoning -User: ease of use PDM understood by customer Abstract models for analysts: too complex for users Difficulties in use: alternative paths, orderless, rules, tables Unclear overview: direct/alternative paths, large models -Expert: ease of use (P6, P7) Difficulties in use: alternative paths, orderless, rules, tables Unclear overview: direct/alternative paths, large models APPENDICES PDM is no end product Fit between completeness/readability Alternative approaches could reduce complexity of PDM Business analyst creates PDM EFFICIENCY -Multiple instantiations of models (P8) -Automated creation (P9) -Reusability -Reduce modelling efforts -Optimising process (P10) MAINTAINABILITY -Changes FLEXIBILITY -Other environments (P11) Optimising: order, cost, and time Usable in other environments Practical problems less straightforward 101
103 APPENDICES Appendix N. FUNCTIONALITY -Goal of method (A1, A2) -How to achieve (A3) -IT Support USABILITY -Understandability (A4, A5) -User: ease of use -Expert: ease of use (A6) ACPM: Linking Claims and Statements METHODS Positive Negative Undecided Structured method: capturing knowledge, roles, and rules New insights in process Interaction of artifacts and lifecycles: communication, workflow Hierarchy of artifacts possible Increased understanding by using existing concepts/methods Missing details: input, output Limited understandability: artefact not intuitive, unclear added value, confusing reasoning, and non self-explanatory method. Abstract models for analysts: too complex for users Difficulties in use: determination of artifacts, attributes, flow, and rules System boundaries should be clearly defined EFFICIENCY -Multiple instantiations of models (A7) -Automated creation -Reusability -Reduce modelling efforts (A8) -Optimising process MAINTAINABILITY -Changes (A9) FLEXIBILITY -Other environments (A10) Reusability of Artifacts and Lifecycles Usable in other environments Adaptation of models in several places 102
104 APPENDICES Appendix O. Descriptives of Participants DDPS PBWD ACPM Total Sex Male Female Age < > Profession Consultant Business Analyst Software Engineer Process Analyst Process Architect Student Skill level Novice Intermediate Expert Years of experience > Models read/analysed Min Mean 68,89 82,50 64,00 71,90 Max 250,00 200,00 150,00 250,00 Models created/adjusted Min Mean 37,44 123,30 24,90 62,72 Max 200, ,00 60, ,00 Number of activities Min 5,00 10,00 5,00 5,00 Mean 18,00 130,88 24,13 57,67 Max 60,00 650,00 100,00 650,00 Days of formal training Min Mean 1,83 8,60 0,80 3,81 Max 5,00 25,00 3,00 25,00 Days of self-education Min Mean 11,56 5,70 27,70 15,10 Max 88,00 35,00 250,00 250,00 Known methods/tools BPMN Protos Petri-nets UML IDEF BPM one PBWD DDPS ACPM
105 APPENDICES Appendix P. Overview of Claims and their support Data-driven Process Structures Product-Based Workflow Design Artifact-Centric Process Modelling FUNCTIONALITY -Goal of method D1 Data-driven modelling of large process structures; ensuring correct coordination, reducing modelling efforts, and providing mechanisms for maintenance. P1 Method that (re)designs a process reasoning from the desired outcome, without directly discussing how to achieve it. A1 Representation usable by business people to analyse, manage, and control business operations A2 Substantial new insights can be acquired by managers -How to achieve D2 Separation of data and process logic, leading to an enactable process structure P2 Analytical, clean sheet approach: rational and quantitative way of deriving an optimised process design. A3 Declarative approach, that incorporates formality required for rigorous design and analysis -IT Support D3 IT Support for automated creation and soundness checks P3 PDM used to steer a workflow execution: basis for a process model. USABILITY -Understandability P4 P5 Created models are accepted by end users as valid and workable. Based on existing concept (BOM) A4 Intuitive appeal to business managers, somewhat foreign to business process professionals A5 Based on existing methods and techniques -User: ease of use D4 Intuitive integration of data and (sub-)processes enables users to instantiate and adapt model without process knowledge (by adapting data structure). -Expert: ease of use EFFICIENCY -Different processes from same models D5 Process experts require profound domain knowledge to create data model and LCM. D6 Instantiating different data structures and generating the respective data-driven process structures P6 P7 Efforts required to collect data for PDM differs for every company. Constructing PDM is manual task P8 Using different optimisation criteria, different process models can be created. A6 Identifying artifacts is an iterative process that requires understanding of whole business process. A7 Enabling specification of generic schema with multiple specialisations. -Automated creation D7 Automated creation of Process Structure P9 Algorithms and PBWS can be used to automatically generate process models or recommendations for carrying out operations. -Reusability D8 Standardising processing of objects in order to increase the re- use of process models and reducing modelling efforts. -Reduce modelling efforts D9 Separation of data and process logic results in a reduction of modelling efforts. A8 Separation of data management concerns from process flow concerns -Optimisation P10 Optimisation of the process by including optimisation criteria. MAINTAINABILITY -Changes D10 Changes can be made at datalevel and are automatically trans- lated into corresponding adaptations of the process A9 Changes can be made to conceptual flow and business workflow, while preserving the same Business Operations Model. FLEXIBILITY -Other environments D11 Usable in other environments, not specificly the engineering domain. P11 Restricted to fields where clear concept of the products to be delivered exists. A10 Usable in other environments, particularly in the use of consumed and nonconsumed goods. 104
Supporting the BPM lifecycle with FileNet
 Supporting the BPM lifecycle with FileNet Mariska Netjes Hajo A. Reijers Wil. M.P. van der Aalst Outline Introduction Evaluation approach Evaluation of FileNet Conclusions Business Process Management Supporting
How To Develop Software
 Software Engineering Prof. N.L. Sarda Computer Science & Engineering Indian Institute of Technology, Bombay Lecture-4 Overview of Phases (Part - II) We studied the problem definition phase, with which
(Refer Slide Time 00:56)
") Software Engineering Prof.N. L. Sarda Computer Science & Engineering Indian Institute of Technology, Bombay Lecture-12 Data Modelling- ER diagrams, Mapping to relational model (Part -II) We will continue
Software Engineering Prof.N. L. Sarda Computer Science & Engineering Indian Institute of Technology, Bombay Lecture-12 Data Modelling- ER diagrams, Mapping to relational model (Part -II) We will continue
(Refer Slide Time: 01:52)
") Software Engineering Prof. N. L. Sarda Computer Science & Engineering Indian Institute of Technology, Bombay Lecture - 2 Introduction to Software Engineering Challenges, Process Models etc (Part 2) This
Software Engineering Prof. N. L. Sarda Computer Science & Engineering Indian Institute of Technology, Bombay Lecture - 2 Introduction to Software Engineering Challenges, Process Models etc (Part 2) This
Requirements engineering
 Learning Unit 2 Requirements engineering Contents Introduction............................................... 21 2.1 Important concepts........................................ 21 2.1.1 Stakeholders and
Designing workflow systems
 TECHNISCHE UNIVERSITEIT EINDHOVEN Department of Mathematics and Computing Science MASTER S THESIS An algorithmic approach to process design and a human oriented approach to process automation by Irene
An Integrated Quality Assurance Framework for Specifying Business Information Systems
 An Integrated Quality Assurance Framework for Specifying Business Information Systems Frank Salger 1, Stefan Sauer 2, Gregor Engels 1,2 1 Capgemini sd&m AG, Carl-Wery-Str. 42, D-81739 München, Germany
2 Computer Science and Information Systems Research Projects
 2 Computer Science and Information Systems Research Projects This book outlines a general process for carrying out thesis projects, and it embraces the following components as fundamentally important:
Towards Web Design Frameworks (Wdfs)
") 14 Towards Web Design Frameworks (Wdfs) Rehema Baguma, Faculty of Computing and IT, Makerere University. [email protected]; Ogao Patrick, Department of Information Systems, Faculty of Computing and
14 Towards Web Design Frameworks (Wdfs) Rehema Baguma, Faculty of Computing and IT, Makerere University. [email protected]; Ogao Patrick, Department of Information Systems, Faculty of Computing and
What to look for when recruiting a good project manager
 What to look for when recruiting a good project manager Although it isn t possible to provide one single definition of what a good project manager is, certain traits, skills and attributes seem to be advantageous
SHOULD SALES FORCE AUTOMATION CHANGES BRAND AUTOMATION FOR LG
 SHOULD SALES FORCE AUTOMATION CHANGES BRAND AUTOMATION FOR LG Dr. Ashish Mathur (M) Associate Professor, Department of Management Studies Lachoo Memorial College of Science & Technology, Jodhpur ABSTRACT
SUPPORTING KNOWLEDGE WORKERS: CASE MANANGEMENT MODEL AND NOTATION (CMMN)
") INFORMATION SYSTEMS IN MANAGEMENT Information Systems in Management (2013) Vol. 2 (1) 3 11 SUPPORTING KNOWLEDGE WORKERS: CASE MANANGEMENT MODEL AND NOTATION (CMMN) AGNIESZKA GRUDZIŃSKA-KUNA Department
INFORMATION SYSTEMS IN MANAGEMENT Information Systems in Management (2013) Vol. 2 (1) 3 11 SUPPORTING KNOWLEDGE WORKERS: CASE MANANGEMENT MODEL AND NOTATION (CMMN) AGNIESZKA GRUDZIŃSKA-KUNA Department
Software Engineering Reference Framework
 Software Engineering Reference Framework Michel Chaudron, Jan Friso Groote, Kees van Hee, Kees Hemerik, Lou Somers, Tom Verhoeff. Department of Mathematics and Computer Science Eindhoven University of
Measuring the response of students to assessment: the Assessment Experience Questionnaire
 11 th Improving Student Learning Symposium, 2003 Measuring the response of students to assessment: the Assessment Experience Questionnaire Graham Gibbs and Claire Simpson, Open University Abstract A review
MSc in Physics Research For students entering in 2006
 MSc in Physics Research For students entering in 2006 Awarding Institution: The University of Reading Teaching Institution: The University of Reading Faculty of Science Programme length: 12 or 24 months
New criteria for assessing a technological design
 New criteria for assessing a technological design Kees van Hee and Kees van Overveld April 2012 1. Introduction In 2010 we developed a set of criteria for the evaluation of technological design projects
STAGE 1 COMPETENCY STANDARD FOR PROFESSIONAL ENGINEER
 STAGE 1 STANDARD FOR PROFESSIONAL ENGINEER ROLE DESCRIPTION - THE MATURE, PROFESSIONAL ENGINEER The following characterises the senior practice role that the mature, Professional Engineer may be expected
Week 3. COM1030. Requirements Elicitation techniques. 1. Researching the business background
 Aims of the lecture: 1. Introduce the issue of a systems requirements. 2. Discuss problems in establishing requirements of a system. 3. Consider some practical methods of doing this. 4. Relate the material
Supporting the BPM life-cycle with FileNet
 Supporting the BPM life-cycle with FileNet Mariska Netjes, Hajo A. Reijers, Wil M.P. van der Aalst Eindhoven University of Technology, Department of Technology Management, PO Box 513, NL-5600 MB Eindhoven,
SUPPORTING LOGISTICS DECISIONS BY USING COST AND PERFORMANCE MANAGEMENT TOOLS. Zoltán BOKOR. Abstract. 1. Introduction
 SUPPORTING LOGISTICS DECISIONS BY USING COST AND PERFORMANCE MANAGEMENT TOOLS Zoltán BOKOR Department of Transport Economics Faculty of Transportation Engineering Budapest University of Technology and
Requirements Engineering: Elicitation Techniques
 2008:PR003 Requirements Engineering: Elicitation Techniques Sai Ganesh. Gunda Source:http://www.marcocioffi.com/archives/2005/04/requirements-engineering/ MASTER S THESIS Software Engineering, 2008 Department
Modeling Workflow Patterns
 Modeling Workflow Patterns Bizagi Suite Workflow Patterns 1 Table of Contents Modeling workflow patterns... 4 Implementing the patterns... 4 Basic control flow patterns... 4 WCP 1- Sequence... 4 WCP 2-
Process Modelling from Insurance Event Log
 Process Modelling from Insurance Event Log P.V. Kumaraguru Research scholar, Dr.M.G.R Educational and Research Institute University Chennai- 600 095 India Dr. S.P. Rajagopalan Professor Emeritus, Dr. M.G.R
A Framework for Software Product Line Engineering
 Günter Böckle Klaus Pohl Frank van der Linden 2 A Framework for Software Product Line Engineering In this chapter you will learn: o The principles of software product line subsumed by our software product
Better Processes = Better E-Commerce
 Better Processes = Better E-Commerce by Hajo A. Reijers and Monique H. Jansen-Vullers Many companies have found out the hard way that successful e-commerce requires more than a flashy Web presence. Electronic
Advanced Service Creation: Bridging the Gap Between Requirements Elicitation and Service Design
 Advanced Service Creation: Bridging the Gap Between Requirements Elicitation and Service Design Dionisis X. Adamopoulos 1, Constantine A. Papandreou 2 1 University of Piraeus, Greece and Centre for Communication
Business Process Management: A personal view
 Business Process Management: A personal view W.M.P. van der Aalst Department of Technology Management Eindhoven University of Technology, The Netherlands [email protected] 1 Introduction Business
Title: Basic Concepts and Technologies for Business Process Management
 Title: Basic Concepts and Technologies for Business Process Management Presenter: prof.dr. Manfred Reichert The economic success of an enterprise more and more depends on its ability to flexibly and quickly
Family Evaluation Framework overview & introduction
 A Family Evaluation Framework overview & introduction P B Frank van der Linden O Partner: Philips Medical Systems Veenpluis 4-6 5684 PC Best, the Netherlands Date: 29 August, 2005 Number: PH-0503-01 Version:
How To Determine Your Level Of Competence
 Outcome Analysis of Bachelor and Master Curricula in Electrical Engineering and Computing Hans-Ulrich Heiss #1, Cornelia Raue *2 # School of Electrical Engineering and Computer Science, TU Berlin Einsteinufer
Risk Knowledge Capture in the Riskit Method
 Risk Knowledge Capture in the Riskit Method Jyrki Kontio and Victor R. Basili [email protected] / [email protected] University of Maryland Department of Computer Science A.V.Williams Building
Surveying and evaluating tools for managing processes for software intensive systems
 Master Thesis in Software Engineering 30 Credits, Advanced Level Surveying and evaluating tools for managing processes for software intensive systems Anuradha Suryadevara IDT Mälardalen University, ABB
Quality Ensuring Development of Software Processes
 Quality Ensuring Development of Software Processes ALEXANDER FÖRSTER,GREGOR ENGELS Department of Computer Science University of Paderborn D-33095 Paderborn, Germany {alfo engels}@upb.de ABSTRACT: Software
Table of Contents. CHAPTER 1 Web-Based Systems 1. CHAPTER 2 Web Engineering 12. CHAPTER 3 A Web Engineering Process 24
 Table of Contents CHAPTER 1 Web-Based Systems 1 The Web 1 Web Applications 2 Let s Introduce a Case Study 3 Are WebApps Really Computer Software? 4 Are the Attributes of WebApps Different from the Attributes
Software Metrics & Software Metrology. Alain Abran. Chapter 4 Quantification and Measurement are Not the Same!
 Software Metrics & Software Metrology Alain Abran Chapter 4 Quantification and Measurement are Not the Same! 1 Agenda This chapter covers: The difference between a number & an analysis model. The Measurement
Analysing Qualitative Data
 Analysing Qualitative Data Workshop Professor Debra Myhill Philosophical Assumptions It is important to think about the philosophical assumptions that underpin the interpretation of all data. Your ontological
Software Engineering Compiled By: Roshani Ghimire Page 1
 Unit 7: Metric for Process and Product 7.1 Software Measurement Measurement is the process by which numbers or symbols are assigned to the attributes of entities in the real world in such a way as to define
CONCEPTUAL DESIGN FOR ASSET MANAGEMENT SYSTEM UNDER THE FRAMEWORK OF ISO 55000
 CONCEPTUAL DESIGN FOR ASSET MANAGEMENT SYSTEM UNDER THE FRAMEWORK OF ISO 55000 Sungin CHO Khanh-Loc NGUYEN Jos M. WETZER DNV GL Clean Technology Centre DNV GL Clean Technology Centre DNV GL Energy Advisory
Introducing Reference Models in ERP Development
 Introducing Reference Models in ERP Development Signe Ellegård Borch IT University of Copenhagen [email protected] Introduction Business process reference modelling is not a new topic in the ERP software
Thesis Summary: An Ontology for City Logistics
 Thesis summary This report contains the detailed course of designing an ontology that formalises the domain knowledge of City Logistics and then facilitates relevant agent-based modelling. Validation,
Quality Standard Customer Service Complaints Handling
 Quality Standard Customer Service Complaints Handling Version 1 Date:- 2 nd December 2010 Page 1 Contents INTRODUCTION 4 OVERVIEW OF THE COMPLAINTS STANDARD 5 FRAMEWORK 6 MANDATORY SECTIONS 7 SECTION 1
Full-time MSc in Logistics and Supply Chain Management
 Full-time MSc in Logistics and Supply Chain Management Course structure and content 2015-2016 The course has been developed to produce expert logistics and supply chain professionals who can take the skills
Exploring the directions and methods of business development. A comparative multiple-case study on Ikea and Vodafone
 Exploring the directions and methods of business development A comparative multiple-case study on Ikea and Vodafone Michal Štefan Aalborg University Master thesis for MSc. in International Business Economics
REGULATIONS AND CURRICULUM FOR THE MASTER S PROGRAMME IN INFORMATION ARCHITECTURE FACULTY OF HUMANITIES AALBORG UNIVERSITY
 REGULATIONS AND CURRICULUM FOR THE MASTER S PROGRAMME IN INFORMATION ARCHITECTURE FACULTY OF HUMANITIES AALBORG UNIVERSITY SEPTEMBER 2015 Indhold PART 1... 4 PRELIMINARY REGULATIONS... 4 Section 1 Legal
Holistic Development of Knowledge Management with KMMM
 1 Karsten Ehms, Dr. Manfred Langen Holistic Development of Knowledge Management with KMMM Siemens AG / Corporate Technology Knowledge Management & Business Transformation If knowledge management is to
7 Conclusions and suggestions for further research
 7 Conclusions and suggestions for further research This research has devised an approach to analyzing system-level coordination from the point of view of product architecture. The analysis was conducted
Curriculum for Business Economics and Information Technology
 Curriculum for Business Economics and Information Technology Copenhagen School of Design and Technology August 2012 1 General regulations for all institutions providing the programme Curriculum Applicable
C. Wohlin and B. Regnell, "Achieving Industrial Relevance in Software Engineering Education", Proceedings Conference on Software Engineering
 C. Wohlin and B. Regnell, "Achieving Industrial Relevance in Software Engineering Education", Proceedings Conference on Software Engineering Education & Training, pp. 16-25, New Orleans, Lousiana, USA,
Demonstrating WSMX: Least Cost Supply Management
 Demonstrating WSMX: Least Cost Supply Management Eyal Oren 2, Alexander Wahler 1, Bernhard Schreder 1, Aleksandar Balaban 1, Michal Zaremba 2, and Maciej Zaremba 2 1 NIWA Web Solutions, Vienna, Austria
Usability Evaluation of Universities Websites
 1 Jabar M. A., 2Usman Abbas Usman, 3Sidi F. Department of Information System, marzanah@ upm.edu.my 2 Department of Information System, [email protected] 3 Department of Computer Science, fatimah@
FileNet s BPM life-cycle support
 FileNet s BPM life-cycle support Mariska Netjes, Hajo A. Reijers, Wil M.P. van der Aalst Eindhoven University of Technology, Department of Technology Management, PO Box 513, NL-5600 MB Eindhoven, The Netherlands
CHAPTER 1 INTRODUCTION
 CHAPTER 1 INTRODUCTION 1.1 Research Motivation In today s modern digital environment with or without our notice we are leaving our digital footprints in various data repositories through our daily activities,
THE STANDARD FOR DOCTORAL DEGREES IN LAW AT THE FACULTY OF LAW, UNIVERSITY OF TROMSØ
 THE FACULTY OF LAW THE STANDARD FOR DOCTORAL DEGREES IN LAW AT THE FACULTY OF LAW, UNIVERSITY OF TROMSØ Guidelines for the Faculty of Law in Tromsø, adopted by the Faculty Board on 31 May 2010. 1 Background
-Blue Print- The Quality Approach towards IT Service Management
 -Blue Print- The Quality Approach towards IT Service Management The Qualification and Certification Program in IT Service Management according to ISO/IEC 20000 TÜV SÜD Akademie GmbH Certification Body
Doctoral (PhD) Thesis Assessment
 Thesis Assessment") 1 Doctoral (PhD) Thesis Assessment Student: Petra Gyurácz-Németh Title: Service Delivery Standardisation and Customisation in the Hungarian Hotels Institute: UNIVERSITY OF PANNONIA Doctoral School of Management
1 Doctoral (PhD) Thesis Assessment Student: Petra Gyurácz-Németh Title: Service Delivery Standardisation and Customisation in the Hungarian Hotels Institute: UNIVERSITY OF PANNONIA Doctoral School of Management
Transport Management from a Shipper s Perspective
 Transport Management from a Shipper s Perspective Utilizing the Analytical Hierarchy Process to assess the shipper s transport outsourcing decision Author P.J. Marijnissen 1102214 January 8, 2009 Final
Full-time MSc in Logistics and Supply Chain Management
 Full-time MSc in Logistics and Supply Chain Management Course structure and content 2016-2017 The course has been developed to produce expert logistics and supply chain professionals who can take the skills
The Project Planning Process Group
 3 The Project Planning Process Group............................................... Terms you ll need to understand: Activity Activity attributes Activity list Activity on arrow diagram (AOA) Activity
Managing and Tracing the Traversal of Process Clouds with Templates, Agendas and Artifacts
 Managing and Tracing the Traversal of Process Clouds with Templates, Agendas and Artifacts Marian Benner, Matthias Book, Tobias Brückmann, Volker Gruhn, Thomas Richter, Sema Seyhan paluno The Ruhr Institute
SELF STUDY DIPLOMA IN BUSINESS ANALYSIS
 What? How? Business Process Education Centre CC PostNet Suite 60, Private Bag X1 Northcliff, 2115, South Africa Tel (011) 478 0430 Fax (011) 478 0435 www.whathow.co.za SELF STUDY DIPLOMA IN BUSINESS ANALYSIS
1 INTRODUCTION TO SYSTEM ANALYSIS AND DESIGN
 1 INTRODUCTION TO SYSTEM ANALYSIS AND DESIGN 1.1 INTRODUCTION Systems are created to solve problems. One can think of the systems approach as an organized way of dealing with a problem. In this dynamic
These subject guidelines should be read in conjunction with the Introduction, Outline and Details all essays sections of this guide.
 Criterion J: abstract The abstract is judged on the clarity with which it presents an overview of the research and the essay, not on the quality of the research question itself, nor on the quality of the
Usability Issues in Web Site Design
 Version 3, April 98 (available from http://www.npl.co.uk/npl/sections/us and in Proceedings of UPA 98) Usability Issues in Web Site Design Nigel Bevan National Physical Laboratory, Usability Services,
Rochester Institute of Technology Master's Thesis Guidelines for Students and Faculty
 Rochester Institute of Technology Master's Thesis Guidelines for Students and Faculty The objective of this document is to provide guidance for students and faculty committees concerning the planning,
Guidelines for degree projects in business administration: A. Bachelor level 15 hec (G2E level) D. Master level 30 hec (A2E level)
 D. Master level 30 hec (A2E level)") School of Business and Economics Reg. no: 2010/83 at Linnaeus University Revision 2 Decided by ELNU Board 2011-10-28 Revision 3, 2013-01-17 (Reg. no: ST 2013/47-1.1) Guidelines for degree projects in business
School of Business and Economics Reg. no: 2010/83 at Linnaeus University Revision 2 Decided by ELNU Board 2011-10-28 Revision 3, 2013-01-17 (Reg. no: ST 2013/47-1.1) Guidelines for degree projects in business
IMPACT OF JOB CHARACTERISTICS ON JOB SATISFACTION AMONG ERP SYSTEM USERS
 IMPACT OF JOB CHARACTERISTICS ON JOB SATISFACTION AMONG ERP SYSTEM USERS S.Lakshmi 1 * and M.R.Vanithmani 2# 1. School of Management, Sri Krishna College Of Engineering And Technology, Coimbatore, Tamil
The Asset Management Landscape
 The Asset Management Landscape ISBN 978-0-9871799-1-3 Issued November 2011 www.gfmam.org The Asset Management Landscape www.gfmam.org ISBN 978-0-9871799-1-3 Published November 2011 This version replaces
Listening to the Customer s Voice 1
 Listening to the Customer s Voice 1 Karl E. Wiegers Process Impact 716-377-5110 www.processimpact.com Perhaps the greatest challenge facing the software developer is sharing the vision of the final product
Applying Integrated Risk Management Scenarios for Improving Enterprise Governance
 Applying Integrated Risk Management Scenarios for Improving Enterprise Governance János Ivanyos Trusted Business Partners Ltd, Budapest, Hungary, [email protected] Abstract: The term of scenario is used
An Enterprise Framework for Evaluating and Improving Software Quality
 An Enterprise Framework for Evaluating and Improving Software Quality Abstract Philip Lew [email protected] With the world s economy increasingly driven by software products, there has been a relentless
Towards a Transparent Proactive User Interface for a Shopping Assistant
 Towards a Transparent Proactive User Interface for a Shopping Assistant Michael Schneider Department of Computer Science, Saarland University, Stuhlsatzenhausweg, Bau 36.1, 66123 Saarbrücken, Germany [email protected]
Bachelor of International Sales and Marketing Management Professionsbachelor i international handel og markedsføring
 August 2009 Curriculum Bachelor of International Sales and Marketing Management Professionsbachelor i international handel og markedsføring Contents Contents... 1 Section 1: General... 3 1 The Course...
Literature survey: historical and theoretical background. The chapter requires you to have done some library and company research to:
 Writing the MBA Dissertation 1. General Comments This should be divided into chapters as detailed in the following section: Note: The dissertation may not divide up easily into the 6 main headings, but
UNIVERSITY OF ULSTER: COLERAINE PROGRAMME SPECIFICATION. COURSE TITLE: B.Sc. (HONS) SOCIAL PSYCHOLOGY/ B.Sc. (HONS) SOCIAL PSYCHOLOGY with DPP
 SOCIAL PSYCHOLOGY/ B.Sc. (HONS) SOCIAL PSYCHOLOGY with DPP") 25 UNIVERSITY OF ULSTER: COLERAINE PROGRAMME SPECIFICATION COURSE TITLE: B.Sc. (HONS) SOCIAL PSYCHOLOGY/ B.Sc. (HONS) SOCIAL PSYCHOLOGY with DPP PLEASE NOTE: This specification provides a concise summary
25 UNIVERSITY OF ULSTER: COLERAINE PROGRAMME SPECIFICATION COURSE TITLE: B.Sc. (HONS) SOCIAL PSYCHOLOGY/ B.Sc. (HONS) SOCIAL PSYCHOLOGY with DPP PLEASE NOTE: This specification provides a concise summary
BPMN and Simulation. L. J. Enstone & M. F. Clark The Lanner Group April 2006
 BPMN and Simulation L. J. Enstone & M. F. Clark The Lanner Group April 2006 Abstract This paper describes the experiences and technical challenges encountered by the Lanner group in building a Java based
Data Coding and Entry Lessons Learned
 Chapter 7 Data Coding and Entry Lessons Learned Pércsich Richárd Introduction In this chapter we give an overview of the process of coding and entry of the 1999 pilot test data for the English examination
Modelling Workflow with Petri Nets. CA4 BPM PetriNets
 Modelling Workflow with Petri Nets 1 Workflow Management Issues Georgakopoulos,Hornick, Sheth Process Workflow specification Workflow Implementation =workflow application Business Process Modelling/ Reengineering
THE METIER OF ERP PROJECT MANAGEMENT Successful Projects above all require Business-IT Leadership
 THE METIER OF ERP PROJECT MANAGEMENT Successful Projects above all require Business-IT Leadership White Paper March 2013 1 P a g e Table of contents Introduction ERP Projects ERP Project Management ERP
How Good is Our Council?
 A guide to evaluating Council Services using quality indicators Securing the future... l Improving services l Enhancing quality of life l Making the best use of public resources Foreword Perth & Kinross
Supply Chain Management 100 Success Secrets
 Supply Chain Management 100 Success Secrets Supply Chain Management 100 Success Secrets - 100 Most Asked Questions: The Missing SCM Software, Logistics, Solution, System and Process Guide Lance Batten
Process Methodology. Wegmans Deli Kiosk. for. Version 1.0. Prepared by DELI-cious Developers. Rochester Institute of Technology
 Process Methodology for Wegmans Deli Kiosk Version 1.0 Prepared by DELI-cious Developers Rochester Institute of Technology September 15, 2013 1 Table of Contents 1. Process... 3 1.1 Choice... 3 1.2 Description...
Maintaining employees focus and motivation is essential if they are to make a full contribution to your business.
 Maintaining employees focus and motivation is essential if they are to make a full contribution to your business. appraisals actively involve employees in understanding what is expected of them. By setting
ICT Project Management. Software Project Planning By J. Ogutu
 ICT Project Management Software Project Planning By J. Ogutu Overview Step Wise project planning framework Preparation of a software project plan Planning and scheduling the activities in software project
Consulting projects: What really matters
 Consulting projects: What really matters The factors that influence the success of management consulting projects Case 138: het 'Zwijsen future proof' project met de inzet van GEA Results PhD 2014, Bart